
Stability Analysis of Paste Filling Roof by Cut and Fill Mining


Abstract
:1. Introduction
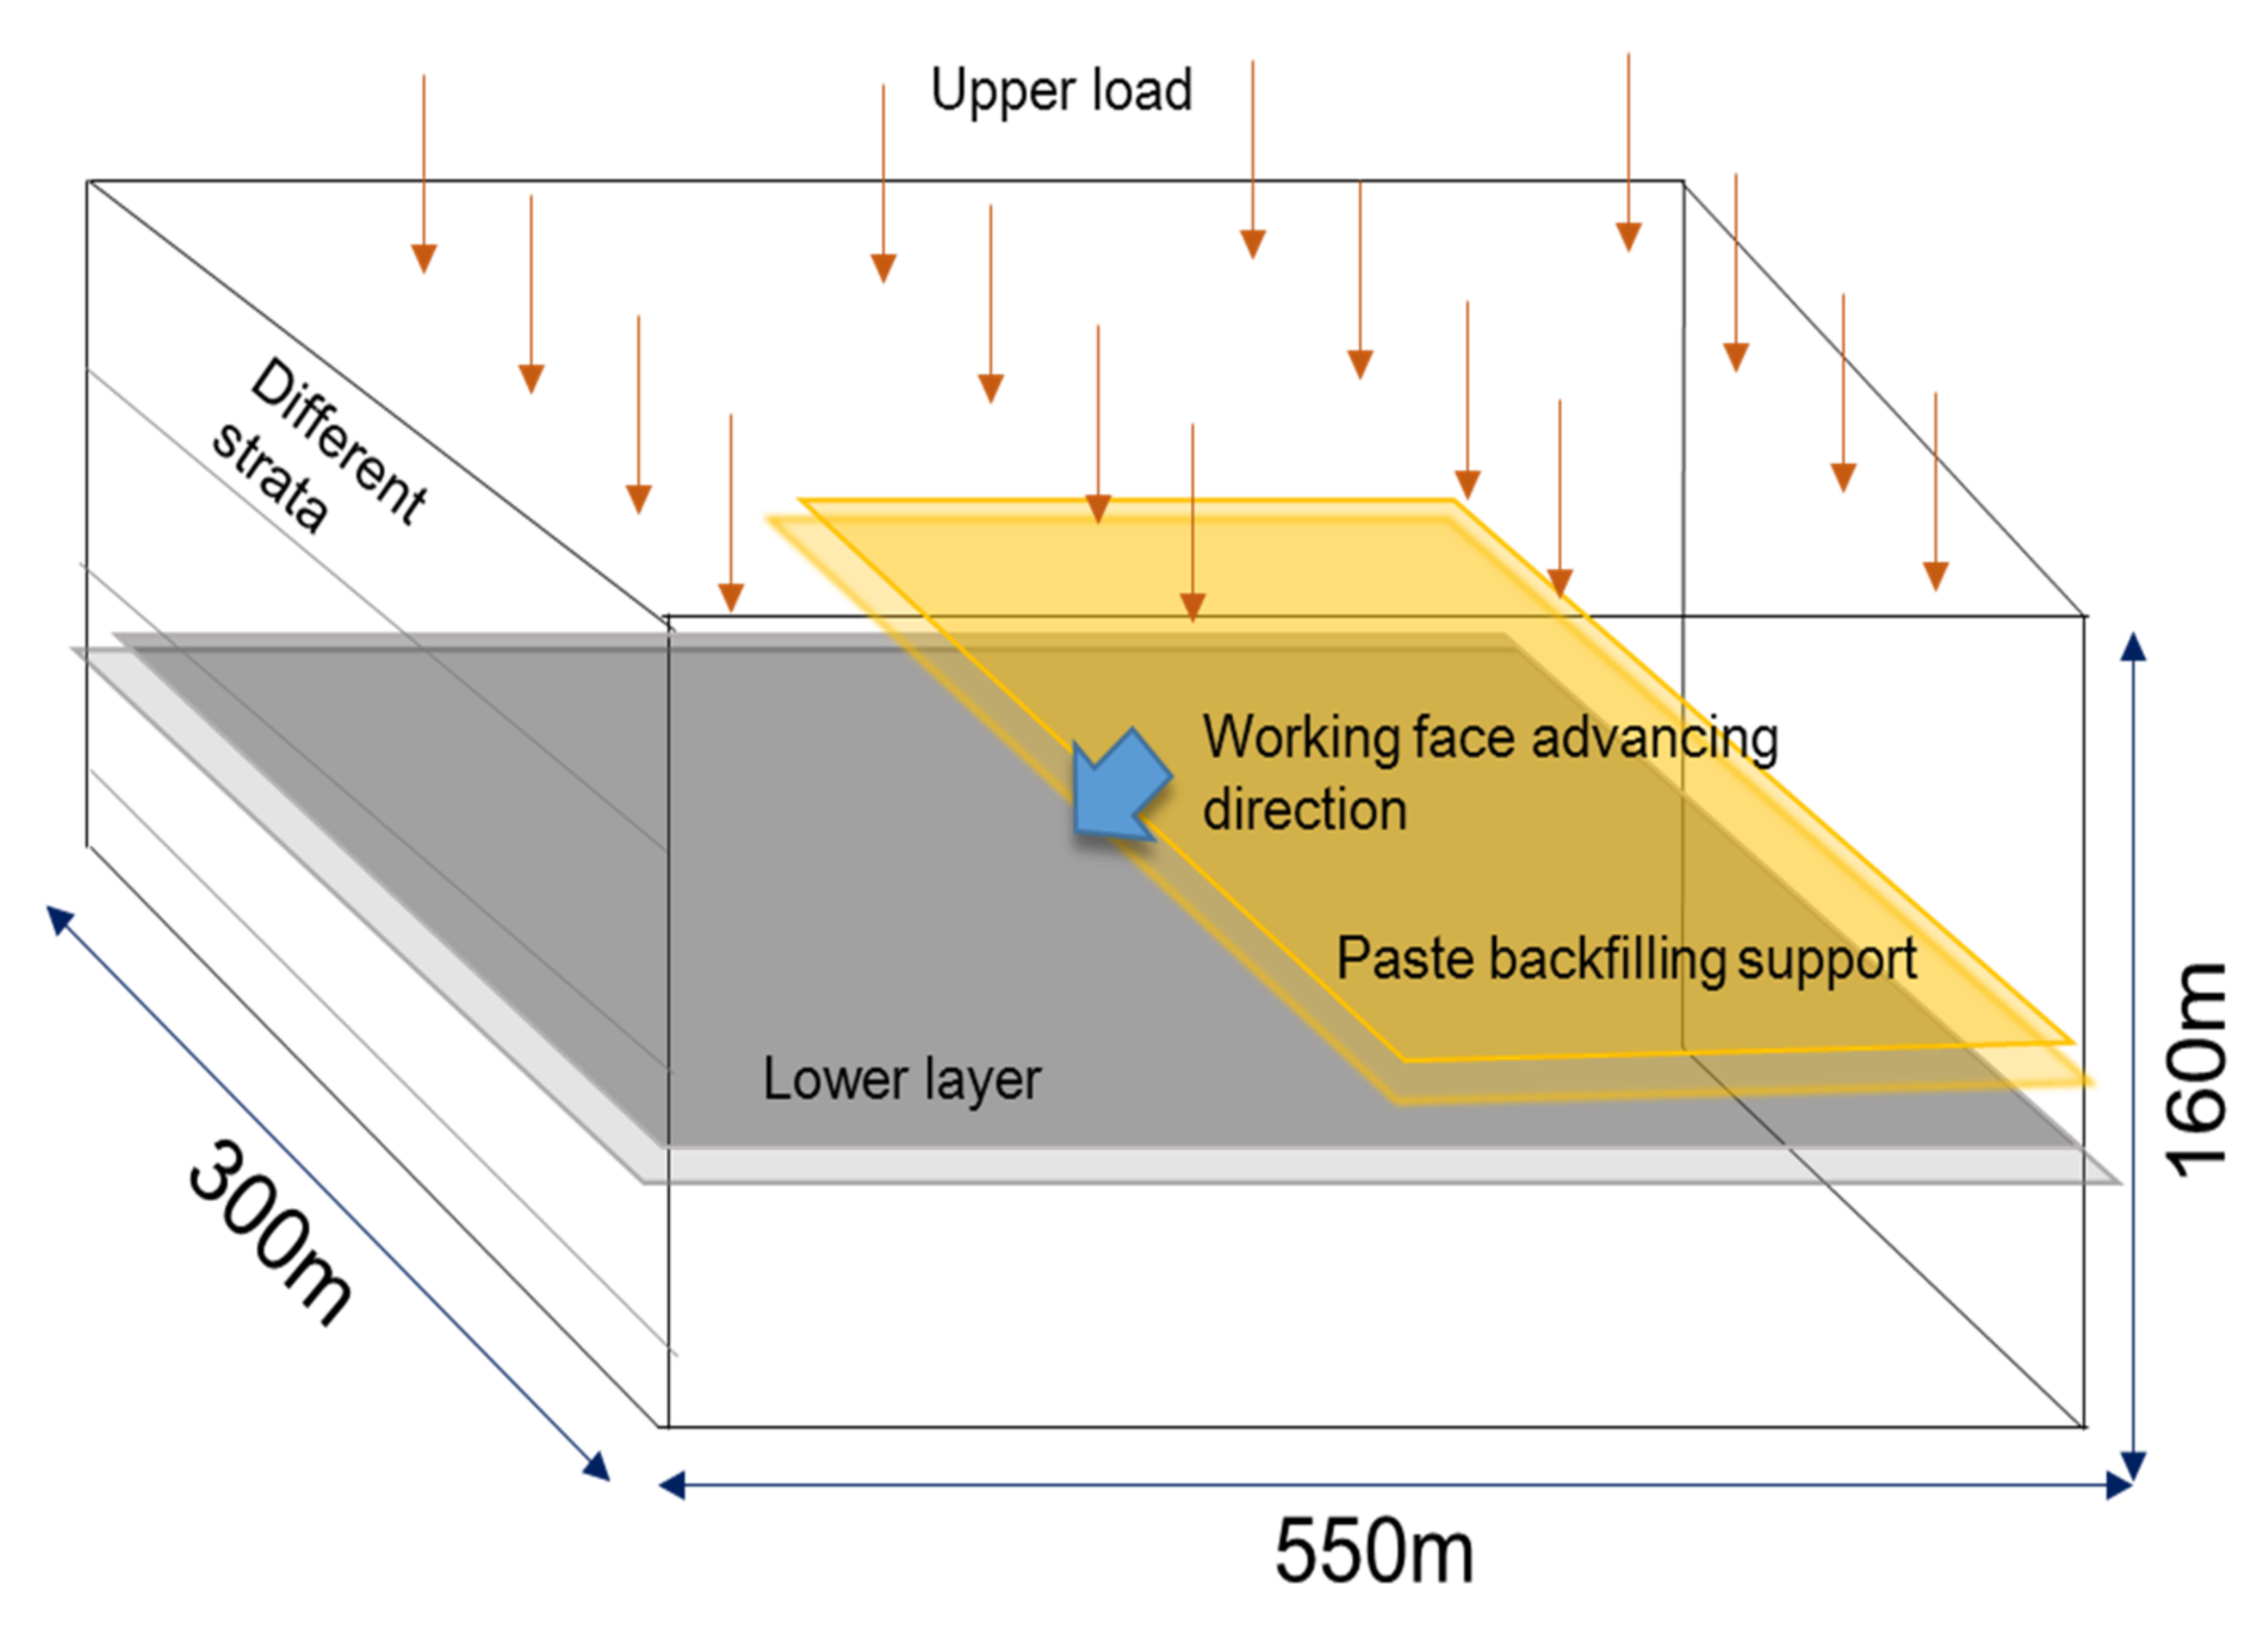
2. Project Overview
3. Analysis of the Mechanism of the Instability Thickness of the Paste False Roof
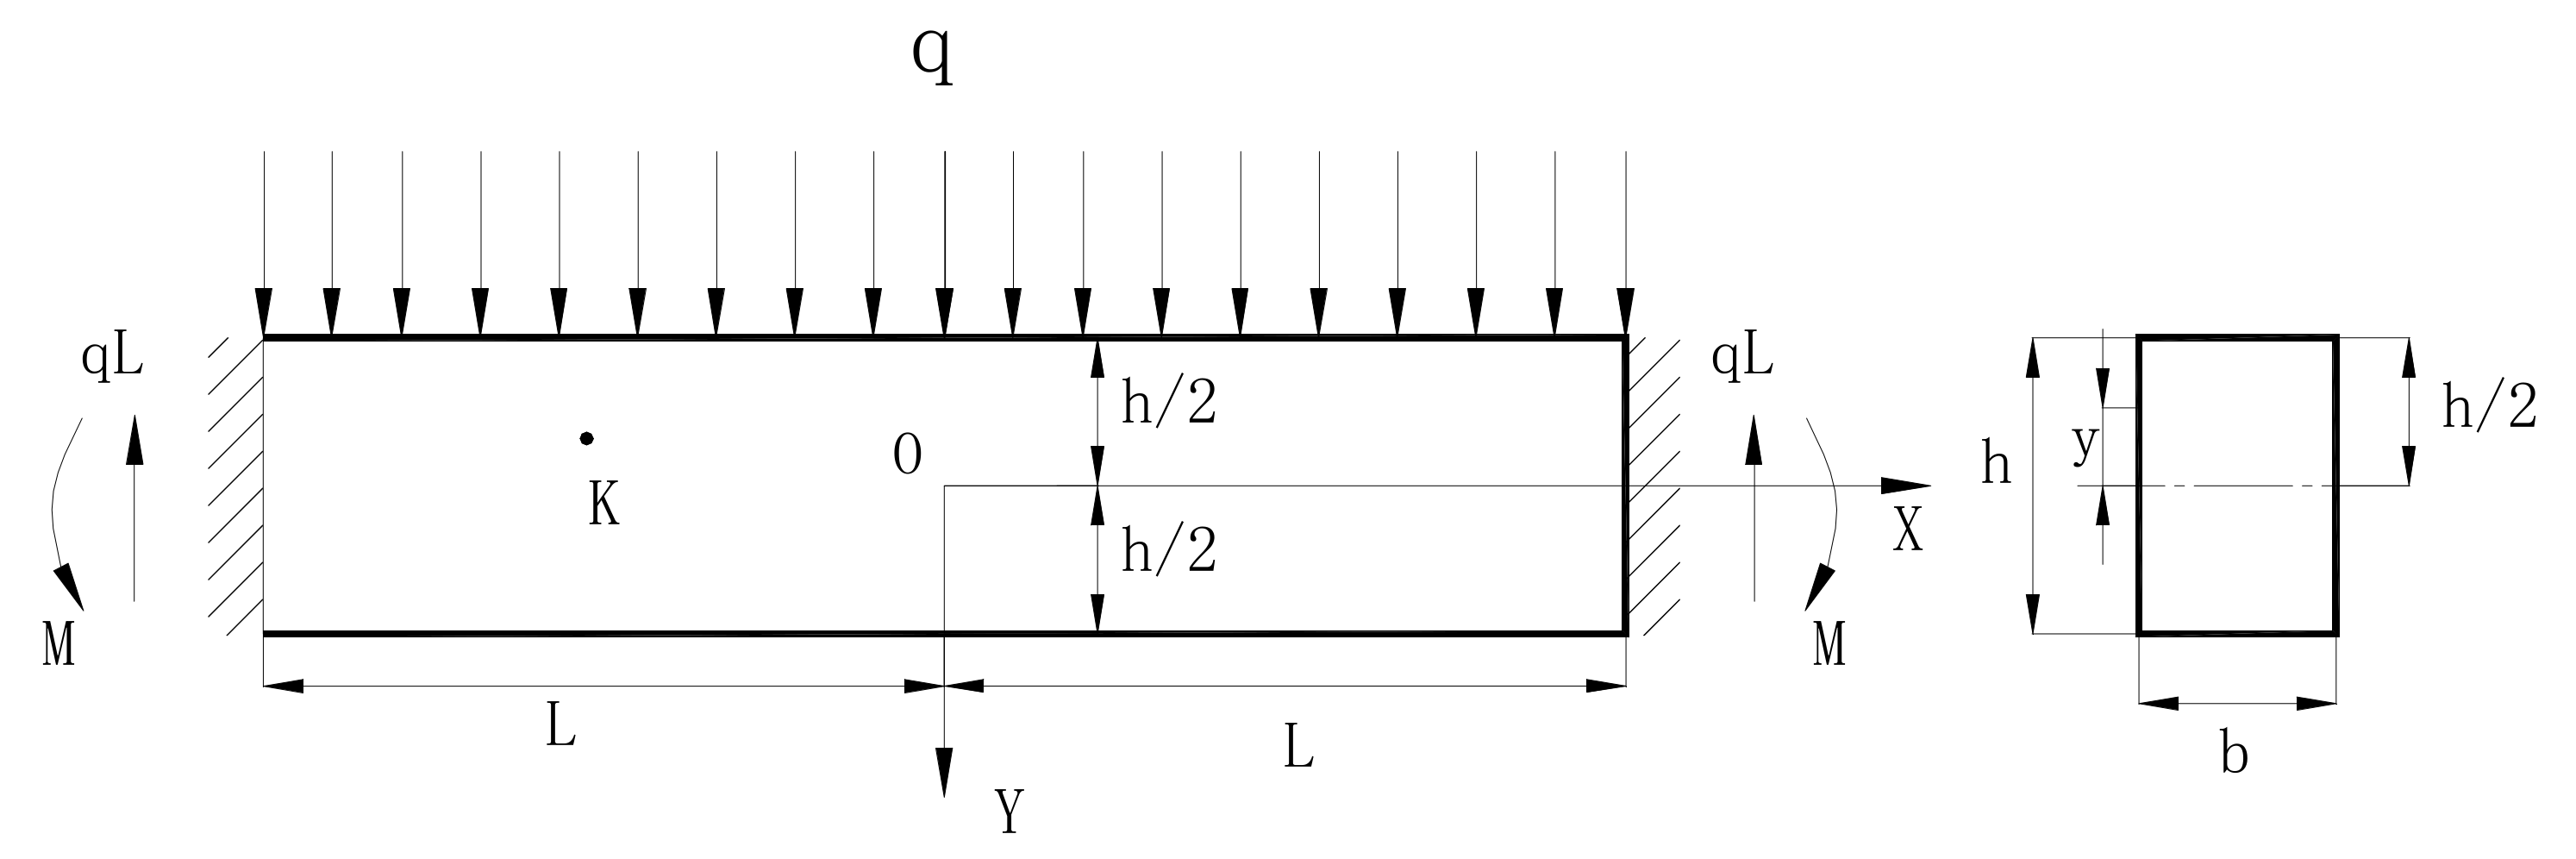
3.1. Calculation of False Roof Load
3.2. Theoretical Analysis of False Roof Instability Thickness
4. Numerical Simulation Analysis of the Instability Thickness of the Paste False Roof
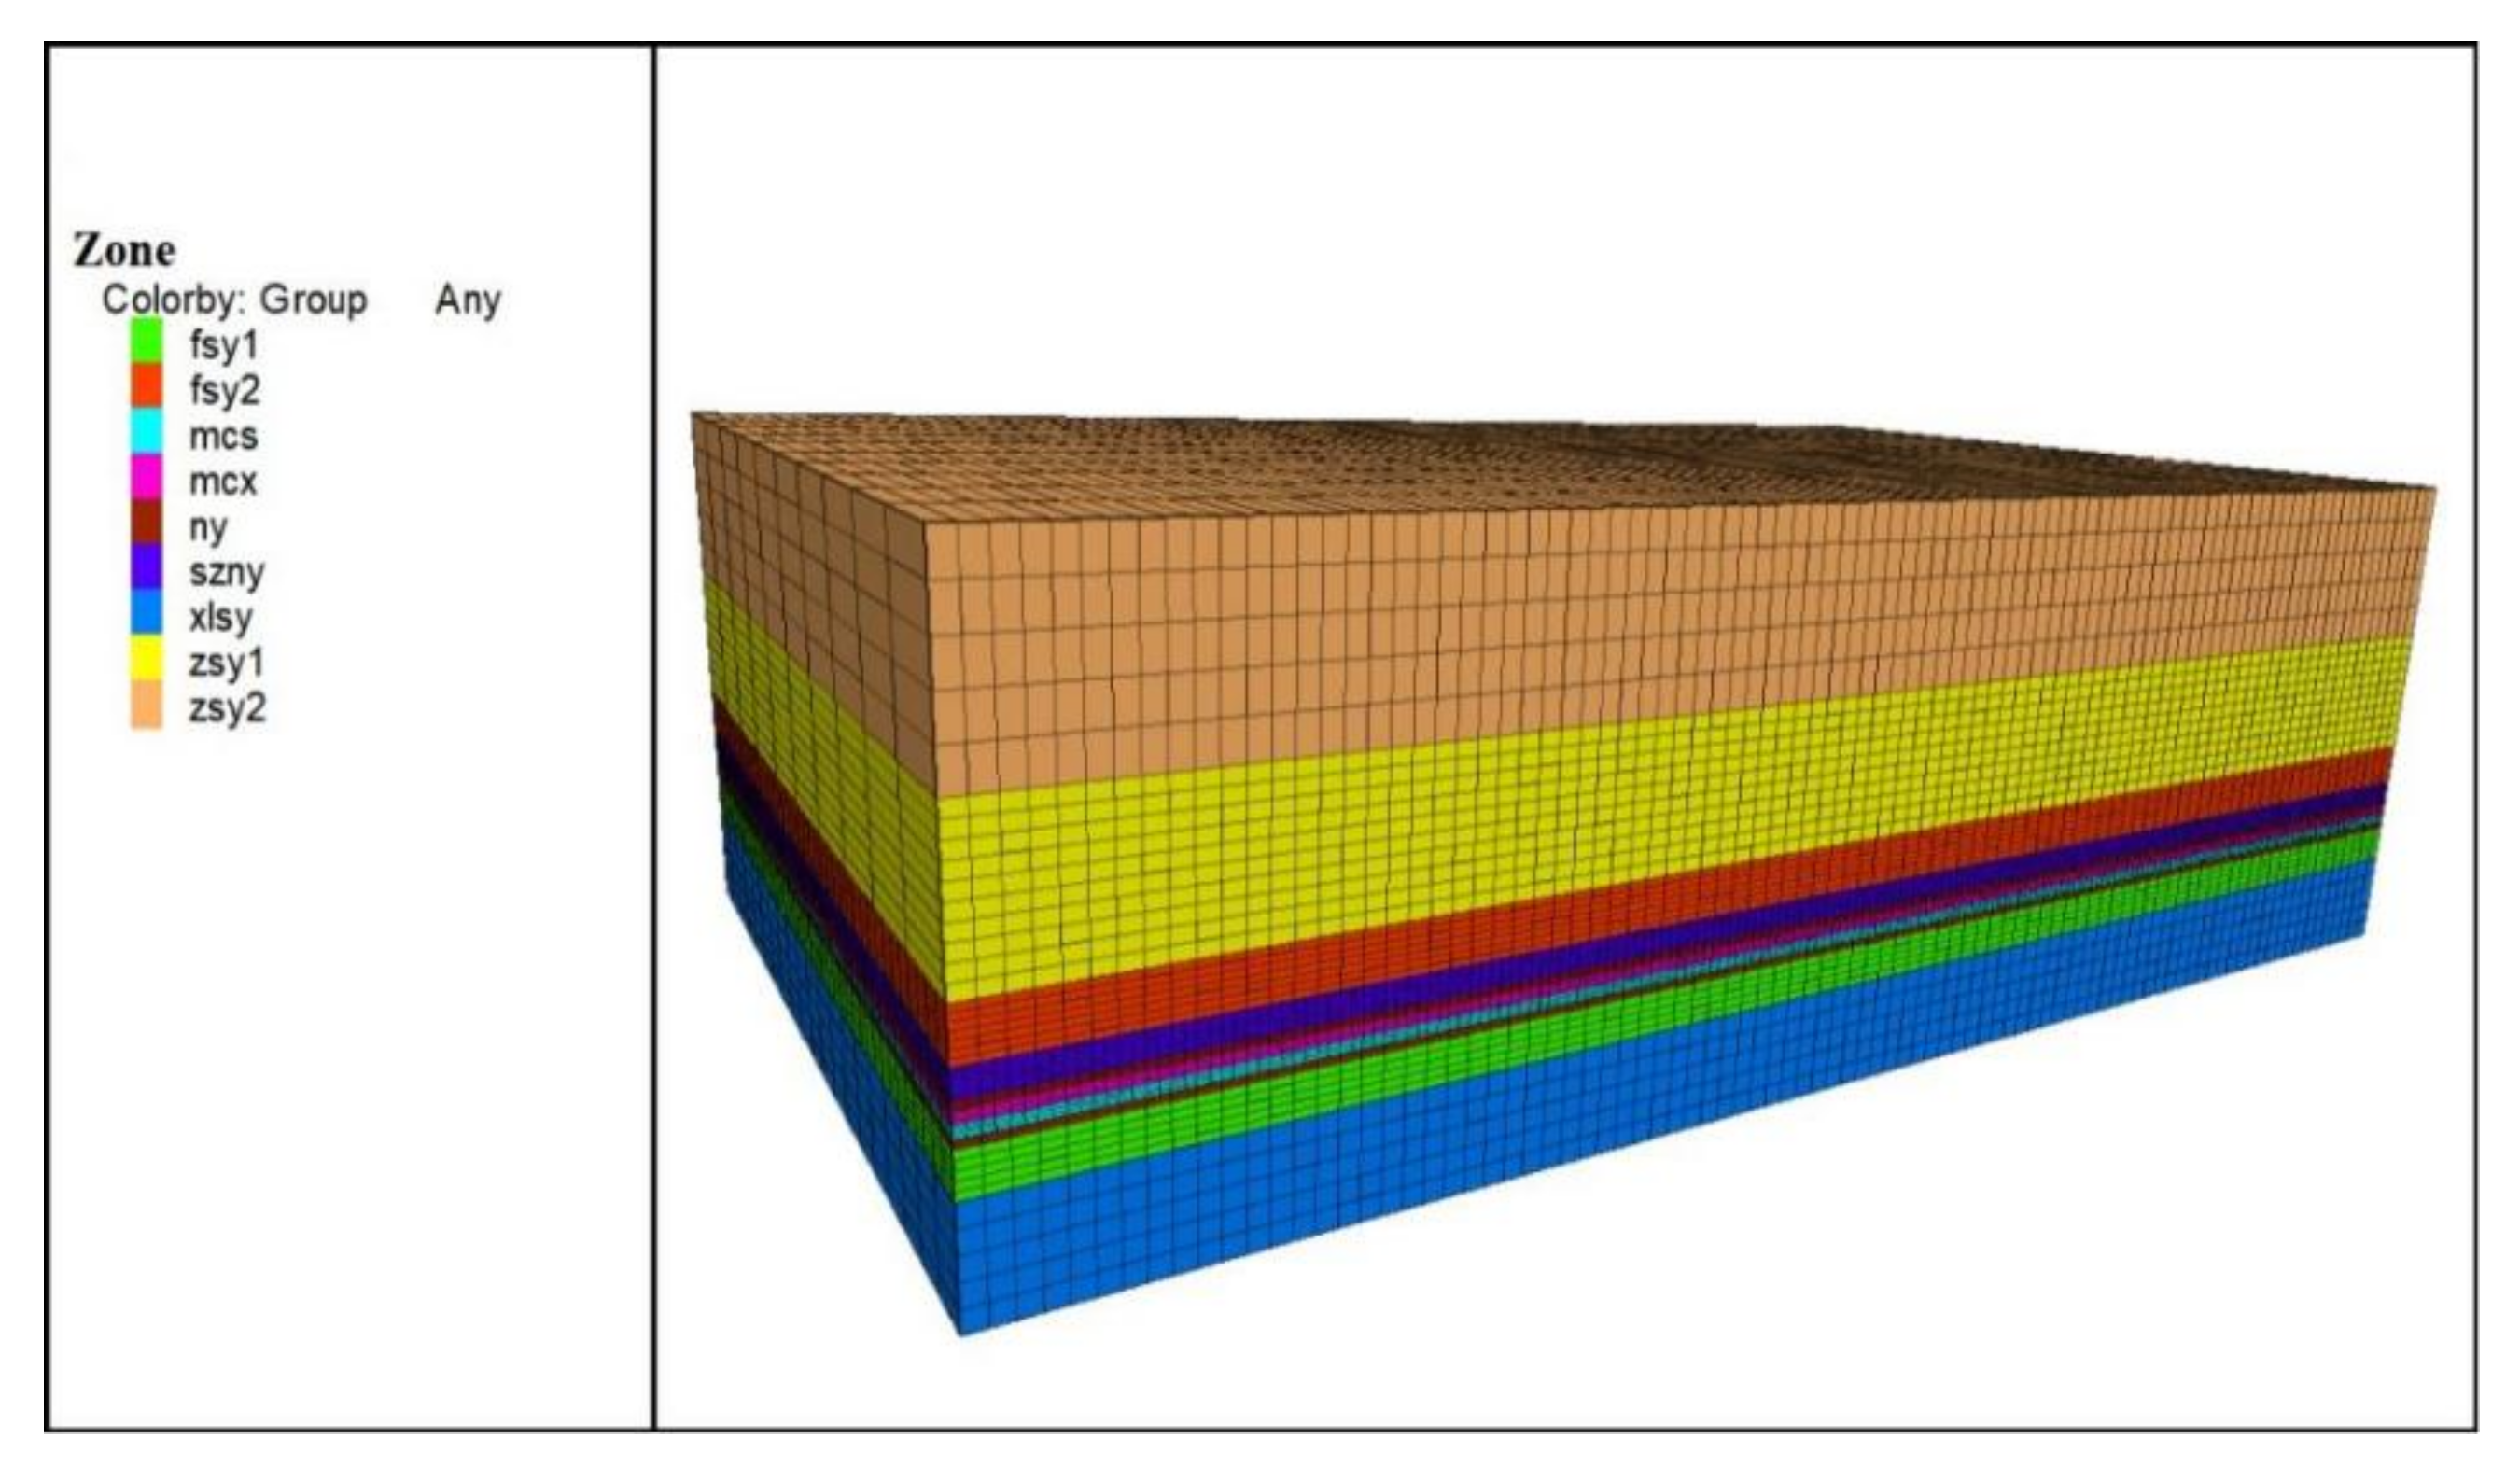
4.1. Numerical Simulation Modeling of Layered Mining
4.2. Numerical Simulation Schemes of Different False Roof Thicknesses
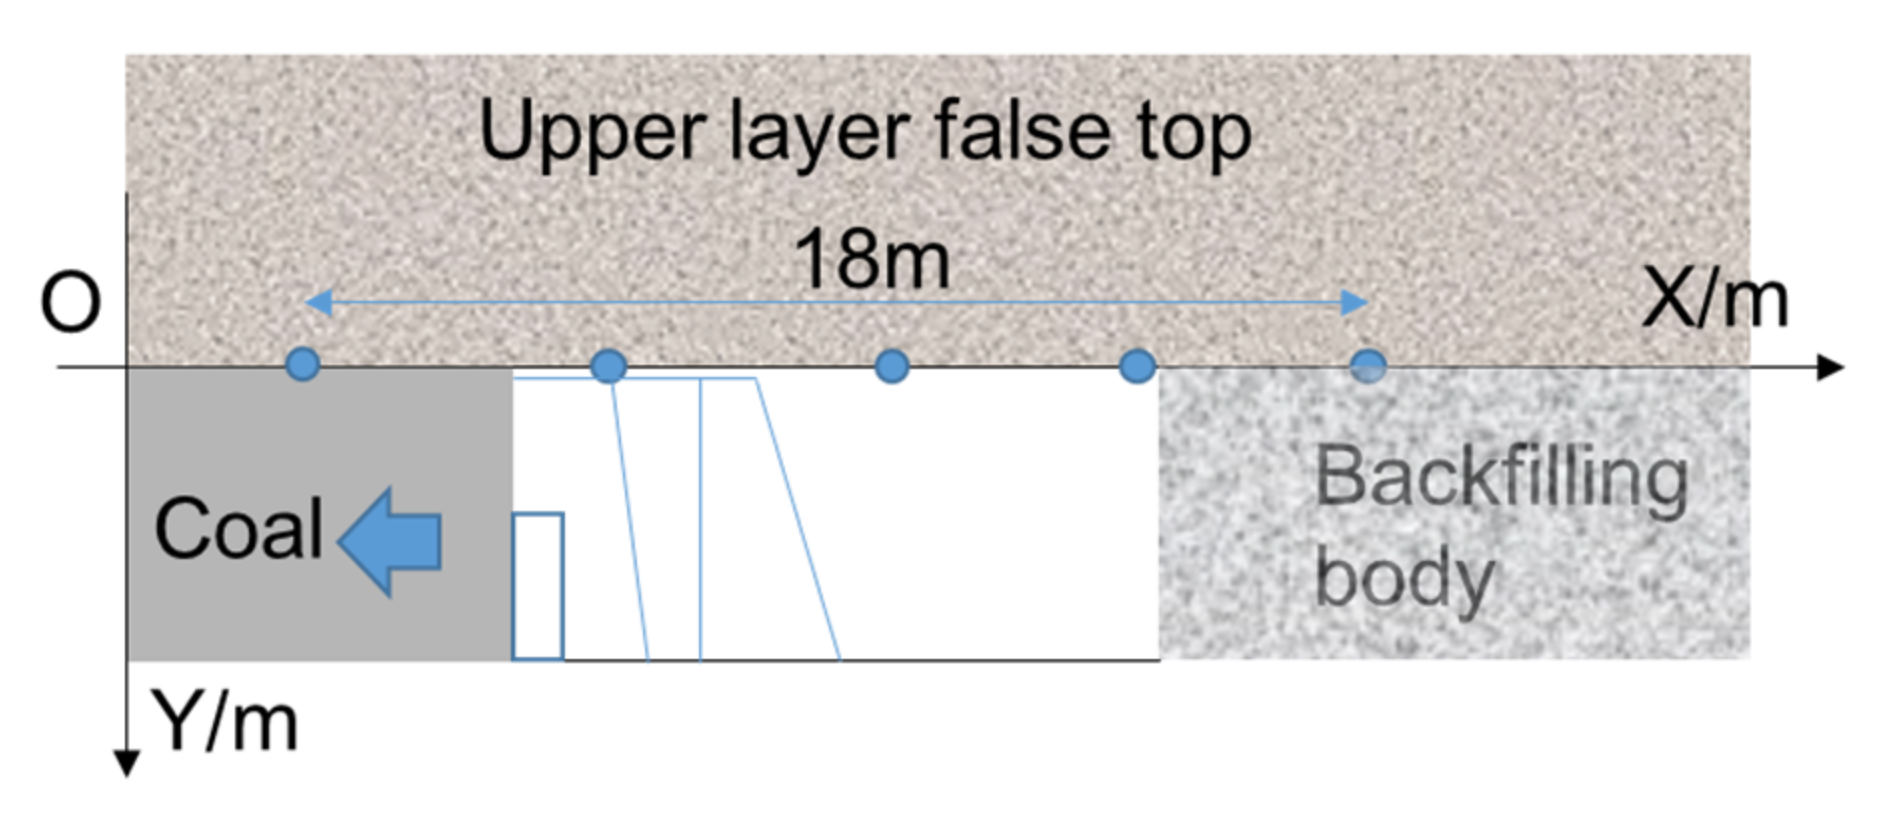
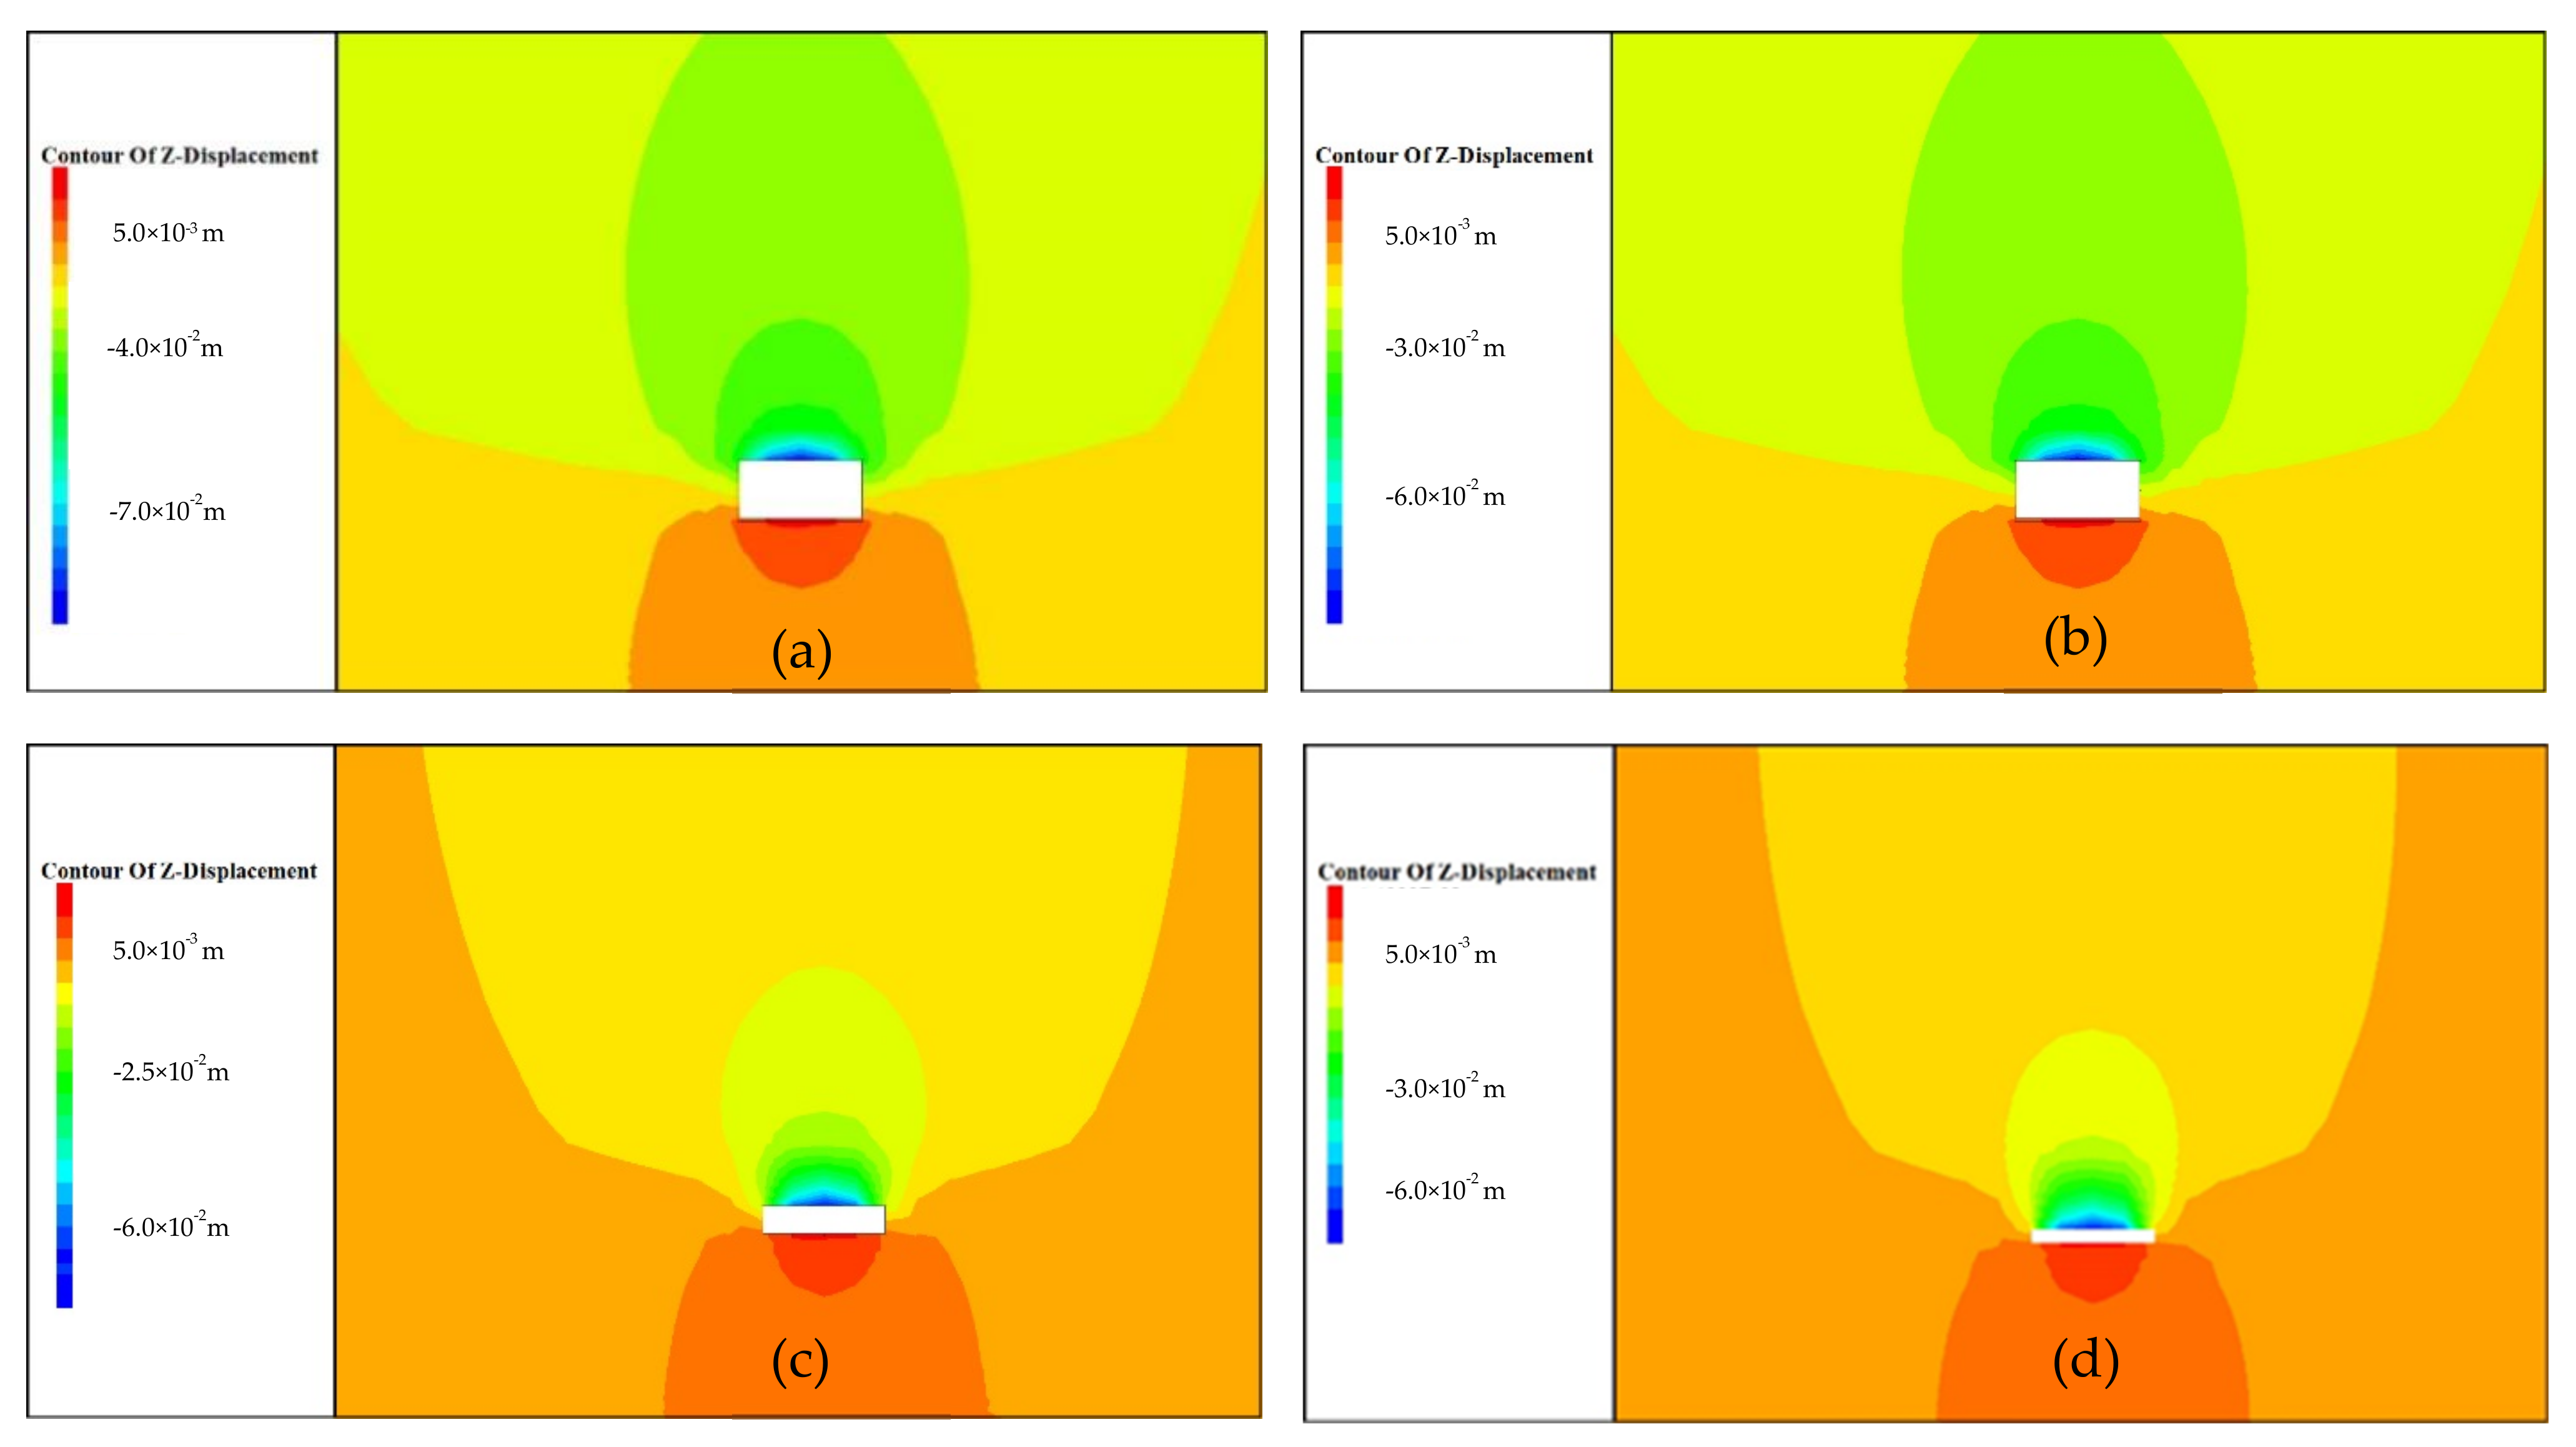
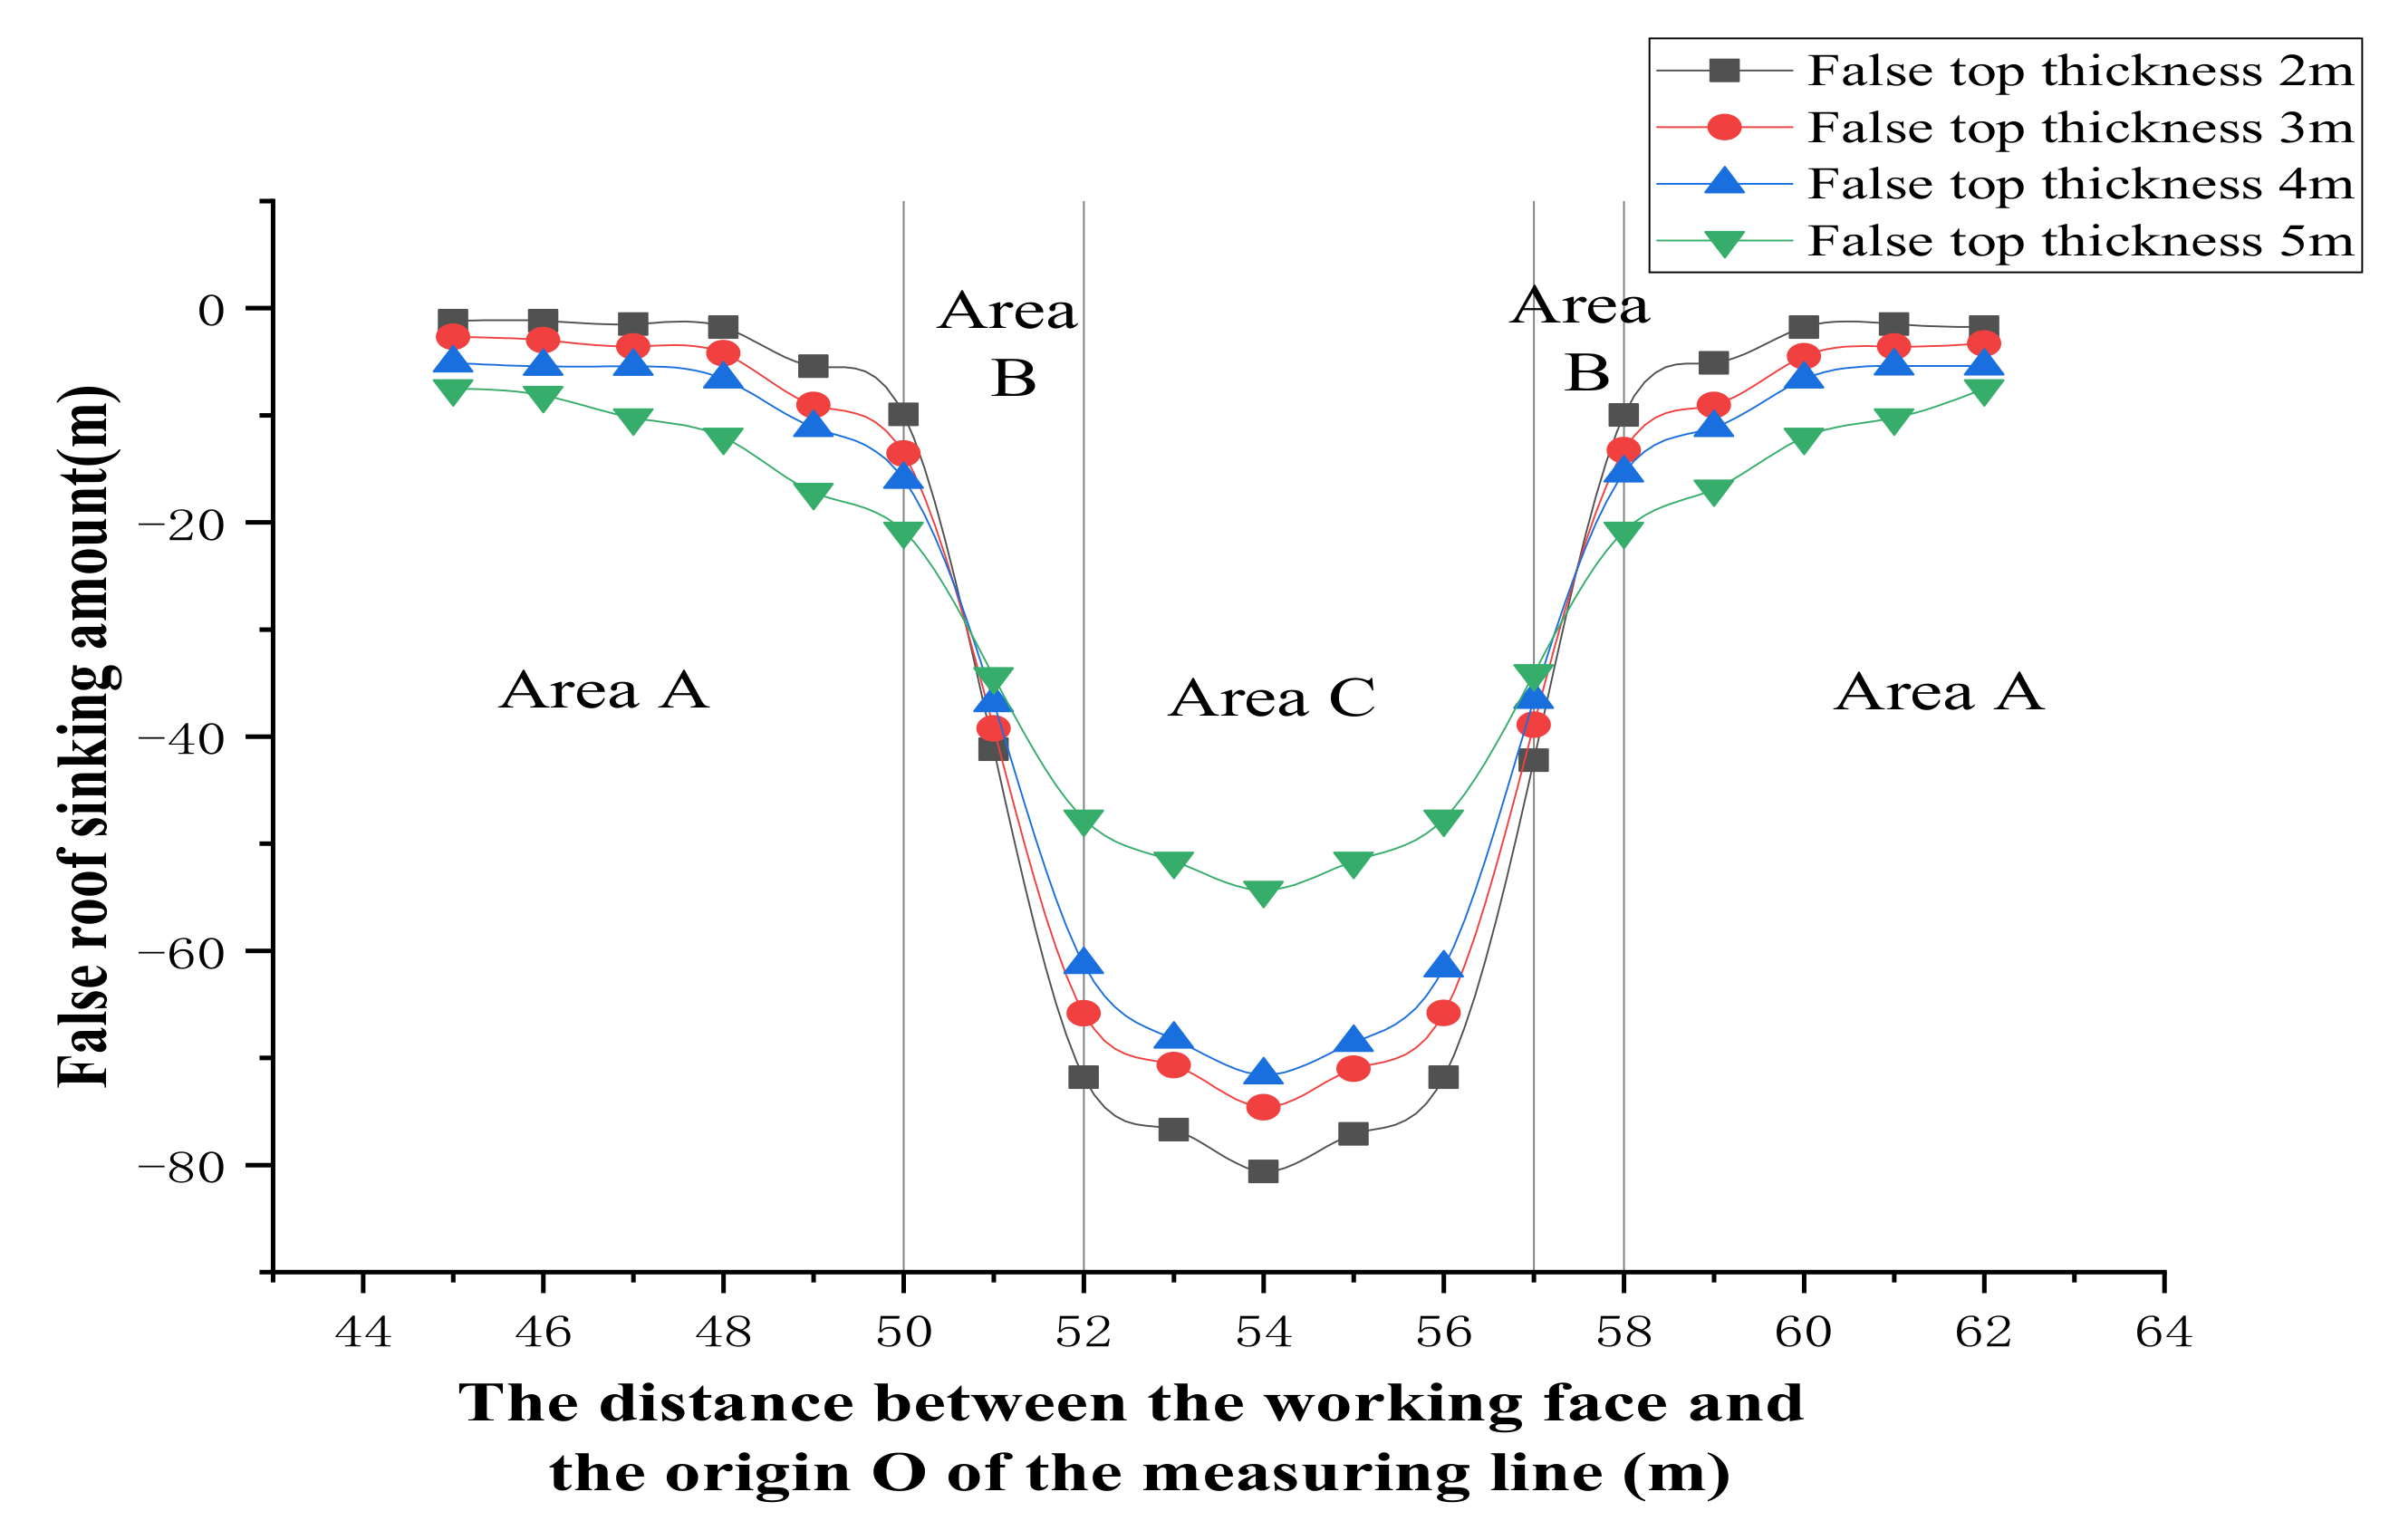
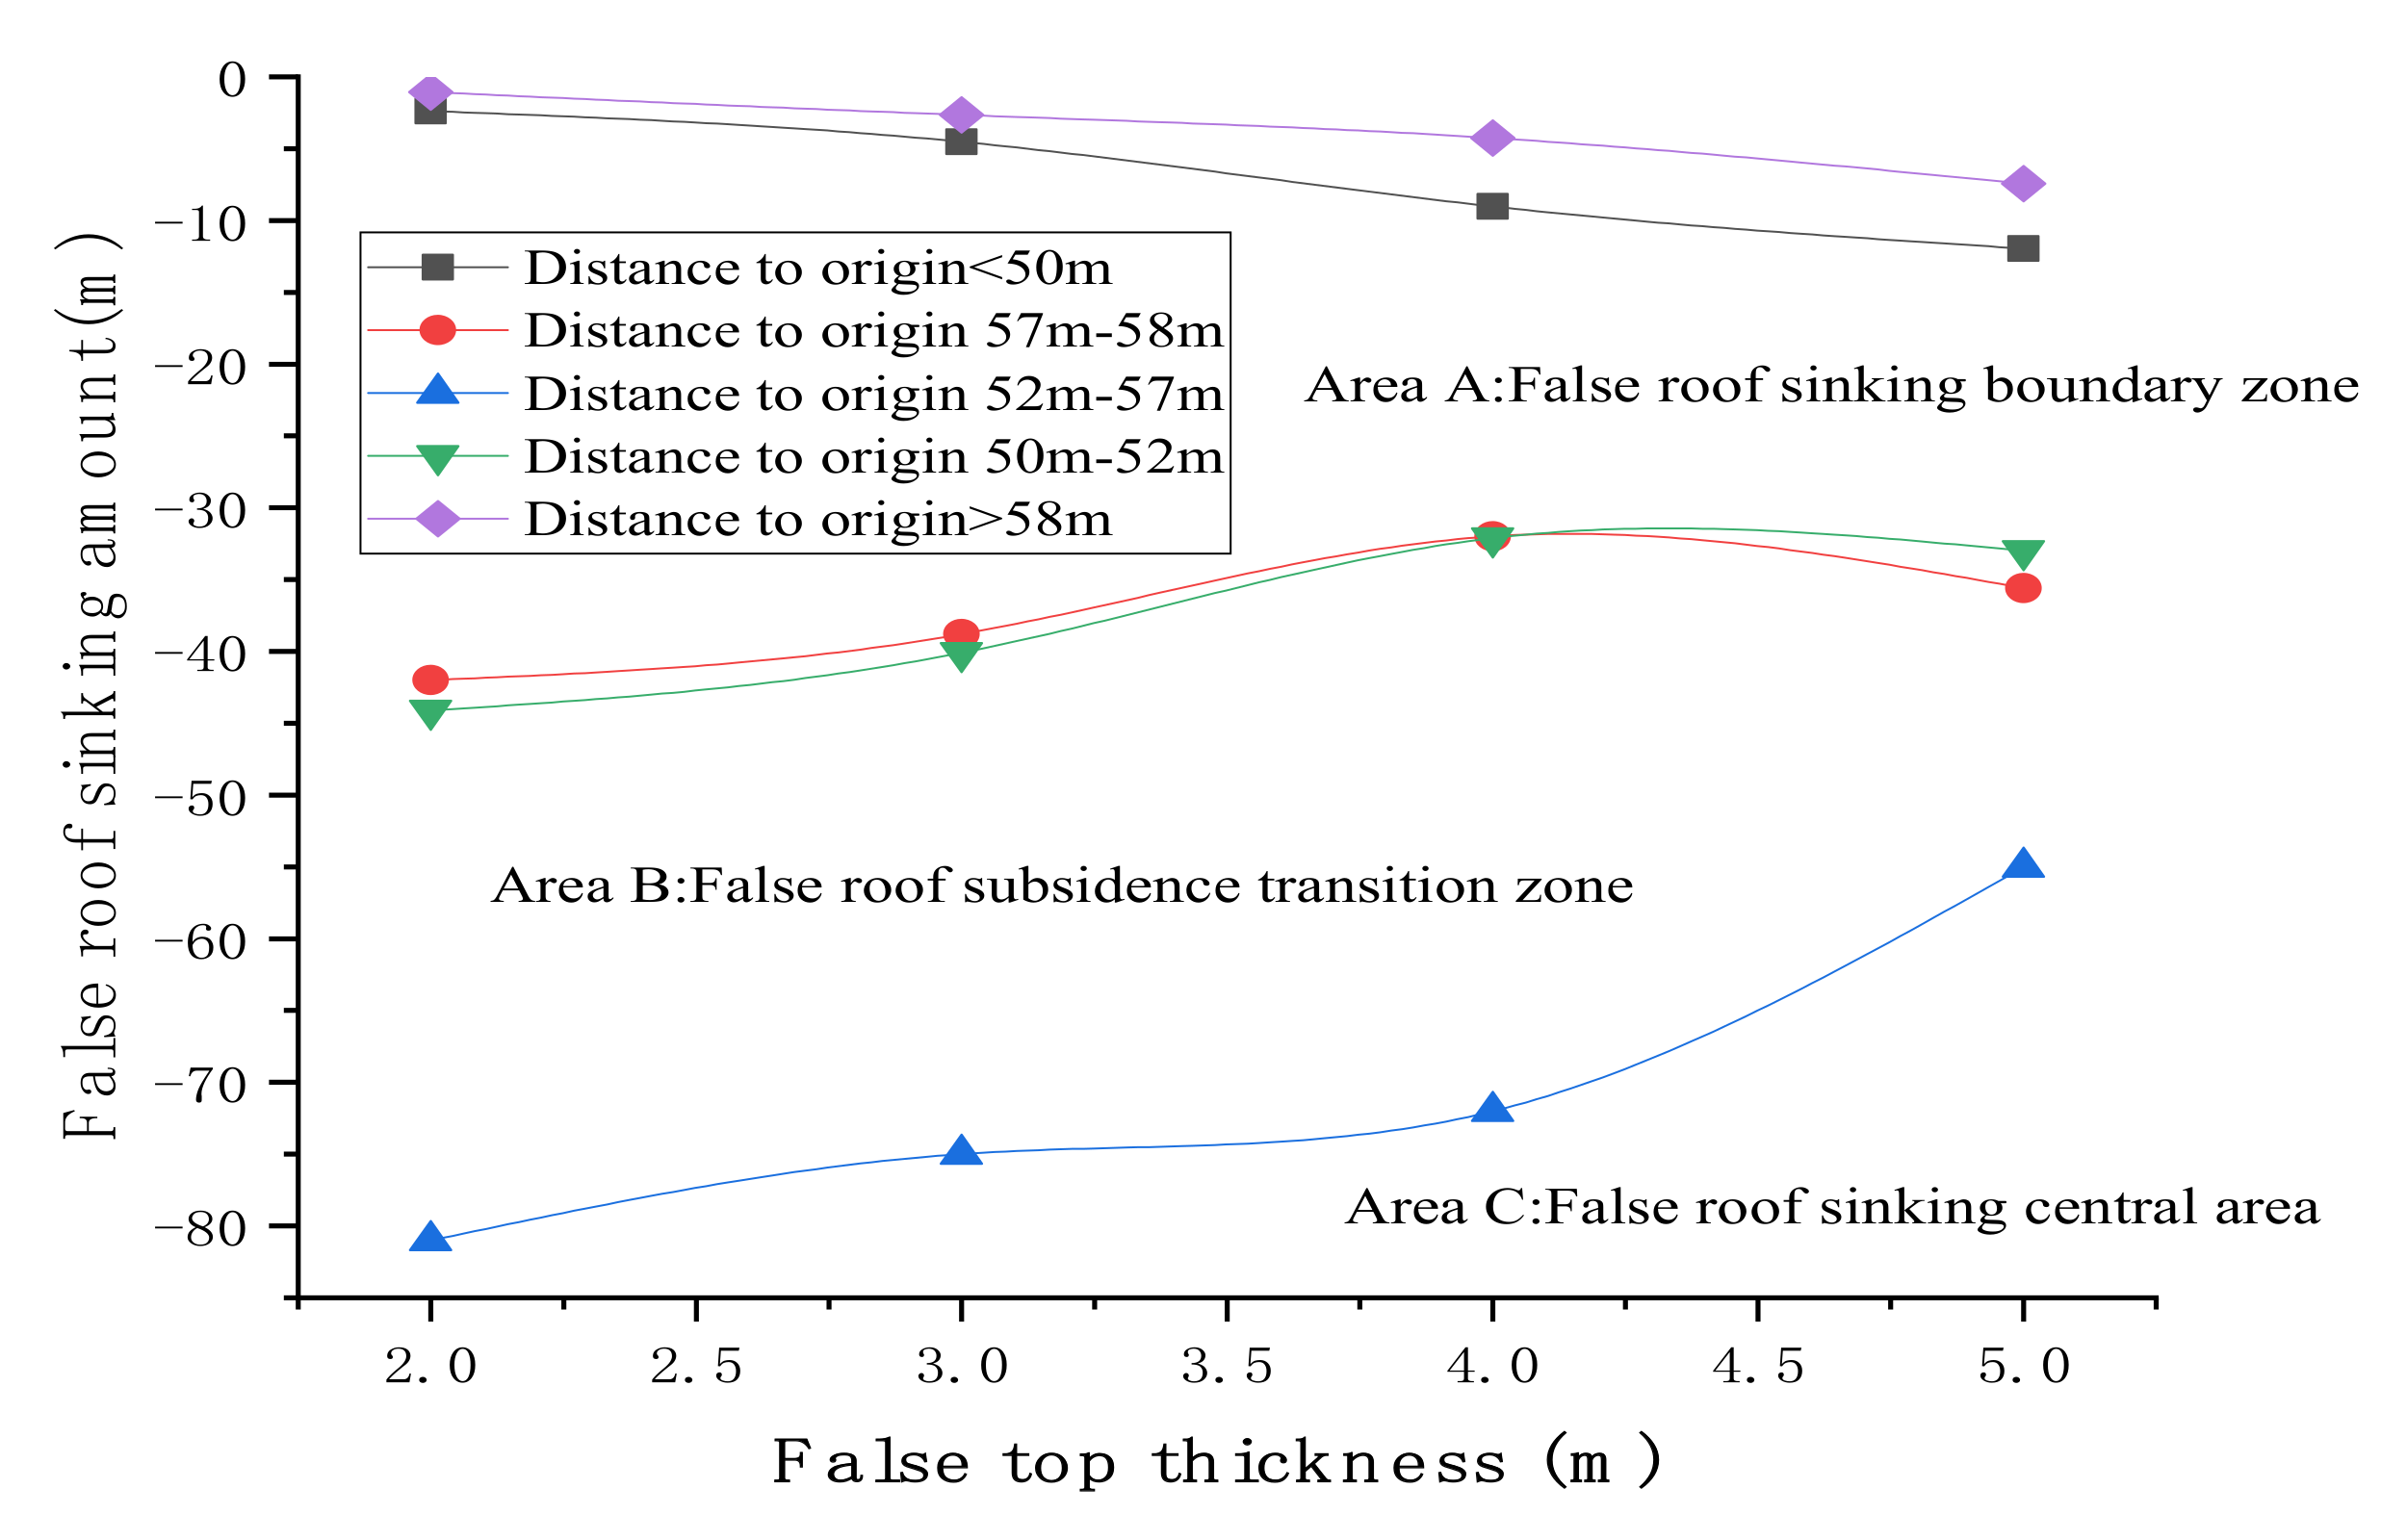
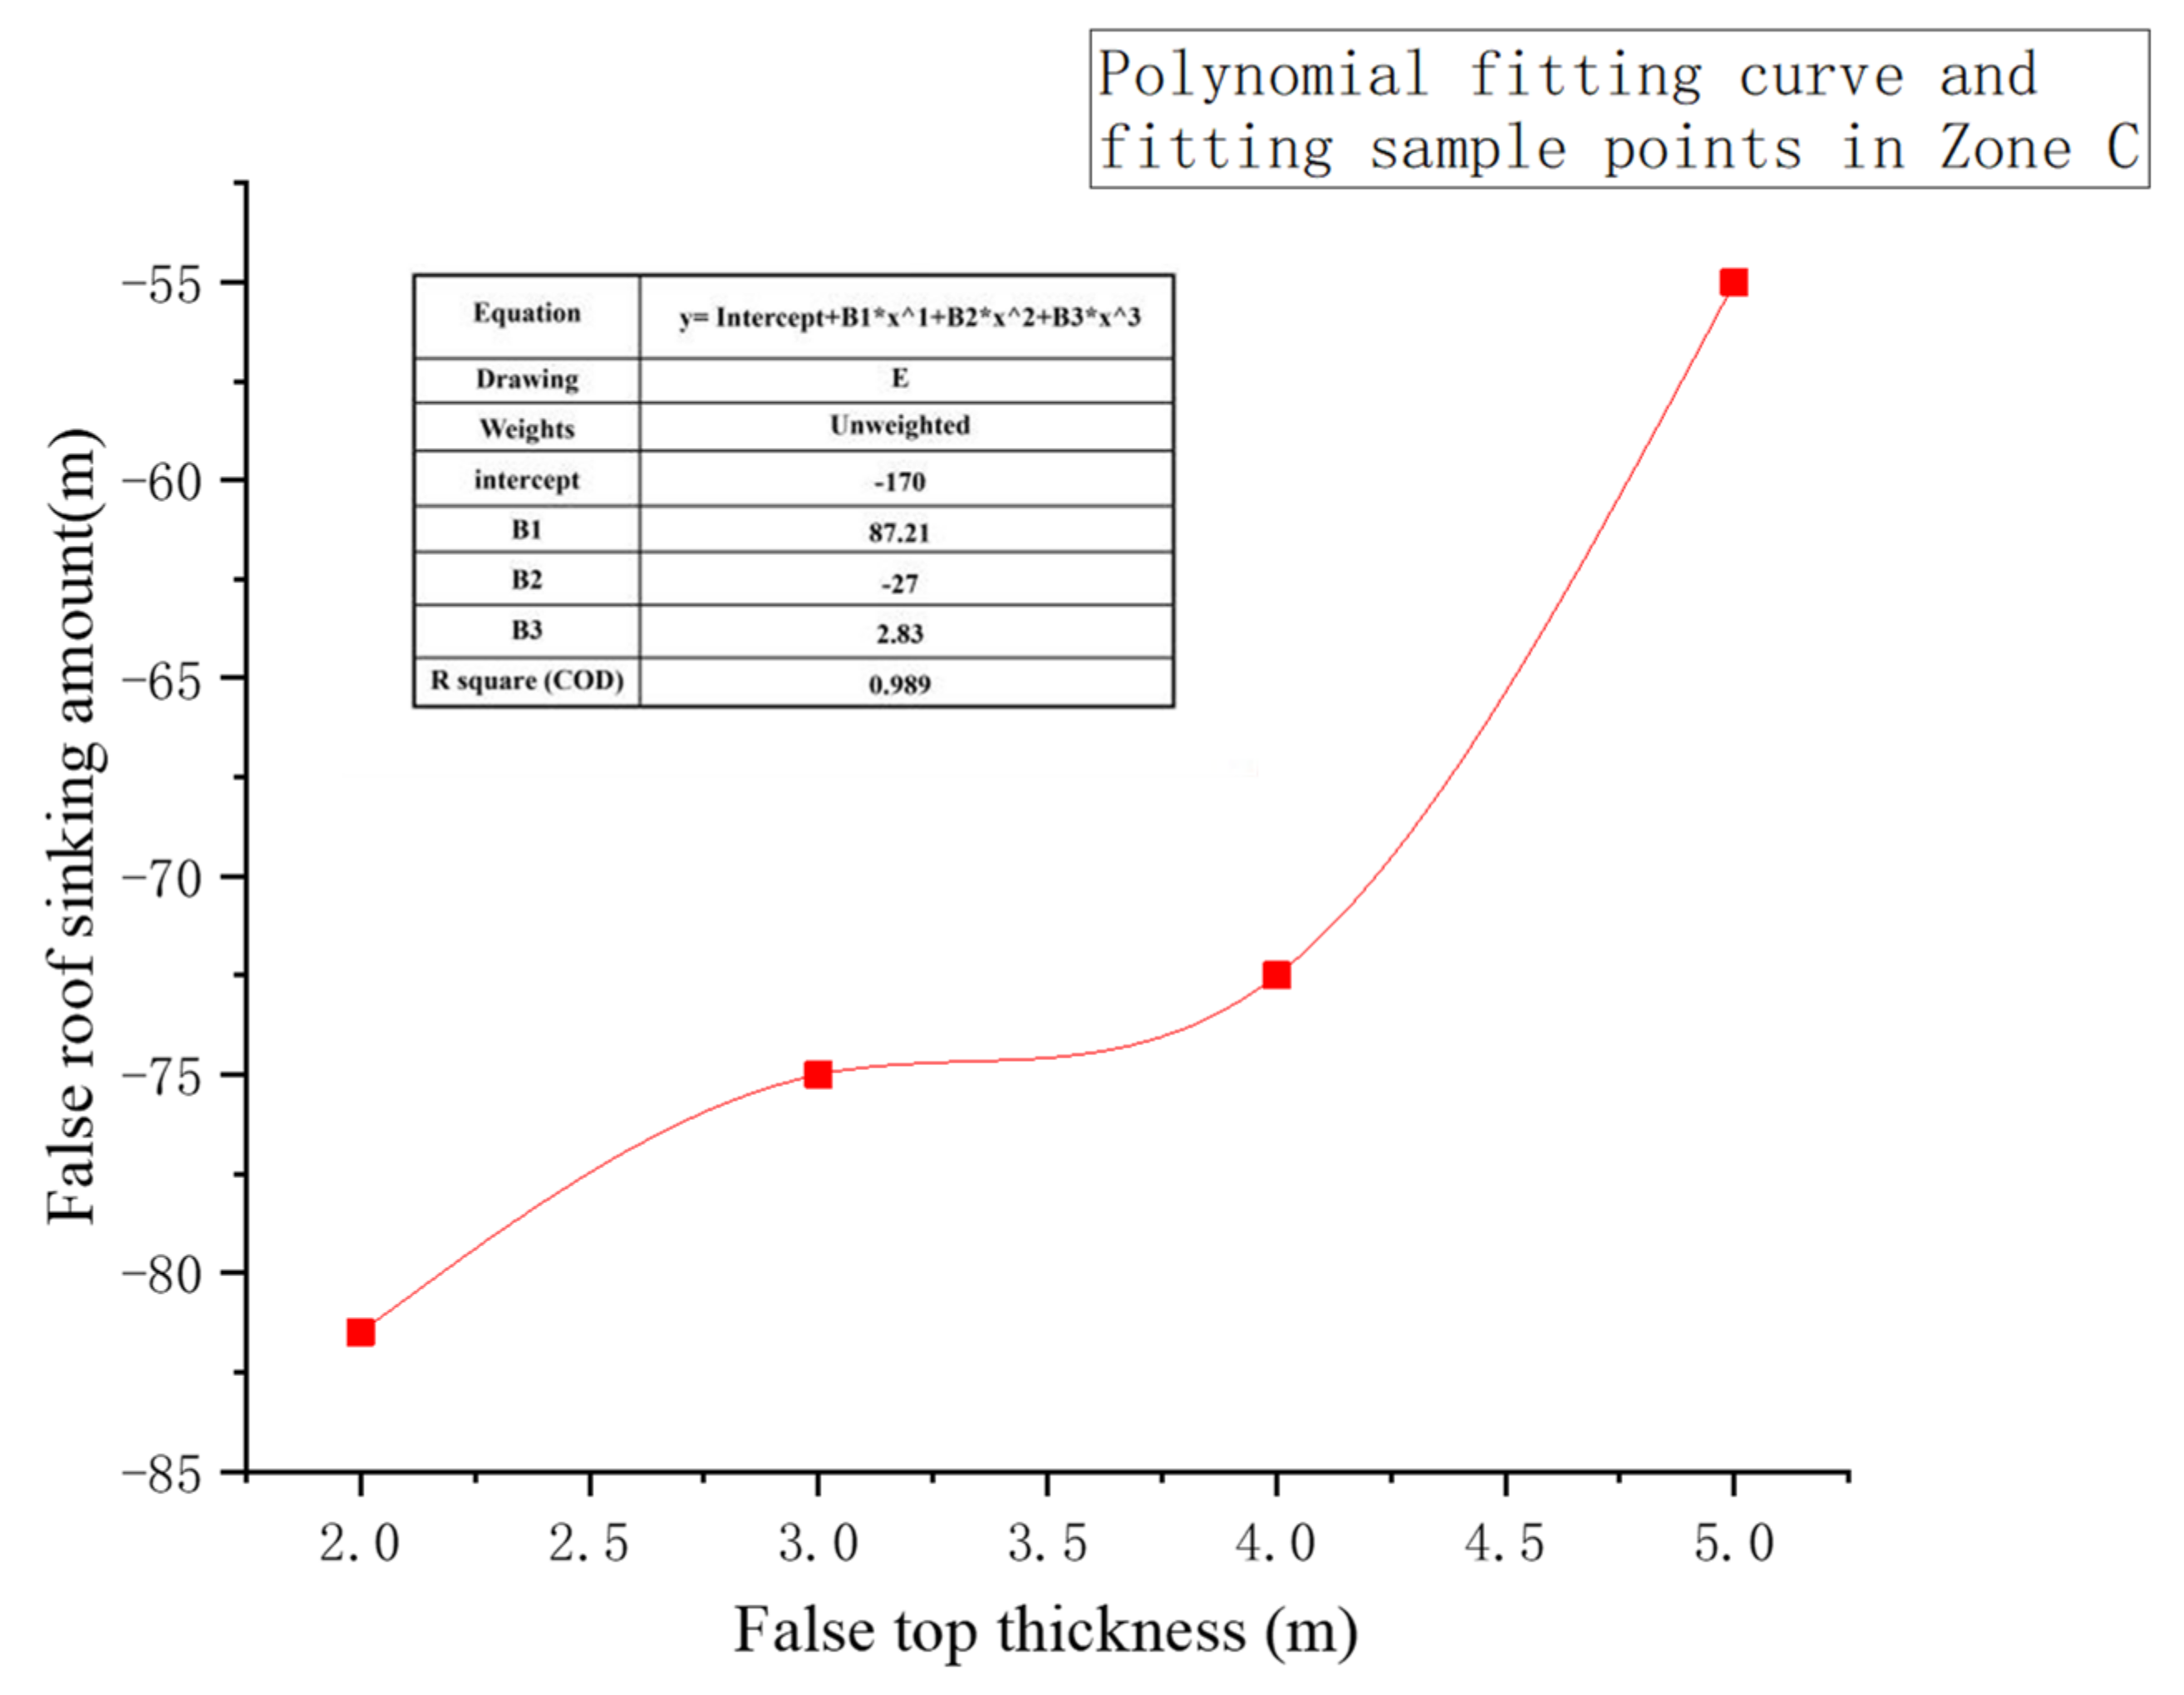
4.3. Simulation Results and Analysis of the Displacement of the Paste False Top
4.3.1. Correlation Analysis of False Roof Thickness and False Roof Subsidence
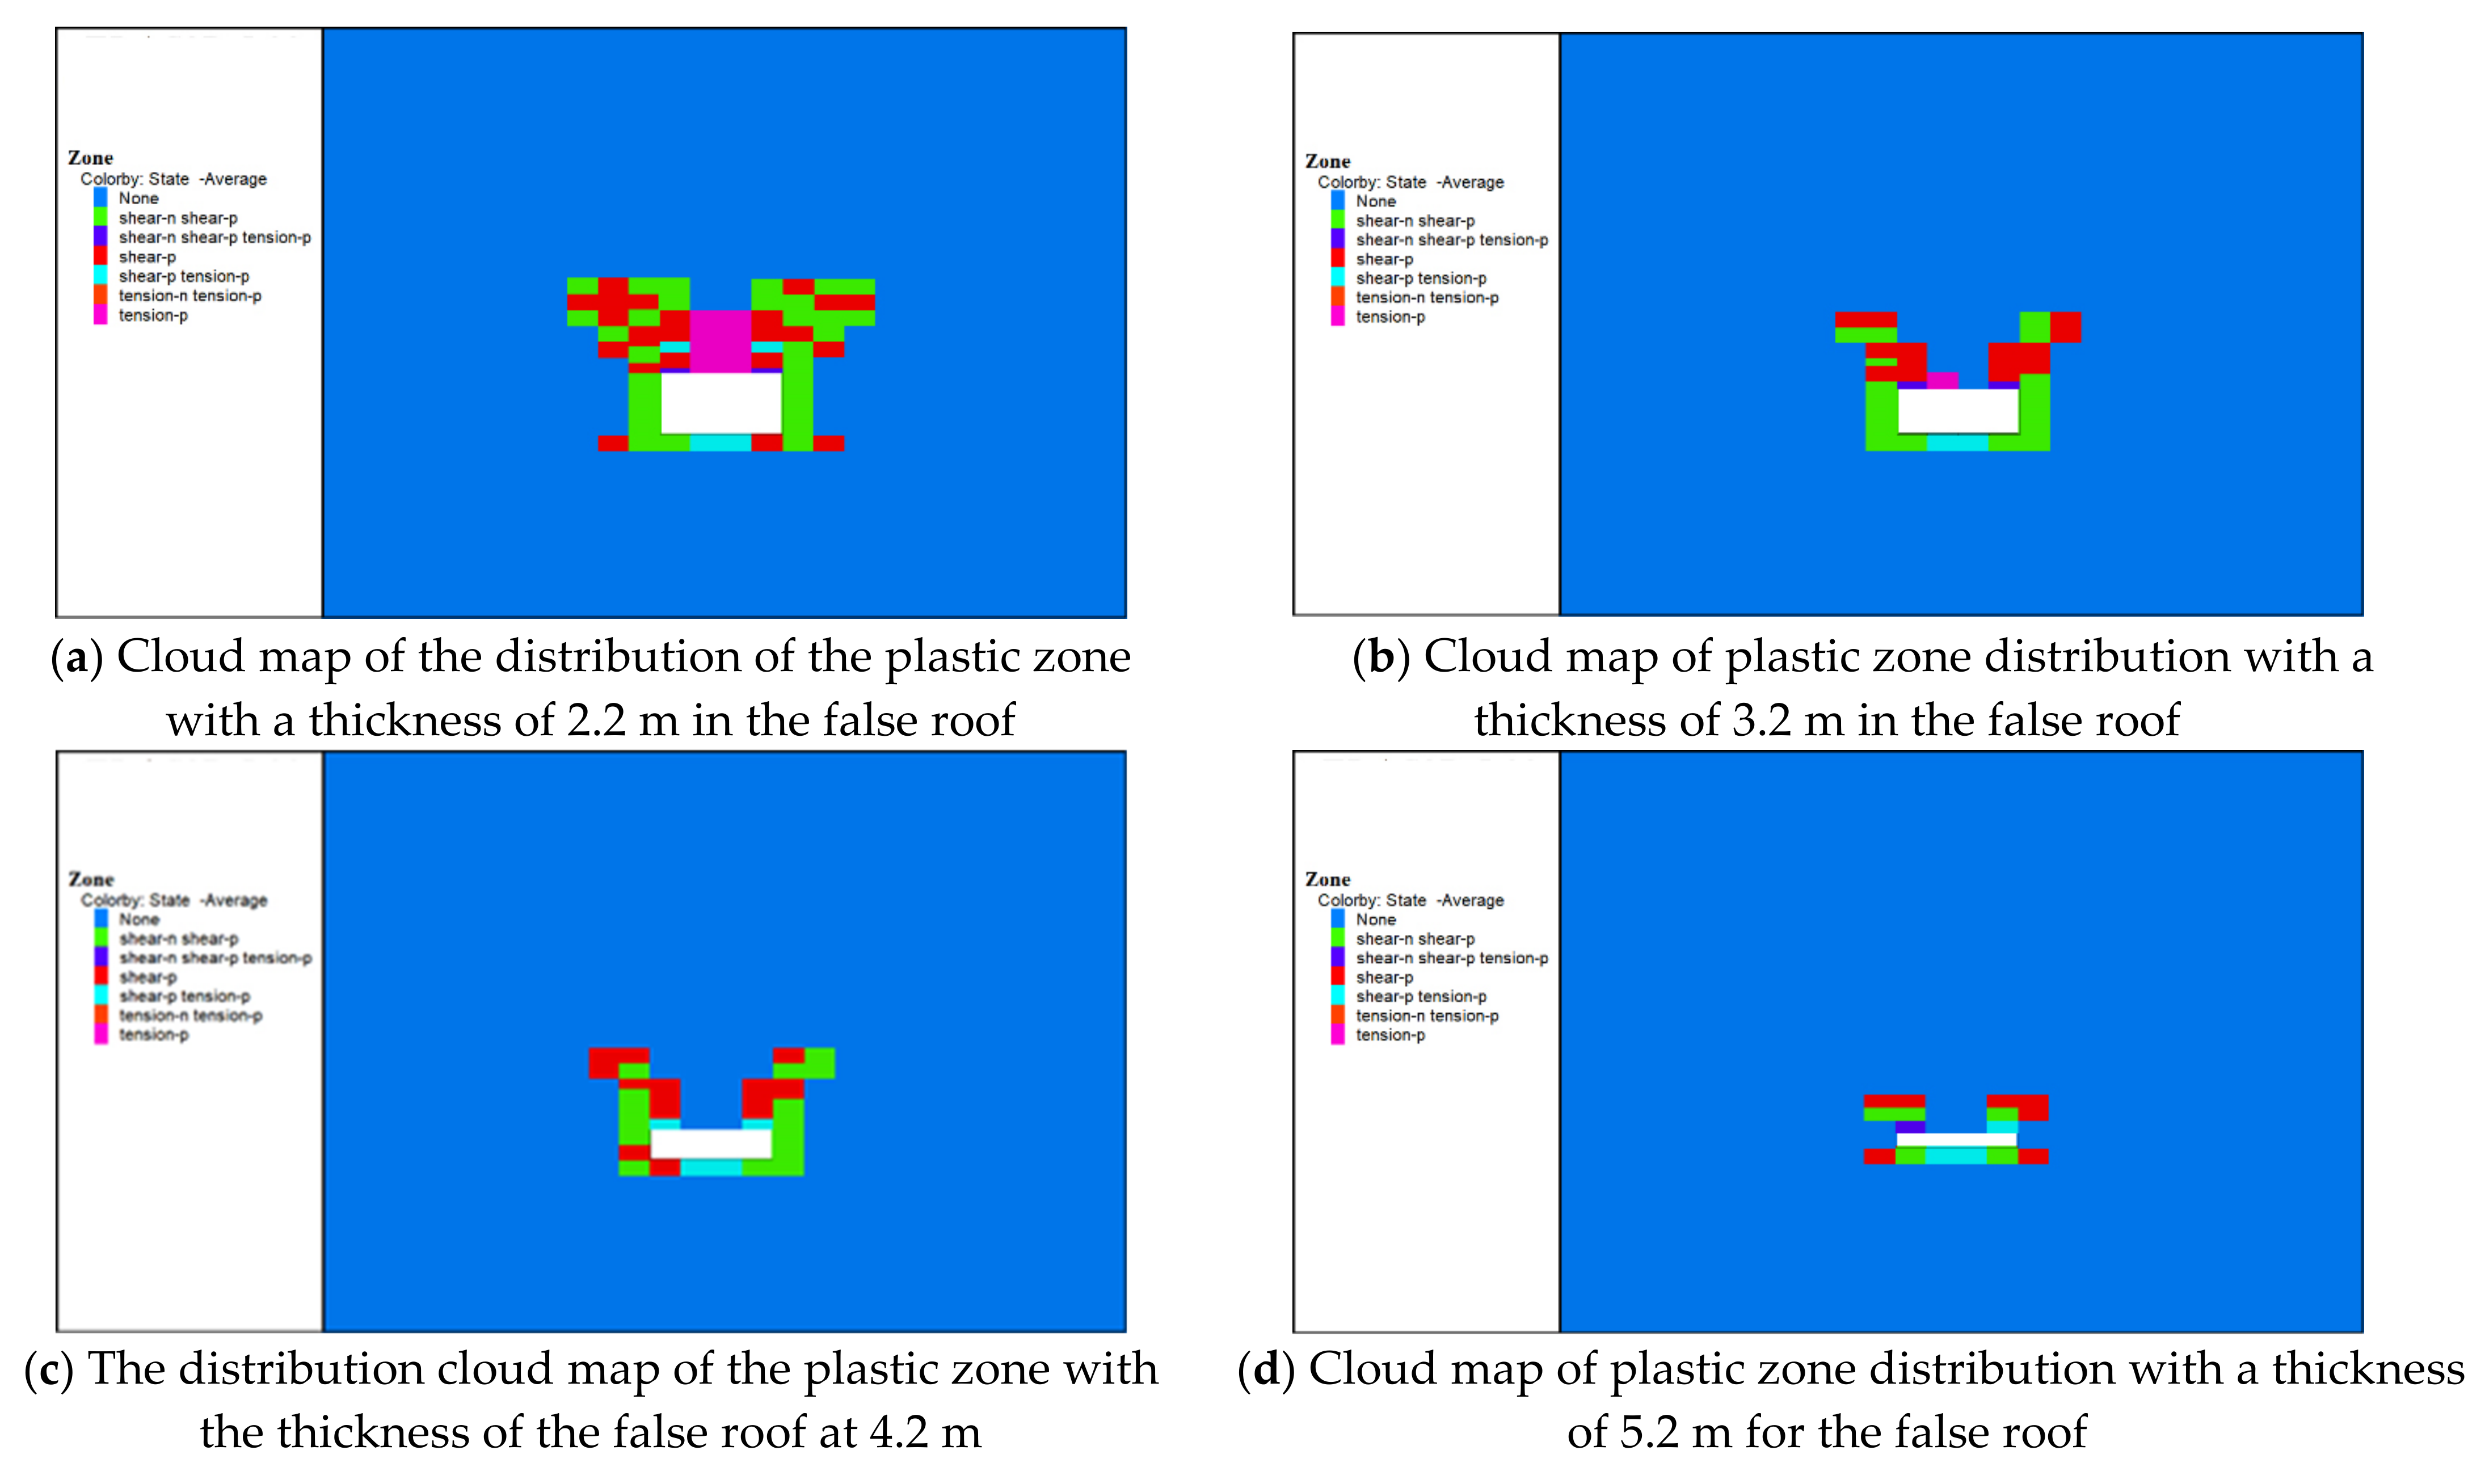
4.3.2. Analysis of the Development Law of Plastic Zone under Different False Top Thickness
5. Conclusions
Author Contributions
Funding
Institutional Review Board Statement
Informed Consent Statement
Data Availability Statement
Acknowledgments
Conflicts of Interest
References
- Zhou, H.; Hou, C.; Sun, X.; Qu, Q.; Chen, D. Solid waste paste filling for none-village-relocation coal mining. J. China Univ. Min. Technol. 2004, 33, 154–158, 177. [Google Scholar]
- Chang, Q.; Tang, W.; Xu, Y.; Zhou, H. Research on the width of filling body in gob-side entry retaining with high-water materials. Int. J. Min. Sci. Technol. 2018, 28, 519–524. [Google Scholar] [CrossRef]
- Du, X.J.; Feng, G.R.; Qi, T.Y. Roof stability analyses of water-preserved and water-stored coal mining with construction backfill mining. J. China Coal Soc. 2019, 44, 821–830. [Google Scholar]
- Xiuzhi, S.H.I.; Yonggang, G.O.U.; Xin, C.; Jia, L.U.O. Determination and application of the backfill thickness in the residual ore recovery of crown and sill pillar. J. Min. Saf. Eng. 2016, 33, 1080. [Google Scholar]
- Wu, A.; Zhang, A.; Wang, H.; Gongcheng, L.; Rong, K. The mechanical model for the paste false roof and finite element analysis. J. Min. Saf. Eng. 2017, 3, 98–101. [Google Scholar]
- Xikui, S.U.N.; Xiushan, L.I.; Xianyuan, S.H.I. Study on mine strata behavior with full backfill effect of paste backfill in coal mine. Coal Sci. Technol. 2017, 45, 48–53. [Google Scholar]
- Tang, W.; Sun, X.; Wang, H.; Shi, X.Y.; Li, X.Y.; Li, Y. Study on effect of overlying strata stability during strip coal pillar excavation with paste backfilling. Coal Sci. Technol. 2017, 45, 109–115. [Google Scholar]
- Sun, Y.; Li, G.; Zhang, J.; Xu, J. Failure Mechanisms of Rheological Coal Roadway. Sustainability 2020, 12, 2885. [Google Scholar] [CrossRef] [Green Version]
- Basarir, H.; Sun, Y.; Li, G. Gateway stability analysis by global-local modeling approach. Int. J. Rock Mech. Min. Sci. 2019, 113, 31–40. [Google Scholar] [CrossRef]
- Sun, Y.; Li, G.; Basarir, H.; Karrech, A.; Azadi, M.R. Laboratory evaluation of shear strength properties for cement-based grouted coal mass. Arab. J. Geosci. 2019, 12, 1–11. [Google Scholar] [CrossRef]
- Ma, D.; Kong, S.; Li, Z.; Zhang, Q.; Wang, Z.; Zhou, Z. Effect of wetting-drying cycle on hydraulic and mechanical properties of cemented paste backfill of the recycled solid wastes. Chemosphere 2021, 282, 131163. [Google Scholar] [CrossRef]
- Chen, J.; Liu, P.; Zhao, H.; Zhang, C.; Zhang, J. Analytical studying the axial performance of fully encapsulated rock bolts. Eng. Fail. Anal. 2021, 128, 105580. [Google Scholar] [CrossRef]
- Sun, Y.; Li, G.; Zhang, J. Investigation on jet grouting support strategy for controlling time-dependent deformation in the roadway. Energy Sci. Eng. 2020, 8, 1–8. [Google Scholar] [CrossRef] [Green Version]
- Sun, Y.; Li, G.; Zhang, J.; Qian, D. Experimental and numerical investigation on a novel support system for controlling roadway deformation in underground coal mines. Energy Sci. Eng. 2020, 8, 490–500. [Google Scholar] [CrossRef] [Green Version]
- Ma, D.; Duan, H.; Liu, J.; Li, X.; Zhou, Z. The role of gangue on the mitigation of mining-induced hazards and environmental pollution: An experimental investigation. Sci. Total Environ. 2019, 664, 436–448. [Google Scholar] [CrossRef] [PubMed]
- Chen, J.; Zhao, H.; He, F.; Zhang, J.; Tao, K. Studying the performance of fully encapsulated rock bolts with modified structural elements. Int. J. Coal Sci. Technol. 2021, 8, 64–76. [Google Scholar] [CrossRef]
- Sun, Y.; Li, G.; Zhang, J.; Qian, D. Stability Control for the Rheological Roadway by a Novel High-Efficiency Jet Grouting Technique in Deep Underground Coal Mines. Sustainability 2019, 11, 6494. [Google Scholar] [CrossRef] [Green Version]
- Ma, D.; Zhang, J.; Duan, H.; Huang, Y.; Li, M.; Sun, Q.; Zhou, N. Reutilization of gangue wastes in underground backfilling mining: Overburden aquifer protection. Chemosphere 2021, 264, 128400. [Google Scholar] [CrossRef]
- Chang, Q.; Sun, X.; Dong, X.; Shao, S. Stability analysis of cemented paste backfill false roof in highwall mining: A case study. Desalin. Water Treat. 2021, 219, 96–102. [Google Scholar] [CrossRef]
- Sun, Y.; Zhang, J.; Li, G.; Ma, G.; Huang, Y.; Sun, J.; Wang, Y.; Nener, B. Determination of Young’s modulus of jet grouted coalcretes using an intelligent model. Eng. Geol. 2019, 252, 43–53. [Google Scholar] [CrossRef]
- Sun, Y.; Li, G.; Zhang, N.; Chang, Q.; Xu, J.; Zhang, J. Development of ensemble learning models to evaluate the strength of coal-grout materials. Int. J. Min. Sci. Technol. 2021, 31, 153–162. [Google Scholar] [CrossRef]
- Lv, W.; Wu, Y.; Ming, L.; Yin, J. Migration law of the roof of a composited backfilling longwall face in a steeply dipping coal seam. Minerals 2019, 9, 188. [Google Scholar] [CrossRef] [Green Version]
- Fengshan, M.A.; Feng, L.I.U.; Jie, G.U.O.; Rong, L.U.; Huigao, G.U.O.; Yongyuan, K.O.U. Backfill stability analysis of steep dip mine using filling method. J. Eng. Geol. 2018, 26, 1351–1359. [Google Scholar]
- Abbasi, B.; Russell, D.; Taghavi, R. FLAC3D mesh and zone quality. In Proceedings of the FLAC/DEM Symposium, Hangzhou, China, 22–24 October 2013; Itasca Consulting Group: Minneapolis, MN, USA, 2013. [Google Scholar]
- Sears, M.M.; Slaker, B.; Rashed, G.; Winfield, J. Numerical model validation and analysis of a dipping limestone pillar using FLAC3D. In Proceedings of the 53rd US Rock Mechanics/Geomechanics Symposium, New York, NY, USA, 23 June 2019; OnePetro: New York, NY, USA, 2019. [Google Scholar]
- Sun, Y.; Li, G.; Zhang, J.; Sun, J.; Huang, J.; Taherdangkoo, R. New Insights of Grouting in Coal Mass: From Small-Scale Experiments to Microstructures. Sustainability 2021, 13, 9315. [Google Scholar] [CrossRef]
- Sun, Y.; Bi, R.; Chang, Q.; Taherdangkoo, R.; Zhang, J.; Sun, J.; Huang, J.; Li, G. Stability Analysis of Roadway Groups under Multi-Mining Disturbances. Appl. Sci. 2021, 11, 7953. [Google Scholar] [CrossRef]
- Wu, K.; Shao, Z.; Qin, S.; Wei, W.; Chu, Z. A critical review on the performance of yielding supports in squeezing tunnels. Tunn. Undergr. Sp. Technol. 2021, 115, 103815. [Google Scholar] [CrossRef]
- Wu, K.; Shao, Z.; Sharifzadeh, M.; Hong, S.; Qin, S. Analytical computation of support characteristic curve for circumferential yielding lining in tunnel design. J. Rock Mech. Geotech. Eng. 2021, 13, 1–13. [Google Scholar]
- Zhu, D.; Yan, E.; Hu, G.; Lin, Y. Revival deformation mechanism of Hefeng Landslide in the Three Gorges Reservoir based on FLAC3D software. Procedia Eng. 2011, 15, 2847–2851. [Google Scholar] [CrossRef] [Green Version]


| Top and Bottom Name | Rock Stone Name | Platts Hardness Coefficient | Thickness/m |
|---|---|---|---|
| Old top | Fine-grained sandstone—Siltstone | 4.04 | 12.42~ 13.65 |
| Direct top | Sandy mudstone—Fine siltstone | 2.74 | 6.87~7.85 |
| Mudstone | 1.22 | 1.82~2.13 | |
| Direct bottom | Mudstone—Siltstone | 2.71 | 2.96~3.05 |
| Old bottom | Sandy mudstone—Fine-grained sandstone | 3.62 | 8.37~8.94 |
| Rock Formation Lithology Basic Parameters | Layered Thick Degree /m | Bulk Modulus the Amount/GPa | Shear Modulus/GPa | Elastic Modulus/GPa | Poisson’s Ratio | Cohesion/MPa | Internal Friction Angle/° | Density/kg·m−3 | Tensile Strength/MPa |
|---|---|---|---|---|---|---|---|---|---|
| Medium-grained sandstone | 220 | 19.11 | 13.16 | 32.12 | 0.22 | 2.72 | 25.13 | 2650 | 2.7 |
| Siltstone | 13.1 | 13.06 | 8.60 | 21.16 | 0.23 | 2.02 | 26.10 | 2600 | 2 |
| Sandy mudstone | 7.2 | 10.48 | 6.29 | 15.73 | 0.25 | 1.19 | 30.67 | 2510 | 1.1 |
| Mudstone | 1.9 | 7.65 | 5.50 | 13.31 | 0.21 | 0.89 | 31.03 | 2320 | 0.8 |
| 3# coal seam | 6.4 | 1.37 | 0.67 | 1.73 | 0.29 | 0.53 | 29.24 | 1450 | 0.5 |
| Mudstone | 1.1 | 7.65 | 5.50 | 13.31 | 0.21 | 0.89 | 31.03 | 2320 | 0.8 |
| Siltstone | 1.9 | 13.06 | 8.60 | 21.16 | 0.23 | 2.02 | 26.10 | 2600 | 2 |
| Fine-grained sandstone | 8.9 | 11.64 | 7.32 | 18.16 | 0.24 | 1.32 | 33.21 | 2410 | 2.3 |
| 5 MPa filling body | - | 0.08 | 0.13 | 0.2 | 0.27 | 0.33 | 30.00 | 1900 | 0.24 |
Publisher’s Note: MDPI stays neutral with regard to jurisdictional claims in published maps and institutional affiliations. |
© 2021 by the authors. Licensee MDPI, Basel, Switzerland. This article is an open access article distributed under the terms and conditions of the Creative Commons Attribution (CC BY) license (https://creativecommons.org/licenses/by/4.0/).
Share and Cite
Chang, Q.; Sun, Y.; Leng, Q.; Liu, Z.; Zhou, H.; Sun, Y. Stability Analysis of Paste Filling Roof by Cut and Fill Mining. Sustainability 2021, 13, 10899. https://doi.org/10.3390/su131910899
Chang Q, Sun Y, Leng Q, Liu Z, Zhou H, Sun Y. Stability Analysis of Paste Filling Roof by Cut and Fill Mining. Sustainability. 2021; 13(19):10899. https://doi.org/10.3390/su131910899
Chicago/Turabian StyleChang, Qingliang, Yifeng Sun, Qiang Leng, Zexu Liu, Huaqiang Zhou, and Yuantian Sun. 2021. "Stability Analysis of Paste Filling Roof by Cut and Fill Mining" Sustainability 13, no. 19: 10899. https://doi.org/10.3390/su131910899