Article

Evaluation on the Change Characteristics of Ecosystem Service Function in the Northern Xinjiang Based on Land Use Change

1
Ministry of Education Key Laboratory for Western Arid Region Grassland Resources and Ecology, College of Grassland Science, Xinjiang Agricultural University, Urumqi 830052, China
2
State Key Laboratory of Desert and Oasis Ecology, Xinjiang Institute of Ecology and Geography, Chinese Academy of Sciences, Urumqi 830011, China
*
Author to whom correspondence should be addressed.
Yang Wang and Remina Shataer contributed equally to this work.
Sustainability 2021, 13(17), 9679; https://doi.org/10.3390/su13179679
Submission received: 27 July 2021 / Revised: 18 August 2021 / Accepted: 21 August 2021 / Published: 28 August 2021
(This article belongs to the Special Issue Urban Management Based on the Concept of Sustainable Development)

Abstract

:
Monitoring the interannual changes in land use and the temporal and spatial characteristics of the ecosystem services value (ESV) can help to comprehensively and objectively understand the distribution of regional ecological patterns. The mountain–oasis–desert transition zone in the northern Tianshan Mountain region of Xinjiang, China, is a geographically unique area with a highly sensitive ecosystem. As a data source, the study uses Landsat TM images from 1990, 2000, 2010, and 2018 along with GIS-extracted data to calculate the dynamic degree of land use. As well, the spatial and temporal patterns of land use change and ESV are quantitatively analyzed by using the equivalent factor method, sensitivity index, and spatial correlation studies. The results reveal the following: (1) From 1990 to 2018, the land use changes in the northern Tianshans are relatively drastic, mainly due to the increase in cultivated land, grassland and construction land, and the decrease in forest land, water, and unused land. (2) The ESV increases and then decreases, for a total loss of about 271.63 × 10⁸ yuan. The largest decrease is in forest value, and the largest increase (around 129.94%) is in construction land. (3) The spatial distribution pattern of ESV in the northern Tianshans is apparent, showing high in the north and southwest, and low in the central and southeast portions of the study area. Additionally, there is a visible spatial correlation and aggregation in ESV. The present research can provide theoretical support for the environmental protection of the ecologically vulnerable area of the northern Tianshans as well as for further construction across the region.

1. Introduction

‘Ecosystem services’ refer to the direct or indirect contributions and services of ecosystem structures, processes and functions to humans [1,2]. Land use/cover change (LUCC), which describes the interaction between the human/land relationship and the ecosystem, is an important driving force that affects the transformation of ecosystem structure and function [3]. Therefore, closely linking LUCC with human well-being is of great significance for ensuring regional ecological security and socio-economic development [4,5,6]. In recent years, many Domestic scholars and abroad have conducted a lot of research on the value theory, type classification and accounting methods of ecosystem services, and have achieved rich results [7,8,9,10,11]. Costanza [12] combined ecology and economics to quantitatively study the value of ecosystem services, in the process establishing a global ecosystem service value. However, Hassan [13] argues that using the same ESV coefficient in different research areas to assess the value of ecosystem services will cause significant errors and spatial heterogeneity.
In short, scholars such as Daily and Costanza [12,14] clarified the definition of ecosystem and laid the foundation for the development of ecosystem service assessment research. Domestic related research was introduced by scholars such as Ouyang [7], Zhao [15], and Xie et al. [8]. On this basis, many domestic scholars have carried out a lot of research work related to ecosystem services using value and material quality evaluation methods. Domestic scholars Xie et al. [16] refer to Costanza [12] based on the relevant estimation research the classification of ecosystem service functions, and according to the actual situation of the Chinese ecosystem, conducted in-depth studies on different spatial scales, and corrected the ecosystem service value coefficients. Establishing a set of service value coefficients that can be widely used to evaluate ecosystems—such as cities [17], islands [18], and watersheds [19]—further advances the evaluation research process of the value of ecosystem services. In recent years, the unit value of different regions has been calculated based on the value equivalent of basic ecosystem services, and the equivalent correction has been made by comparing grain yield, net profit, NDVI, NPP, precipitation, or soil conservation adjustment with global or national average levels, and corresponding with expert experience. In combination, this can determine the unit area value of ecosystem services [20,21,22]. The functional value method uses actual market price data to reflect the actual preferences or costs of individuals, but requires sufficient quantity, cost, and market price data to fully analyze the marginal changes in ecosystem services [23,24]. In addition, with the support of 3S technology, many scholars have studied the area’s habitat protection, environmental function zoning, ecological compensation policies, and ecological economic accounting [25].
At present, with research and discussion increasing both domestically and abroad, the relationship between land use change and ESV is shifting ever closer, making quantitative research in this field conducive to the coordination of regional sustainable development. Polasky et al. [26] point out that the increasing area of cultivated land is the main reason for the decrease in ESV in certain areas of the United States. Luo et al. [27] and Yoriguli et al. [28] believe that the comprehensive urbanization rate is an important mitigating factor affecting changes in the value of regional ecosystem services and is strongly related to the social economy. Chen [29] points out that the structure of land types is frequently converted, and the conversion of high-value land types to low-value land types is the direct cause of the decrease in regional ESV. Meanwhile, Wang [30] and Li [31] argue separately that the main reason for the reduction in ESV in rapidly urbanized areas is the sharp decline in cultivated land area. In similar work, Gashaw [32] points out that land use change is closely related to regional single ESV, such as the conversion of forests into agricultural land, which weakens the proportion of gas regulation and climate regulation functions of regional ecosystems, but strengthens the single items formed by food production and biodiversity protection.
In summary, it is feasible to study the value of regional ecosystem services based on LUCC. However, the multiple time series and spatial scales intuitively show that the spatial degree of ESV is differentiated, and that GIS and RS technologies thus need to be combined. At the same time, multiple periods of land use or remote sensing image data are used for spatial superposition, and the law of regional land transfer is quantitatively studied by methods such as transfer matrix and land use dynamics. Against this research backdrop, ESV temporal and spatial differentiation characteristics can be explored based on spatial statistical analysis [33]. In China’s arid northwest, the Tianshan Mountain region is a sprawling and multi-featured zone. The overall terrain of this area is high in the west and low in the east, and it presents a mountain-oasis-desert transitional ecological unit with a complete spectrum of vertical landscape belts [34]. From an economic perspective, northern Tianshan Mountains is a focal point for advocating the economic development of China’s renowned “One Belt, One Road” and includes key petrochemical and light industrial bases [35]. However, as the population grows in this region, deforestation and grazing are intensifying the demand for land resources, resulting in forest land degradation and land desertification. The disorderly development of industry and mining has destroyed much of the surface vegetation, causing soil fertility to decline and the ecological environment to become increasingly fragile [36]. In light of this situation, these findings will provide a scientific basis for the sustainable development of land resources in the arid area of northwest China, one that takes into consideration the balance of the regional ecological environment.

2. Data and Materials

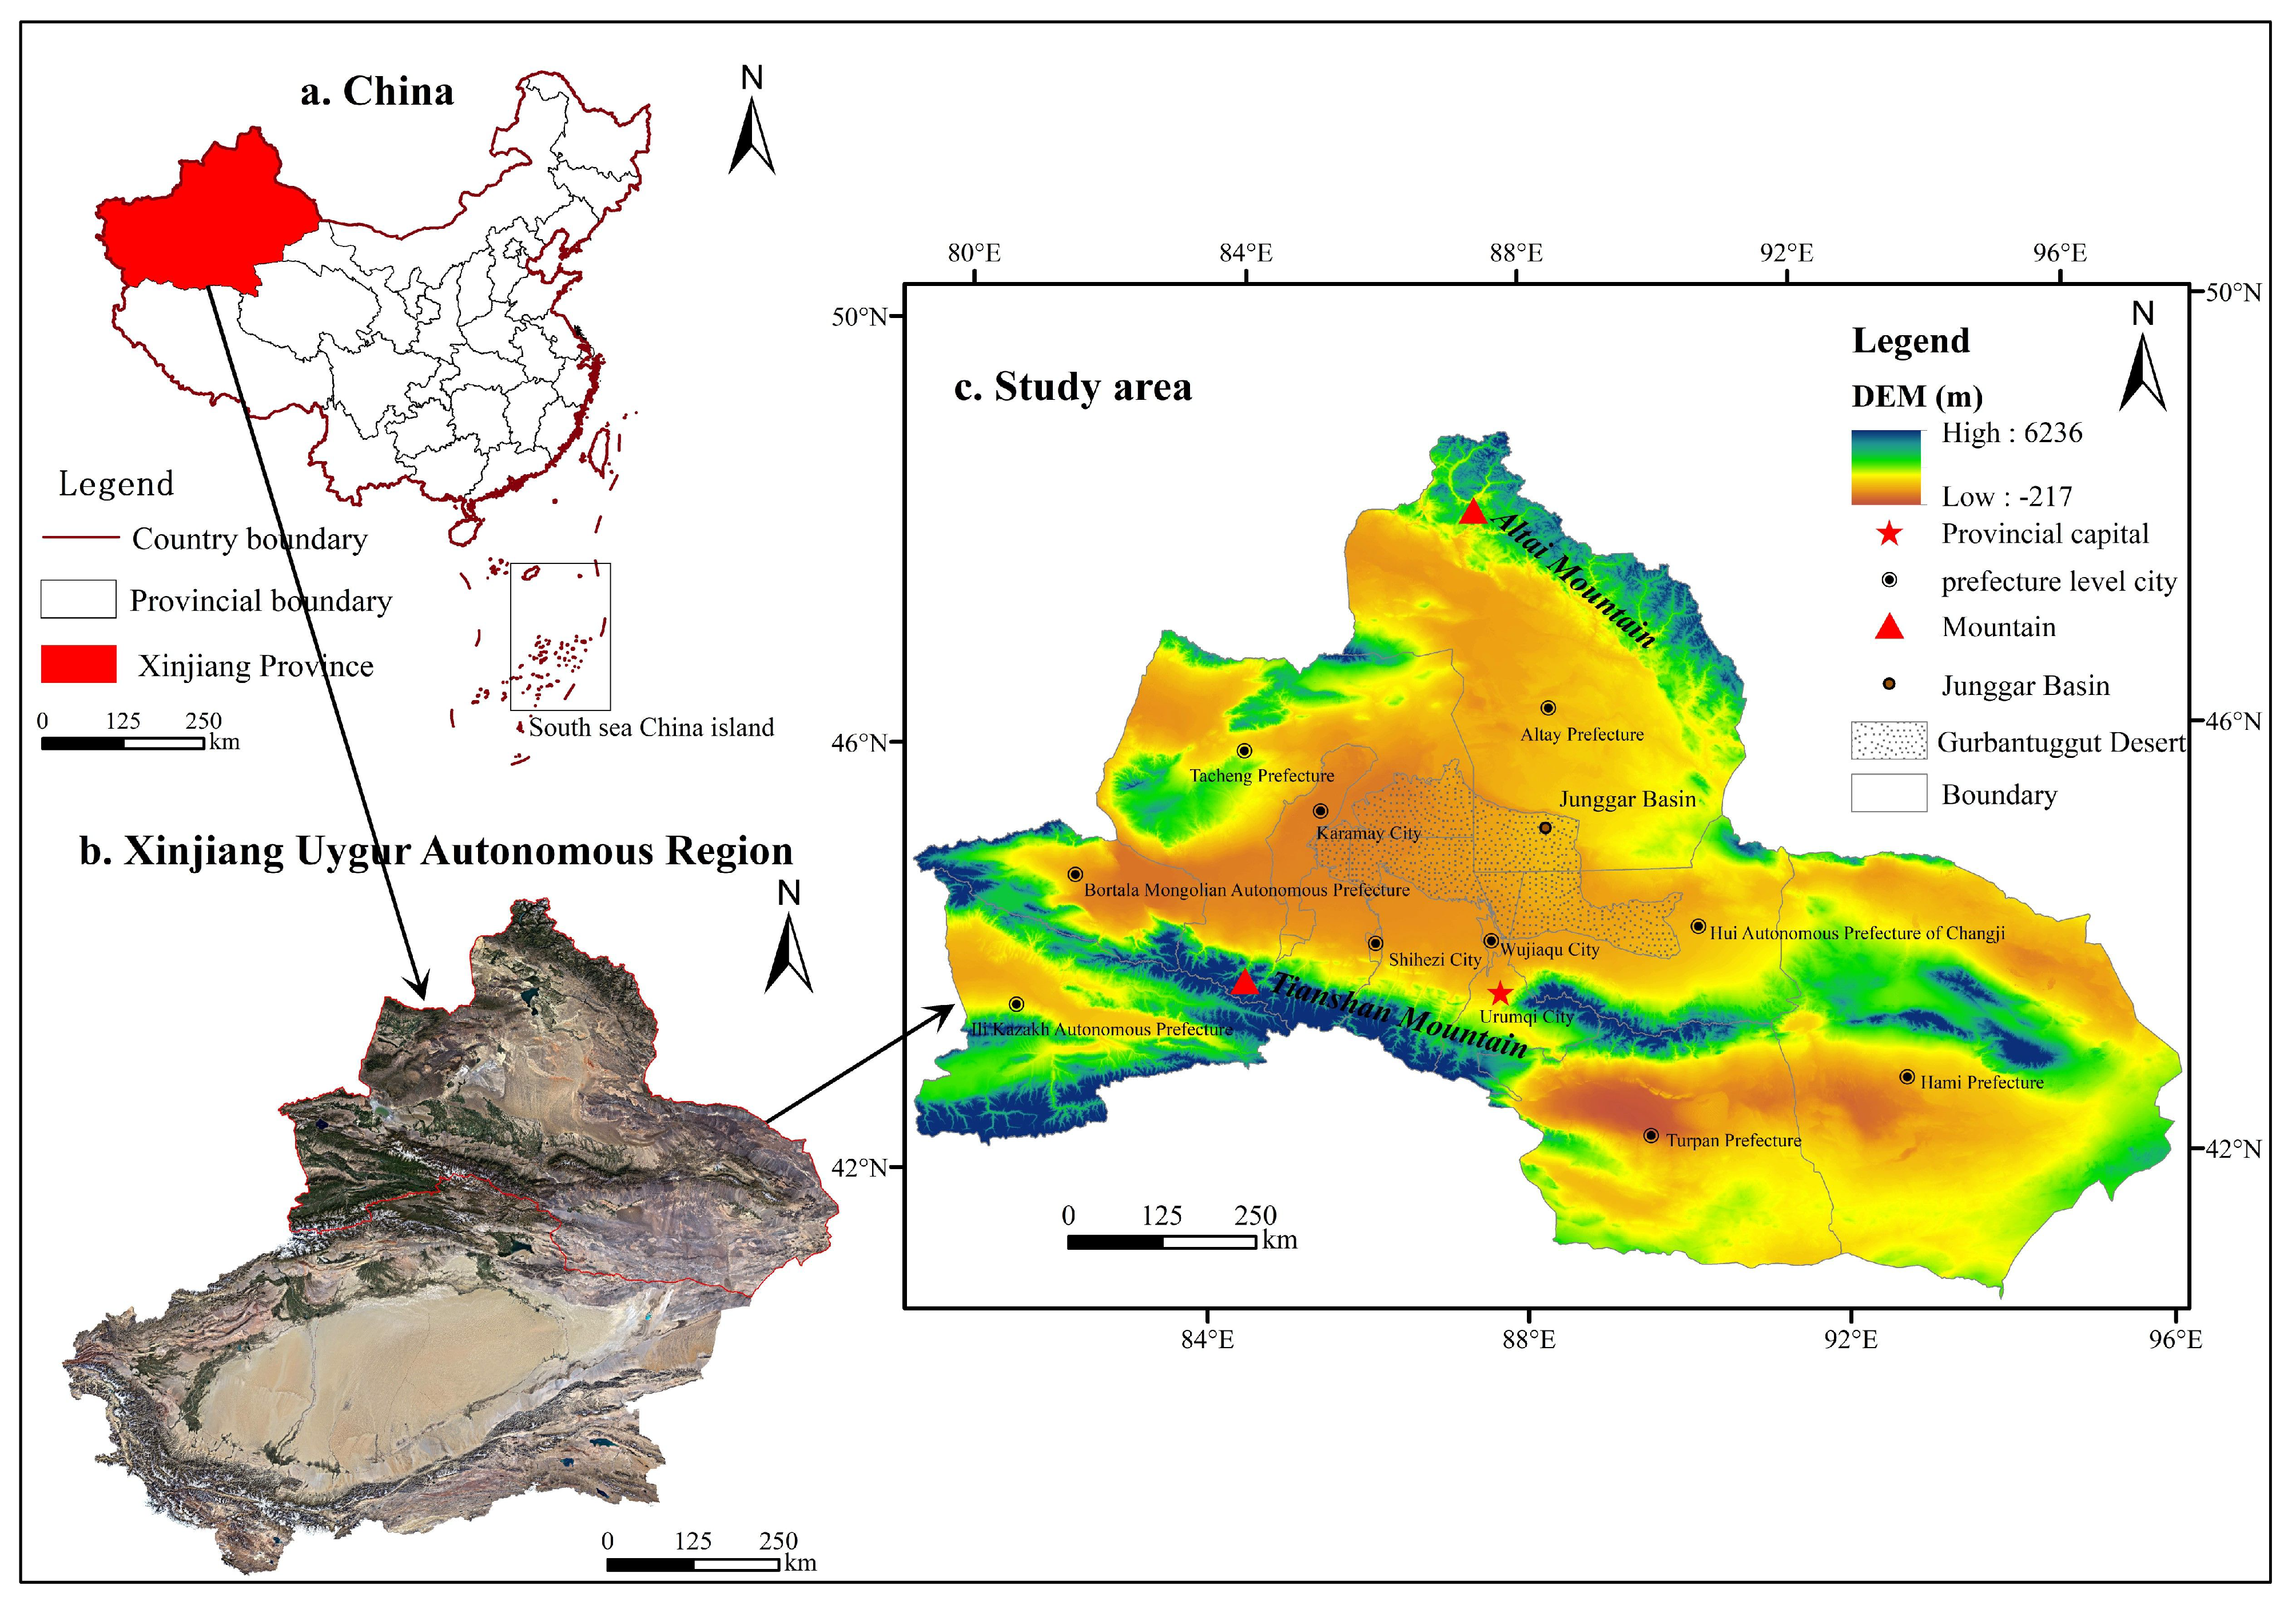
2.1. Description of Study Area

The northern part of the Tianshan Mountains is situated in Xinjiang, China. It lies at latitude 79°54′–96°22′ E and longitude 42°08′–48°03′ N, with an altitude between −217 and 6236 m. This region features a continental arid and semi-arid climate that experiences an average annual temperature of 4 to 9 °C, annual precipitation of about 160 to 300 mm, and a large difference in temperature between day and night. Furthermore, its topography is characterized by classic mountain range and basin phase distribution [37]. Being mostly arid, the area has only sparse vegetation that is mainly drought-tolerant.
A good example of the region’s fragile arid ecosystem is the Haloxylon Desert, which is widely distributed in the Junggar Basin. The Haloxylon is characterized by extreme soil moisture deficiency, with the dominant soil types being brown and gray desert soil [38]. The main centers within the study area are Urumqi city, Turpan Prefecture, Hami Prefecture, Altay Prefecture, Tacheng Prefecture, Changji Hui Autonomous Prefecture, Ili Kazak Autonomous Prefecture, and Bortala Mongolian Autonomous Prefecture. The Northern Tianshan Mountains also serve as the pivot point for Xinjiang’s rapid economic development (Figure 1).

2.2. Methods

2.2.1. Data Collection and Processing

The land use data employed in this study come from the Data Center of Resources and Environment, Chinese Academy of Sciences (http://www.resdc.cn/, accessed on 7 May 2021). The four periods of 1990, 2000, 2010, and 2018 were selected at a spatial resolution of 30 m, giving a classification accuracy of more than 90%. The socio-economic data come from the “Xinjiang Statistical Yearbook”, “Xinjiang Production and Construction Corps Statistical Yearbook”, and the website of the Xinjiang Uygur Autonomous Region Statistics Bureau (http://www.xjtj.gov.cn/, accessed on 8 June 2021). DEM elevation data are derived from the geospatial data cloud platform of the Computer Network Information Center, Chinese Academy of Sciences (http://www.gscloud.cn, accessed on 7 May 2021), and the administrative boundaries of each administrative unit are from the National Basic Geographic Information Center 1:4 million database (http://ngcc.sbsm.gov.cn/, accessed on 7 May 2021). Based on the Classification of Land Use Status (GB/T 21010-2017), this paper classifies the land use types in northern Tianshan Mountains into the six following categories: cultivated land, forest, grassland, water area, construction land, and unused land [39].

2.2.2. Single Dynamic Degree of Land Use

Land use dynamics are an indicator for evaluating the change rate and amplitude of different land use types within a certain time range [40]. They also reflect the impact of human activities on a single land use type. The formula for land use dynamics is
K = U j - U i U i × 1 t × 100 %
where K is the dynamic degree of a certain land use type; Ui and Uj, respectively, represent the area at the beginning and end of the research period of a certain land use type; and t represents the research duration. The larger the value of K, the more obvious the dynamic change of this type of land use.

2.2.3. Ecosystem Service Value (ESV) Calculation

The evaluation of ESV is based on a study by Xie [16], who used as a reference some of the results of the Costanza [12] model. Xie [16] revised the model to formulate an ecosystem service value equivalent that was based on the actual situation in China. Among them, the cultivated land and unused land are divided into farmland and difficult-to-use land. Due to its particularity, construction land is only included in the cultural and recreational ecological service functions [41]. Data were collected on the food crop yields in the administrative unit in the northern Tianshan Mountains during the study period. It is calculated that the service value equivalent factor of a single ecosystem in the area is 1881.82 yuan/hm2. From this, the ecosystem service value coefficient is obtained (Table 1).
The next step is to calculate the ESV of the study area according to the service value coefficient and the area of each category. The calculation formula is
E S V = A a × V C a E S V = A a × V C b a
where ESV is the ecosystem service value; Aa is the area of type a land use type in the study area; VCa represents the ecological service value coefficient of type a land use type; and VCba represents the ecosystem service value of item b of type a land use type.

2.2.4. Sensitivity Coefficient of Ecosystem Service Value

This study uses the Ecosystem Service Sensitivity Index (CS) to clarify the degree of influence of the value coefficient on ESV under different time scales [42]. The calculation formula is
C S = | E S V j - E S V i E S V i V C j k - V C i k V C i k |
In the formula, CS is the sensitivity coefficient of the ecosystem value coefficient, and i and j represent the initial ecosystem service value and the value after the adjustment of the ecological value coefficient, respectively. If CS > 1, ESV is elastic to VC, and its accuracy and reliability are low. On the contrary, if CS < 1, ESV is inelastic to VC, and the research results are credible.

2.2.5. Spatial Auto-Correlation Analysis

Global Moran’s I and Univariate local Moran’s I were used to characterize the spatial aggregation or discrete distribution of ecosystem service values in spatial units in northern Tianshan Mountains [43]. The local indicators of spatial connection are used to analyze the value of ecosystem services. By analyzing the Lisa cluster map of ESV, the spatial aggregation strength of ESV in this region was explored. The formula is
I i = X i - X ¯ Si 2 j = 1 , j i n W i , j ( X j - X ¯ )
S i 2 = j = 1 , j i n ( X j - X ¯ ) n - 1 2
where Xi and Xj are the attribute values of units i and j, respectively; Wij is the spatial weight matrix between factors i and j; S is the standard deviation; X ¯ is the average of the corresponding attributes; and n is the total number of factors.

3. Results and Analysis

3.1. Spatio-Temporal Change Characteristics of Land Use Types

For the time frame 1990–2018, the inter-annual changes of land use types in northern Tianshan Mountains (Table 2) and the distribution map of land use/cover types (Figure 2) show that unused land is the dominant land use type, with the largest proportion being 55.46% in 1990 and the smallest proportion 52.11% in 2018. Grassland area is second only to unused land, with a multi-year average proportion of 33.6%, while cultivated land is the most advantageous land use type in the study area, showing the largest increase in area (2.61%). Construction land area is the smallest, accounting for only 0.41–0.95% of the total area.
Throughout the study period, the land use types in the study area showed different characteristics during different time periods. These characteristics mainly manifested as an increase in the area of cultivated land, grassland and construction land, and a decrease in the area of forest land, waters, and unused land. The growth of cultivated land was the most obvious, showing a cumulative increase of 155.83 × 10⁴ hm2 (Table 3). Furthermore, the growth rate was the fastest from 2010 to 2018, with a dynamic degree of 3.54 (Figure 3). The land was mainly transformed from grassland (149.36 × 10⁴ hm2) and unused land (61.95 × 10⁴ hm2) due to the reclamation of wasteland suitable for agriculture by water diversion and irrigation.
Meanwhile, grassland grew by 138.94 × 10⁴ hm2 in total during the study period. The fastest growth rate occurred in 2010–2018, at a dynamic degree of 1.15. The main transformation was from unused land (406.71 × 10⁴ hm2) and forest land (155.59 × 10⁴ hm2). In 1990, the area of construction land was 25.15 × 10⁴ hm2, but this grew to 56.61 × 10⁴ hm2 by 2018, representing an increase of 31.46 × 10⁴ hm2. The growth rate was the fastest from 2010 to 2018, with a dynamic degree of 9.49, and it mainly transformed from cultivated land (19.7 × 10⁴ hm2) and unused land (13.04 × 10⁴ hm2). This indicates that with the development of the social economy, construction land is increasing to meet the needs of high-quality urban development.
Six typical types of land use change were further analyzed (Figure 4). The area of unused land was 3306.18 × 104 hm2 in 1990 and 3109.4 × 104 hm2 in 2018, giving a reduction of approximately 196.78 hm2. The area was mainly transformed into grassland (406.71 × 10⁴ hm2) and cultivated land (61.95 × 10⁴ hm2). Between 1990 and 2018, the forest land area and water area decreased by 104.2 × 10⁴ hm2 and 25.25 × 10⁴, respectively. The fastest period of decrease was 2010–2018, and the dynamic degree was −4.92, −4.14. Forest land was primarily transformed into grassland (155.59 × 10⁴ hm2) and cultivated land (12.06 × 10⁴ hm2), and water bodies were mainly transformed into unused land (41.37 × 10⁴ hm2) and grassland (12.48 × 10⁴ hm2). This change reflects that with the rational allocation of cultivated land resources, the conversion of land use types is mainly based on the conversion between grassland and cultivated land. Moreover, due to the influence of natural conditions and economic and social development and policies, the area of unused land was greatly reduced, and the area of forest land showed a shrinking trend.

3.2. Temporal and Spatial Changes in ESV

3.2.1. Time Dimension Changes in ESV

This study uses the ESV coefficient in northern Tianshan Mountains to estimate the value of ecosystem services in various regions from 1990 to 2018 (Table 4). As can be seen in the table, the ESV showed a clear downward trend. The maximum value was 5291.31 × 108 yuan in 2010, and the minimum was 4955.55 × 108 yuan in 2018. In terms of segments, the ESV in the study area showed a gentle upward trend from 1990 to 2010. However, by 2018, the ESV was 4955.55 × 108 yuan, indicating a clear downward trend.
From 1990 to 2018, the ESV decreased by 271.63 × 10⁸ yuan, which was about −5.2%. Grassland contributed the most to the total ESV, with a contribution of about 45.02–57.97%. The contribution of cultivated land and construction land to the system service value showed an obvious upward trend, making the inter-annual change rate of ESV relatively large, while the ecosystem service contribution value of forest land and waters showed a downward trend, decreasing by 428.14 × 10⁸ yuan and 218.71 × 10⁸ yuan, respectively. The ESV change rate was thus −41.56% and −26.24%. The sharp decline in forest land and water area is the main reason for the decline in the value of ecosystem services during the study period. Grazing in forests, unreasonable reclamation, and over-exploitation of water resources exacerbated the ESV, causing it to shrink.
Ecosystem services are the output of ecosystems through ecological functions, which can directly or indirectly serve humans. The contributions of these services are divided into the following four categories: regulation service, support service, provision service and cultural service [44]. According to the ESV first-level classification, the value of ecosystem services in northern Tianshan Mountains in Xinjiang showed a downward trend from 1990 to 2018. The proportion of its contribution rate may be stated as: regulation service > support service > provision service > cultural service (Table 5). The regulation service function is the most prominent, with a maximum value of 2932.23 × 108 yuan in 2010 and a minimum value of 2520.63 × 108 yuan in 2018. This indicates an upward trend followed by a downward trend. The second most prominent is support service, with a maximum value of 1865.41 × 108 yuan in 1990 and a minimum value of 1842.26 × 108 yuan in 2018. Support service charted a volatile trend and declined as a whole. Meanwhile, both supply service and cultural service accounted for only a small proportion of the ecosystem service value in the study area.
The change trend of the value of various ecosystem services in the study area is similar to the change trend of the total value of the ecosystem. According to the proportion of the value of each individual function of the ESV secondary classification: soil formation and protection > waste treatment > water conservation > biodiversity protection > climate regulation > gas regulation > food production > raw material production > entertainment culture. The regulation service function covers four aspects: gas regulation, climate regulation, water conservation, and waste treatment and shows a downward trend in general. Among them, water conservation and waste treatment and regulation services have similar changing trends, with fluctuations rising before 2010 and then decreasing to 2018. Grassland and woodland have a great impact on regulation services, which is related to the coverage of regional vegetation and the high level of regulation services. Therefore, changes in regulation services maintain a strong correlation with changes in grassland area. The two service functions of soil formation and protection and biodiversity protection are collectively called support services. These two services show a downward trend prior to 2000, rebound slightly, and then decline again after 2010. Soil formation and protection accounted for the highest proportion of single value, and the trend of gradual fluctuation is mainly due to the decrease in forest land area year by year. Factors, such as water shortage and uneven distribution, give this service a gentle downward trend.
Supply services and cultural services account for only a small proportion of the ecosystem service value in the study area. The two service functions of food production and raw material production are supply services, and the entertainment and cultural service functions are cultural services. Among them, the food production function of the supply service is mainly affected by cultivated land and construction land and is consistent with the change trend of cultivated land and construction land, showing a continuous upward growth trend. The cultural service function shows an upward trend from 1990 to 2010, followed by a rapid downward trend from 2010 to 2018. The cultural service function of the district and the changes in water reveal a synchronous trend.
In summary, the overall decline trend of ESV in northern Tianshan from 1990 to 2018 is consistent with that of regulating services. From 1990 to 2010, it exhibits a continuous upward trend and continues to decline after 2010–2018. Cultivated land, grassland, and woodland have a significant impact on the value of ecosystem services, and the protection of forests and grasslands is crucial to the ecological protection of the entire study area.

3.2.2. Ecosystem Sensitivity Coefficient Analysis

According to the sensitivity calculation formula, the VC of each land use type was adjusted upward and downward by 50% to obtain the sensitivity index CS for the study area in 1990, 2000, 2010, and 2018 (Figure 5). The results show that the CS values for different land use types in the four mentioned periods were all less than 1. Specifically, the maximum value was grassland, with a CS value of 0.5797, which means that when the VC of grassland increased by 1%, the total value increased by 0.5133%. The minimum value was construction land, with a CS value of 0.0000. From 1990 to 2018, the CS value of cultivated land continued to increase, whereas the CS value of forest land and water area showed a downward trend. With continuous expansion, the demand for agricultural water source irrigation also increased, while the water area decreased.
The CS value of grassland fluctuated and rose, reaching the highest value in 2018. This indicates that grassland contributes the most value for its ecosystem services and is in line with the national policy guidelines to strengthen grassland protection and construction. Overall, the CS sensitivity analysis shows that for each category in the study period, the CS value is less than 1. Furthermore, the ESV in the Northern Tianshans is inelastic to VC, the result is credible, and the value coefficient is suitable for calculating the ecology of the study area.

3.2.3. Changing Characteristics of ESV Spatial Dimensions

In order to further analyze the temporal and spatial distribution characteristics of the ecosystem service value, a fishing net tool was created based on the ArcGIS 10.2 platform. As well, the study area was divided into 6284 grids with a size of 10 × 10 km each [45]. In order visually to show the service value levels and clustering changes of the land ecosystem in the study area from 1990 to 2018, the natural breakpoint grading method was used in ArcGIS to divide the ESV from low to high, thus providing a spatial display of profit and loss (Figure 6).
By analyzing the overall ESV temporal and spatial changes, we can see that the basic pattern of the study area is relatively stable, showing a distribution pattern of “high in the north and southwest, and low in the middle and southeast”. This feature is compatible with the typical mountain-oasis-desert transition zone, as high-grade ESV areas are mainly distributed in mountain regions. In the study area, the landform types are primarily mountains and hills, and natural forest and grassland resources are abundant.
Meanwhile, medium-level ESV areas are mainly distributed in the oasis areas, where the land types are mainly cultivated land and construction land. Low-level ESV areas have a large area of desert units distributed among them, and unused land is a relatively common land use type. In contrast to the changes in the spatial distribution of ESV in 1990 and 2018, high-grade ESV areas have been increasing year by year; low-grade areas have not changed significantly, but still account for a relatively large portion. Therefore, from a general point of view, ESV in the study area shows a downward trend.
Over the past 30 years, the development of national engineering construction projects has accelerated the urbanization process in the Northern Tianshans. By combining land used and ESV gains and losses, we can see that some areas are still undergoing change. The far northern and southwestern parts of the study area are characterized by high-grade distribution and high ESV, as they are strongly affected by the policies of returning grazing to grassland and cultivated land protection. Hence, the area of cultivated land and grassland has increased steadily, and the area of unused land has been declining year by year. The distribution characteristics of the central and southeast portions of the study area are low-grade, meaning that the Gurbantunggut Desert (China’s second largest) is counted among the central area. As the sprawling desert is vast, the ESV is low.

3.3. Analysis of Spatial Correlation of ESV

Spatial Autocorrelation Analysis

This paper uses Geoda software to perform global autocorrelation analysis to further analyze the dynamic agglomeration of ESV space in the study area (Figure 7). From 1990 to 2018, Moran’s I value was greater than 0 and showed a steady fluctuating trend, indicating that the spatial distribution of ecosystem services values has significant aggregation characteristics. The regional autocorrelation analysis clearly shows the spatial distribution of ESV (Figure 8). Through superposition analysis, we can see that ESV distribution has very significant spatial autocorrelation, that is, the ESV high-value area is concentrated in space, and the low-value area is discrete.
In 1990, the Global Moran’s I index reached its maximum value of 0.749 and showed a decreasing trend year by year, indicating that the spatial autocorrelation of ESV has gradually decreased. At the same time, it indirectly indicates that higher ESV contribution values have decreased year by year, with Moran’s I reaching a peak value of 0.453 during 1990–2000. This phenomenon is related to the dramatic increase in ESV caused by substantial changes in forest and arable land area. The far northern and southwestern parts of the study area are important economic function areas that benefit from the high contribution of cultivated land, forest land, and grassland to ESV. This, in turn, increases the ESV of the region and is advantageous to the coordinated development of the ecological economy. Conversely, the central and southeastern parts of the study area have a fragile ecological environment. Even so, the demand for land is increasing in these areas and the allocation of resource elements is imperfect, which is not conducive to the growth of ESV.

4. Discussion

The area under study is a mountain–oasis–desert staggered transition unit, with correlation effects on atmospheric environment, soil environment, water environment, and other subsystems [46,47]. Land use change, as one of the important factors reflecting the value of ecosystem services, closely connects its change with the value flow. From the perspective of ecosystem service, the mountain area is the water source formation place in arid areas, with rich natural forest and grassland resources playing a positive role in the increment of regional ecosystem service value. Furthermore, the natural environment of the oasis area is closely related to human habitat development, and is also the most suitable habitat for plant growth and development.
The desert-staggered transition zone is the foundation of the oasis formation and development. The Haloxylon ammodendron in this area are important plant protection communities and are all undergoing complex energy conversion and material exchanges [48,49]. At present, most of the research on ESV is based on small river basins, indicating a clear gap in the literature. The overall value of ecosystem services in the research area is decreasing, a finding which differs from previous studies based on other spatial scales in Xinjiang. For example, the value of ecosystem services in the Manas River Basin in Xinjiang from 1995 to 2015 showed a positive and continuous growth trend [50], and the ESV in the Tarim River Basin in southern Xinjiang declined rapidly from 2010 to 2015 [51]. As well, research on Xinjiang’s ESV based on the work of Yao Yuan and others [52] shows that the regional ecological value trended upward from 2007 to 2016.While the differences are related to a variety of land use structures and landform types, the differences in the correction coefficient will also have an impact on the ESV. In recent years, many authors have calculated estimates based on equivalent factors and ESV coefficients. However, it is difficult to determine a clear and fixed standard, which makes the value estimations significantly different and the results highly subjective [53]. In addition, the diversity of ecosystems reflects certain variations in the value of ecosystem services. Therefore, when evaluating the ecosystem service value according to the equivalent factor method, the equivalent factor correction method should be used to make reasonable corrections to the ESV coefficient according to the actual situation of the study area, as such specificity plays an important role in truly reflecting the changes in ESV [54].
The evolution of land use pattern in the Northern Tianshan Mountains is a comprehensive embodiment of changes in ESV. With the expansion of urbanization over the past 30 years, related factors such as industrial and agricultural development and population increase have driven drastic changes in land use types. Among these, the dominant land types are cultivated land, grassland, and construction land, and they play a crucial role in the ecological function. The continuous expansion of cultivated land into woodland, along with the obvious trend of expansion towards the Gobi and other deserts, has resulted in serious land degradation. At the same time, the rapid growth in cultivated land has spurred continuous growth in energy demand, while natural climate fluctuations have made water evaporation greater than precipitation, which is unsustainable for current levels of development.
Accelerated expansion of construction land increased by about 129.94% in 1990–2018, exerting further pressure on land and leading to a decline in the value of ecosystem services [55,56]. Added to that, in recent years, the tourism economy has also rapidly increased. However, the sudden influx of visitors has caused high-intensity human disturbance activities that are negatively affecting regional vegetation and soil properties. The resulting ecological imbalance is not conducive to ecological protection. Overall, the process of urbanization is accelerating in the study area. With population growth, the demand for food production functions in supply services has likewise increased, and water conservancy facilities such as irrigation and repair reservoirs have changed the pattern of water resources distribution. This has caused large spatial and temporal fluctuations in water and biodiversity conservation [57,58]. As an important part of promoting the development of “One Belt and One Road”, the Tianshan North Slope Economic Belt is one of the biggest obstacles restricting the ecological restoration process of China’s “clear waters and green mountains” in China.
This paper uses the spatial autocorrelation analysis method based on the grid scale, combined with the coupling relationship between land use change and ecosystem service value, to intuitively reflect the evolution characteristics of the ESV spatial distribution pattern. The land use structure in the Northern Tianshan Mountains is frequently transformed, and the relationship with ecological fragility becomes more obvious with the increase in time scale. Additionally, the characteristics of spatial cluster change were analyzed using the global Moran index and LISA cluster diagram. The correlation is mainly concentrated in the mountain and oasis areas, and the spatial distribution shows high significance [59].
Considering the above discussion regarding the comprehensive spatial characteristic identification of ecosystem service value in the study area, it is expected that the Northern Tianshan region will be adversely affected by human activities and policy implementation, The contradiction between ecology–economy–development is prominent in the region, which in turn affects the structure and function of the entire arid area ecosystem [60,61]. While the present study focuses on regional land use structure changes and analyzes the temporal and spatial differentiation characteristics of ecosystem service value, an analysis of nature, society and potential policy-driving forces has yet to be done. A follow-up study could involve an updated analysis of the high-precision satellite remote sensing data and the release of socio-economic data in relation to the urban agglomeration occurring on the northern slope of the Tianshan Mountains on a regional scale. This could be conducted to explore the development and migration trends of urban agglomerations driven by policy, population, and economic factors.

5. Conclusions

Based on land use data from 1990, 2000, 2010, and 2018, the present study adopted an equivalent factor correction method along with some spatial autocorrelation techniques to analyze the spatiotemporal changes of land use and ecosystem service values in the Northern Tianshan Mountains. The main conclusions are as follows:
(1) From 1990 to 2018, unused land was the largest and most widely distributed land type in the study area, with cultivated land and grassland showing a fluctuating upward trend. Among these land types, the growth of cultivated land was the most significant, increasing 155.83 × 10⁴ hm2 over the past 30 years. From 2000–2018, the positive dynamic growth rate of construction land and negative dynamic change of woodland and water area were the most obvious changes.
(2) The value of ecosystem services in the Northern Tianshans showed a fluctuating downward trend, with a total decrease of 271.63 × 10⁸ yuan, or about −5.2%. Grassland and cultivated land, both of which made the highest ESV contribution values, played a positive role in increasing the value of ecological services. Furthermore, for individual ecological services, soil formation and protection, waste treatment, water conservation and biodiversity conservation assumed key guiding roles and should be investigated more in-depth in future research.
(3) From the perspective of spatial scale, from 1990–2018, ESV in the northern Tianshans showed the distribution trend of “high in the north and southwest, low in the middle and southeast”. The ESV high-grade portions were concentrated in mountainous areas, where the topography is mainly mountainous and hilly, and vegetation coverage is high. This area was less affected by grazing and human activities. The medium-level ESV area is an oasis that features cultivated land, construction land, etc., while low-level ESV areas were largely deserts, with ‘unused land’ being the most predominant land use type.

Author Contributions

Y.W. and Z.L. conceived the study design and implemented the field research, R.S. and T.X. collected and analyzed the field data; X.C. and H.Z. applied statistics, mathematics, or other forms of technology to analyze or research data. R.S. wrote the paper with the help of Y.W. All authors have read and agreed to the published version of the manuscript.

Funding

The research is supported by the Natural Science Foundation of Xinjiang Uygur Autonomous Region (2021D01E02).

Conflicts of Interest

The authors declare they have no conflict of interest.

References

  1. Wang, S.G.; Rajchandar, P.; Aires, M.; Silva João, M.N.; Mohamed, S.; Pedro, C.; Campos, F.S. Using Satellite Image Fusion to Evaluate the Impact of Land Use Changes on Ecosystem Services and Their Economic Values. Remote Sens. 2021, 13, 851. [Google Scholar]
  2. Feng, Y.; Zhu, J.H.; Zeng, L.X.; Xiao, W.F. Prediction of profit and loss of county—Scale ecosystem service Values under land use change: A case study of Banan District, Chongqing. Acta Ecol. Sin. 2021, 41, 3381–3393. [Google Scholar]
  3. Li, T.H.; Li, W.K.; Qian, Z.H. Variations in ecosystem service value in response to land use changes in Shenzhen. Ecol. Econ. 2008, 69, 1427–1435. [Google Scholar]
  4. Wang, X.M.; Xu, M.; Zhang, Y.; Xu, N.Z.; Zhang, Y.H. Evaluation of Eco-economy Harmony and Spatial Evolution of the Urban Agglomeration Area in The Great Pearl River Delta. IOP Conf. Ser. Earth Environ. Sci. 2018, 153, 1–8. [Google Scholar] [CrossRef]
  5. Wei, X.D.; Wang, N.; Luo, P.P.; Yang, J.; Zhang, J.; Lin, K.L. Spatiotemporal Assessment of Land Marketization and Its Driving Forces for Sustainable Urban–Rural Development in Shaanxi Province in China. Sustainability 2021, 13, 7755. [Google Scholar] [CrossRef]
  6. Zha, X.B.; Luo, P.P.; Zhu, W.; Wang, S.T.; Lyu, J.q.; Zhou, M.M.; Huo, A.D.; Wang, Z.H. A Bibliometric Analysis of the Research on Sponge City: Current Situation and Future Development Direction. Ecohydrology 2021, e2328. [Google Scholar] [CrossRef]
  7. OuYang, Z.Y.; Wang, X.K.; Miao, H. Aprimary study on Chinese terrestrial ecosystem services and theur ecological-economic values. Acta Ecol. Sin. 1999, 19, 609–613. [Google Scholar]
  8. Xie, G.D.; Lu, C.X.; Leng, Y.F.; Zheng, D.; Li, S.C. Ecological assets valuation of the Tibetan Plateau. J. Nat. Resour. 2003, 18, 189–196. [Google Scholar]
  9. Fu, B.J.; Zhang, L.W. Land—use change and ecosystem services: Concepts, methods and progress. Prog. Geogr. 2014, 33, 441–446. [Google Scholar]
  10. Wang, Z.Y.; Cao, J.S. Assessing and Predicting the Impact of Multi-Scenario Land Use Changes on the Ecosystem Service Value: A Case Study in the Upstream of Xiong’ an New Area, China. Sustainability 2021, 13, 704. [Google Scholar] [CrossRef]
  11. Jin, T.T.; Zhang, Y.X.; Zhu, Y.H.; Gong, J.; Yan, L.L. Spatiotemporal variations of ecosystem service values and landscape ecological risk and their cor-relation in forest area of Loess Plateau, China: A case study of Ziwuling region. Chin. J. Appl. Ecol. 2021, 32, 1623–1632. [Google Scholar]
  12. Costanza, R.; D’Arge, R.; Groot, R.D.; Farber, S.; Grasso, M.; Hannon, B.; Limburg, K.; Naeem, S.; O’Neill, R.V.; Paruelo, J.; et al. The value of the world’s ecosystem services and natural capital. Nature 1997, 387, 253–260. [Google Scholar] [CrossRef]
  13. Hassan, R.M.; Crafford, J.G. Measuring the contribution of ecological composition and functional services of ecosystems to the dynamics of KwaZulu-Natal coast fisheries. Ecol. Econ. 2015, 119, 306–313. [Google Scholar] [CrossRef] [Green Version]
  14. Daily, G.C. Nature’s Services: Socuetal Dependence on Natural Ecosystems. Pac. Conserv. Biol. 1997, 6, 220–221. [Google Scholar]
  15. Zhao, J.Z.; Xiao, H.; Wu, G. Comparison analysis on physical and value assessment methods for ecosystems services. Chin. J. Appl. Ecol. 2000, 11, 290–292. [Google Scholar]
  16. Xie, G.D.; Zhang, C.X.; Zhang, L.M.; Chen, W.H.; Li, S.M. Improvement of the Evaluation Method for Ecosystem Service Value Based on Per Unit Area. J. Nat. Resour. 2015, 30, 1243–1254. [Google Scholar]
  17. Zhang, J.; Lei, G.; Qi, L.H.; Ding, X.; Cheng, C.J.; Liu, X.Q. The landscape pattern and ecological service value in Danjiangkou City under land use change from 2003 to 2018. Acta Ecol. Sin. 2021, 41, 1280–1290. [Google Scholar]
  18. Lei, J.R.; Chen, Z.Z.; Chen, X.H.; Li, Y.L.; Wu, T.T. Spatio-temporal changes of land use and ecosystem services value in Hainan Island from 1980 to 2018. Acta Ecol. Sin. 2020, 40, 4760–4773. [Google Scholar]
  19. Chen, W.X.; Zeng, J.; Zhong, M.X.; Pan, S.P. Coupling Analysis of Ecosystem Services Value and Economic Development in the Yangtze River Economic Belt: A Case Study in Hunan Province, China. Remote Sens. 2021, 13, 1552. [Google Scholar] [CrossRef]
  20. Shi, Y.; Wang, R.S.; Huang, J.L.; Yang, W.R. An analysis of the spatial and temporal changes in Chinese terrestrial ecosystem service functions. Sci. Bull. 2012, 57, 2120–2131. [Google Scholar] [CrossRef] [Green Version]
  21. Liu, M.Z.; Jia, Y.G.; Zhao, J.J.; Shen, Y.J.; Pei, H.W.; Zhang, H.J.; Li, Y.L. Revegetation projects significantly improved ecosystem service values in the agro-pastoral ecotone of northern China in recent 20 years. Sci. Total Environ. 2021, 788, 147756. [Google Scholar] [CrossRef] [PubMed]
  22. Luo, P.; Mu, D.; Xue, H.; Ngo-Duc, T.; Dang-Dinh, K.; Takara, K.; Nover, D.; Schladow, G. Flood inundation assessment for the Hanoi Central Area, Vietnam under historical and extreme rainfall conditions. Sci. Rep. 2018, 8, 12623. [Google Scholar] [CrossRef]
  23. Wu, G.Y.; Dong, R.; Yu, F.W. Estimation of Ecological Compensation Standards for Small Watersheds: Based on the Value of Ecological Service Function. IOP Conf. Ser. Earth Environ. Sci. 2019, 35, 210–214. [Google Scholar]
  24. Nesticò, A.; Endreny, T.; Guarini, M.R.; Sica, F.; Anelli, D. Real Estate Values, Tree Cover, and Per-Capita Income: An Evaluation of the Interdependencies in Buffalo City (NY). In International Conference on Computational Science and Its Applications; Springer: Cham, Switzerlands, 2020; pp. 913–926. [Google Scholar]
  25. Sagoff, M. The quantification and valuation of ecosystem services. Ecol. Econ. 2011, 70, 497–502. [Google Scholar] [CrossRef]
  26. Polasky, S.; Nelson, E.; Pennington, D.; Kris, A. The Impact of Land-Use Change on Ecosystem Services, Biodiversity and Returns to Landowners: A Case Study in the State of Minnesota. Environ. Resour. Econ. 2011, 48, 219–242. [Google Scholar] [CrossRef]
  27. Luo, S.F.; Yan, W.D. Evolution and driving force analysis of ecosystem service values in Guangxi Beibu Gulf coastal areas, China. Acta Ecol. Sin. 2018, 38, 3248–3259. [Google Scholar]
  28. Yueriguli, K.S.M.; Yang, S.T.; Zibibula, S.M.Y. Impact of land use change on ecosystem service value in Ebinur Lake Basin, Xinjiang. Trans. Chin. Soc. Agric. Eng. 2019, 35, 260–269. [Google Scholar]
  29. Chen, W.X.; Li, F.J.; Zhu, L.J. Spatial heterogeneity and sensitivity analysis of Ecosystem Services value in the Middle Yangtze River region. J. Nat. Resour. 2019, 34, 325–337. [Google Scholar]
  30. Wang, X.G.; Yan, F.Q.; Zeng, Y.W.; Chen, M.; Su, F.Z.; Cui, Y.K. Changes in Ecosystems and Ecosystem Services in the Guangdong-Hong Kong-Macao Greater Bay Area since the Reform and Opening Up in China. Remote Sens. 2021, 13, 1611. [Google Scholar] [CrossRef]
  31. Li, L.; Wu, D.F.; Wang, F.; Liu, Y.Y.; Liu, Y.H.; Qian, L.X. Prediction and tradeoff analysis of ecosystem service value in the rapidly urbanizing Foshan City of China: A case study. Acta Ecol. Sin. 2020, 40, 9023–9036. [Google Scholar]
  32. Gashaw, T.; Tulu, T.; Argaw, M.; Abeyou, W.; Tolessa, T.; Kindu, M. Estimating the impacts of land use/land cover changes on Ecosystem Service Values: The case of the Andassa watershed in the Upper Blue Nile basin of Ethiopia. Ecosyst. Serv. 2018, 31, 219–228. [Google Scholar] [CrossRef]
  33. Guo, B.; Wang, X.X.; Pei, L.; Su, Y.; Zhang, D.M.; Wang, Y. Identifying the spatiotemporal dynamic of PM 2.5 concentrations at multiple scales using geographically and temporally weighted regression model across China during 2015–2018. Sci. Total Environ. 2021, 751, 141765. [Google Scholar] [CrossRef]
  34. Fang, C.L.; Gao, Q.; Zhang, X.L.; Cheng, W.G. Spatiotemporal characteristics of the expansion of an urban agglomeration and its effect on the eco-environment: Case study on the northern slope of the Tianshan Mountains. Sci. China Earth Sci. 2019, 62, 137–148. [Google Scholar] [CrossRef]
  35. Song, W.J.; Zhang, Q.; Liu, S.S.; Yang, J.N. LUCC-Based Human Disturbance and Ecological Security in Arid Area: A Case Study in the Economic Zone on Northern Slope of the Tianshan Mountains. Arid Zone Res. 2018, 1, 235–242. [Google Scholar]
  36. Huo, A.; Peng, J.; Cheng, Y.X.; Luo, P.P.; Zhao, Z.X.; Zheng, C.L. Hydrological Analysis of Loess Plateau Highland Control Schemes in Dongzhi Plateau. Front. Earth Sci. 2020, 8, 528632. [Google Scholar] [CrossRef]
  37. Guo, Z.C.; Wei, W.; Shi, P.J.; Zhou, L.; Wang, X.F.; Li, Z.Y.; Pang, S.F.; Jie, B.B. Spatiotemporal changes of land desertification sensitivityin the arid region of Northwest China. Acta Geogr. Sin. 2020, 75, 1948–1965. [Google Scholar]
  38. Zhu, Y.H.; Luo, P.P.; Zhang, S.; Sun, B. Spatiotemporal Analysis of Hydrological Variations and Their Impacts on Vegetation in Semiarid Areas from Multiple Satellite Data. Remote Sens. 2020, 12, 4177. [Google Scholar] [CrossRef]
  39. Liu, J.Y. Study on National Resources & Environment Survey and Dynamic Monitoring Using Remote Sensing. J. Remote Sens. 1997, 3, 225–230. [Google Scholar]
  40. Tong, S.Q.; Bao, G.; Rong, A.H.; Huang, X.J.; Bao, Y.B.; Bao, Y.H. Comparison of the Spatiotemporal Dynamics of Land Use Changes in Four Municipalities of China Based on Intensity Analysis. Sustainability 2020, 12, 3687. [Google Scholar] [CrossRef]
  41. Zulpiya, M.M.T.; Hamit, Y.M.T.; Anwar, E.Z.I.Z.; Ajigul, A.B.L.M.T. Response of ecosystem services value to land use/cover change in the Yanqi Basin of Xinjiang, China. J. Desert Res. 2014, 34, 275–283. [Google Scholar]
  42. Mayila, R.H.M.; Mamat, S.W.T.; Nigela, T.X.P.; Yikliman, A.B.D.M.T.; Ma, C.Y.; Erxat, A.B.L.M.T. The ecosystem service value spatial—temporal changes in the Ugan—kuqa River Delta Oasis based on RS and GIS. Acta Eeoiogica Silica 2018, 38, 5938–5951. [Google Scholar]
  43. Xin, D.; Wang, L.C.; Huang, C.B.; Fang, L.L.; Wang, S.Q.; Wang, L.Z. Spatio-temporal variations of ecosystem services in the urban agglomerations in the middle reaches of the Yangtze River, China. Ecol. Indic. 2020, 115, 106394. [Google Scholar]
  44. Qiao, B.; Zhu, C.X.; Cao, X.Y.; Xiao, J.S.; Zhang, L.D.; Yan, Y.Q.; Chen, G.Q.; Shi, F.F. Spatial autocorrelation analysis of land use and ecosystem service value in Maduo County, Qinghai Province, China at the grid scale. Chin. J. Appl. Ecol. 2020, 31, 1660–1672. [Google Scholar]
  45. Guo, C.Y.; Gao, S.; Zhou, B.Y.; Gao, J.H. Effects of land use change on ecosystem service value in Funiu Mountain based upon a grid square. Acta Ecol. Sin. 2019, 39, 3482–3493. [Google Scholar]
  46. Luo, N.N.; Mao, D.H.; Wen, B.L.; Liu, X.T. Climate Change Affected Vegetation Dynamics in the Northern Xinjiang of China: Evaluation by SPEI and NDVI. Land 2020, 9, 90. [Google Scholar] [CrossRef] [Green Version]
  47. Kang, T.T.; Li, Z.; Gao, Y.C. Effectiveness of ecological restoration in the mountain-oasis-desert system of northwestern arid area of China. Acta Ecol. 2019, 39, 7418–7431. [Google Scholar]
  48. Wei, H.J.; Liu, H.M.; Xu, Z.H.; Ren, J.H.; Lu, N.C.; Fan, W.G.; Zhang, P.; Dong, X.B. Linking ecosystem services supply, social demand and human well-being in a typical mountain-oasis-dessert area, Xinjiang, China. Ecosyst. Serv. 2018, 31, 44–57. [Google Scholar] [CrossRef]
  49. Xie, D.N.; Duan, L.; Si, G.Y.; Liu, W.J.; Zhang, T.; Mulder, J. Long-term 15N balance after single-dose input of 15N labeled NH4+ and NO3 in a subtropical forest under reducing N deposition. Glob. Biogeochem. Cycles 2021, e2021GB006959. [Google Scholar] [CrossRef]
  50. Xia, X.X.; Zhu, L.; Yang, A.M.; Jin, H.; Zhang, Q.Q. Evaluate the positive and negative value of ecosystem services based on Mountain-Desert-Oasis system (MODS): A case study of Manas River Basin in Xinjiang. Acta Ecol. Sinca 2020, 40, 3921–3934. [Google Scholar]
  51. Liu, H.M.; Gao, J.X.; Liu, X.; Zhang, H.Y.; Xu, X.L. Monitoring and assessment of the ecosystem services value in the national key ecological function zones. Acta Ecol. Sin. 2020, 40, 1865–1876. [Google Scholar]
  52. Yao, Y.; Ding, J.L.; Zhang, F.; Lei, L.; Jiang, H.N. Impact of human driving factors for land use change on ecosystem services values in Xinjiang Wei Autonomous Region. Bull. Soil Water Conserv. 2013, 33, 298–304. [Google Scholar]
  53. Xia, J.Y.; Cao, M.; Xiao, W.; Li, Y.P.; Fu, G.; Wang, W.; Li, J.S. Integrating Spatial Valuation of Ecosystem Services into Protected Area Management:A Case Study of the Cangshan Nature Reserve Dali, china. Sustainability 2020, 12, 9395. [Google Scholar] [CrossRef]
  54. Li, G.D.; Fang, C.L.; Wang, S.J. Exploring spatiotemporal changes in ecosystem-service values and hotspots in China. Sci. Total Environ. 2016, 545–546, 609–620. [Google Scholar] [CrossRef]
  55. Mu, D.; Luo, P.P.; Lyu, J.; Zhou, M.M.; Huo, A.D.; Duan, W.L.; Nover, D.; He, B.; Zhao, X.L. Impact of temporal rainfall patterns on flash floods in Hue City, Vietnam. J. Flood Risk Manag. 2020, 14, e12668. [Google Scholar]
  56. Zhang, Y.Z.; Huang, C.C.; Tan, Z.H.; Chen, Y.L.; Qiu, H.J.; Huang, C.; Li, Y.Q.; Zhang, Y.X.; Li, X.G.; Shulmeister, J.; et al. Prehistoric and historic overbank floods in the Luoyang Basin along the Luohe River, middle Yellow River basin, China. Quat. Int. 2019, 521, 118–128. [Google Scholar] [CrossRef]
  57. Zhang, Y.; Luo, P.P.; Zhao, S.F.; Kang, S.X.; Wang, P.B.; Zhou, M.M.; Lyu, J.Q. Control and Remediation Methods for Eutrophic Lakes in Recent 30 years. Water Sci. Technol. 2020, 81, 1099–1113. [Google Scholar] [CrossRef]
  58. Ahammad, R.; Stacey, N.; Sunderland, T. Analysis of forest-related policies for supporting ecosystem services-based forest management in Bangladesh. Ecosyst. Serv. 2021, 48, 101235. [Google Scholar] [CrossRef]
  59. Ling, H.B.; Yan, J.J.; Xu, H.L.; Guo, B.; Zhang, Q.Q. Estimates of shifts in ecosystem service values due to changes in key factors in the Manas River basin, northwest China. Sci. Total Environ. 2019, 659, 177–187. [Google Scholar] [CrossRef] [PubMed]
  60. Lyu, J.; Mo, S.; Luo, P.P.; Zhou, M.M.; Shen, B.; Nover, D. A quantitative assessment of hydrological responses to climate change and human activities at spatiotemporal within a typical catchment on the Loess Plateau, China. Quat. Int. 2019, 527, 1–11. [Google Scholar] [CrossRef]
  61. Wang, L.Y.; Ke, X.L.; Hatab, A.A. Trade-Offs between Economic Benefits and Ecosystem Services Value under Three Cropland Protection Scenarios for Wuhan City in China. Land 2020, 9, 117. [Google Scholar] [CrossRef]
Figure 1. Sketch map of study area. Note: Figure approval number is Xin S(2018)033.
Sustainability 13 09679 g001
Figure 2. Status of land use in the Northern Tianshans from 1990 to 2018.
Sustainability 13 09679 g002
Figure 3. Land use dynamic and rate of different types in the Northern Tianshans from 1990 to 2018.
Sustainability 13 09679 g003
Figure 4. Changes in the type of land use in northern Tianshans from 1990 to 2018. Notes: CL, FL, GL, WB, CL*, and UL represent cultivated land, forest land, grassland, water bodies, construction land, and unused land, respectively.
Sustainability 13 09679 g004
Figure 5. Sensitive coefficient of ESV and land use type in the Northern Tianshans from 1990 to 2018.
Sustainability 13 09679 g005
Figure 6. Spatial distribution characteristics of ESV in the Northern Tianshans.
Sustainability 13 09679 g006
Figure 7. Changes in the Global Moran’s I in the Northern Tianshans from 1990 to 2018.
Sustainability 13 09679 g007
Figure 8. LISA cluster map of the Northern Tianshans ESV from 1990 to 2018.
Sustainability 13 09679 g008
Table 1. Ecosystem service value (ESV) coefficient for Northern Tianshan (yuan/hm2).
Ecosystem Service FunctionLand Use Type
Cultivated LandForest LandGrasslandWaterConstruction LandUnused Land
Gas regulation940.916586.371505.460.000.000.00
Climate regulation1674.825080.921693.64865.640.000.00
Water conservation1129.096021.831505.4638,351.500.0056.45
Soil formation and protection2747.467339.103669.5518.820.0037.64
Waste disposal3086.192465.182465.1834,211.500.0018.82
Biodiversity conservation1336.096134.742051.184685.730.00639.82
Food production1881.82188.18564.55188.180.0018.82
Raw material production188.184892.7394.0918.820.000.00
Entertainment culture18.822408.7375.278167.1082.6018.82
Total13,003.3841,117.7813,624.3886,507.2982.60790.36
Table 2. Land use type in the Northern Tianshans from 1990 to 2018 (%).
Land Use Type19902000201020181990–2018
Cultivated Land5.375.446.227.982.61
Forest Land4.194.054.052.45−1.74
Grassland32.9532.8532.3535.322.37
Water1.611.741.781.19−0.42
Construction Land0.410.480.540.950.54
Unused Land55.4655.4455.0752.11−3.35
Table 3. Land use transfer matrix for the Northern Tianshans from 1990 to 2018 (×104 hm2).
Land Use TypeCultivated LandForest LandGrasslandWaterConstruction LandUnused LandTotalTransfer Out
Cultivated Land239.9110.6251.83.319.73.89320.1680.25
Forest Land12.0568.68155.592.281.2810.26250.14238.09
Grassland149.3670.831476.859.7612.53247.911967.241817.88
Water2.50.8512.4838.360.3741.3795.9393.43
Construction Land10.220.122.750.239.692.1425.1514.93
Unused Land61.953.9406.7116.7513.042803.833306.183244.23
Total475.99145.942106.1870.6856.613109.45964.8
Transfer Out236.08144.382054.3867.3836.913105.51
Table 4. Changes in ESV for various land use types in the Northern Tianshans from 1990 to 2018 (108 yuan).
Land Use TypeCultivated LandForest LandGrasslandWaterConstruction LandUnused LandTotal
1990ESV417.661030.282683.36833.660.20262.025227.18
Proportion %7.99%19.71%51.33%15.95%0.00%5.01%100%
2000ESV422.83994.622675.30901.590.24261.885256.46
Proportion %8.04%18.92%50.90%17.15%0.00%4.98%100%
2010ESV483.61994.162634.62918.530.27260.135291.31
Proportion %9.14%18.79%49.79%17.36%0.01%4.92%100%
2018ESV619.34602.142872.77614.950.47245.884955.55
Proportion %12.50%12.15%57.97%12.41%0.01%4.96%100%
ESV changes 1990 to 2018201.67−428.13189.41−218.720.26−16.13−271.63
ESV change rate 1990 to 201848.29%−41.56%7.06%−26.24%129.94%−6.16%−5.2%
Table 5. Changes in individual ecosystem services in the Northern Tianshans from 1990 to 2018.
Type 1Type 21990200020102018
ESV%ESV%ESV%ESV%
Regulation ServiceGas regulation491.769.41%485.53 9.24%485.36 9.17%458.70 9.56%
Climate regulation523.0210.01%518.95 9.87%521.84 9.86%462.20 9.63%
Water conservation871.9616.68%896.40 17.05%904.50 17.09%749.58 15.62%
Waste disposal982.3518.79%1006.84 19.15%1020.54 19.29%850.14 17.72%
Subtotal2869.0954.89%2907.73 55.32%2932.23 55.42%2520.63 52.53%
Support serviceSoil formation and protection1007.5319.27%1000.09 19.03%1001.82 18.93%1023.92 21.34%
Biodiversity conservation857.8816.41%855.45 16.27%855.00 16.16%818.34 17.05%
Subtotal1865.4135.69%1855.54 35.30%1856.82 35.09%1842.26 38.39%
Provision of servicesFood production184.403.53%184.80 3.52%191.90 3.63%218.62 4.56%
Raw material production147.352.82%143.14 2.72%143.69 2.72%100.59 2.10%
Subtotal331.756.35%327.94 6.24%335.59 6.34%319.20 6.65%
Cultural serviceEntertainment culture160.933.08%165.25 3.14%166.67 3.15%116.42 2.43%
total5227.19100%5256.46 100%5291.31 100%4798.51 100%
Publisher’s Note: MDPI stays neutral with regard to jurisdictional claims in published maps and institutional affiliations.

