1. Introduction
Providing abundant resources, services, and social networking opportunities, industrial parks have become an important arena for supporting the innovation and growth of enterprises [
1]. To cope with survival pressures from resource scarcity, high innovation risks, and technology complexity, many new enterprises choose to cooperate with other enterprises in their R&D, production, and marketing [
2,
3]. Collaboration contributes to greater innovation returns and higher success rates, which support the sustained growth of enterprises and motivates more enterprises to participate in the cooperation of innovation activities [
3,
4,
5]. The emergence of innovation cooperation activities among a large number of park enterprises area lubricant for the sustainable development of the parks. These activities promote the effective integration of innovative resources as well as more frequent occurrences of high-quality innovation and the long-term survival of enterprises within parks [
6,
7,
8].
In practice, however, enterprise cooperation can present a number of problems. Collaborative innovation among different enterprises is a process of social interaction [
9]. Problems such as “hitchhiking”, moral issues, and adverse selection inevitably emerge in cooperation activities because of information asymmetry, differences in levels of technology, and heterogeneity of capabilities among enterprises [
1,
10]. These problems harm individual enterprises, impair mutual trust, and undermine cooperative relationships in parks, which make them even more unfavorable to the sustainable emergence of enterprise cooperation in industrial parks—impacting the sustainable development of industrial parks more broadly. In order to improve the sustainable cooperation of innovation, it is vital to analyze the emergence mechanisms of innovation cooperation considering enterprises’ dynamic behaviors in the complex social-economic system of an industrial park [
7].
Previous studies have discussed the characteristics, modes, and mechanisms of cooperation among enterprises in industrial parks, but there have been no thorough investigations of the emergence of enterprise innovation cooperation. For example, P. Xiang et al. and Zhang et al. examined modes of enterprise cooperation [
11,
12]. Mukherjee and Ramani explored the rationale for R&D cooperation and demonstrated that asymmetric capabilities have an impact on alliance choices [
13]. Villarreal studied collaborative knowledge generation and dissemination [
14]. Feng built a collaborative scheduling supply chain model [
15]. Vasquez-Urriago et al. analyzed how parks influence the results of firm cooperation and how this influence is channeled [
1]. Issues such as the rationale for R&D cooperation, informal contracts, alliance choices, and so on have also been discussed [
1,
16]. However, very few scholars have considered how the emergence of enterprise innovation cooperation can be sustained in an industrial park, especially from the perspective of dynamic enterprise behavior. In this paper, we address the following research questions: (1) How is an enterprise’s choice of strategy determined by its preferences and game income? (2) How do enterprise reciprocity and risk preferences influence the sustainable emergence of innovation cooperation in a park?
Various methodologies have been used to investigate mechanisms of cooperation among enterprises in parks, including regression [
1], social network analysis [
11], case studies [
17], and game models [
15]. These methods have shown promise. However, very few studies have considered the evolutionary game model on complex networks, which helps explain how the cooperation of group players can evolve in complex environments [
18]. This paper uses this evolutionary game model approach to analyze the dynamics of enterprise innovation cooperation. More specifically, it introduces some enterprise’s psychological preferences in to the evolutionary game model to show how they influence the sustainable emergence of cooperation in industrial parks. Individual enterprises as group players have abounded rationality, and their actions and decisions are often influenced by preferences, such as reciprocity and risk preferences [
19,
20]. In a cooperation network involving resource allocation, the influence of psychological preferences on enterprise decision-making is well established [
21,
22]. The choice of an enterprise’s cooperation strategy could be determined by these preferences and game interests combined, rather than by game interests alone. This paper brings enterprise reciprocity and risk preferences into an evolutionary game model and provides a more pragmatic explanation of the mechanisms by which enterprise cooperation emerges and is sustained.
This paper proposes a snowdrift game model on complex networks, where enterprises with different compositions of reciprocity and risk preferences are creatively introduced into the game model. The main contributions of this paper are three-fold. First, it delineates four types of enterprises according to their reciprocity and risk preferences, and it computes the game utility determined by an enterprise’s preferences and game benefit together based on the snowdrift game theory. By studying the strategy adjustment rule of enterprises, the paper characterizes the dynamics of enterprise cooperation behavior and provides a clearer understanding of the sustainable emergence of innovation cooperation activities in industrial parks. Second, the use of the simulation approach helps illustrate the dynamics of enterprise cooperation behavior in two types of industrial parks with heterogeneous network styles. There are often better interactions in the cooperative networks of mature industrial parks [
23,
24]. Different network structures can lead to different game strategy choices and, in turn, different game utilities from cooperative behavior [
23]. Thus, two different types of networks—“small-world networks” and “scale-free networks”—are used to simulate and explore the effects of network heterogeneity on enterprise cooperation when considering the reciprocity and risk preferences of the enterprises. A third contribution is that the findings improve the understanding of the sustainable development of enterprises in industrial parks. The study demonstrates the need for building reliable industrial park policies to facilitate sustainable cooperation of innovation in both types of parks studied.
This paper is organized as follows.
Section 2 presents some theoretical background. In
Section 3, a snowdrift game model on complex networks is used to analyze dynamic cooperation behaviors in consideration of the reciprocity and risk preferences of enterprises. In
Section 4, we provide numerical simulation results from small-world and scale-free network environments based on the two types of industrial parks. In
Section 5, we present conclusions and discuss some suggestions to assist park managers in taking action for the sustainable emergence of enterprise cooperation.
2. Theoretical Background
In order to study the evolutionary processes and characteristics of enterprise cooperation in a complex environment such as an industrial park, we use the evolutionary game theory on complex networks. Some scholars have used complex network theory to study the evolution of cooperation, combined with classical game models, such as the prisoner dilemma and snowdrift games [
18,
21]. These studies also considered cooperative behavior in small-world networks and scale-free networks. Hauert and Doebeli studied the evolution of cooperation in the snowdrift game in a small-world network [
25], and Santos et al. and Ma et al. examined the dynamics of cooperation in the snowdrift game in a scale-free network [
26,
27]. Goemz-Gardenes et al. and Szolnoki et al. analyzed the evolutionary dynamics of the prisoner dilemma game in a scale-free network [
18,
28]. Their studies highlighted the influence of spatial structure on individual behaviors and revealed the evolutionary mechanisms of cooperation behaviors in small-world and scale-free networks. Some of the mechanisms that can be used to promote cooperation were considered, such as self-adaptive aspiration, fairness preference-based utility, network reciprocity, and information sharing [
21,
28,
29,
30,
31]. Although the network perspective provides an approach to explaining how network cooperation can emerge in social systems, more work needs to be completed to uncover the effects of enterprise preferences on the dynamics of cooperation in social-economic systems, such as industrial parks.
Two important psychological preferences of an enterprise in innovation cooperation are reciprocity and risk preferences. Reciprocity preference, as a category of psychological motivation, was first brought into behavioral economics by Rabin [
19]. This preference refers to the tendency of people to reciprocate each other’s benevolent behavior and retaliate against hostile behavior, although this might incur a cost [
19]. Kolm pointed out that there are many reciprocal behaviors in human society that become the lubricant for people to form groups and societies [
32]. Many studies have proven that reciprocity preference is widespread [
33,
34,
35,
36,
37,
38,
39]. Reciprocity preference has been applied to game models and incorporated into the utility function to modify the “economic man” hypothesis [
40,
41]. Examples of such models include the ultimatum game, the trust game, the gift exchange game, as well as the public goods game [
35,
37]. Efforts to establish and improve reciprocity can help reduce opportunistic behavior and improve the cooperative performance of partner companies [
42,
43]. However, the existing literature on the evolution of enterprise cooperation behaviors has not adequately considered reciprocity preferences in game models on complex networks. Thus, it is necessary to examine how an enterprise’s reciprocity preference affects large-scale cooperation behaviors in a complex system.
Risk preference refers to a player’s tendency to choose a more or less risky option [
22]. Effects of player risk preference on cooperative behaviors have drawn attention among researchers. Tsay, Xiao and Yang, for instance, studied risk sensitivity in distribution channel partnerships. Both studies found that risk preferences could substantially influence the partners’ utility and determine the choice of collaborative strategy [
20,
44]. Li et al. showed that a migration mechanism based on risk preference was effective in promoting cooperation. This finding was suggested by results indicating that cooperation levels decreased relative to the increasing variance of risk preferences [
45]. Zeng et al. proposed an iterated prisoner dilemma game model, where agents seek to balance average payoffs against risks according to their risk attitudes [
46]. Sun et al. created an aspiration-based game model for interdependent networks considering resource allocation among risk-adverse players, and they highlighted an underlying mechanism of aspiration on cooperation [
21]. It has generally been assumed that each player with reciprocity would fully interact with their neighboring partners in cooperation. However, due to technical and market uncertainties of innovation, and uncertain factors in partnerships, when some companies engage in innovative activities, they often face a risky environment [
22]. Enterprises need to decide whether to interact more according to their evaluation of the innovation risk and cooperation risk in such an environment [
44]. For this reason, evolutionary game models should consider additional mechanisms, such as the possibility that an interaction might be determined by reciprocity and risk preferences, in addition to mechanisms that the interaction choice is determined by player’s payoff. By using the preference-based model in this way, the effect of enterprise behaviors on the dynamics of cooperation in an industrial park can be comprehensively examined.
4. Simulation and Comparison
This paper uses Matlab 8.3 to simulate the evolutionary process of cooperative behavior among enterprises based on the snowdrift game model on complex networks. Simulation results are analyzed and compared fortwo types of networks, the scale-free network and the small-world network, with changes in key variables, such as loss-to-profit ratio, enterprise preferences, and network characteristics.
4.1. Simulation of Cooperative Network Characteristics of Two Types of Parks
For the simulations, we set the network parameters on the basis of previous studies [
27,
51,
57] and following the cooperation network research of the two types of Chinese industrial parks [
23,
24]. One type of park, less mature, is coded as Park A. Examples of this type are the Danyang High-tech Park in Zhengjiang and the Nishui Technology Park in Nanjing. The other type of park, a mature park, is coded as Park B. Two examples in this case are the Shenzheng Technology Ecological Park and Shanghai Chuangzhi Park.
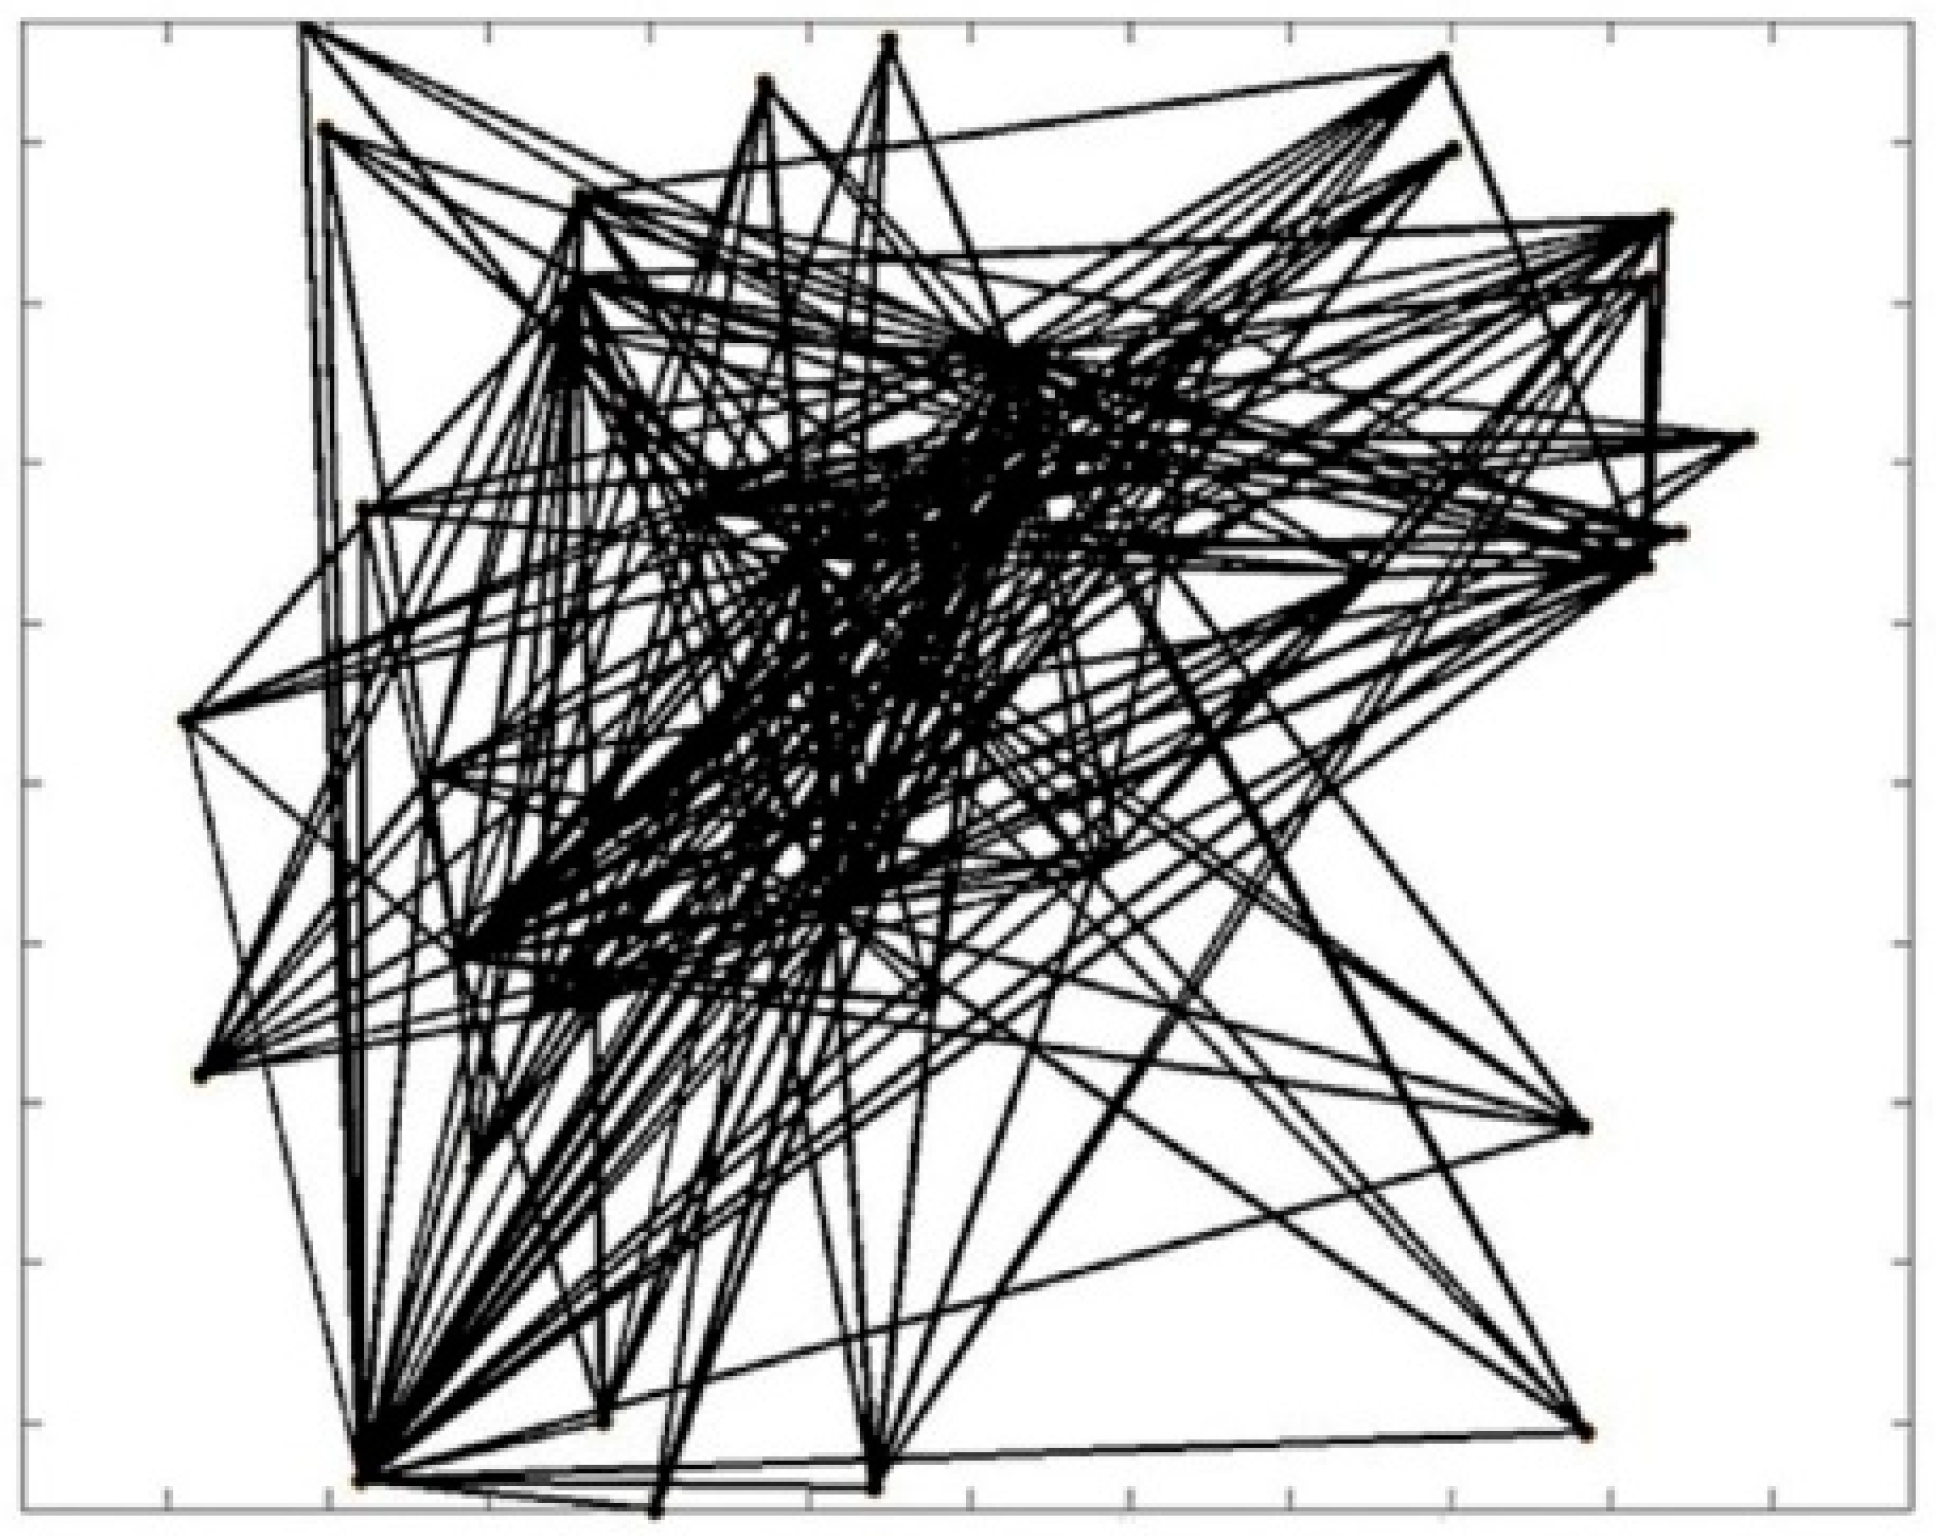
Figure 1 and
Figure 2 present the initial network structure of the cooperation networks in the two types of parks. Parameterizations for the network characteristics include the number of nodes
, average degree
, average path length
, and average clustering coefficient
. The lines between the dots indicate the cooperative relationship that exists among enterprises. The two network diagrams are consistent with the structural characteristics of the cooperation network that the two types of parks should have. Namely, small-world networks of Park B have smaller path lengths, higher network aggregation coefficients, and shorter cooperation paths among enterprises. In comparison, in the scale-free networks of Park A, the number of core nodes is relatively small, but core nodes have a large number of cooperative nodes, which means that core enterprises control most of the social resources in the network.
4.2. Simulation of the Sustainable Emergence of Enterprise Cooperation in Two Parks
Following prior studies [
19,
21,
22], the simulation specifies necessary parameters as such: if the enterprise is risk-averse and reciprocal, set
,
(Class 1); if the enterprise is risk-favored and reciprocal, set
,
(Class 2); if the enterprise is risk-favored and exclusive, set
,
(Class 3); if the enterprise is risk-averse and exclusive, set
,
(Class 4). At the initial stage, the strategy distribution of enterprises in the network is set as random, and the maximum evolutionary step size of the game is set as 500.
The rest of this section presents an in-depth analysis of the influence of preference combinations on the sustainable cooperation of innovation in the parks. First, it analyzes the evolution of the enterprise cooperation rate in park cooperation networks under the same preference combination but with different loss-to-profit ratios. Then, it analyzes the evolution of the enterprise cooperation rate under four different preference combinations, and the dynamics of the profit ratio of cooperation strategy to betrayal strategy and the emergence of betrayer under four different preference combinations.
4.2.1. Changes of the Cooperation Rate under Different Loss-to-Profit Ratios
The cooperation rate λ is an important index to measure emerging degrees of network cooperation [
57]. For cooperation rate
,
refers to the number of enterprises in the network that have adopted a cooperative strategy in a certain period, and
is the total number of enterprises in the network. In order to analyze the changes in the cooperation rate under different loss-to-profit ratios
, the preference combination of enterprises is set as risk-averse and reciprocal—that is, enterprises in Class 1.
Figure 3 and
Figure 4 present the values of the cooperation rate at different loss-to-profit ratios when enterprises are risk-averse and reciprocal.
Figure 3 and
Figure 4 show that the higher the loss-to-profit ratio, the stronger the motivation for enterprises to choose betrayal strategies, and, in turn, the lower the enterprise cooperation rate. At the same loss-to-profit ratio, in Park A with a scale-free network structure, the fluctuation of the enterprise cooperation rate is significantly greater than that in Park B with a small-world network structure. When the loss-to-profit ratio is low,
, the cooperation rate of enterprises in Park A rises to about 0.8, and the cooperation rate of enterprises in Park B becomes higher and more stable. When the loss-to-profit ratio is at a high level (e.g.,
), the cooperation rate of enterprises in Park A fluctuates and decreases rapidly, while the cooperation rate of enterprises in Park B shows a steadily decreasing trend.
From the simulation results of the two parks with different network structures, we can conclude that as the loss-to-profit ratio increases, the cooperation rate will decrease under the same preference combination, which means more enterprises will choose to betray. In Park B, the cooperation rate is more sensitive to the profit-to-loss ratio changes. The changing trend of the cooperation rate at different levels of the loss-to-profit ratio provides useful insight in to the dynamics of cooperation behaviors.
This analysis of changing trends in cooperation rates has assumed the companies’ preference is the combination of risk aversion and reciprocity. To gain a proper understanding of the effects of the preferences on the cooperation rate, all four preference combinations need to be analyzed with the value of loss-to-profit ratio parameter set at a low level. The analysis in the next subsections limit the loss-to-profit ratio to a low value of 0.3, considering the value of the cooperation rate is not close to 0 even when the value of loss-to-profit ratio is low.
4.2.2. Changes of the Cooperation Rate under Different Preference Combinations
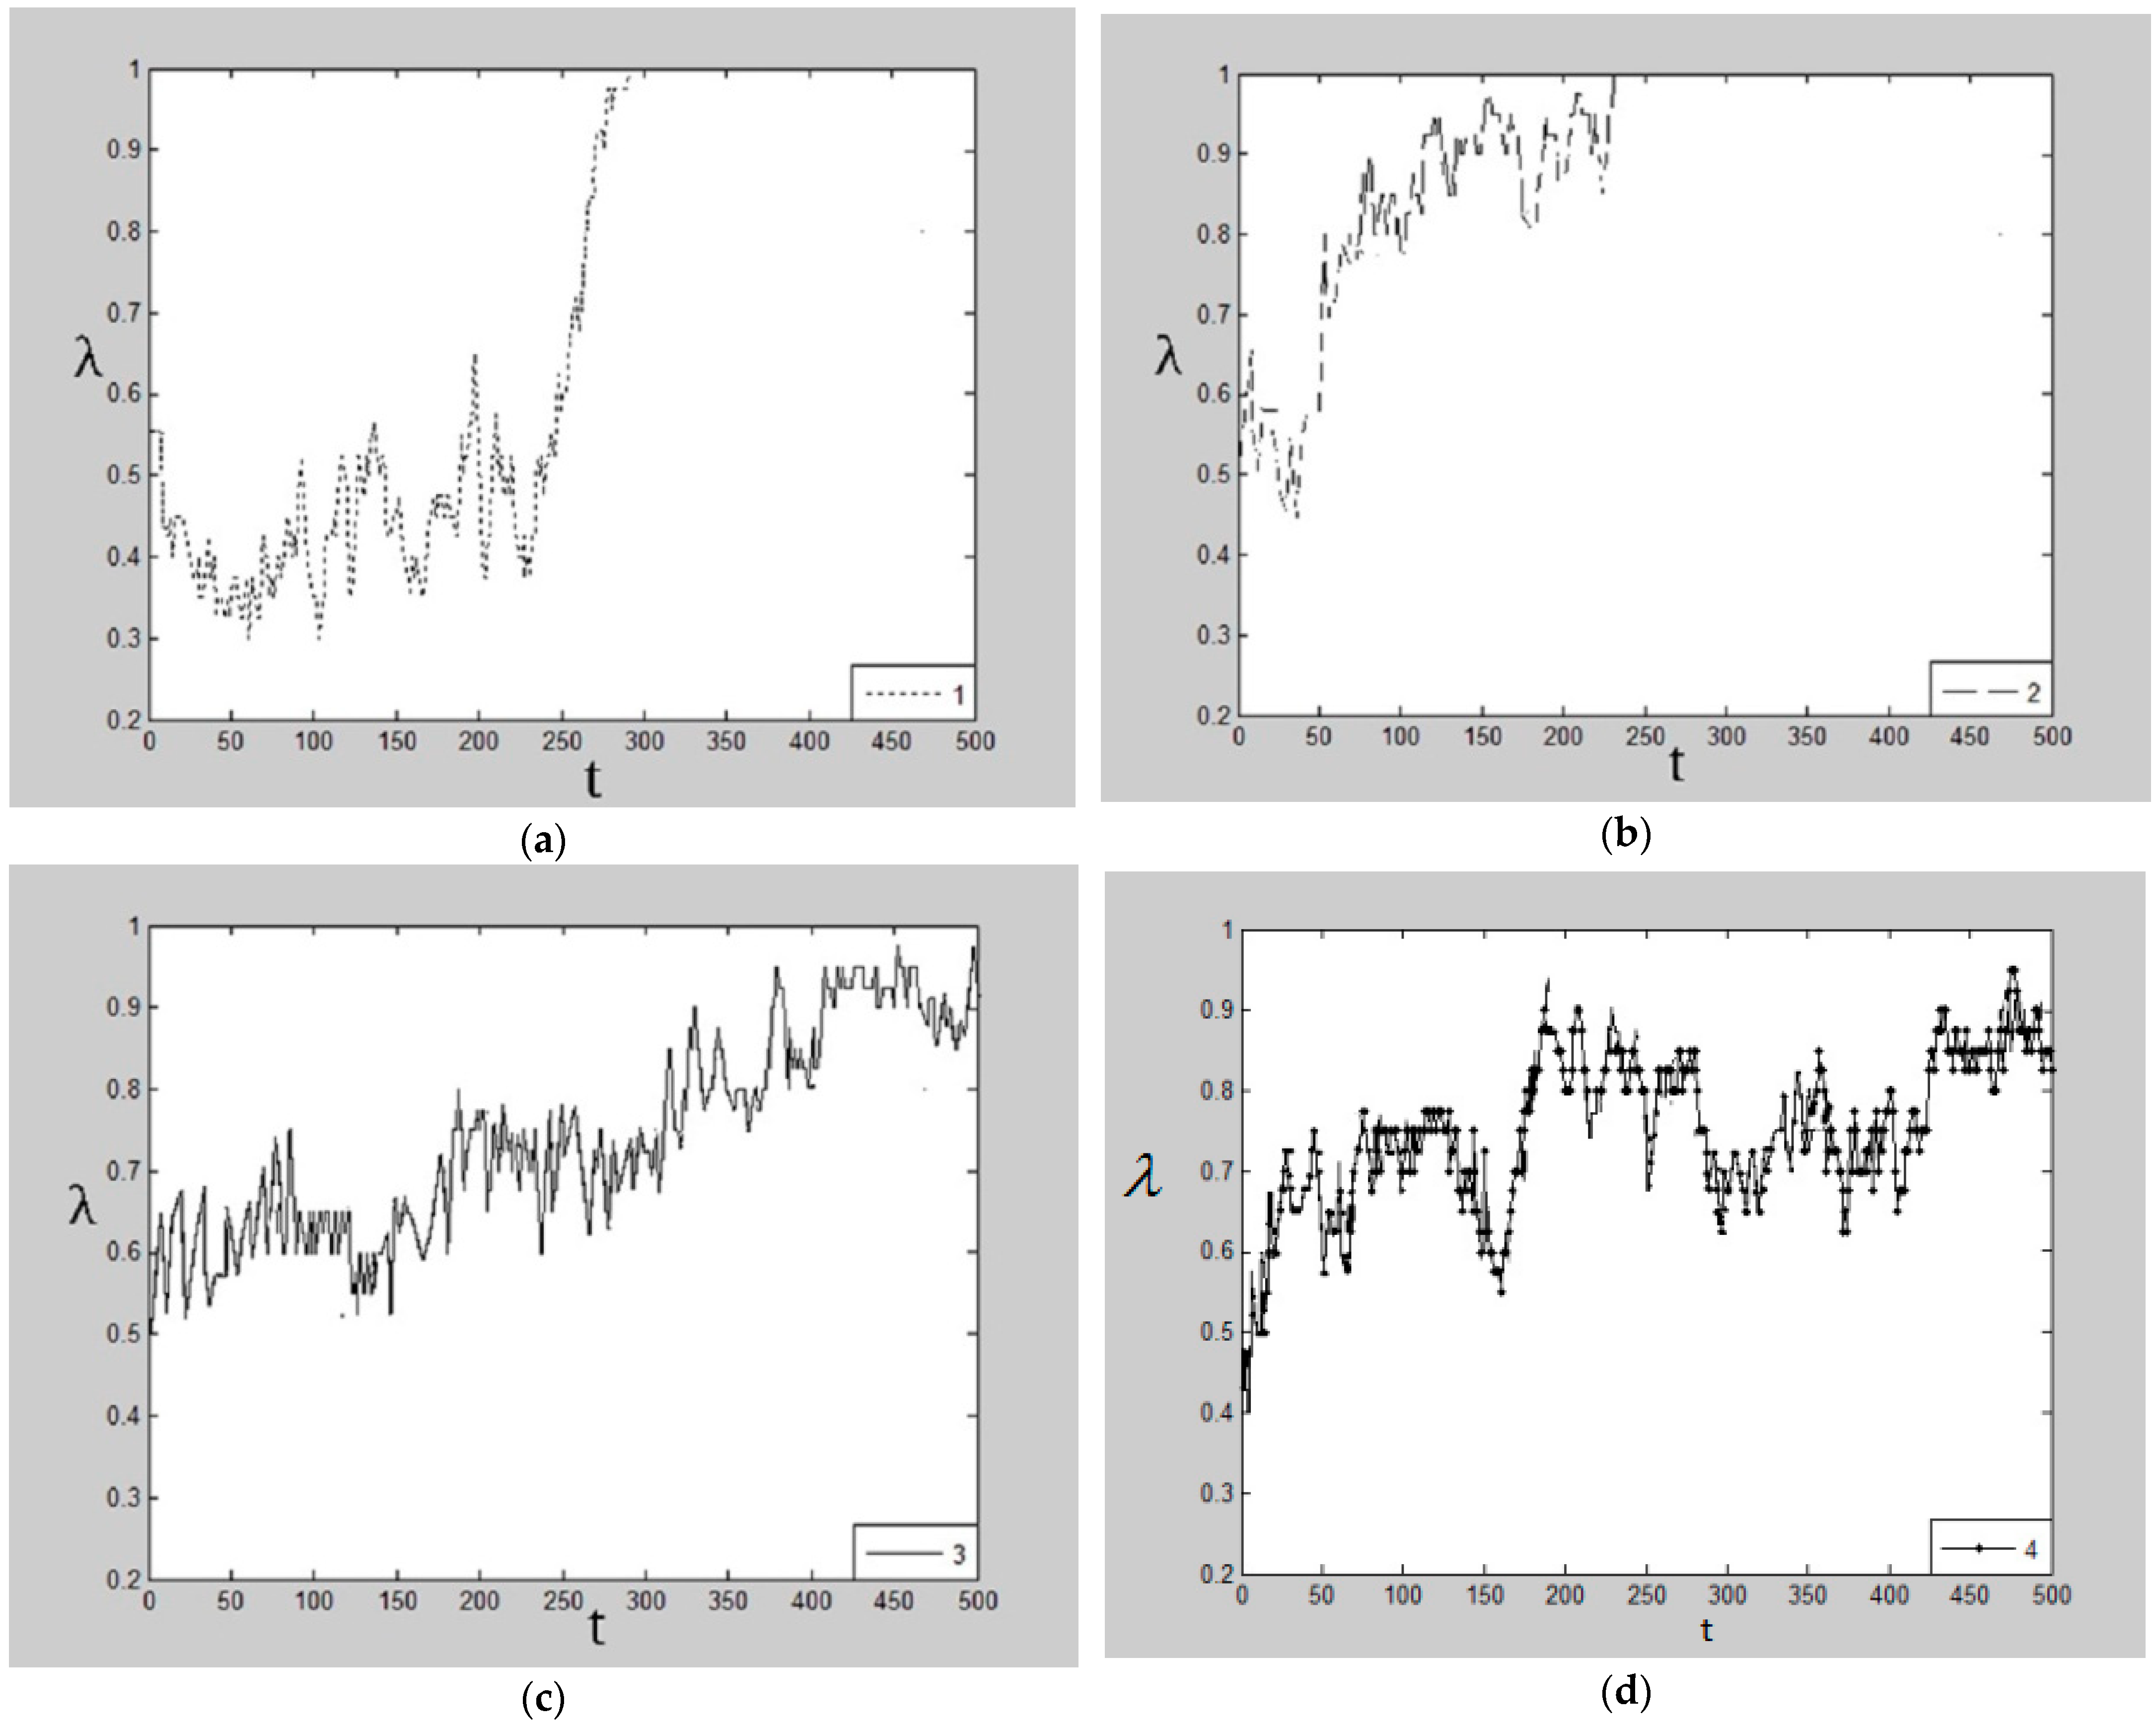
This sub section analyzes the evolution of the cooperation rate under the four risk and reciprocity preference combinations in the two parks. The simulation results are shown in
Figure 5a–d and
Figure 6a–d. According to the results in
Section 4.2.1, the loss-to-profit ratio
is set to a fixed value of 0.3.
As we can see from
Figure 5, in Park A with a scale-free network structure, the cooperation rate in each case stabilizes as it trends upwards approaching 1 for three preference combinations, namely Class 1, Class 2, and Class 3. If the cooperation rate converges to 1, it means that all companies in the network will adopt a cooperative strategy, and cooperative behavior will predominate throughout the network. Compared with the other three combinations, when the enterprise prefers reciprocity and risk, the speed to converge to the cooperation rate 1 is the fastest.
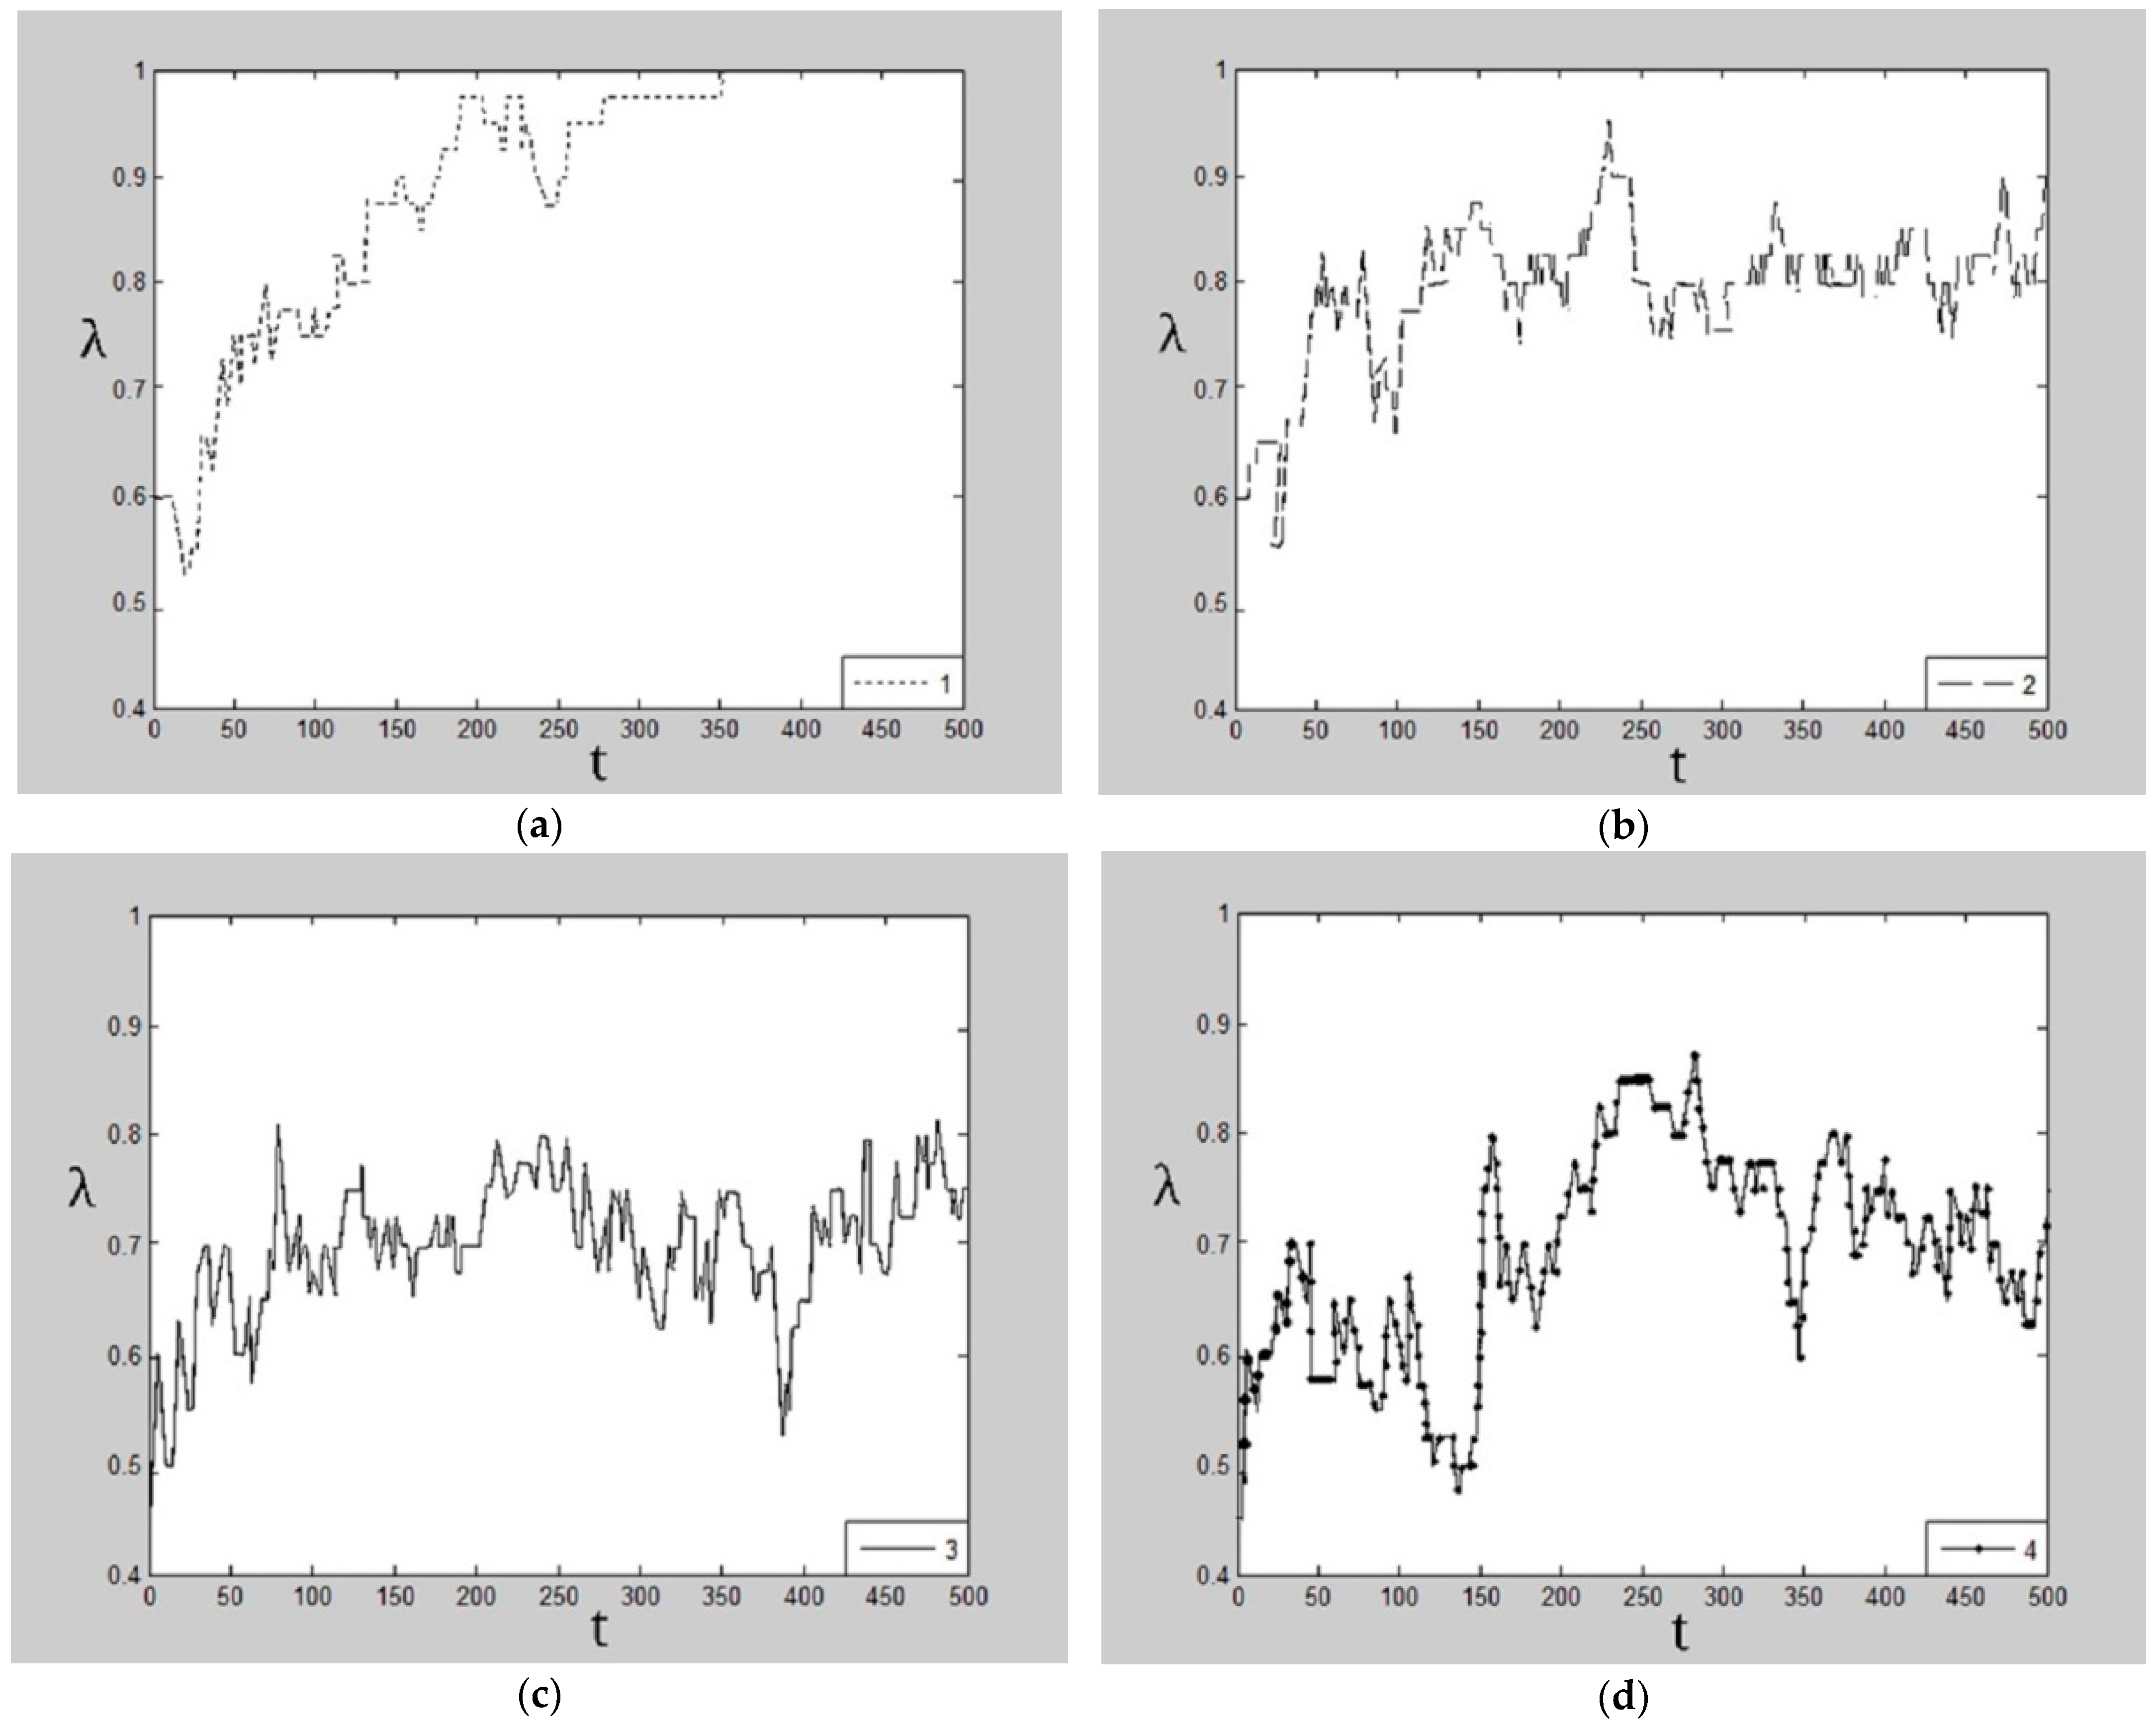
As we can see from
Figure 6, in Park B, the cooperation rate has a tendency to converge to 1 under the combination of Class 1. When the enterprise is risk-averse and reciprocal, compared with the other three combinations, the rising trend of the enterprise cooperation rate is most obvious. The simulation results of
Figure 5 and
Figure 6 therefore demonstrate that, regardless of the network style, when enterprises in the park are risk-averse but exclusive to one another, the overall cooperation rate of the park rises slowly and the level of cooperation is the lowest, which is not beneficial to the sustainable emergence of enterprise cooperation. It is clear, in two styles of networks, that when enterprises are reciprocal and risk-averse, the cooperation rate can stabilize.
Figure 5 and
Figure 6 show that the reciprocity and risk preferences of enterprises largely affect the cooperation rate in the network.
Under the preference combination of reciprocity and risk aversion, the cooperation rate of the two parks is good. This shows that a reciprocal preference plays a positive role in the emergence of cooperation, while the risk aversion preference can enhance this positive effect. Enterprises with reciprocity tend to pursue their own interests in cooperation, and also tolerate partner enterprises profiting from the cooperation. This is the enterprise’s smart understanding of the long-term return expectations in the process of the ongoing game, and they know that “reciprocity can last” [
33]. Because enterprises seek cooperation to avoid the high loss of innovation risks, risk-averse enterprises have stronger expectations for maintaining a cooperative relationship than risk-favored enterprises, and it is also easier for risk-averse enterprises to tolerate partners benefitting from the arrangement. Therefore, risk aversion will enhance the role of reciprocity on sustainable cooperation.
It is also worth noting that the combination of enterprise preferences that is most conducive to the sustainable cooperation of innovation is different in the two types of parks. In Park B, the performance of the cooperation rate is always the best under the combination of risk aversion and reciprocity. At the beginning of Park A, however, the performance of the cooperation rate under the preference combination of risk aversion and reciprocity is not as good as that of risk-favored and reciprocity.
The development of the innovation network in Park A is immature. The characteristics of a scale-free network show that the network status of enterprises in the park is not equal, and there are few core enterprises with resource advantages. Nonetheless, these core enterprises have a large number of connections and great network power [
13,
56]. Enterprises with weak resources usually have more contacts with stronger enterprises, and when they cooperate with stronger enterprises, they assume a greater relationship risk. At the beginning, the risk-averse enterprises in Park A have expectations that the cooperative relationship will enable them to share innovation losses, but they are also sensitive to the risk of cooperative relationships [
46]. Risk-averse enterprises will take a wait-and-see attitude towards cooperation. As the game progresses, the psychology of reciprocity plays an increasingly leading role, which enhances the overall enterprise’s expectation of a win–win situation and long-term income, weakening the enterprise’s sensitivity to cooperative risk. Research on the mechanisms of reciprocity provides verification of the findings of this paper [
33,
34,
38,
43]. In contrast to Park A, the development of the innovation network in Park B is relatively mature. According to the characteristics of small-world networks, the degree of network aggregation is high, and the difference in network power is small. The gap between enterprises in terms of resources and status is small [
24,
56]. Enterprises are less sensitive to the risk of partnerships. Therefore, the cooperation rate of Park B is not the same as that of Park A. Thus, when most of the enterprises are reciprocal and risk-averse, the overall cooperation rate of the park is higher. The results of the two parks also show that as the game continues, a preference for reciprocity plays a greater role in sustainable cooperation than the preference for risk.
4.2.3. Effect of Loss-to-Profit Ratio on the Cooperation Rate under Different Preference Combinations
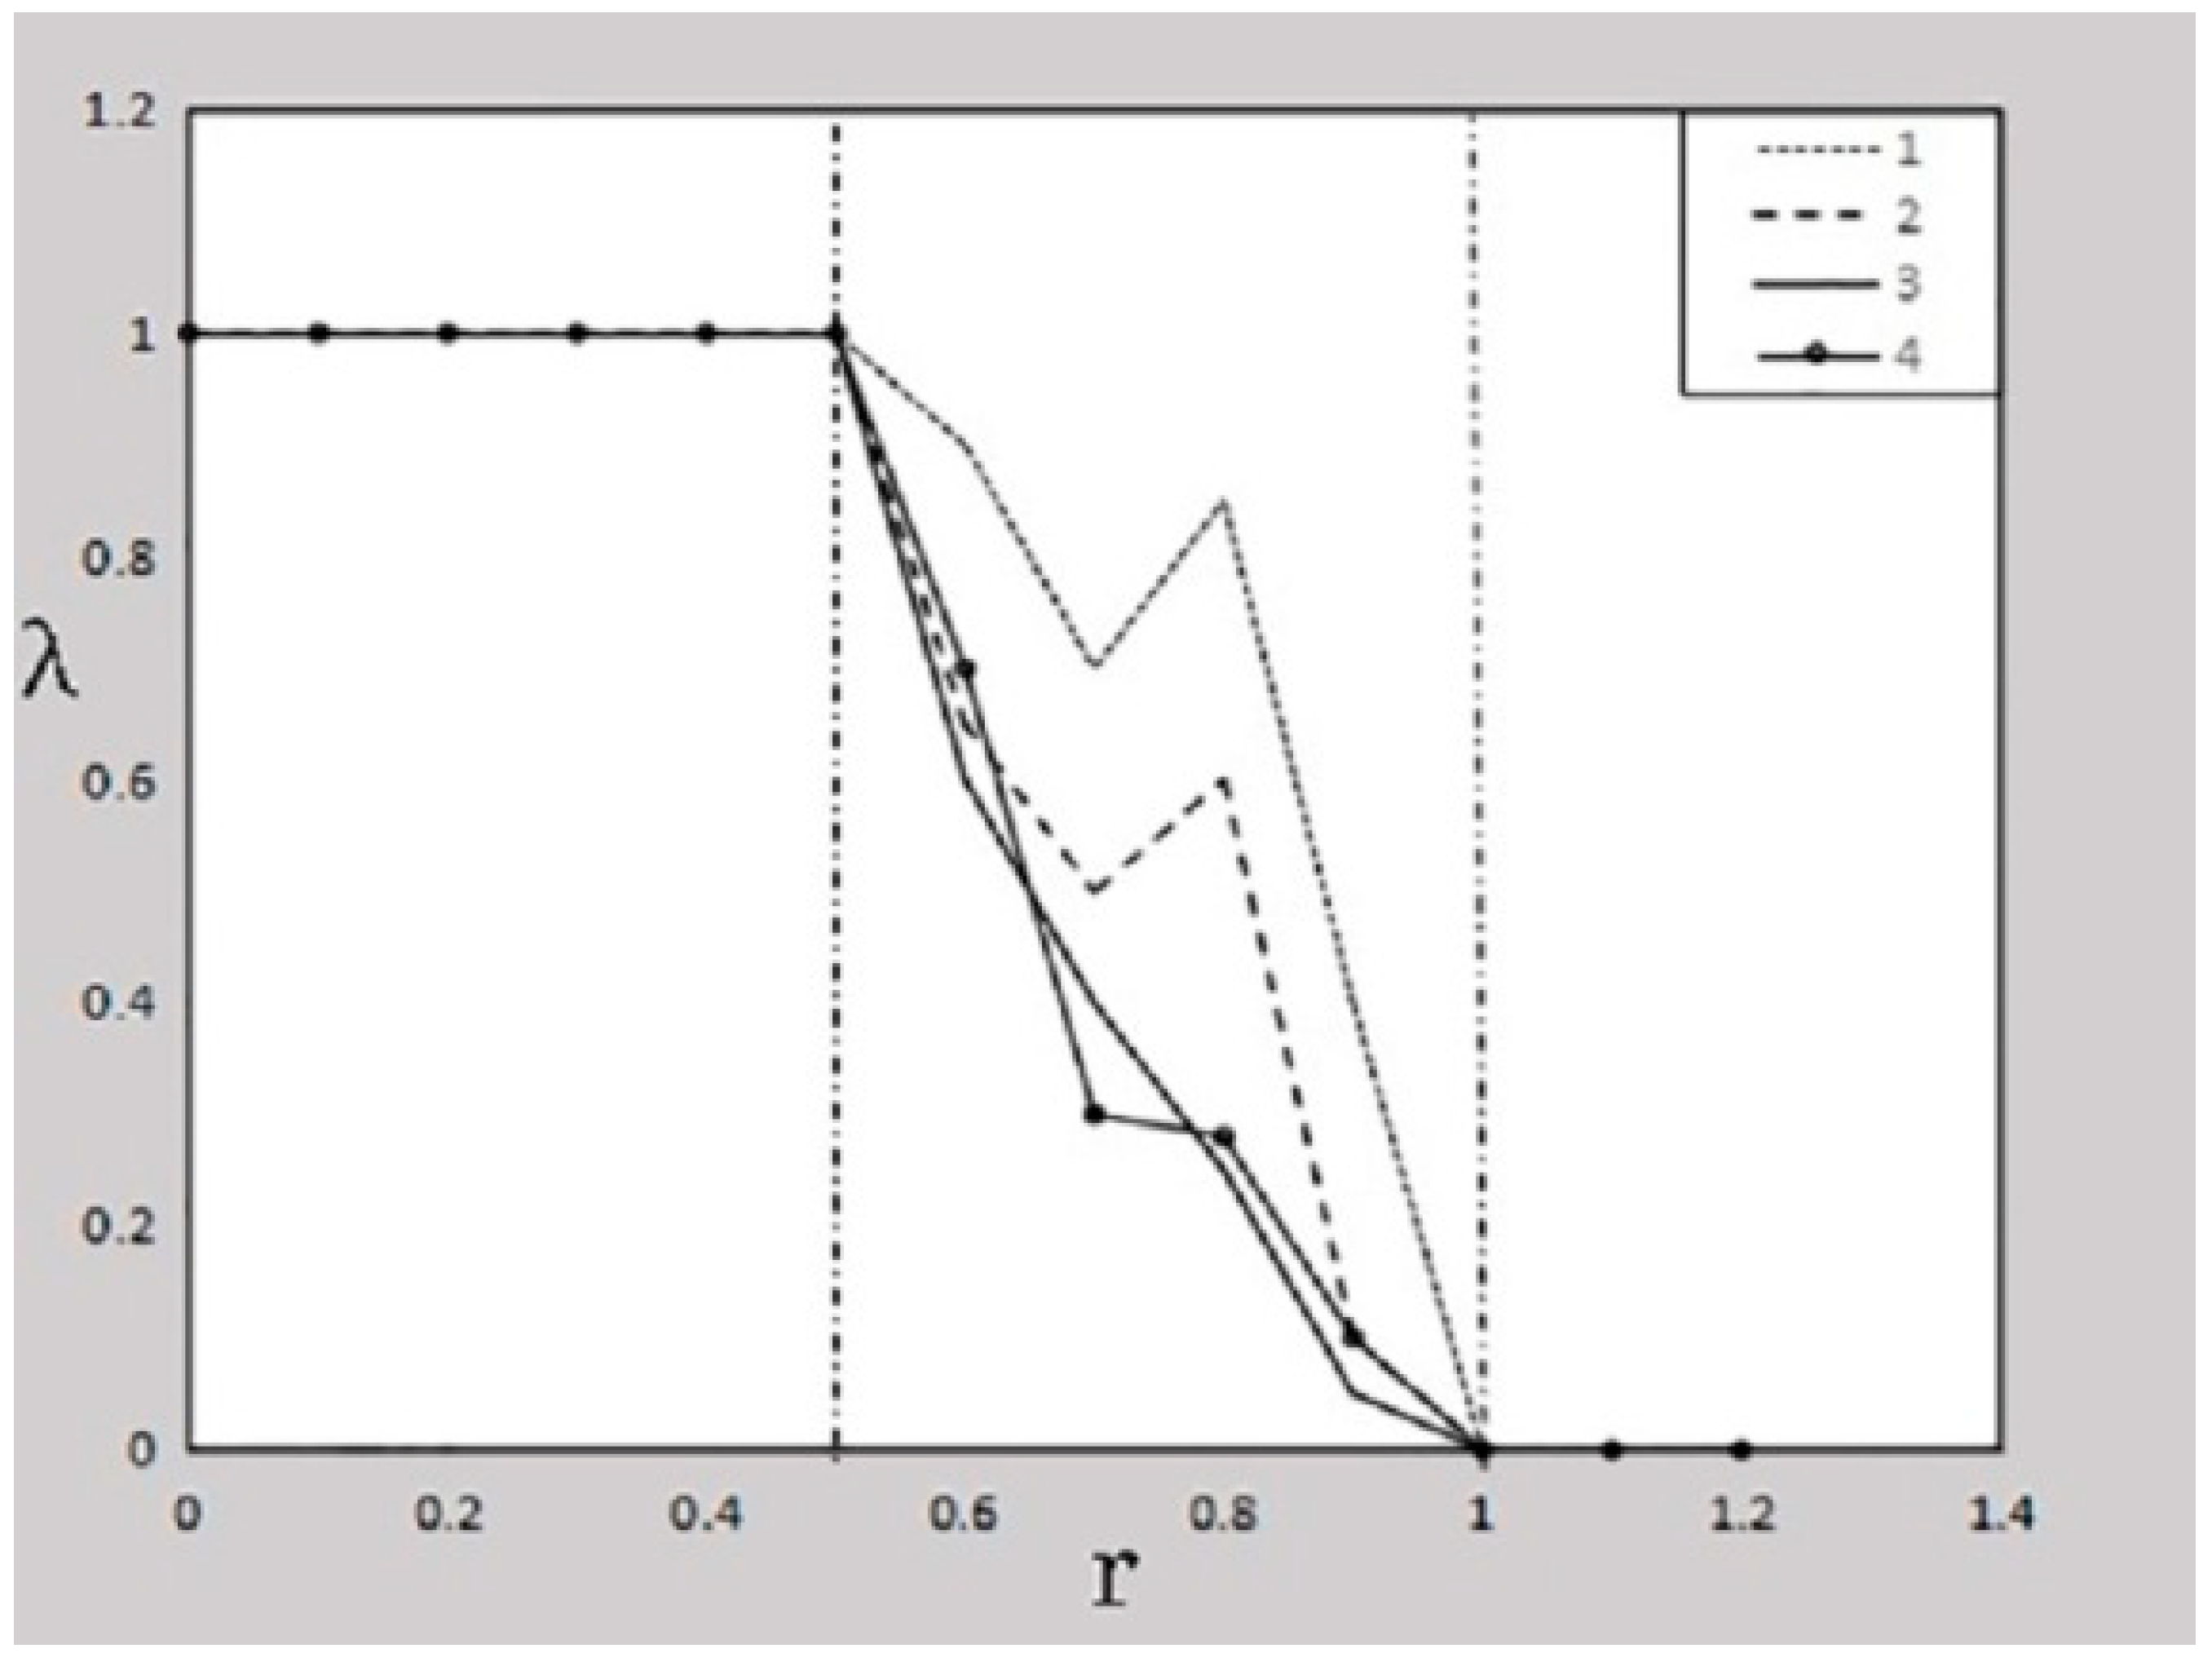
Thresholds fora betrayer to appear under different preference combinations in Park A and Park B are analyzed. The results are shown in
Figure 7 and
Figure 8.
Figure 7 and
Figure 8 show that the loss-to-profit ratio of cooperation in the network game plays an important role in the emergence and disappearance of cooperation in networks. When the cooperative loss-to-profit ratio of the game exceeds 1—that is, when the costs and benefits of cooperation are equal—the cooperative behavior in the network will completely disappear for all enterprises, who will then choose a strategy of betrayal. In Park A, when the cooperative loss-to-profit ratio is greater than 0.6, the betrayer begins to appear in the network under the four different preference combinations. However, at the same time, the influence of the preference combination type on the emergence of cooperative behavior is different. The same thing happens in Park B, except that the loss-to-profit ratio threshold for betrayal is lower than in Park A, where the threshold is 0.5. This indicates that the influence of preference combinations on the emergence of cooperative behaviors in the two parks is constrained by the loss-to-profit ratio of enterprise game cooperation, and the effect of this constraint is particularly significant in the park with a small-world network style. The threshold for the betrayer to appear in Park B is lower than that in Park A, which shows that some enterprises in small-world networks are more sensitive to revenue and can turn to betrayal more easily.
In summary, the type of preference combination has an effect on the sustainable emergence of enterprise cooperation under the constraints of the loss-to-profit ratio of enterprise cooperation and network style. In Park A, the preference combination of risk-favored and reciprocity is more conducive to promoting the emergence of network cooperative behavior. In Park B, the preference combination of risk-averse and reciprocity is more advantageous to promoting the emergence of cooperative behavior.
4.2.4. Dynamics of the Ratio of Cooperation Revenue to Betrayal Revenue
Figure 9 and
Figure 10 show the changing ratio of the revenue of cooperation to the revenue of betrayal under the four preference combinations in Park A and Park B.
refers to the total revenue of the enterprises choosing the cooperative strategy divided by the total revenue of the enterprises choosing the betrayal strategy after every round of the game. A high
means that even if there are few collaborators, they may influence the betrayal group players to adopt a strategy of cooperation. Such a situation is conducive to the evolution of the group strategy towards cooperation. As we can see from
Figure 9 and
Figure 10, when an enterprise is risk-averse and reciprocal, the ratio
on the two styles of networks shows a rising trend. However, if in the shorter period, when the enterprise is risk-favored and has a reciprocal preference, the ratio
will have a better performance in Park A. In addition, when the preference combinations of enterprises are two types that include a reciprocal preference, the evolving performance of the ratio of cooperation revenue to betrayal revenue will obviously be higher than when the enterprise preference combinations are the other two types in Park A and Park B. This shows that the preference combinations that involve risk aversion and reciprocity can encourage enterprises to adopt cooperation strategies one after another to obtain greater benefits in two styles of networks. It also shows that reciprocal psychology has a stronger influence in encouraging sustainable cooperation than risk preference in two styles of networks.
Therefore, enterprises with preferences for risk aversion and reciprocity are easier to build a partnership with and can obtain greater profit through the cooperation. The possible reasons have been discussed in the context of the simulation results of the cooperation rate under the four combinations. So, from a long-term perspective, an enterprise’s risk aversion preference is conducive to the sustainable emergence of cooperation in two styles of networks, which is consistent with the viewpoint of Zeng et al. [
46] that the enterprise’s aversion to cooperative risk will be adjusted according to its payoff and aspiration in the continuing game. Additionally, it is consistent with the viewpoint of Raub and Snijders [
58] that risk aversion can enhance the tendency to cooperate.
At the same time, an enterprise’s reciprocal preference might play a more important role in encouraging innovation cooperation than an enterprise’s risk preference. This is consistent with the simulation results of
Figure 5 and
Figure 6. As the game progresses, when an enterprise prefers reciprocity, it is easy to form a group culture. This kind of group culture will strengthen the cooperative tendency of enterprises as the game continues, weakening the perception of risk in innovation or cooperation and promoting the emergence of cooperative behavior in the network through the cumulative effect and diffusion process of the network [
54,
56]. As one can find in parks such as Shanghai Zhangjiang Hi-Tech, there is a strong cooperation atmosphere, and most of the enterprises there also have a high awareness of risk avoidance. Other research provides strong support for the results of this subsection [
53,
54].
4.3. Simulation of Network Characteristics and the Sustainable Emergence of Enterprise Cooperation
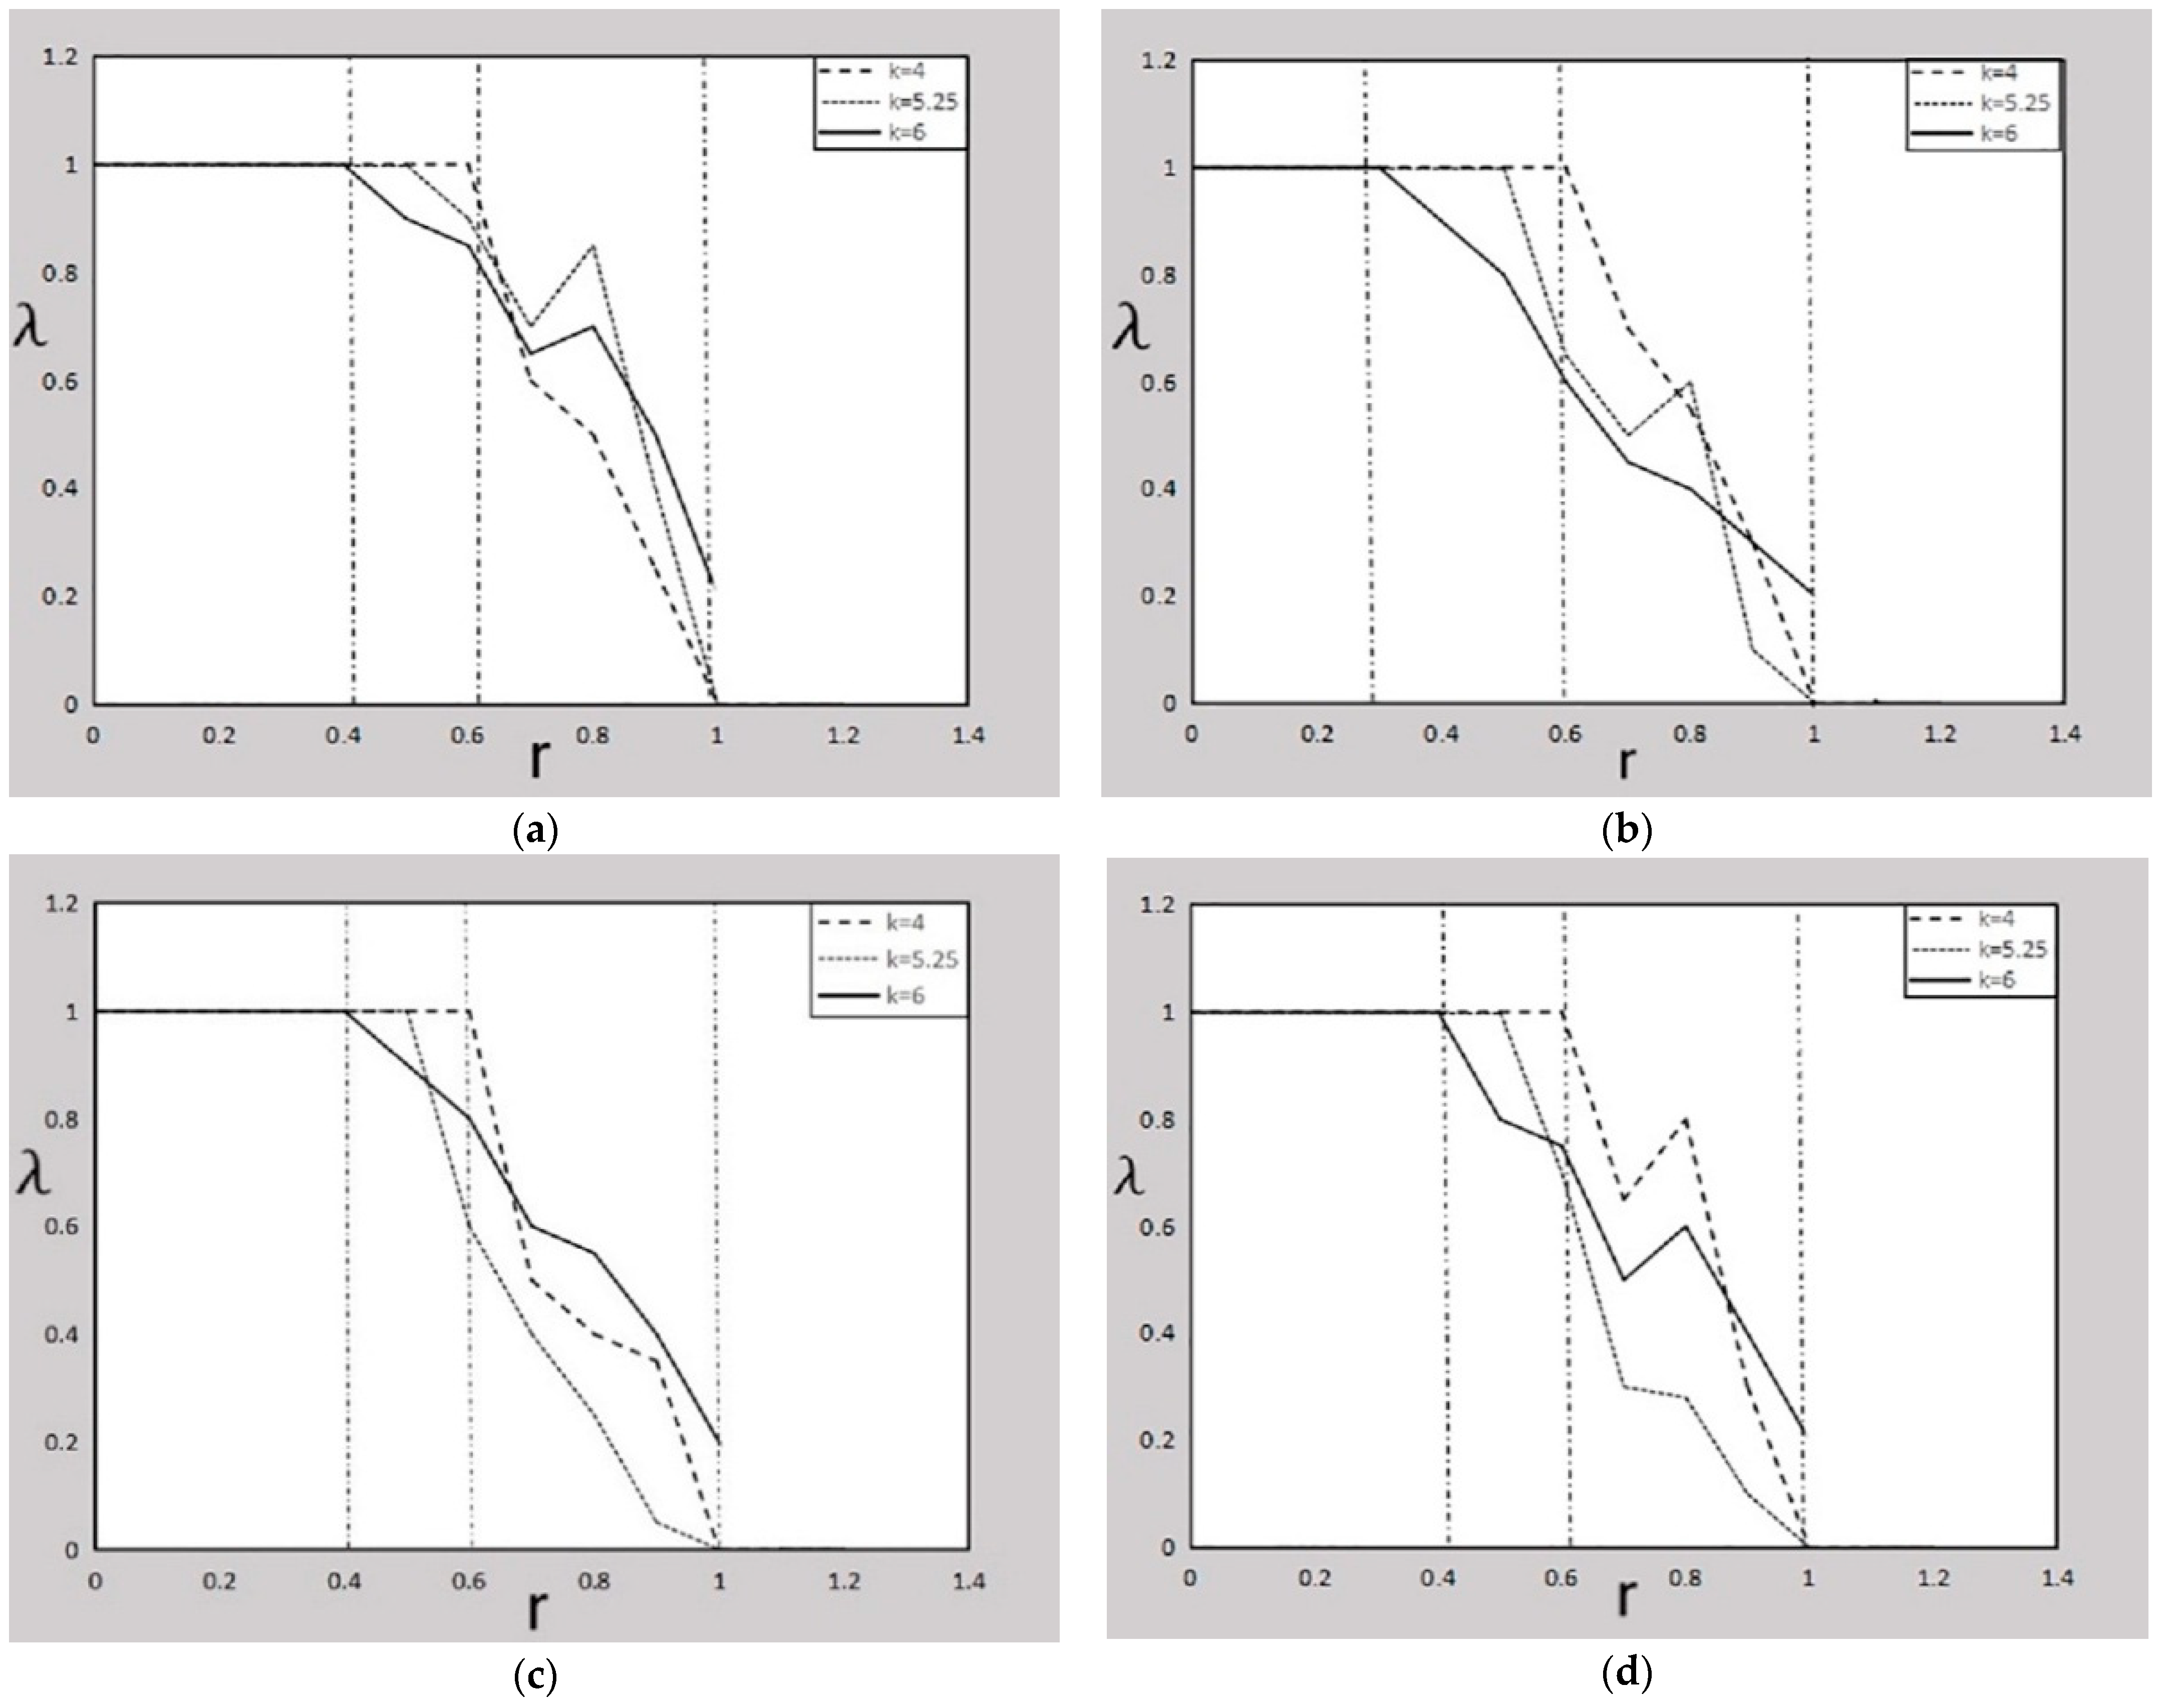
A cooperation network structure is characterized by the average degree, average path length, and average agglomeration coefficient of the network. The network average represents the average number of cooperative partners of each enterprise, which reflects the distribution characteristics of cooperative relationships in the network. Since each firm in the network plays games with its partners, the number of partners will directly affect the game utility and decision of the firm, so the network structure with different average degrees will affect the evolving process of the cooperative game of the firm, and ultimately it will affect the emergence of cooperation in the network. In order to analyze the influence of network structure on the sustainable emergence of cooperation in the park, in this subsection we will simulate the threshold where collaboration disappears in the innovation cooperation of the park under different network average degrees.
Figure 11a–d respectively, represents the evolving process of the cooperation rate under four enterprise preference combinations and different network average degrees in Park A. Parameterization:
,
,
when
. Additionally,
Figure 12a–d respectively, represents the evolving process of the cooperation rate under four enterprise preference combinations and different network average degrees in Park B. Parameterization
,
,
when
.
From
Figure 11a–d and
Figure 12a–d, we can see that preference combinations, network styles, and network average degree characteristics jointly affect the threshold of the loss-to-profit ratio that leads to the appearance of a betrayer and the disappearance of a collaborator in the network. As the average degree of the network increases, the threshold of the loss-to-profit ratio that leads to the appearance of a betrayer decreases. When the network average degree increases to a certain value, even if the betrayal coefficient is 1, no matter the preference combination, there is no longer a situation in which the collaborator disappears in the network. This indicates that even if there are defectors, the increase in the number of each enterprise partner will induce more enterprises to join the cooperation and ultimately improve the sustainability of cooperation in the network.
In Park A, when the enterprise is risk averse and prefers reciprocity, and the network average degree increases to 5, the loss-to-profit ratio threshold for the appearance of betrayer is the lowest, but at this time, even if the temptation coefficient of betrayal is 1, the collaborators in the network will not disappear. In Park B, when the enterprise favors risk and reciprocity, and the network average degree increases to 6, the loss-to-profit ratio threshold for the appearance of betrayer is the lowest, but in this case, even if the temptation coefficient of betrayal is 1, the collaborators in the network will not disappear. This shows that in a scale-free network park, the appearance of a betrayer is more sensitive to changes in the network average degree. However, the increase in the number of corporate partners will promote the sustainable cooperation behavior in the network, which is more significant in the park with the small-world network style. In Park B, the number of partners of each enterprise is large enough, and the enterprise prefers risk and reciprocity, which is more conducive to maintaining the sustainable emergence of cooperation. This is not the case in Park A. It is more helpful to maintain the sustainable emergence of cooperation when an enterprise is risk averse and reciprocal.
5. Conclusions
Based on the snowdrift game model, which incorporated the reciprocity and risk preference theory, this paper has considered different combinations of reciprocity and risk preferences in enterprises, and it has used the complex network method to analyze the dynamics of enterprise cooperation behaviors in two types of industrial parks with different network styles. It has shown that the emergence of enterprise cooperation is jointly affected by an enterprise’s reciprocity, risk preference, loss-to-profit ratio, network style, and network average degree.
5.1. Key Findings
The results of the simulation have indicated that the reciprocity and risk preference of an enterprise have an obvious influence on the sustainable emergence of innovation cooperation in two types of parks. From a long-term perspective, compared with the three other preference combinations, the combination of risk-aversion and reciprocity has a more significant influence on the cooperation rate and the ratio of cooperation revenue to betrayal revenue. This advantage is more prominent in the mature industrial park. When more and more enterprises in a cooperative network are reciprocal, a reciprocal culture is more likely to build. This group culture will enhance the cooperative tendency of enterprises. Then, a large number of cooperative behaviors emerge. Therefore, enterprise preferences for risk aversion and reciprocity have a positive impact on the sustainable emergence of cooperation in both mature and less-mature industrial parks. However, from a short-term perspective, the preference combination of favoring risk and reciprocity is helpful for the emergence of cooperation in less-mature industrial parks.
The reciprocal preference of an enterprise has a greater impact on the cooperation rate and ratio of cooperation revenue to betrayal revenue than risk preference has in two types of parks. Additionally, this advantage is more prominent in Park A. Therefore, in mature and less-mature industrial parks, enterprise reciprocity has a greater impact on the sustainable emergence of enterprise cooperation than risk preference. Nurturing a reciprocal culture in enterprise groups has become an important measure to achieve sustainable cooperation in the parks.
The influence of enterprise preference combinations on the dynamics of cooperative behavior is constrained by the loss-to-profit ratio of cooperation games and network style. The higher the loss-to-profit ratio, the easier it is for betrayers to appear, and the easier it is for collaborators to disappear. The threshold ratio for betrayers to appearing Park B is lower than that in Park A, which can be explained by the fact that enterprises in mature parks are more sensitive to revenues.
Across the four preference combinations, the higher the network average degree, the more conducive the preference is to the sustainable emergence of innovation cooperation, which shows a more significant effecting small-world network parks. This means that in order to foster the positive role of enterprise preferences in the sustainable cooperation of innovation activities, it is necessary to increase the number of potential corporate partners. Enterprises in the park should be encouraged to form extensive connections.
5.2. Management Implications
This paper has shown that, from a long-term perspective, an enterprise’s risk aversion and reciprocity, cooperation loss-to-profit ratio, and extensive establishment of cooperative relations have important impacts on the sustainable cooperation of innovation in two types of Chinese industrial parks. These results provide useful insights about how to promote the sustainable cooperation of innovation activities in complex social-economic networks, which has great policy implications for the sustainable development of enterprises and parks.
The term “sustainable development” has a strong focus on social-economic development and the opening of new markets [
59]. In order to achieve the goal of sustainable development for enterprises and parks, park managers need to take measures to promote the sustainable emergence of enterprise cooperation in the network. Group culture should be established in mature and immature parks to promote reciprocity of network members and restrain the exclusiveness of enterprises. For example, increasing industrial chain closeness and a proper industrial clustering planning can be used by managers of parks to suppress the exclusive psychology of enterprises and to encourage a reciprocal psychology, eventually leading to mutually beneficial cooperation.
In addition, managers of both types of parks can guide enterprises to establish a wide range of enterprise connections and increase the network average degrees. On the one hand, managers can exert pressures on enterprises by stricter enforcement of national technical regulations, “pushing” enterprises to cooperate for better solutions and more resources allocated to innovation. For example, managers can impose harsher economic penalties on enterprises that fail to implement national technical regulations appropriately. On the other hand, managers can provide a favorable environment for cooperation by improving platforms for cooperative innovation and offering more support programs, “pulling” the participation of more enterprise partners.
In addition to the above measures, park managers can support the development of several leading enterprises in a park—particularly in an immature park—and let them play an exemplary role, encouraging them to establish extensive cooperative relations with other enterprises through policies such as R&D funding and other financial assistance. At the same time, it is vital to use the network influence of these enterprises to restrain the exclusive psychology in enterprises and foster a reciprocal culture in enterprise groups.
Several policy implications for improving the sustainable emergence of cooperation have been identified. First, it is recommended to develop strict national technology regulations or policies for forcing enterprises to consider better solutions in innovation practices, which will guide greater innovative cooperation among enterprises. For example, higher quota standards for new energy vehicles, stricter green regulations and a more perfect new generation of ICT standards should be a part of the revision of public policies. Second, national industrial park policies should emphasize performance management, including indexes of green or technology innovation, the extent of enterprise cooperation, the persistence of cooperation, and other indicators. It is helpful to incentive the park management to supervise and urge enterprises.
5.3. Future Research
This study has only focused on the influence of enterprise reciprocity and risk preference on the dynamics of innovation cooperation in networks. There can be co-evolutionary relationships between network structure and cooperative behaviors in a cooperative game. In future, researchers may consider more specific factors of network structures, such as centrality and inter-firm power gaps, and they may examine the possible impacts of these factors on the sustainable emergence of innovation cooperation. Although the methods of network games and simulations can reveal the diversity and complexity of enterprise behavior and are insightful in analyzing the continuous emergence of cooperation, future studies can adopt case studies or econometric methods to conduct empirical analyses to investigate the impacts of reciprocity and risk preferences on the evolution of innovation cooperation.


