
A Public Bad Game Method to Study Dynamics in Socio-Ecological Systems (Part II): Results of Testing Musa-Game in Rwanda and Adding Emergence and Spatiality to the Analysis

 ,
,
Abstract
:1. Introduction
2. Theoretical Framework
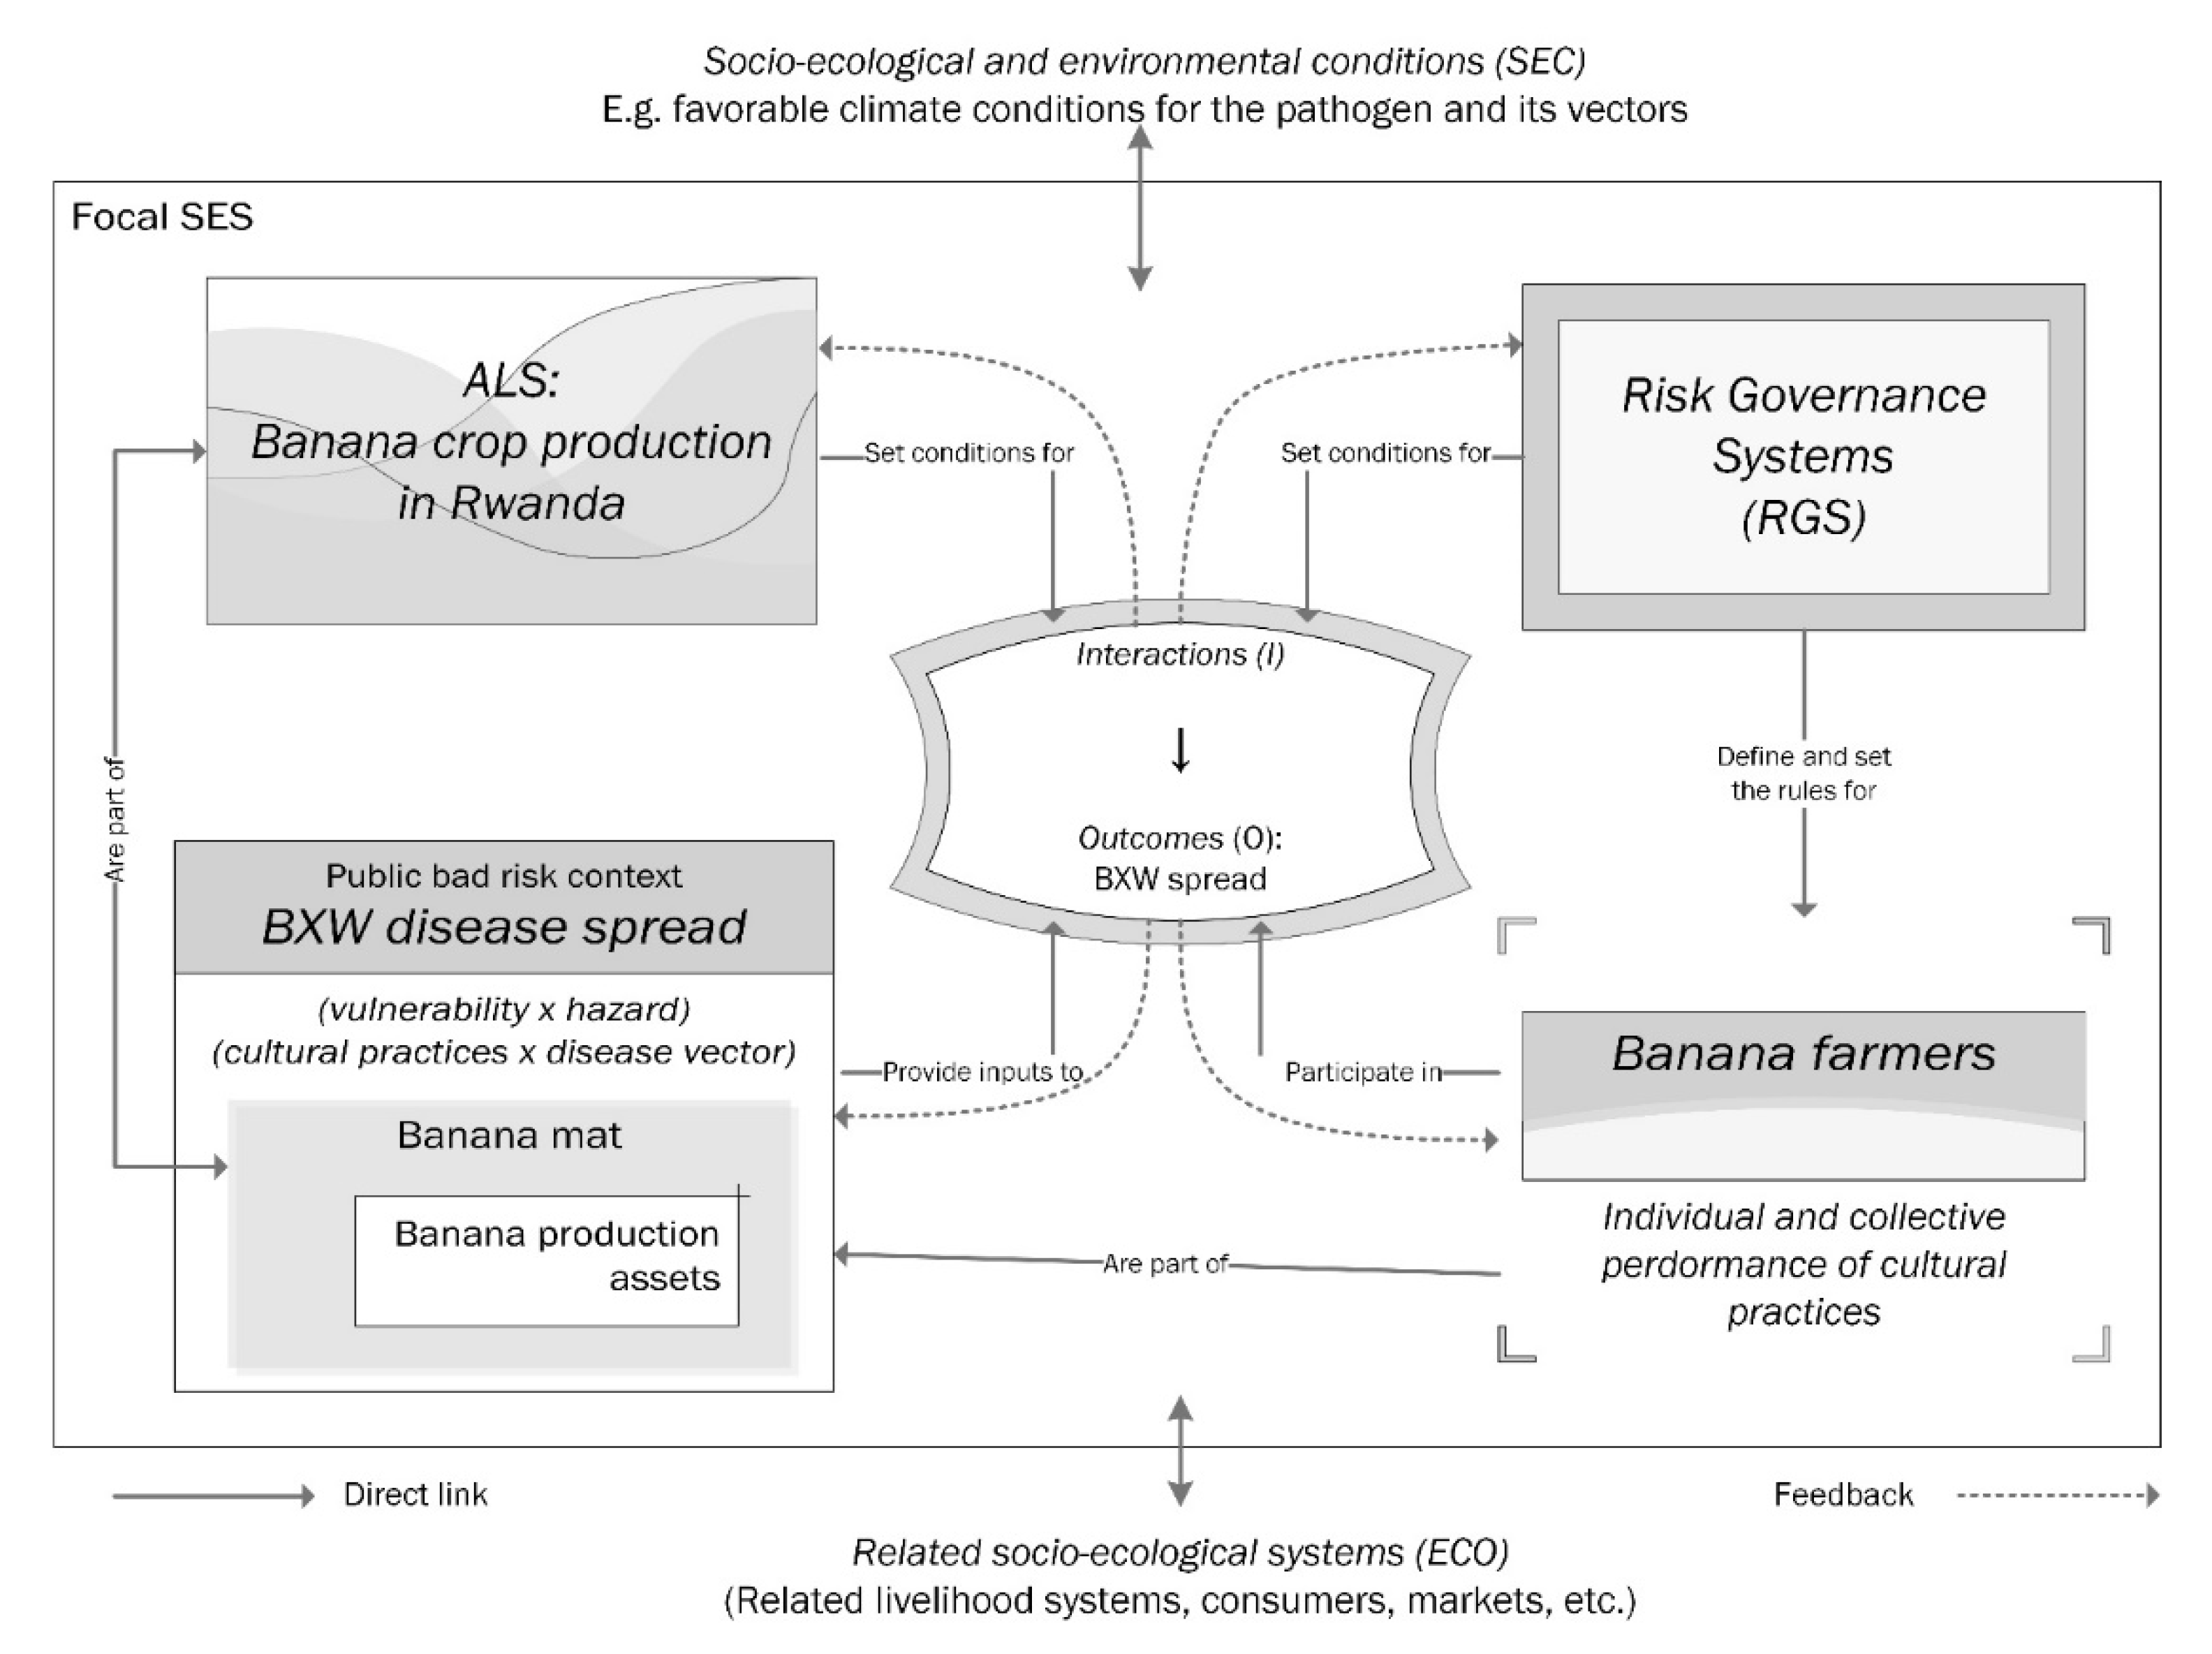
2.1. Framework for Analyzing a Public Bad Risk: An Adaptation from SES Framework
2.2. The Public Bad Risk Governance System: BXW Management in Rwanda
2.3. The Communication Variable in the Context of a Project
3. Methods
3.1. Testing the Musa-Game in Rwanda and Exploring Data Analysis Methods
3.2. ICT4BXW Project Context
3.3. Experimental Treatments
- If the emergence of an event (throughout the game rounds) and its representation at a given place (the board) influenced players’ decision-making (toward prevention and control of the disease, or institutional consequences of failing to do this) and vice-versa?
- If intertwined human and non-human dynamics influenced the creation of unfavorable collective conditions, either from the disease itself (death of the banana mat) or other associated ones (compulsory uprooting of infected mats performed by monitors)?
- If and how spatial analysis could contribute to the interpretation of the data collected through the Musa-game?
- If there was a difference in collective and individual performance in terms of net profit in the different treatments?
- If having previous knowledge of BXW disease management affected collective and individual performance in terms of net profit?
- If risk perceptions influenced participants’ playing strategies for the prevention and/or control of a public bad risk such as BXW disease?
- If the experimental findings could inform digitalized disease management and communication strategies?
- Was the Musa-game easy to understand and attractive to play for actual farmers?
- Did the Musa-game sufficiently capture the real-life decisions about dilemmas related to the prevention and control of BXW disease?
3.4. Sample
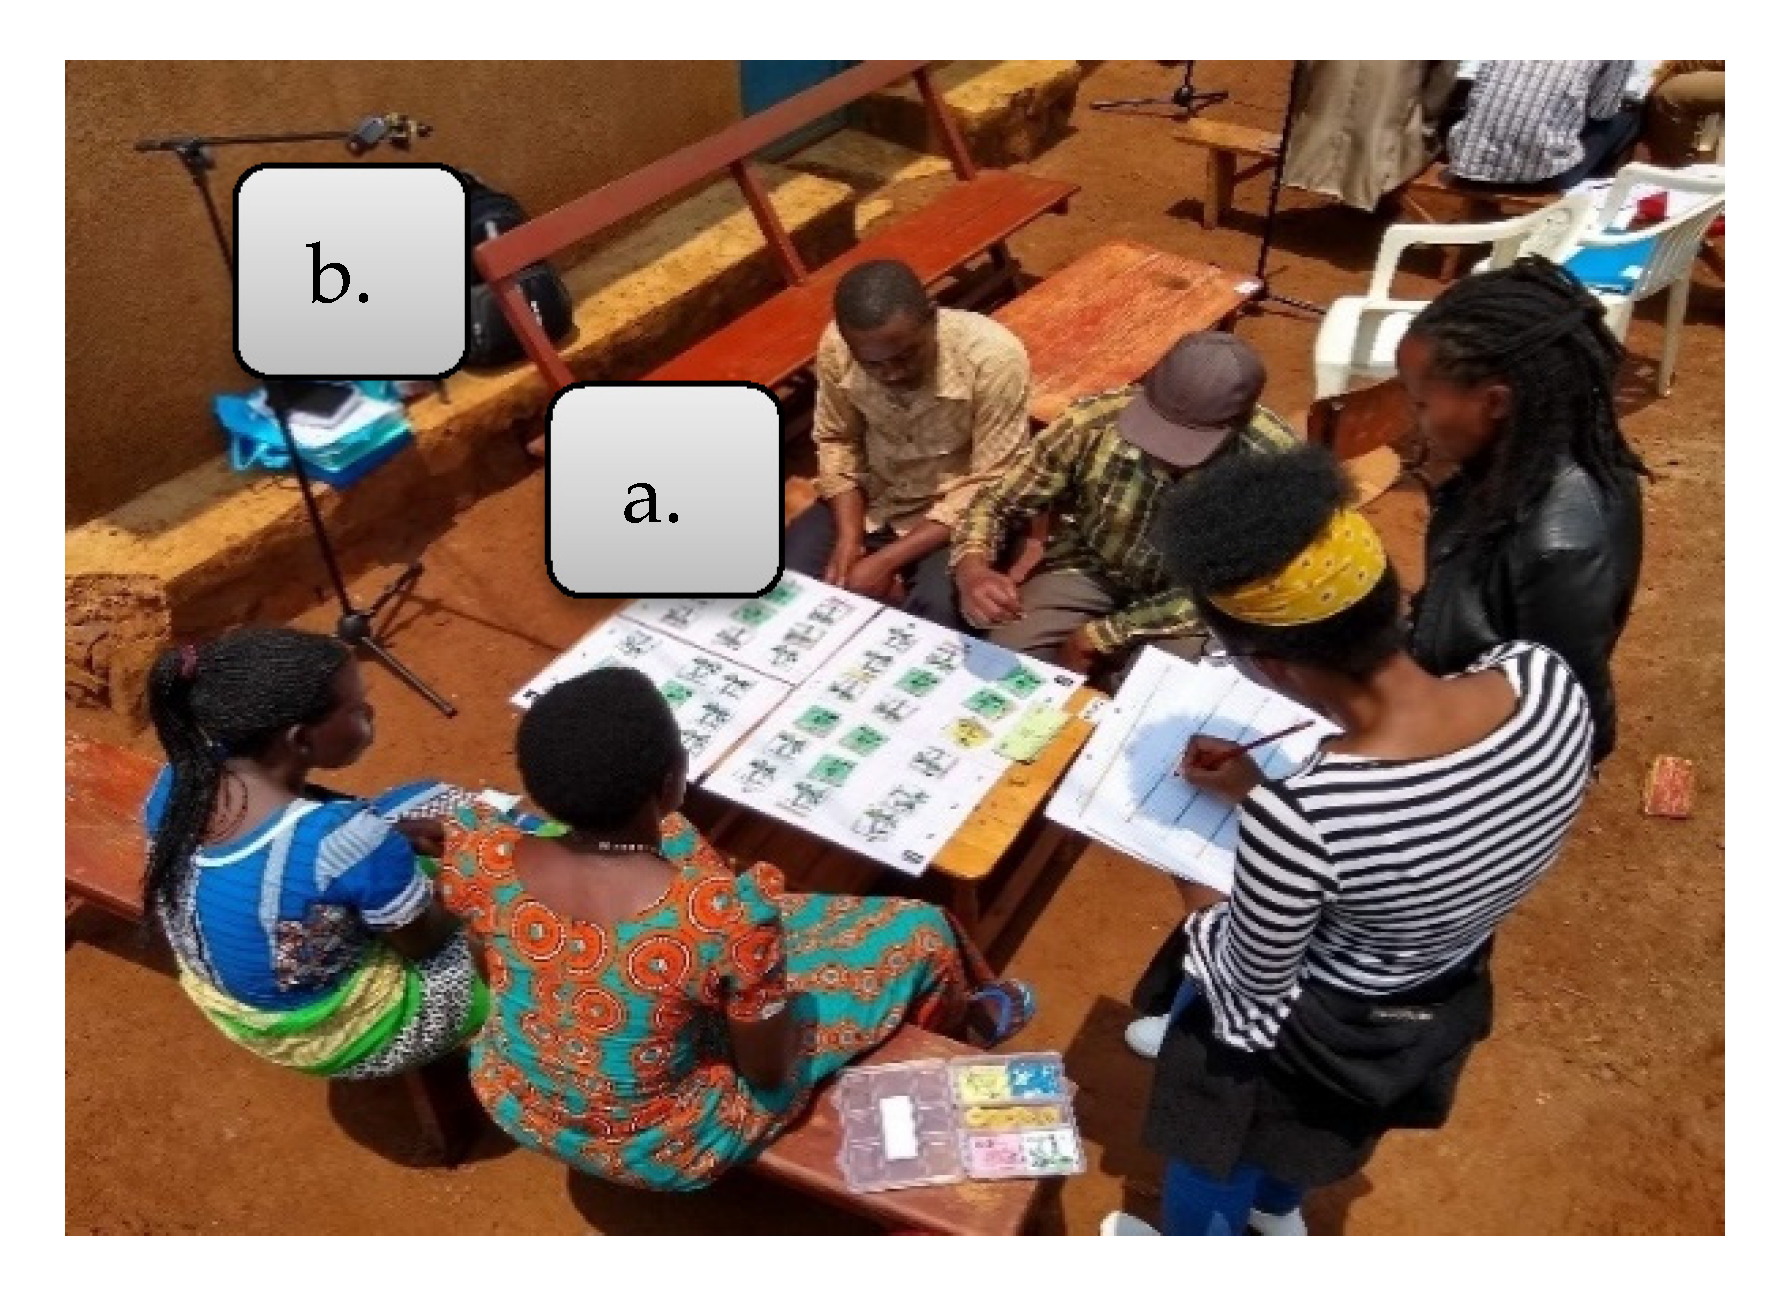
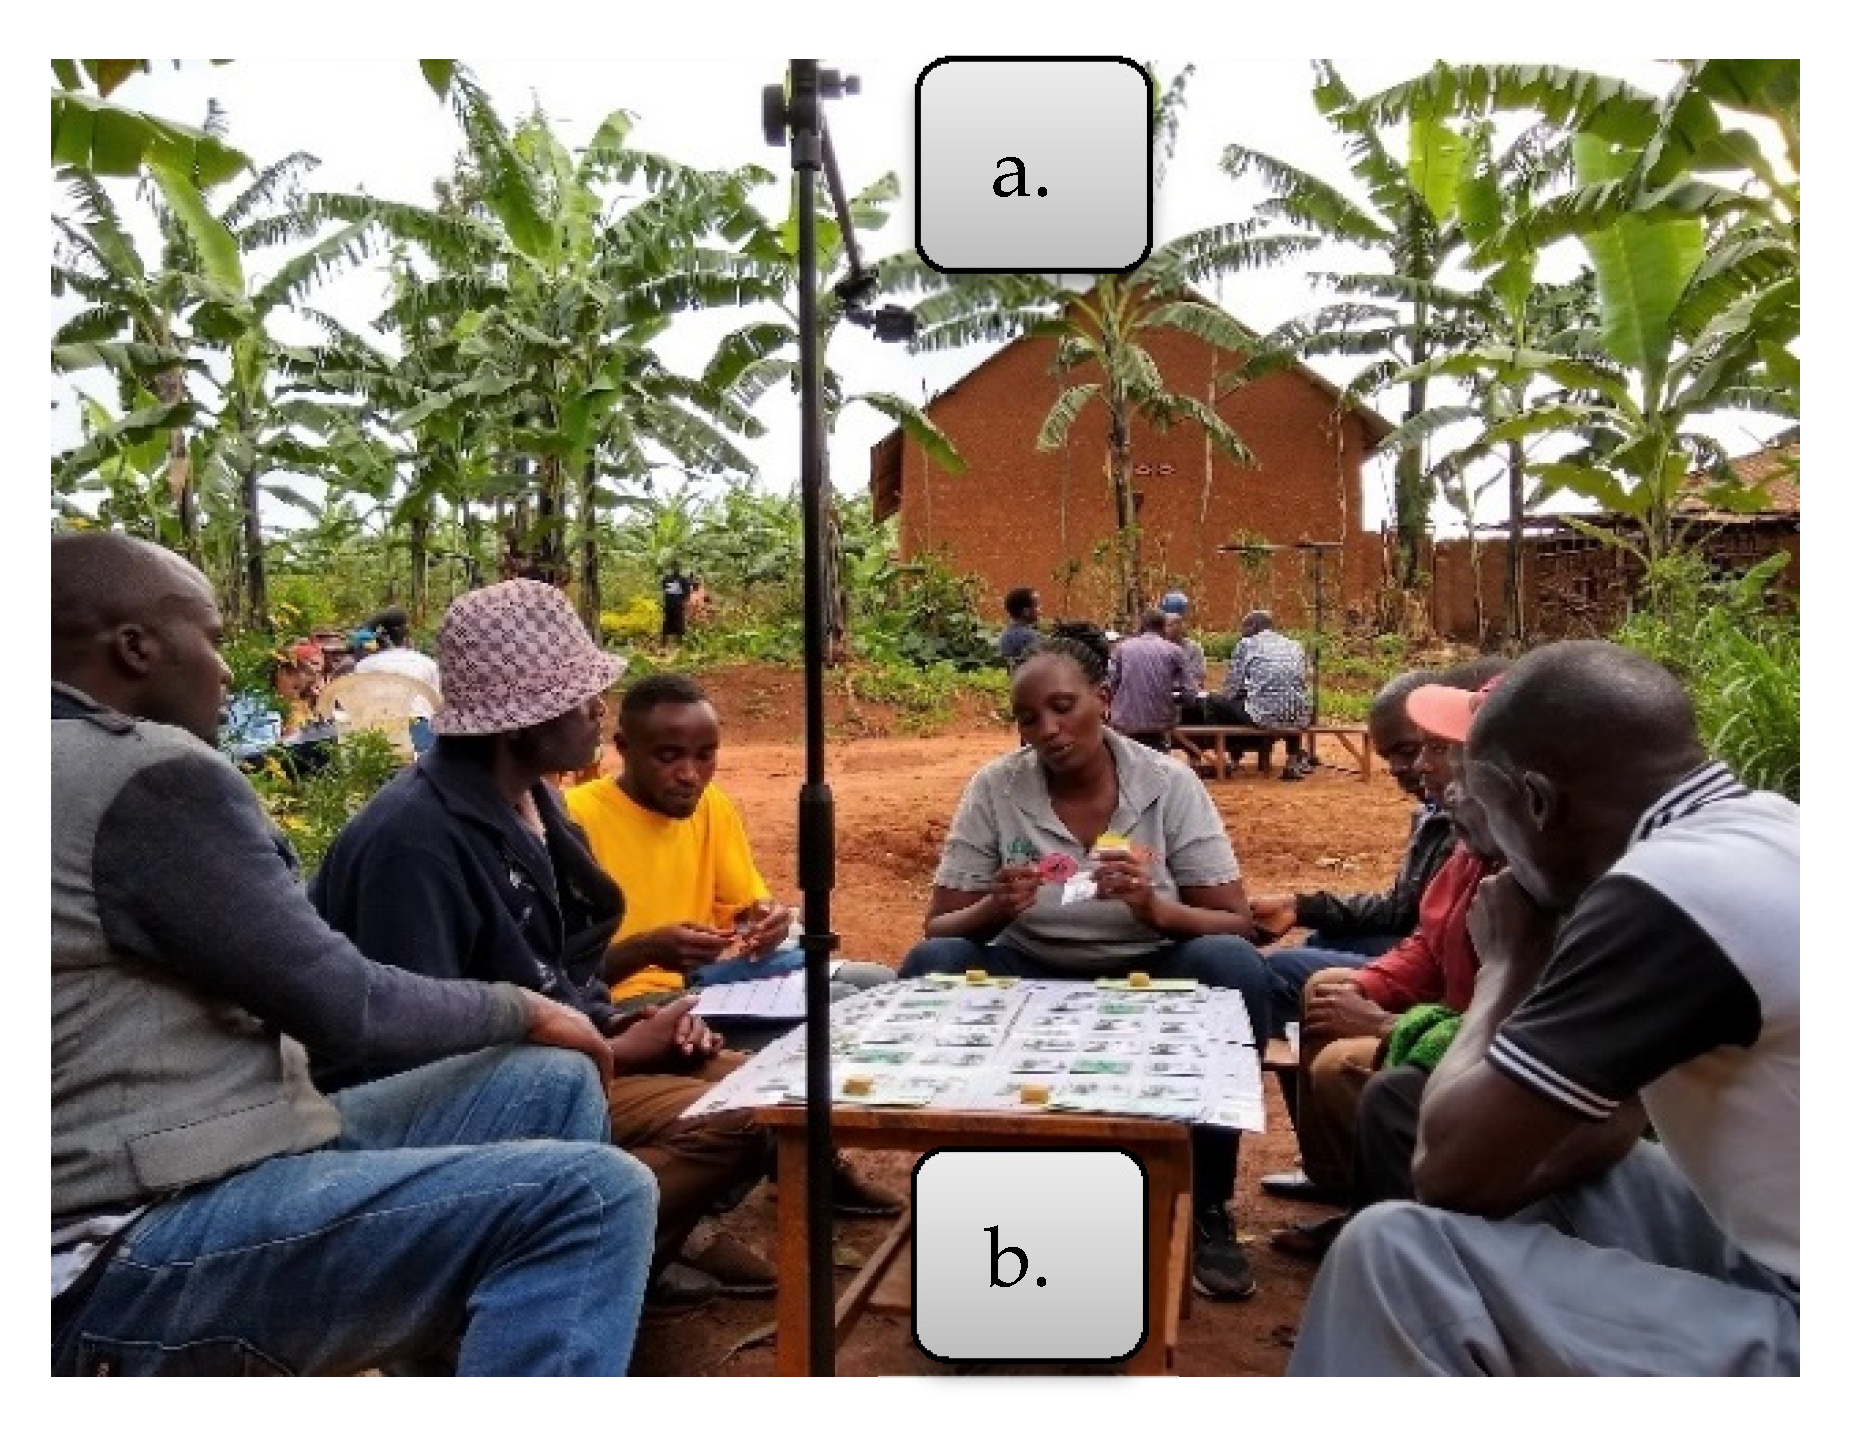
3.5. Procedure
4. Result and Analysis
4.1. Participants Receptivity to the Musa-Game
4.2. Participants’ Perception of How the Game’s Representation of Decision Dilemmas to Prevent and Control BXW Disease Accorded with Real-Life
The style of communication during the game was not the same as the one we use in real life, because when you meet someone, the only thing you tell him is if you have been infected by BXW. […] we never discuss together the measures we should take to fight this disease. But during the game, I was able to discuss and share with my neighbours the measures that we can take to fight this disease together.(T3.a.b3)
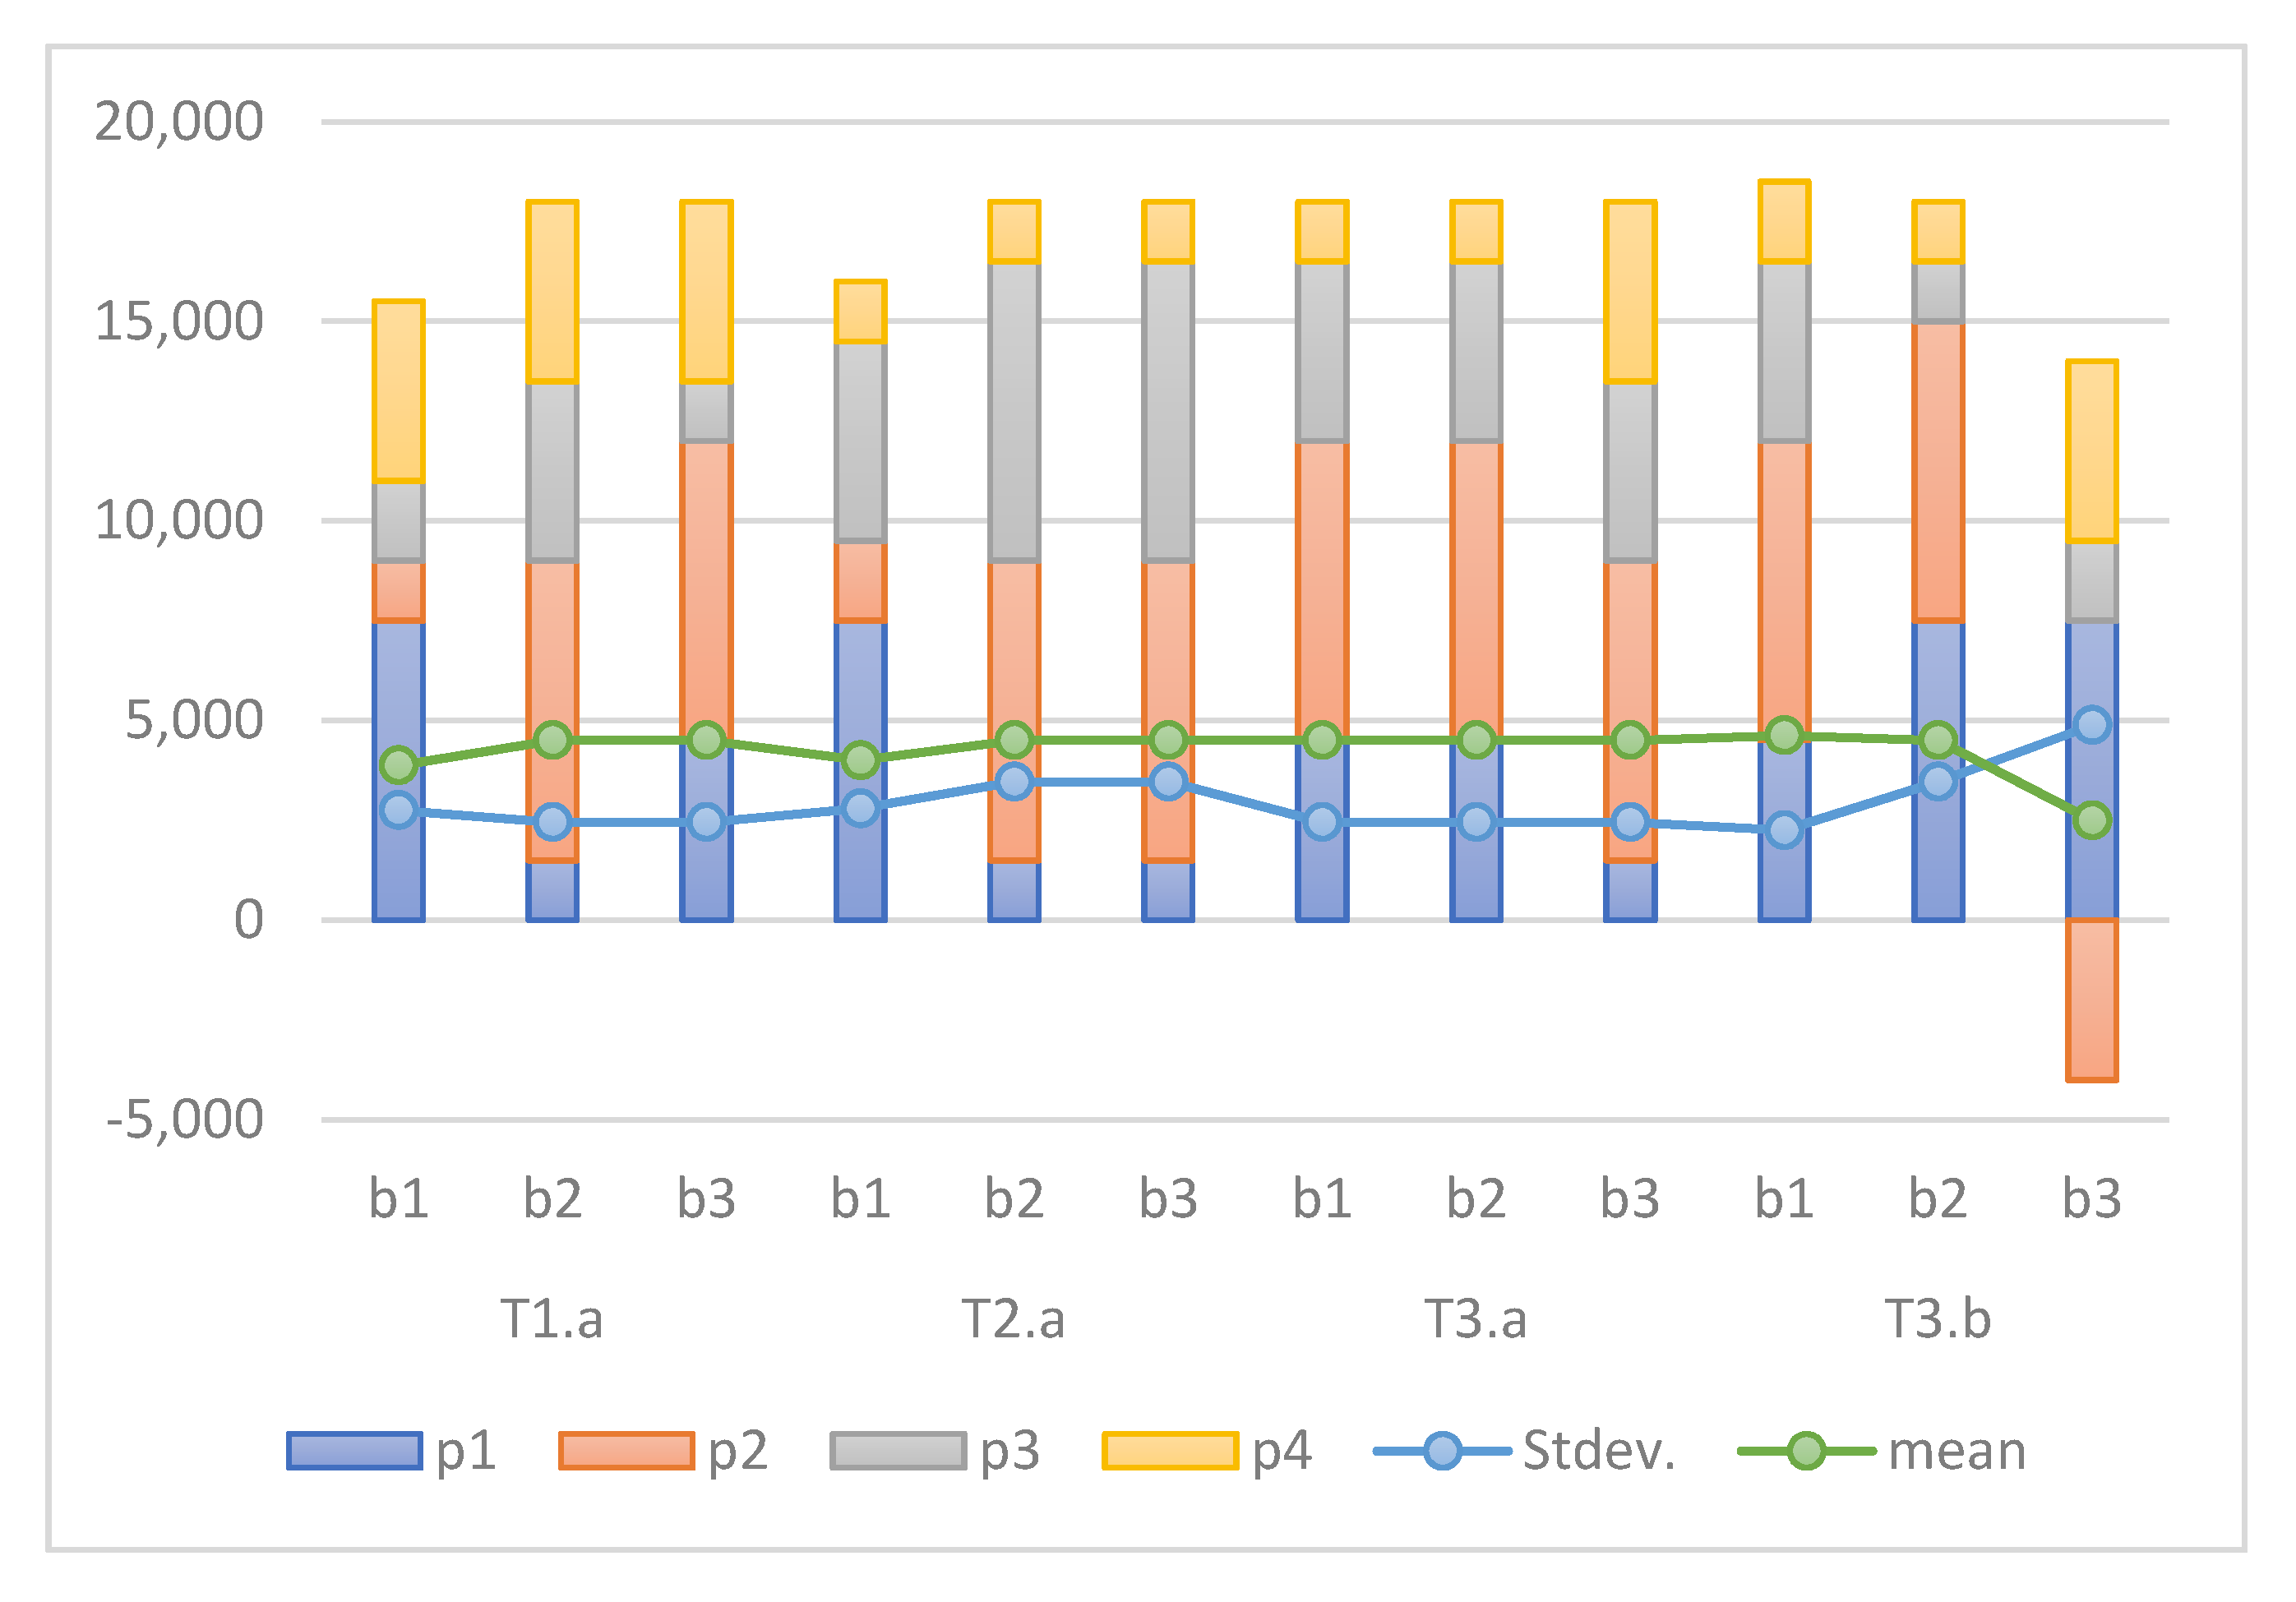
4.3. Overall Game Performance
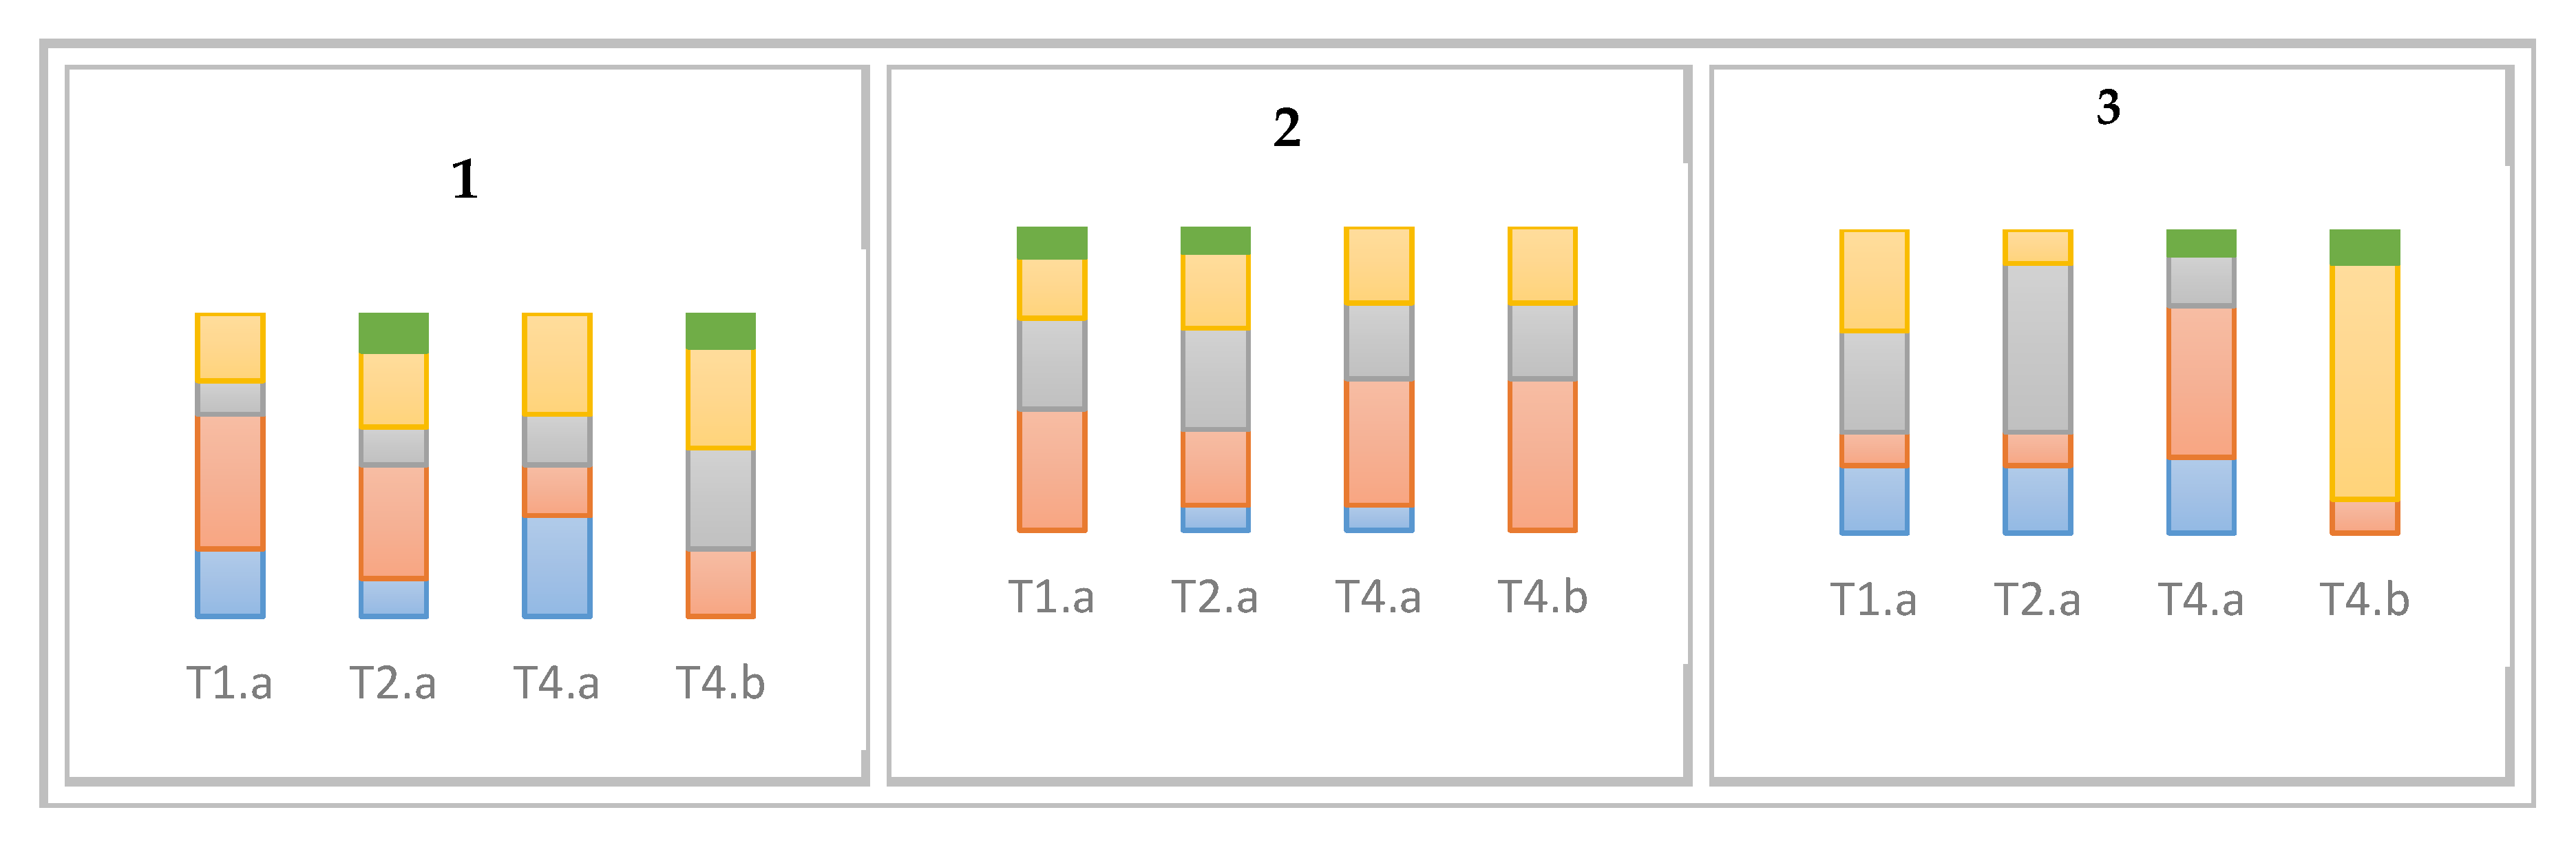
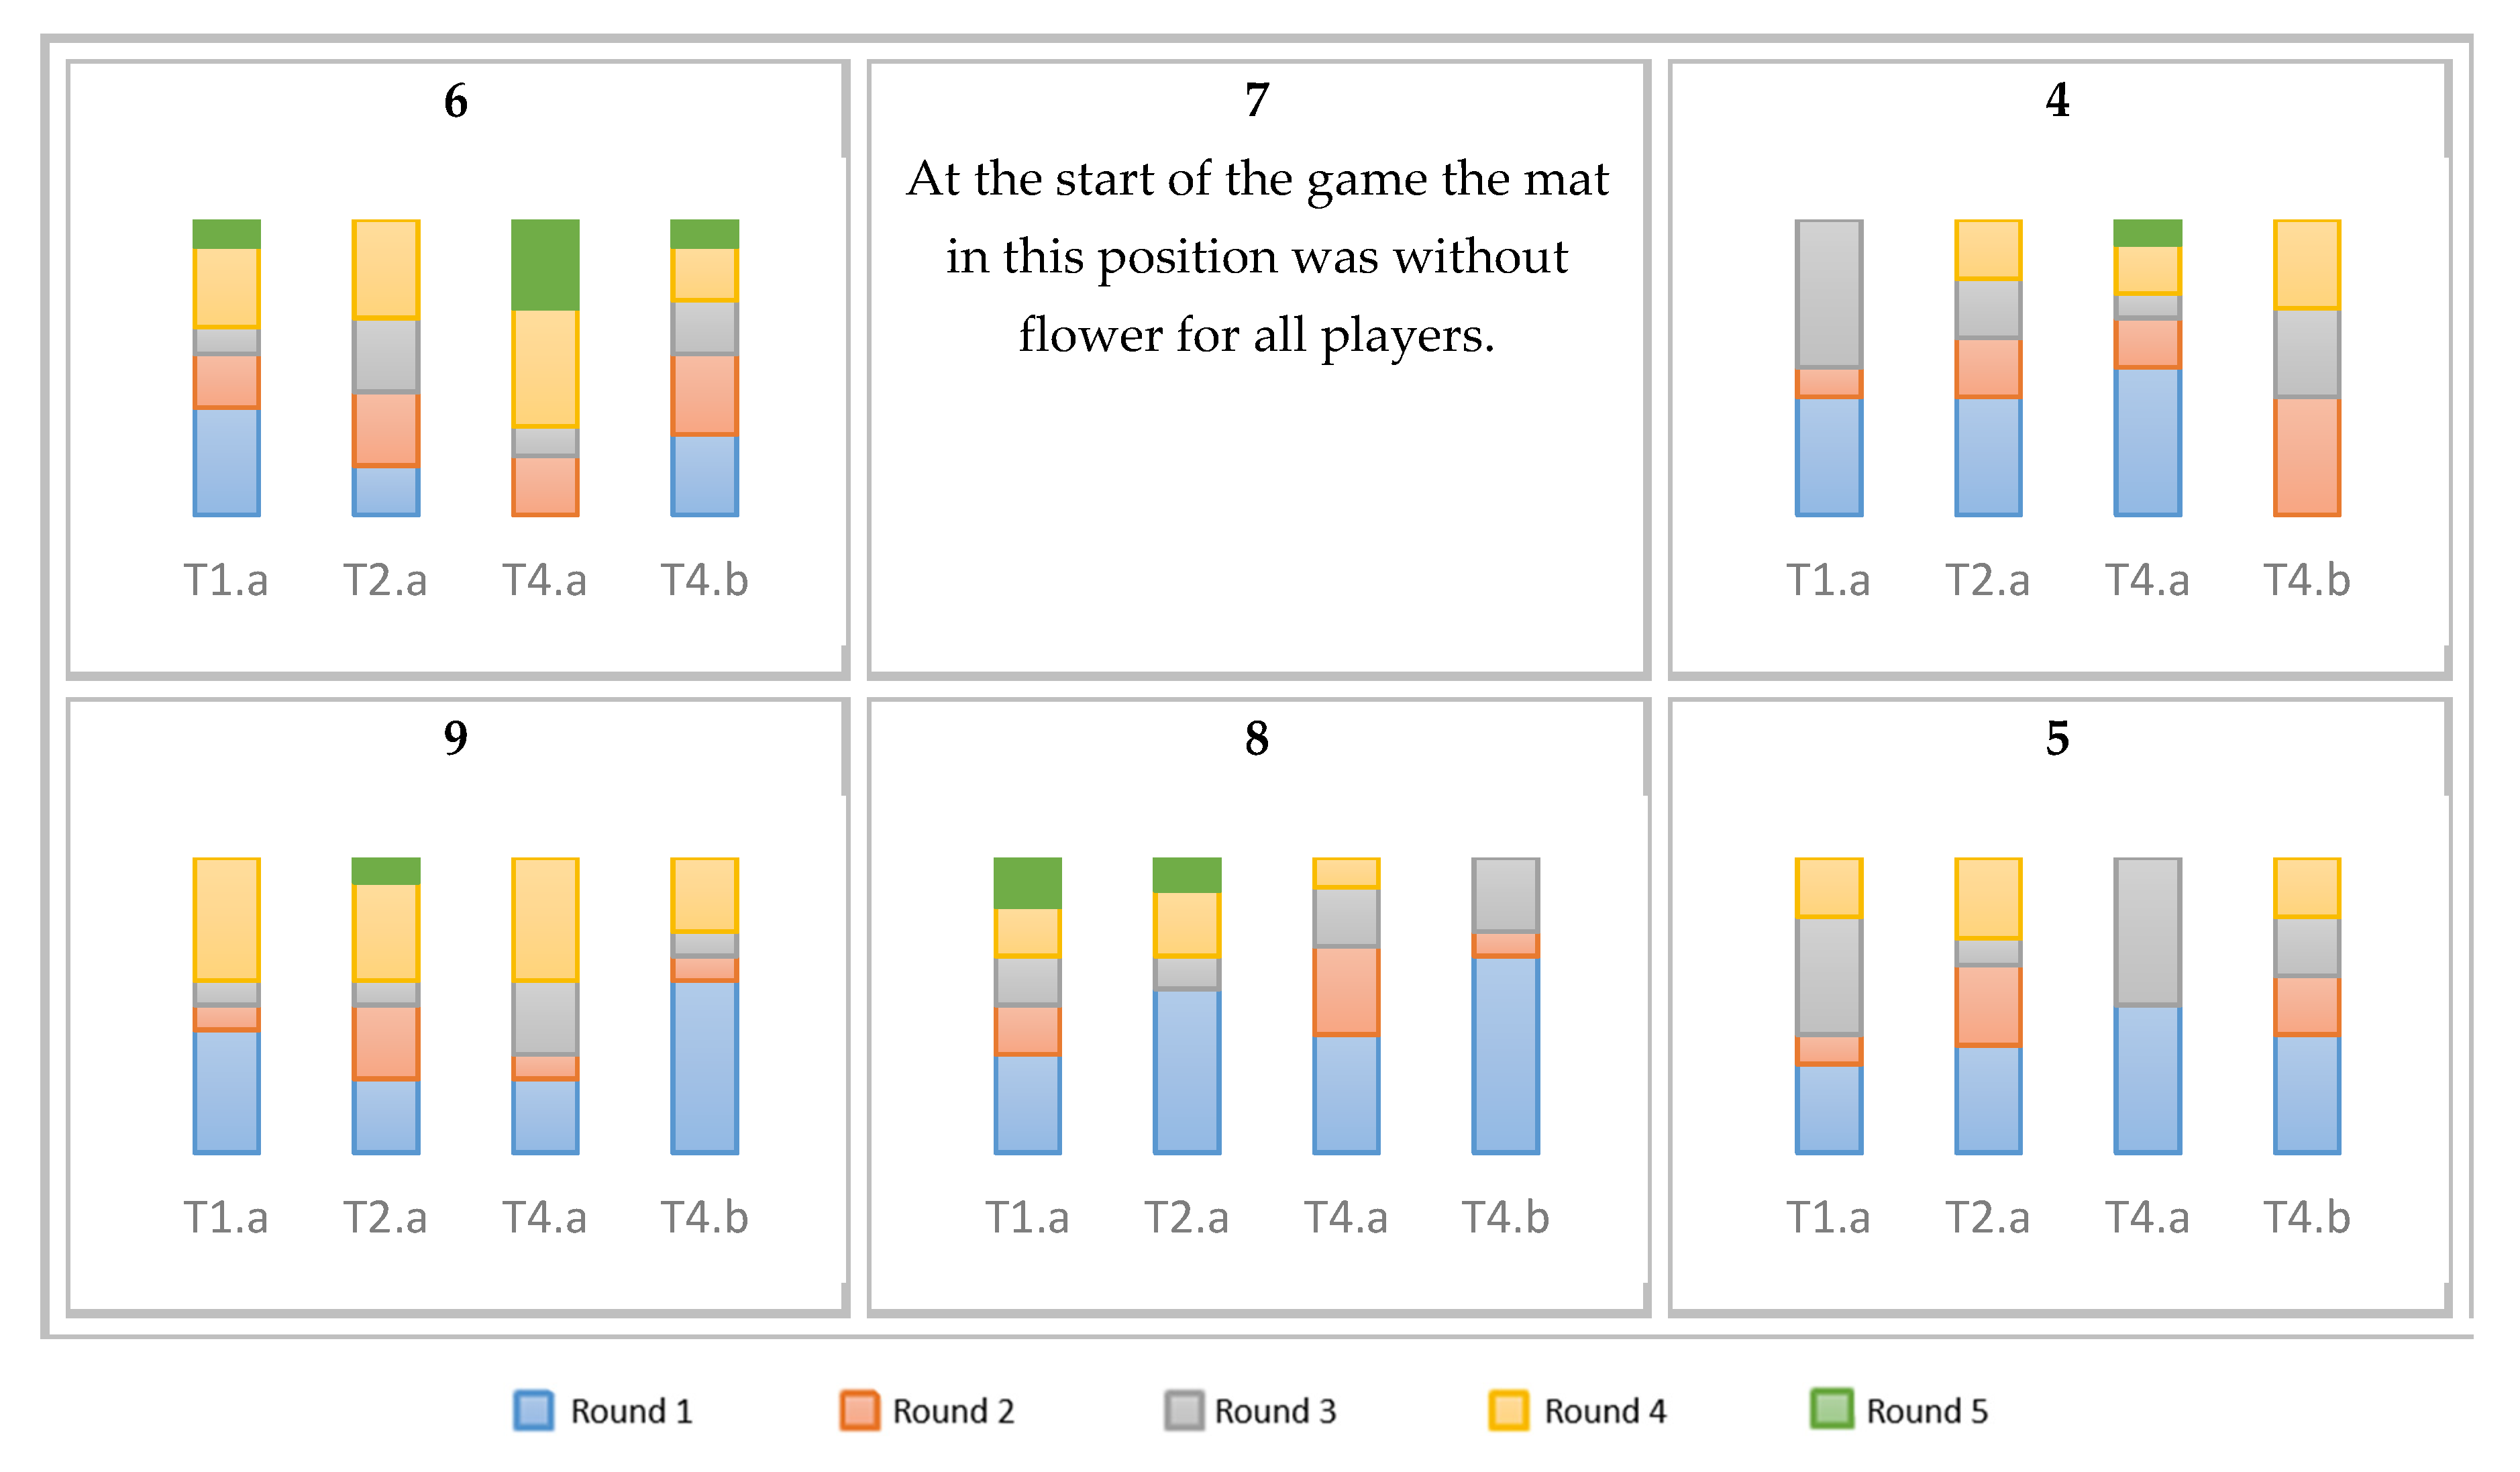
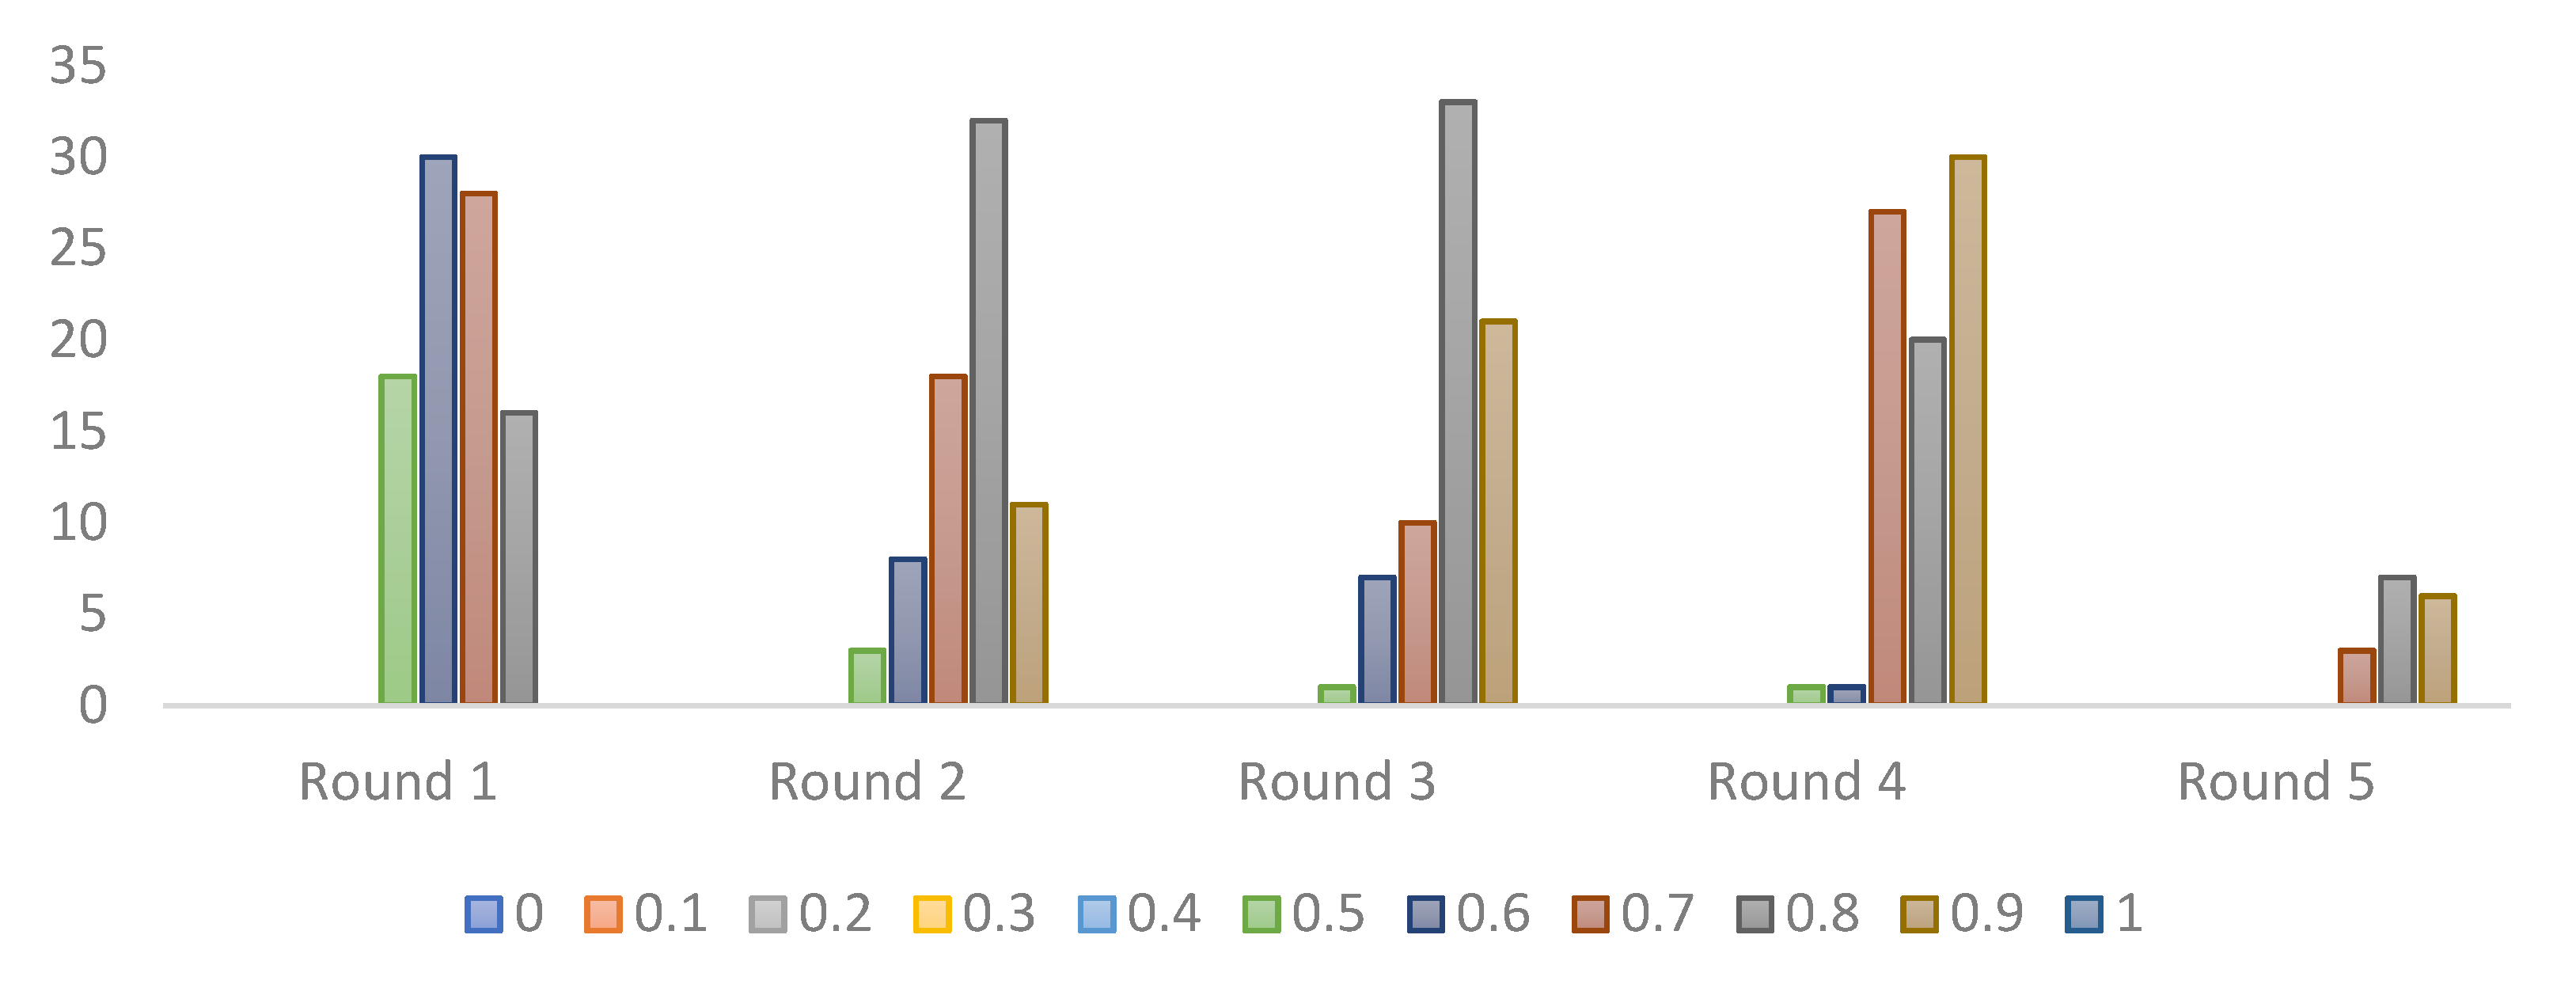
4.4. Spatial Locations of Decision-Making: Decisions about Where to Cut Flowers
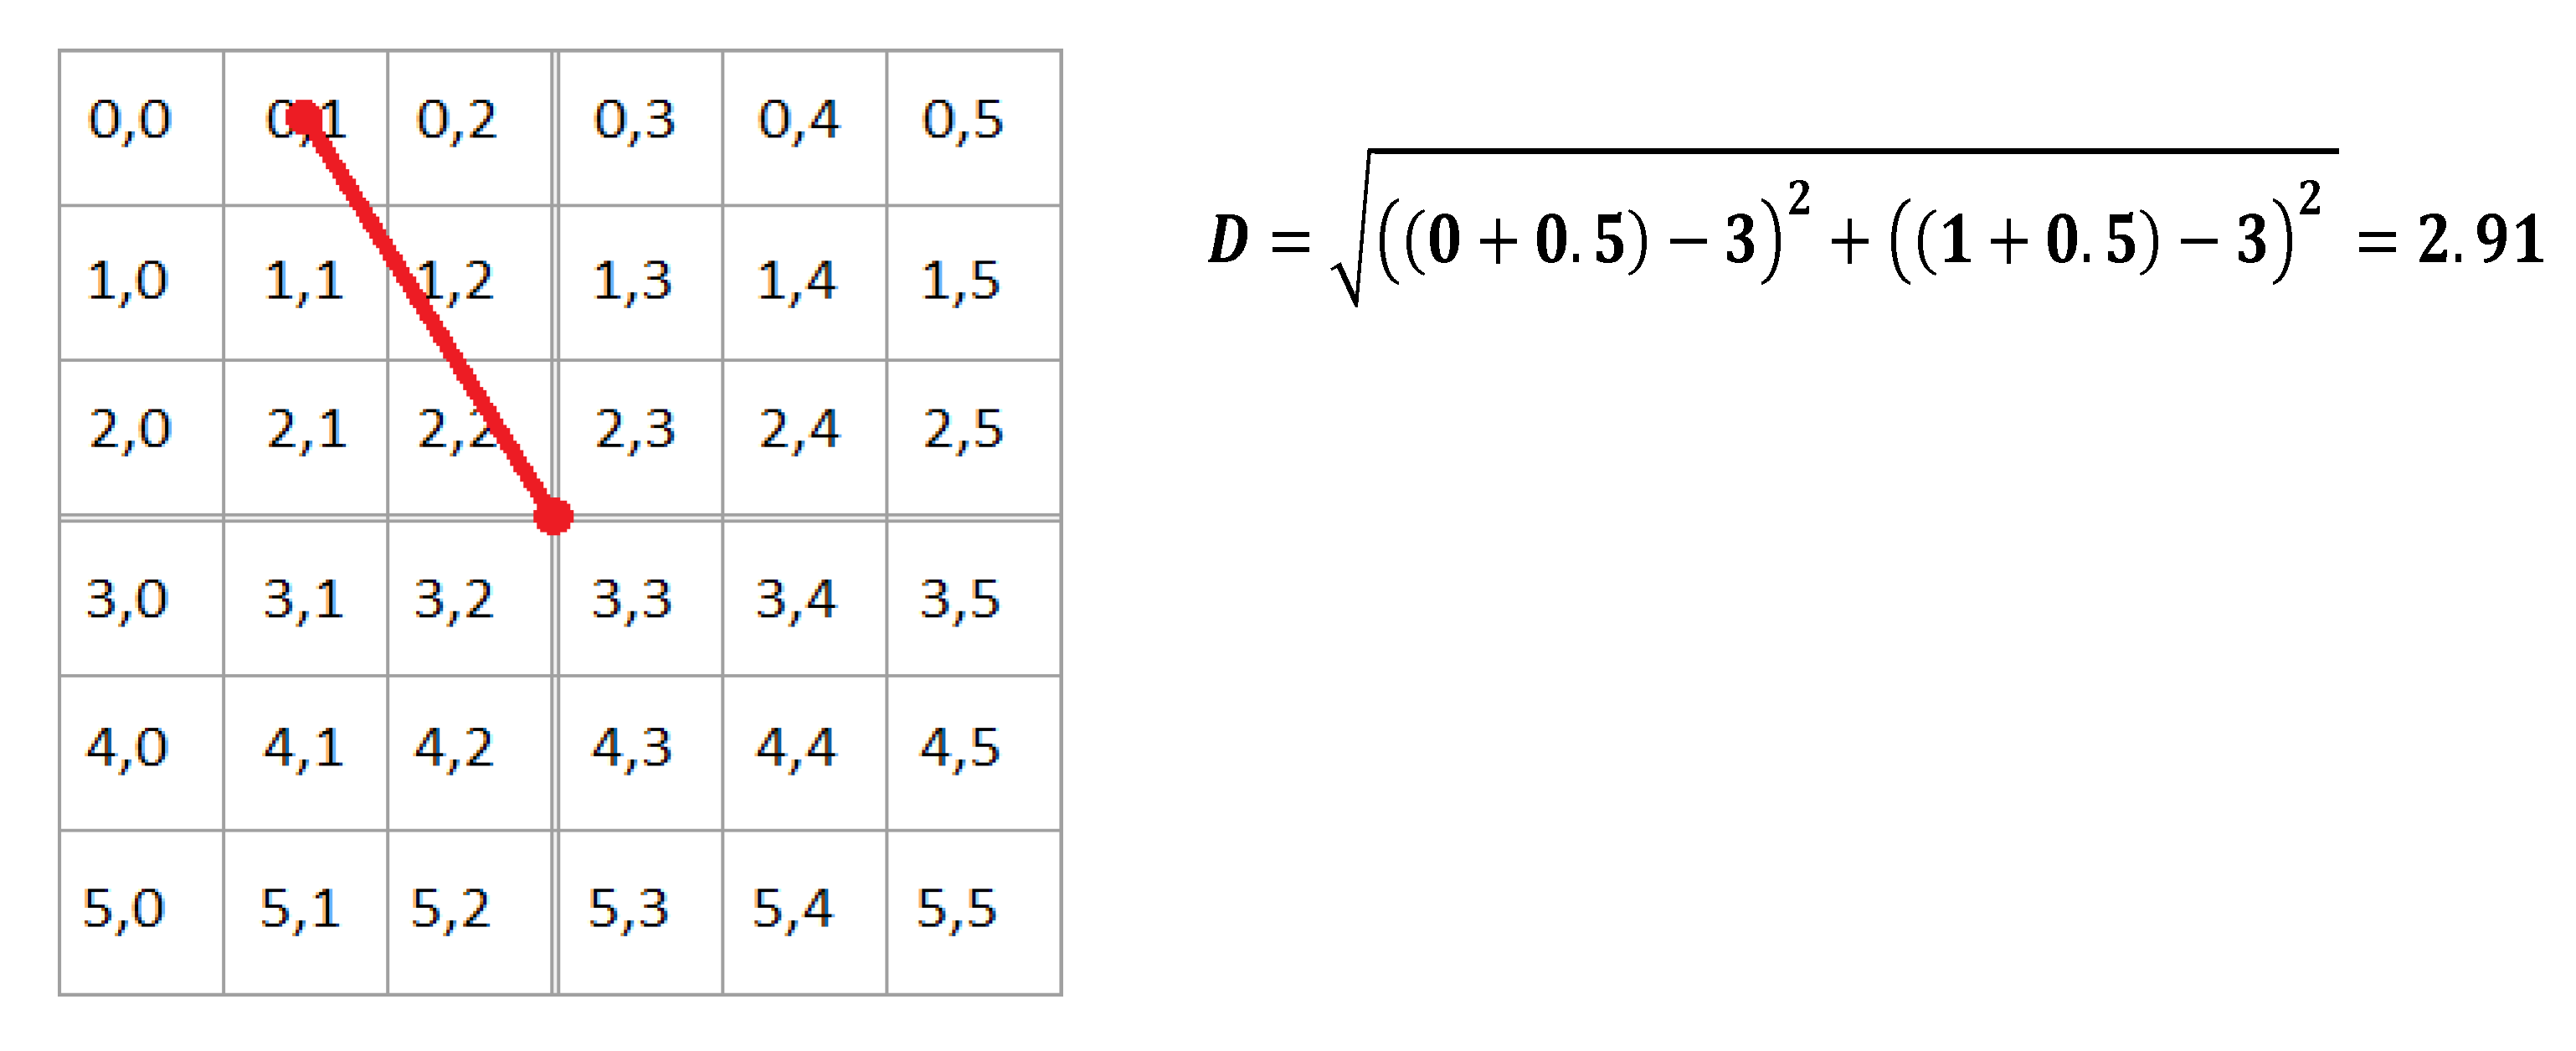
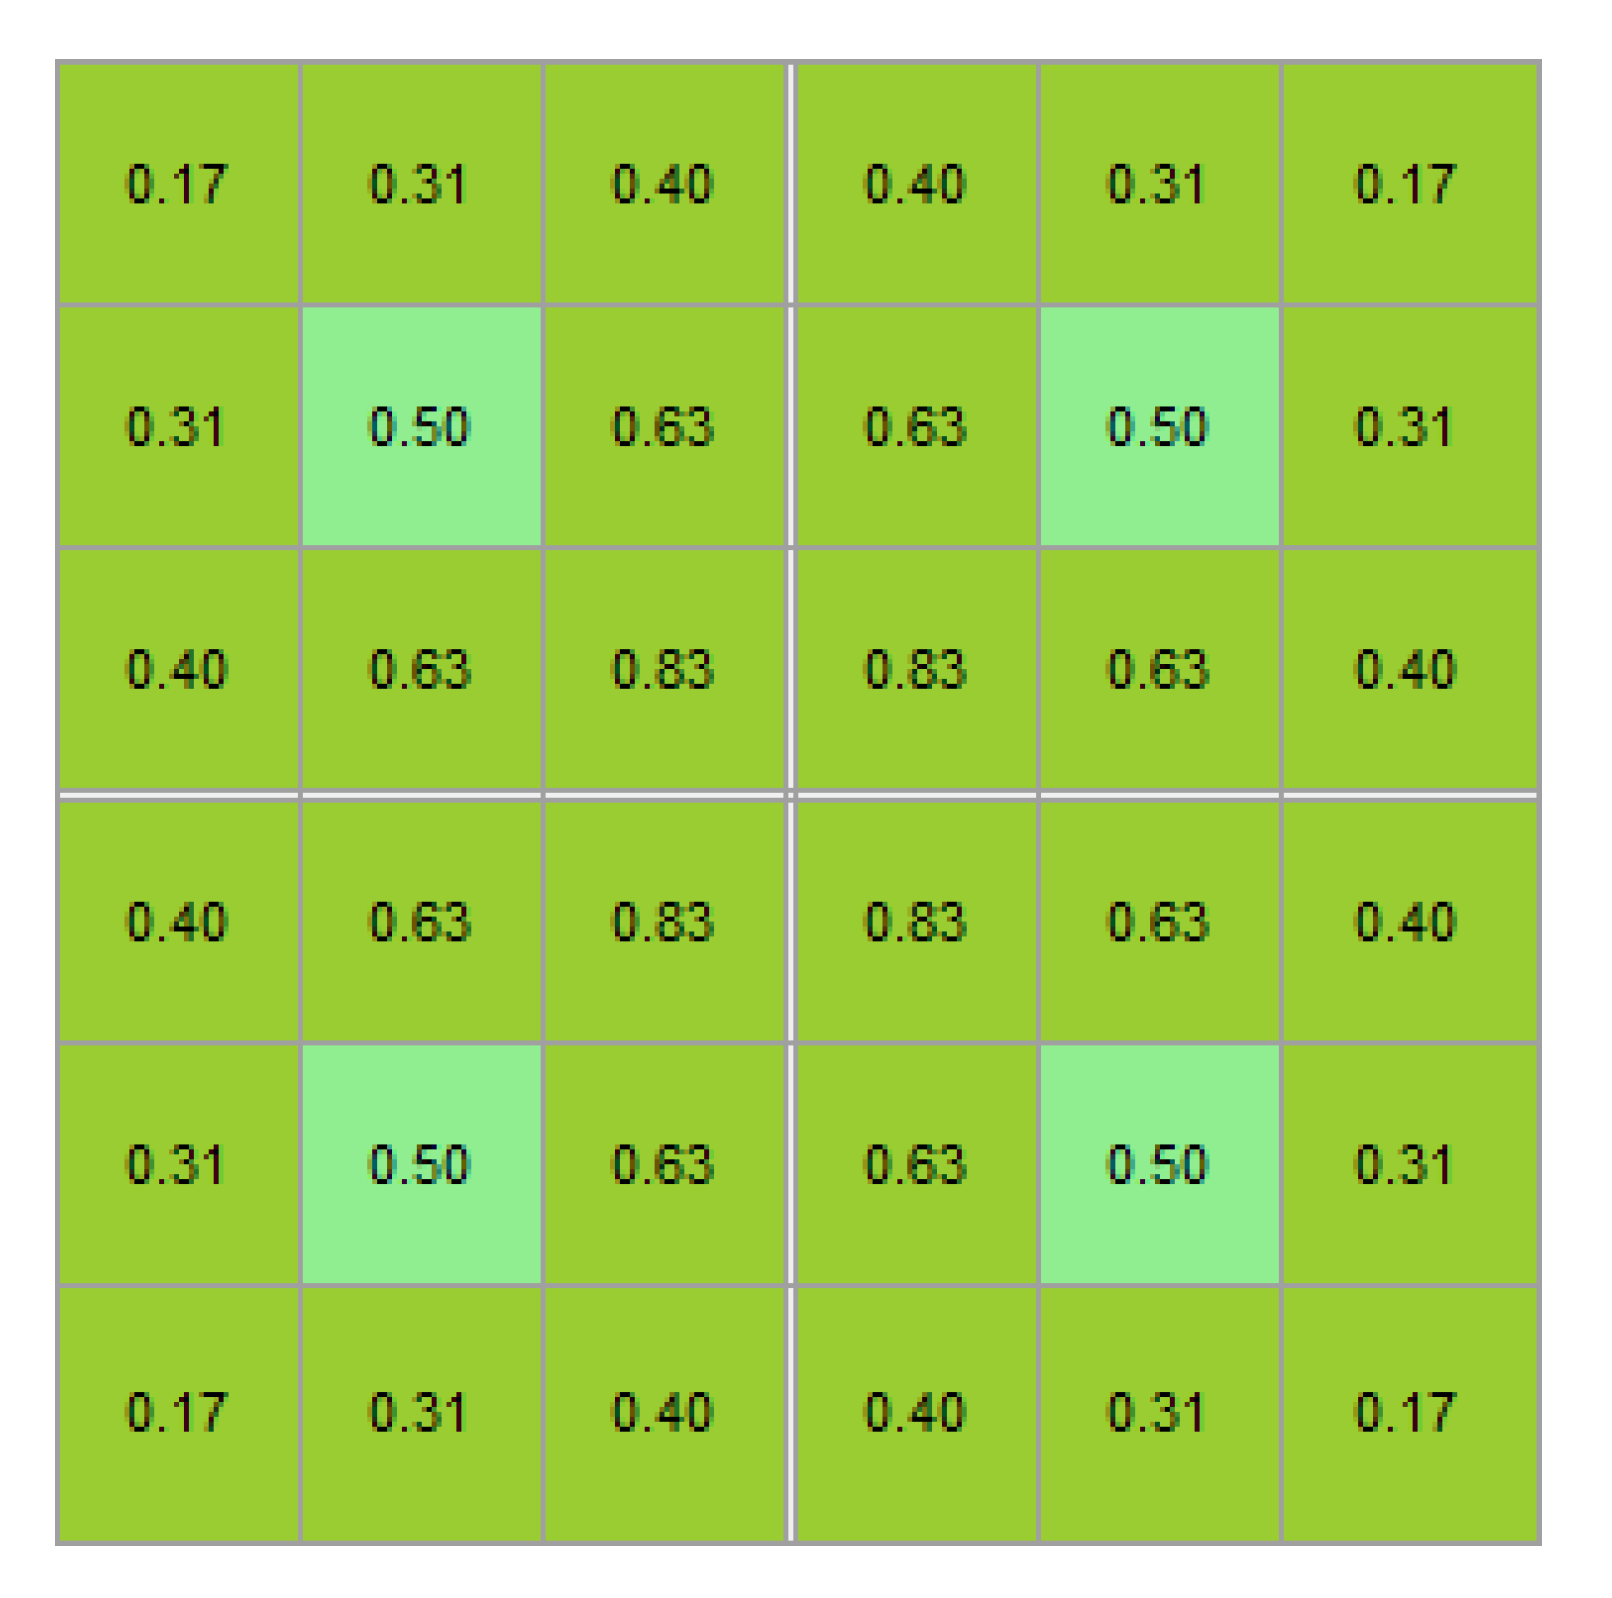
4.5. Spatial Distance-Based Decision-Making Analysis: The Musa Analysis Tool
4.5.1. Decision to Cut Flowers in Relation to the Minimum Distance to a Neighbor’s Mat without Flower
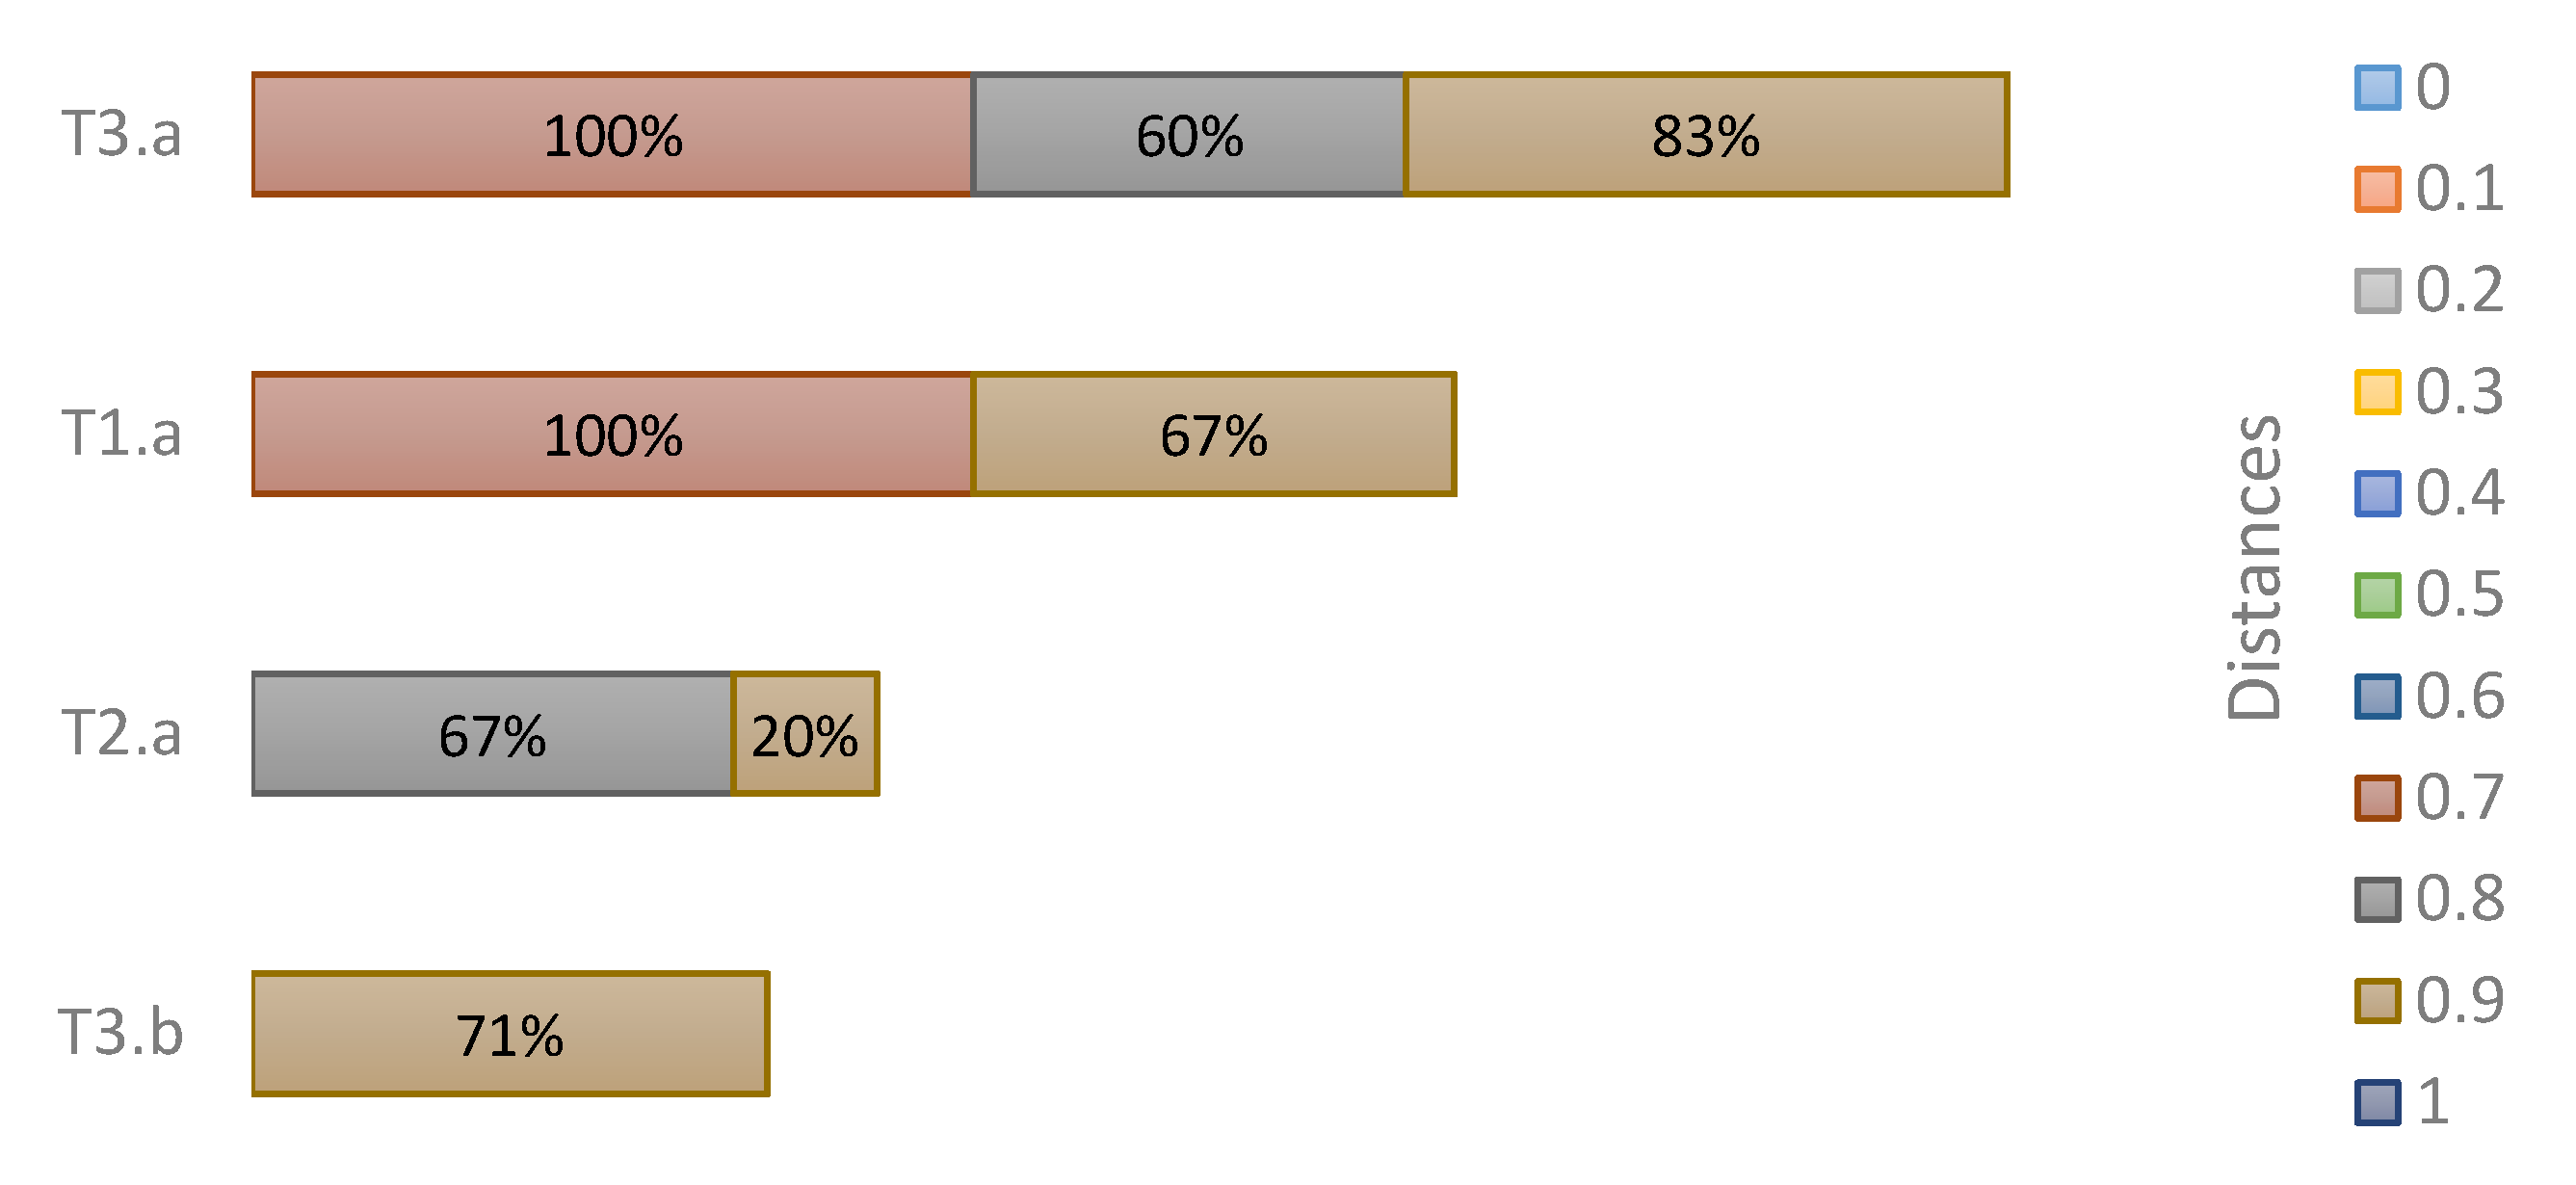
4.5.2. The Decision to Uproot Yellow or Red Mats Versus the Minimum Distance to a Neighbor’s Healthy Mat with or without Flower
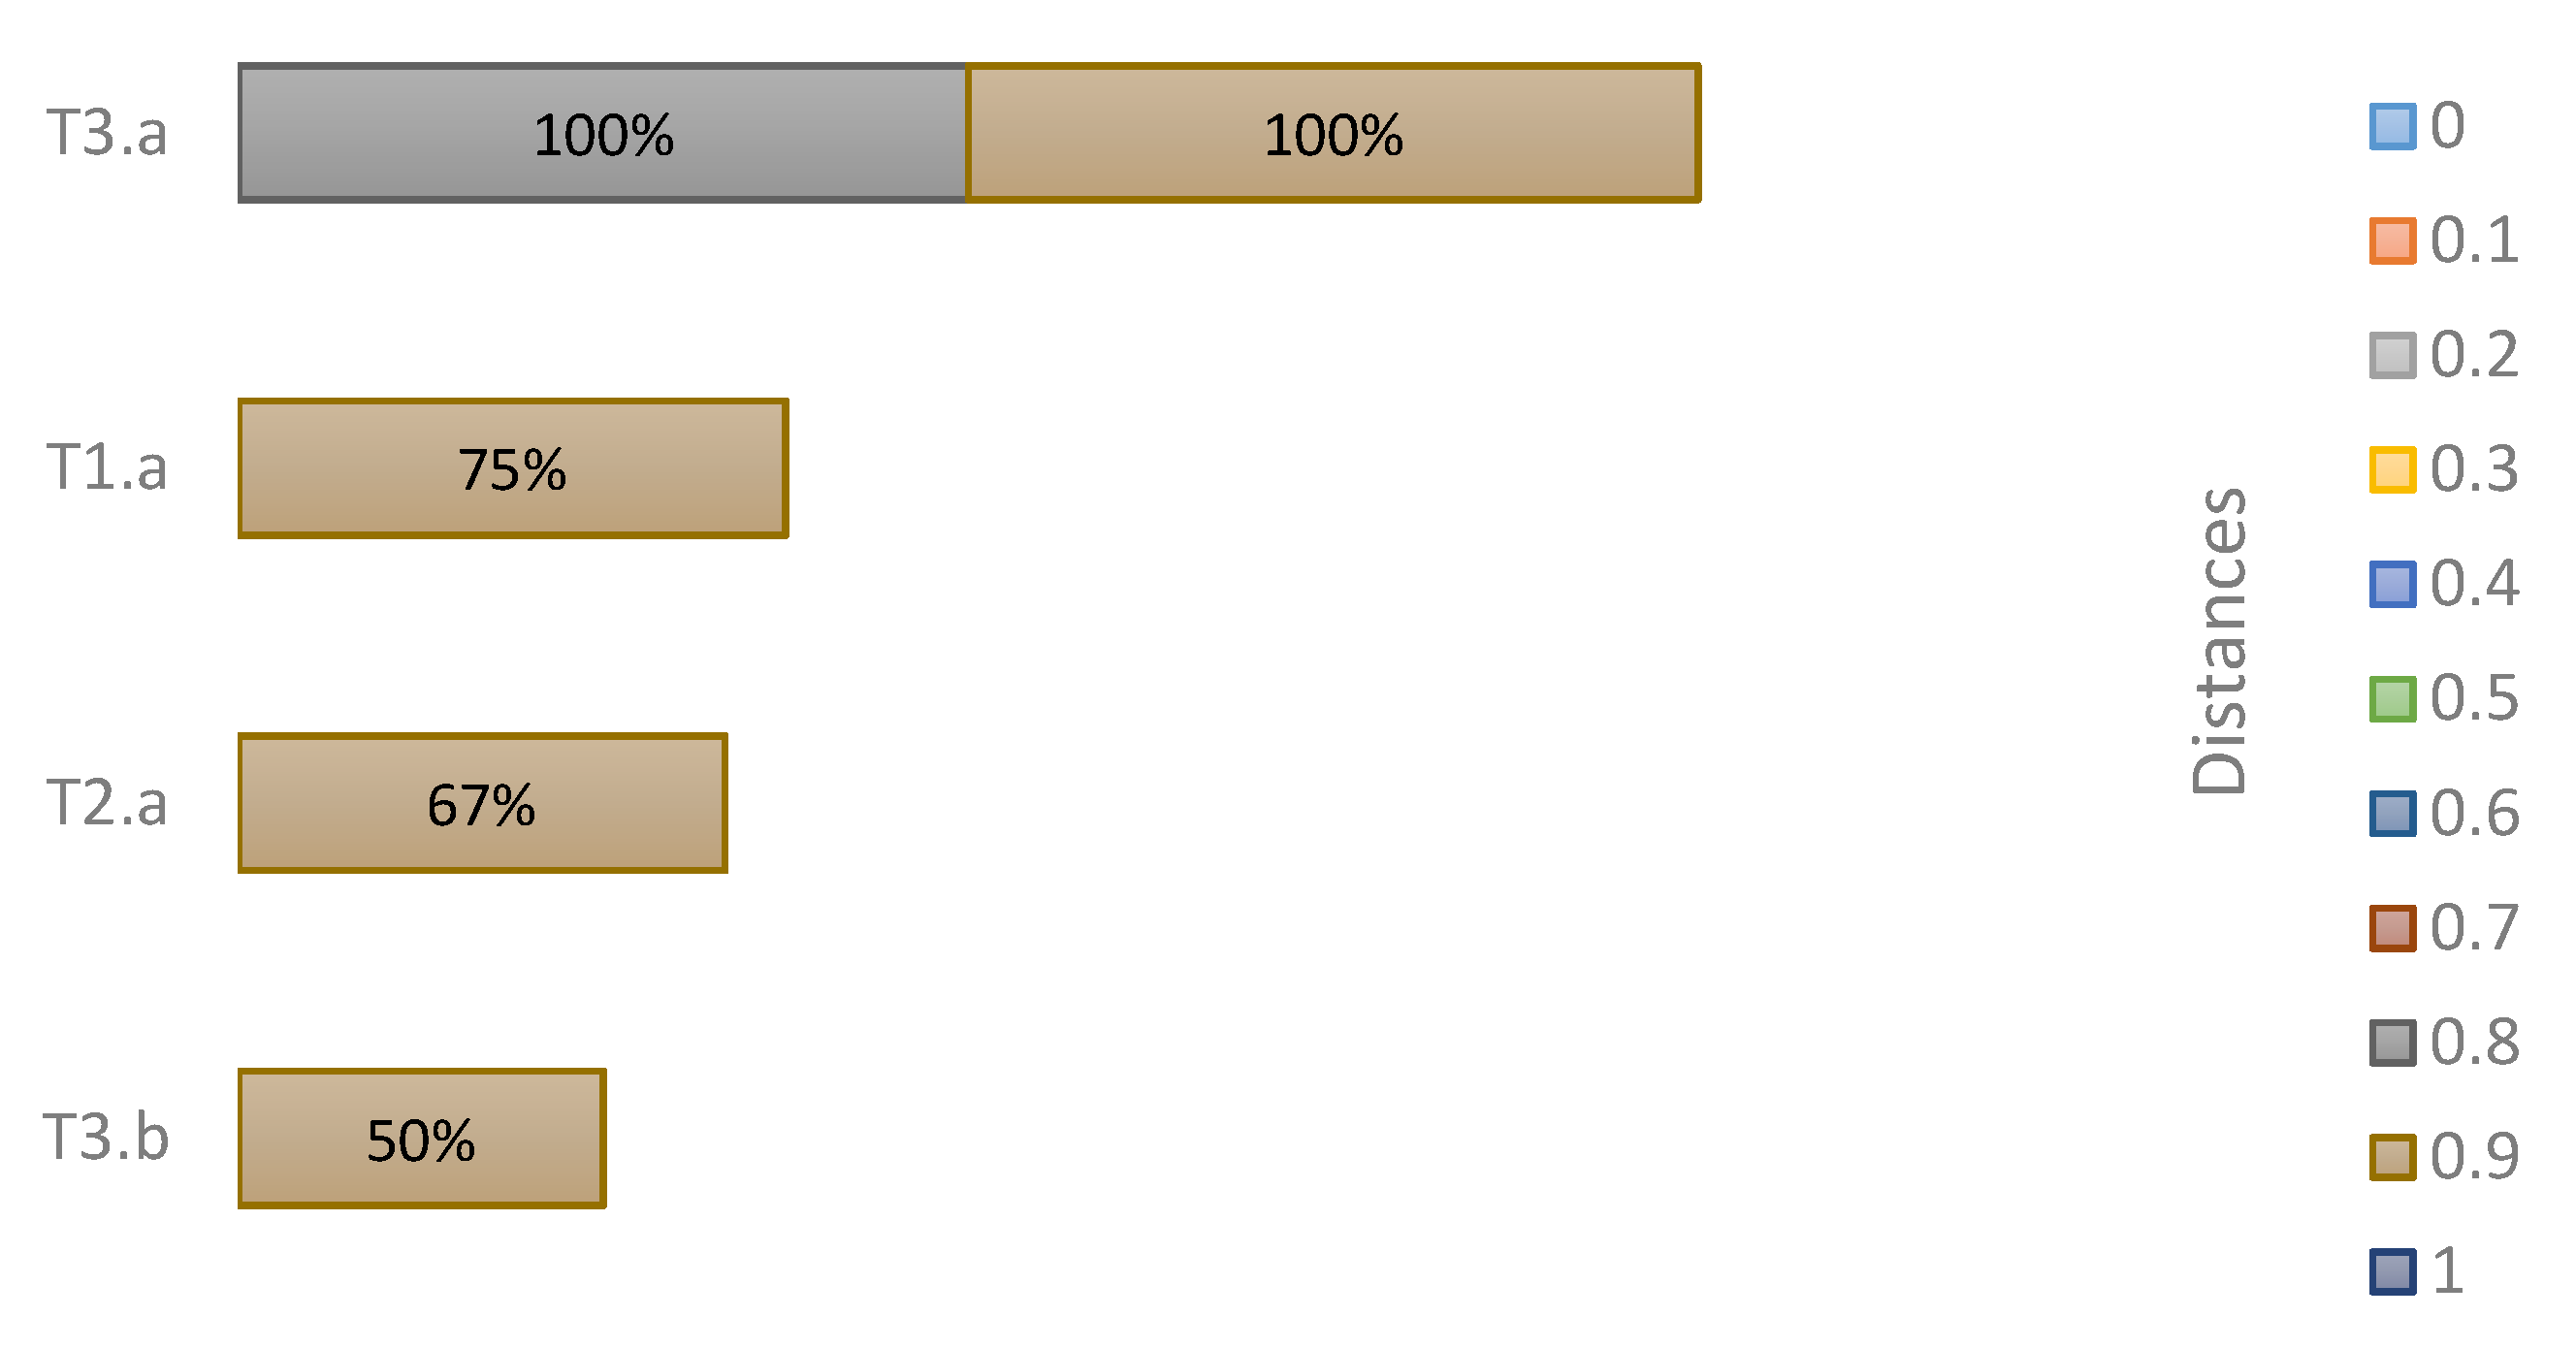
4.5.3. Decisions about Cutting Flowers and the Distance to an Infected Mat and the Outer Border
4.6. Exploring the Usefulness of Neighbors’ Analysis
5. Discussion and Conclusions
5.1. The Emergent Phenomena and Spatial Analysis to Better Understand Public Bad Risks
5.2. The Influence of Knowledge and Communication
6. Reflection on the Musa-Game Method
6.1. The Observed Phenomena in the Game
6.2. Reflection on the Game’s Results
6.3. The Learning Effect of Playing Together
6.4. Implications for Communicating about Public Bad Problems
6.5. Outlook for Dynamic Socio-Ecologic Games
Supplementary Materials
Author Contributions
Funding
Institutional Review Board Statement
Informed Consent Statement
Data Availability Statement
Acknowledgments
Conflicts of Interest
Appendix A

| Components | Description and Example | BXW Context |
|---|---|---|
| Agricultural livelihood system (ALS) | This is represented by a specific territory where diverse agricultural livelihood activities take place, involving crops, animal husbandry, and related activities and assets that provide ecosystem services to farmers and consumers. | Banana small scale farming for consumption and market. |
| Livelihood unit (LU) | This is a specific agricultural activity providing ecosystems services needed to make a living, e.g., cattle for milk and meat, rice production for human consumption, maize production for human or animal feed. | Banana as food and source of income. |
| Livelihood assets | Human: peoples’ health and ability to work, knowledge, skills, experience; Natural: land, water, the forest, livestock; Social: trust, mutual support, reciprocity, ties of social obligations; Physical: tools and equipment, infrastructure, market facilities, water supply, health facilities; Financial: conversion of production into cash, formal or informal credit. | Banana production contributes approximately 50% of the diet of 32% of the households in Rwanda [42]. Therefore, declines in production impact household income as well as food and nutrition security, and social and cultural wellbeing [19]. |
| Public bad risk context (PBRC) | Conditions of vulnerability and characteristics of the hazard that hinder or limit the probability of a public bad. | BXW can result in yield losses up to 100%. No cure exists for BXW. Once the pathogen establishes, the stem will inevitably die. Eradication of BXW is considered impossible, but outbreaks can be managed with preventative and early response agricultural practices. Collective-coordinated actions are needed, as farmers’ production activities and outcomes are interconnected. |
| Vulnerability | The vulnerability (of any system) is a function of three elements: exposure to hazard, sensitivity to that hazard, and the capacity of the system to cope, adapt, or recover from the effect of those conditions [43]. | Farmers lose their income and food security (loss of livelihood), especially for cooking banana because this one is the crop that provides a stable income. Exposure is related to agroecological conditions. In higher lands, there is less exposure because there are fewer vector insects, also the variety. The capacity to cope/adapt/recover is limited and mostly dependant on the wealth of the farmers and their ability to access off-farm income opportunities. More wealthy farmers have more access to information, and female farmers are more isolated from advice/information/resources (they are more vulnerable). |
| Hazard | A physical event, phenomenon, or human activity that has the potential to cause the loss of life or injuries, property damage, social and economic disruption, or environmental degradation. Its potential can be characterized by its probability (frequency) and intensity (magnitude or severity) [44] | BXW, caused by the bacterium Xanthomonas campestris pv. Musacearum, endangers the livelihoods of millions of farmers in East and Central Africa [42,45] and can result in yield losses up to 100%. BXW is highly transmissible and can spread rapidly through infected plant material, cutting tools, long-distance trade, and vectors such as birds, bats, and insects [17]. |
| Risk perception | Risk perceptions are formed by common-sense reasoning, personal experiences, social communication, and cultural traditions. These are the contextual aspects that individuals consider when deciding whether or not to take a risk and selecting reduction or preventive measures [31,46]. | Beliefs about BXW: some farmers compare it to HIV or apocalypse, and therefore they think it cannot be controlled. Uncertainty: farmers feel they are not in control, and therefore if the plant gets infected, uprooted and then re-planted, it is just to lose it again. Beliefs about the system: farmers know they might be forced to uproot if the plantation is infected, and therefore, they try to hide it. Believes about neighbors: Farmers see a risk in their neighbors’ disease management practices. If the farmer tries to control the disease, but the neighbors do not, they will get the disease anyway. |
| Risk governance system (RGS) | Rules (operational, collective-choice rules, constitutionals), property right regimes (private, public, common, mixed), network structure (centralized, non-centralized) [31]. | Rwanda’s current policy for BXW disease outbreaks prescribes a practice called Complete Mat Uprooting (CMU). It involves uprooting the diseased stem and all lateral stems and shoots (i.e., the entire banana mat) regardless of their infection status. All uprooted material should be buried and covered with soil. Uprooting takes place in an early disease stage to reduce the chances of further disease transmission. In high incidence cases (>70% of the banana mats showing symptoms), the whole plantation must be uprooted [18]. Given its impact on livelihoods, farmers are reluctant to comply, hiding the disease by cutting down symptomatic stems or leaves to avoid enforced uprooting. |
| Direct users | Farmers and households that depend on the livelihood unit. | Banana farmers |
| Collective action problems | Coordination of responses to problems among direct users triggered by social dilemmas, risk perception, or coping capacities. | Increasing exposure to the disease is related to farmers preventive and responding measures because the spreading mechanisms and management strategies interconnect them (cutting flower, disinfecting tools, etc.) socially, ecologically, and geographically. |
| Action Interactions (I) and outcomes (O) | Action situations are where all the action takes place as inputs are transformed by the actions of multiple actors into outcomes [47]. | Plant, pathogen, transmission mechanisms, and different actors’ cultural practices interact to create the conditions for BXW spread. |
| Social, economic, ecological, environmental, and political conditions (SEC) | Economic development, demographic trends, political stability, government (settlement) policies, market incentives, media organizations, the biophysical environment and climatic conditions. | The Rwanda Agriculture and Animal Resources Board (RAB) is responsible for disease prevention, control, monitoring and responding to outbreaks. They work through the different layers of the country’s extension system, reaching down to the level of villages where ‘farmer promoters’ act as elected village extension agents. |
| Related socio-ecological systems (ECO) | Other livelihood systems interlinked to the one in question. | No other linked systems were included in this study. |
| Dashed arrows | These denote feedback from action situations [47]. | NA |
| Dotted-and-dashed lines | These surround the focal SES and are influenced by exogenous factors, which might emerge from dynamic processes at larger or smaller scales, either inside or outside the focal SES [47]. | NA |
References
- Sonnemans, J.; Schram, A.; Offerman, T. Public good provision and public bad prevention: The effect of framing. J. Econ. Behav. Organ. 1998, 34, 143–161. [Google Scholar] [CrossRef]
- Hall, J.C.; Harper, S. Economic and Political Institutions and Development; Springer Nature: Cham, Switzerland, 2019. [Google Scholar]
- Mutavi, F.; Aarts, N.; Van Paassen, A.; Heitkönig, I.; Wieland, B. Techne meets Metis: Knowledge and practices for tick control in Laikipia County, Kenya. NJAS—Wagening. J. Life Sci. 2018, 86–87, 136–145. [Google Scholar] [CrossRef]
- Scholthof, K.-B.G. The disease triangle: Pathogens, the environment and society. Nat. Rev. Genet. 2006, 5, 152–156. [Google Scholar] [CrossRef]
- Mayer, K.H.; Piezer, H.F. (Eds.) The Social Ecology of Infectious Diseases, 1st ed.; Academic Press: London, UK, 2008. [Google Scholar]
- Schlüter, M.; Haider, L.J.; Lade, S.; Lindkvist, E.; Martin, R.; Orach, K.; Wijermans, N.; Folke, C. Capturing emergent phenomena in social-ecological systems: An analytical framework. Ecol. Soc. 2019, 24. [Google Scholar] [CrossRef] [Green Version]
- Bonabeau, E. Agent-based modeling: Methods and techniques for simulating human systems. Proc. Natl. Acad. Sci. USA 2002, 99 (Suppl. 3), 7280–7287. [Google Scholar] [CrossRef] [PubMed] [Green Version]
- Marinescu, D.C. Complex Systems and Self-Organization. Cloud Computing. Morgan Kaufmann; Elseiver: Cambridge, UK, 2013. [Google Scholar]
- Galarza-Villamar, J. Social Capital, Collective Action, and Livelihood Resilience: A Multidimensional Approach; Wageningen University: Gelderland, The Netherlands, 2021. [Google Scholar] [CrossRef]
- Ostrom, E. A diagnostic approach for going beyond panaceas. Proc. Natl. Acad. Sci. USA 2007, 104, 15181–15187. [Google Scholar] [CrossRef] [PubMed] [Green Version]
- Ostrom, E.; Cox, M. Moving beyond panaceas: A multi-tiered diagnostic approach for social-ecological analysis. Environ. Conserv. 2010, 37, 451–463. [Google Scholar] [CrossRef] [Green Version]
- Ostrom, E.; Gardner, R.; Walker, J. Rules, Games, and Common-Pool Resources; University of Michigan Press: Ann Arbor, MI, USA, 1994. [Google Scholar]
- Sosnowska, J.; Skibski, O. Attachment Centrality for Weighted Graphs. In Proceedings of the Twenty-Seventh International Joint Conference on Artificial Intelligence (IJCAI-18), Stockholm, Sweden, 13 July 2018. [Google Scholar]
- Fushimi, T.; Saito, K.; Ikeda, T.; Kazama, K. Estimating node connectedness in spatial network under stochastic link disconnection based on efficient sampling. Appl. Netw. Sci. 2019, 4, 1–24. [Google Scholar] [CrossRef] [Green Version]
- Galarza-Villamar, J.A.; McCampbell, M.; Leeuwis, C.; Cecchi, F. Adding Emergence and Spatiality to a Public Bad Game for Studying Dynamics in Socio-Ecological Systems (Part I): The Design of Musa-Game for Integrative Analysis of Collective Action in Banana Disease Management. Sustainability 2021, in press. [Google Scholar]
- Studholme, D.J.; Wicker, E.; Abrare, S.M.; Aspin, A.; Bogdanove, A.; Broders, K.; Dubrow, Z.; Grant, M.; Jones, J.B.; Karamura, G.; et al. Transfer of Xanthomonas campestris pv. arecae and X. campestris pv. musacearum to X. vasicola (Vauterin) as X. vasicola pv. arecae comb. nov. and X. vasicola pv. musacearum comb. nov. and Description of X. vasicola pv. vasculorum pv. nov. Phytopathology 2020, 110, 1153–1160. [Google Scholar] [CrossRef]
- Tinzaara, W.; Karamura, E.; Kubiriba, J.; Ochola, D.; Ocimati, W.; Blomme, G.; Ssekiwoko, F. The banana Xanthomonas wilt epidemic in east and central Africa: Current research and development efforts. Acta Hortic. 2016, 1114, 267–274. [Google Scholar] [CrossRef]
- Hakizamungu, L.; Rukundo, P.; Muhigirwa, J.C.; Mukamuhirwa, F.; Umfuyisoni, J.; Uzayisenga, B.; Kalisa, J.P. Pest Management Decision Guide: Banana Xanthomonas Wilt (BXW); CABI Plantwise: Wallingford, UK, 2020. [Google Scholar]
- McCampbell, M.; Schut, M.; Bergh, I.V.D.; Van Schagen, B.; Vanlauwe, B.; Blomme, G.; Gaidashova, S.; Njukwe, E.; Leeuwis, C. Xanthomonas Wilt of Banana (BXW) in Central Africa: Opportunities, challenges, and pathways for citizen science and ICT-based control and prevention strategies. NJAS—Wagening. J. Life Sci. 2018, 86–87, 89–100. [Google Scholar] [CrossRef]
- Uwamahoro, F.; Berlin, A.; Bylund, H.; Bucagu, C.; Yuen, J. Management strategies for banana Xanthomonas wilt in Rwanda include mixing indigenous and improved cultivars. Agron. Sustain. Dev. 2019, 39, 22. [Google Scholar] [CrossRef] [Green Version]
- Blomme, G.; Dusingizimana, P.; Ntamwira, J.; Kearsley, E.; Gaidashova, S.; Rietveld, A.; Van Schagen, B.; Ocimati, W. Comparing effectiveness, cost- and time-efficiency of control options for Xanthomonas wilt of banana under Rwandan agro-ecological conditions. Eur. J. Plant Pathol. 2021, 160, 487–501. [Google Scholar] [CrossRef]
- Blomme, G.; Ocimati, W.; Sivirihauma, C.; Vutseme, L.; Mariamu, B.; Kamira, M.; Van Schagen, B.; Ekboir, J.; Ntamwira, J. A control package revolving around the removal of single diseased banana stems is effective for the restoration of Xanthomonas wilt infected fields. Eur. J. Plant Pathol. 2017, 149, 385–400. [Google Scholar] [CrossRef]
- Blomme, G.; Ocimati, W.; Sivirihauma, C.; Lusenge, V.; Bumba, M.; Ntamwira, J. Controlling Xanthomonas wilt of banana: Influence of collective application, frequency of application, and social factors on the effectiveness of the Single Diseased Stem Removal technique in eastern Democratic Republic of Congo. Crop. Prot. 2019, 118, 79–88. [Google Scholar] [CrossRef]
- Generous, N.; Fairchild, G.; Deshpande, A.; Del Valle, S.Y.; Priedhorsky, R. Global Disease Monitoring and Forecasting with Wikipedia. PLoS Comput. Biol. 2014, 10, e1003892. [Google Scholar] [CrossRef] [PubMed]
- Walsham, G. ICT4D research: Reflections on history and future agenda. Inf. Technol. Dev. 2017, 23, 18–41. [Google Scholar] [CrossRef] [Green Version]
- GSMA. Digital Agriculture Maps 2020: State of the Sector in Low and Middle-Income Countries; GSMA Association: London, UK, 2020. [Google Scholar]
- Fabregas, R.; Kremer, M.; Schilbach, F. Realizing the potential of digital development: The case of agricultural advice. Science 2019, 366, eaay3038. [Google Scholar] [CrossRef] [Green Version]
- Arouna, A.; Michler, J.D.; Yergo, W.G.; Saito, K. One Size Fits All? Experimental Evidence on the Digital Delivery of Personalized Extension Advice in Nigeria. Am. J. Agric. Econ. 2021, 103, 596–619. [Google Scholar] [CrossRef]
- Wennink, B.; Mur, R. Twigire Muhinzi Reflection Paper; Ministry of Agriculture and Animal Resources, and The Belgian Development Agency: Kigali, Rwanda, 2016. [Google Scholar]
- MINAGRI. National ICT4RAg Strategy (2016–2020); Ministry of Agriculture and Animal Resources: Kigali, Rwanda, 2016. [Google Scholar]
- Van Asselt, M.B.; Renn, O. Risk governance. J. Risk Res. 2011, 14, 431–449. [Google Scholar] [CrossRef]
- IRGC. Risk Governance Deficits: An Analysis and Illustration of the Most Common Deficits in Risk Governance; International Risk Governance Council: Geneva, Switzerland, 2008. [Google Scholar]
- ArcGis. An Overview of the Neighborhood Toolset. ArcMap 10.3. (n.d.). Available online: https://desktop.arcgis.com/en/arcmap/10.3/tools/spatial-analyst-toolbox/an-overview-of-the-neighborhood-tools.htm (accessed on 20 August 2020).
- Damtew, E.; Leeuwis, C.; Struik, P.C.; Cecchi, F.; van Mierlo, B.; Lie, R.; Lemaga, B.; Cieslik, K. Communicative interventions for collective action in the management of potato late blight: Evidence from a framed field game experiment in Ethiopia. Food Secur. 2021, 13, 255–271. [Google Scholar] [CrossRef]
- Barua, Z.; Barua, S.; Aktar, S.; Kabir, N.; Li, M. Effects of misinformation on COVID-19 individual responses and recommendations for resilience of disastrous consequences of misinformation. Prog. Disaster Sci. 2020, 8, 100119. [Google Scholar] [CrossRef]
- Pennycook, G.; McPhetres, J.; Zhang, Y.; Lu, J.G.; Rand, D.G. Fighting COVID-19 Misinformation on Social Media: Experimental Evidence for a Scalable Accuracy-Nudge Intervention. Psychol. Sci. 2020, 31, 770–780. [Google Scholar] [CrossRef]
- Tafesse, S.; Van Mierlo, B.; Leeuwis, C.; Lie, R.; Lemaga, B.; Struik, P.C. Combining experiential and social learning approaches for crop disease management in a smallholder context: A complex socio-ecological problem. Socio-Ecol. Pr. Res. 2020, 2, 265–282. [Google Scholar] [CrossRef]
- Cieslik, K.; Cecchi, F.; Damtew, E.A.; Tafesse, S.; Struik, P.C.; Lemaga, B.; Leeuwis, C. The role of ICT in collective management of public bads: The case of potato late blight in Ethiopia. World Dev. 2021, 140, 105366. [Google Scholar] [CrossRef]
- Munthali, N. Innovation Intermediation in a Digital Age: Broadening Extension Service Delivery in Ghana; Wageningen University: Gelderland, The Netherlands, 2021. [Google Scholar]
- Trendov, N.M.; Varas, S.; Zeng, M. Digital Technologies in Agriculture and Rural Areas—Status Report; FAO: Rome, Italy, 2019. [Google Scholar]
- Van Der Waals, J.; Denner, F.; Van Rij, N.; Korsten, L. Evaluation of PLANT-Plus, a decision support system for control of early blight on potatoes in South Africa. Crop. Prot. 2003, 22, 821–828. [Google Scholar] [CrossRef]
- Nkuba, J.; Tinzaara, W.; Night, G.; Niko, N.; Jogo, W.; Ndyetabula, I.; Mukandala, L.; Ndayihazamaso, P.; Niyongere, C.; Gaidashova, S.; et al. Adverse impact of Banana Xanthomonas Wilt on farmers’ livelihoods in Eastern and Central Africa. Afr. J. Plant. Sci. 2015, 9, 279–286. [Google Scholar]
- Turner, B.L.; Kasperson, R.E.; Matson, P.A.; McCarthy, J.J.; Corell, R.W.; Christensen, L.; Eckley, N.; Kasperson, J.X.; Luers, A.; Martello, M.L.; et al. A framework for vulnerability analysis in sustainability science. Proc. Natl. Acad. Sci. USA 2003, 100, 8074–8079. [Google Scholar] [CrossRef] [Green Version]
- Blaikie, P.; Cannon, T.; Davis, I.; Wisner, B. At Risk: Natural Hazards, People’s Vulnerability and Disasters; Routledge: London, UK, 1994. [Google Scholar]
- Tripathi, L.; Mwangi, M.; Aritua, V.; Tushemereirwe, W.K.; Abele, S.; Bandyopadhyay, R. Xanthomonas Wilt: A threat to Banana Production in East and Central Africa. Plant. Dis. 2009, 93. [Google Scholar] [CrossRef] [Green Version]
- Wachinger, G.; Renn, O.; Begg, C.; Kuhlicke, C. The Risk Perception Paradox-Implications for Governance and Communication of Natural Hazards. Risk Anal. 2012, 33, 1049–1065. [Google Scholar] [CrossRef] [PubMed]
- McGinnis, M.D.; Ostrom, E. Social-ecological system framework: Initial changes and continuing challenges. Ecol. Soc. 2014, 19. [Google Scholar] [CrossRef] [Green Version]


| Treatment | Boards | Description | Village | Part of ICT4BXW Project Intervention | Code Treatment/ ICT4BXW/ Board | N. Players |
|---|---|---|---|---|---|---|
| T1.a | Board 1 | Non comm. | Muzizi | Yes (a) | T1.a.b1 | 12 |
| Board 2 | T1.a.b2 | |||||
| Board 3. | T1.a.b3 | |||||
| T2.a | Board 1 | Preventive comm. | Kamajigija | Yes (a) | T2.a.b1 | 12 |
| Board 2 | T2.a.b2 | |||||
| Board 3. | T2.a.b3 | |||||
| T3.a | Board 1 | Preventive and responsive comm. | Kinunga II | Yes (a) | T3.a.b1 | 12 |
| Board 2 | T3.a.b2 | |||||
| Board 3. | T3.a.b3 | |||||
| T3.b | Board 1 | Preventive and responsive comm. | Butimba II | No (b) | T3.b.b1 | 12 |
| Board 2 | T3.b.b2 | |||||
| Board 3. | T3.b.b3 | |||||
| Total | 12 boards | 3 treatments | 4 villages | 48 | ||
| 12 games |
| Dependent Variables | Independent Variables | Controlled Dynamic Variables |
|---|---|---|
| Individual profit outcome | Risk communication: none; preventative; responsive; preventative and responsive. | Farmer game rules |
| Collective profit outcome | Insect vector game rules | |
| Decision to cut male flower (0 or 2 flowers per round) | Monitor inspection game rules | |
| Decision to either cut male flower (0 or 2 per round) or uproot one infected mat. | Rules in the progression of the disease through the progress of time. |
| Treatment 2.a: Preventive (26) | Treatment 3.a: Preventive-Responsive (28) | |||||||||||
|---|---|---|---|---|---|---|---|---|---|---|---|---|
| a | T2.a | r1 | r2 | r3 | r4 | r5 | T4.a | r1 | r2 | r3 | r4 | r5 |
| P1 | 23,100 | 20,300 | 19,800 | 17,000 | 16,500 | P1 | 23,100 | 20,300 | 19,800 | 19,600 | 19,500 | |
| P2 | 23,100 | 22,900 | 22,700 | 22,500 | 22,500 | P2 | 23,100 | 22,900 | 22,700 | 22,500 | 22,500 | |
| P3 | 23,100 | 22,900 | 22,700 | 22,500 | 22,500 | P3 | 23,100 | 22,900 | 20,100 | 19,600 | 19,500 | |
| P4 | 20,500 | 20,000 | 17,200 | 17,000 | 16,500 | P4 | 20,500 | 20,000 | 19,800 | 17,000 | 16,500 | |
| Mean | 22,450 | 21,525 | 20,600 | 19,750 | 19,500 | Mean | 22,450 | 21,525 | 20,600 | 19,675 | 19,500 | |
| Sum | 89,800 | 86,100 | 82,400 | 79,000 | 78,000 | Sum | 89,800 | 86,100 | 82,400 | 78,700 | 78,000 | |
| Stdv. | 1300 | 1592 | 2647 | 3175 | 3464 | Stdv. | 1300 | 1592 | 1407 | 2247 | 2449 | |
| b |  |  | ||||||||||
| c |  |  | ||||||||||
| Social Dilemma | Players (farmers) face the dilemma of either taking a preventive/control action (investment) against BXW, which could potentially harm themselves and others. The dilemma, shaping actions, includes when (game-round) and where (location on the gameboard) to act. |
| Risk Perception | Players’ perceived risk of disease infection and punishment (monitor) influences the decision about when and where to act. |
| Coping Capacity | Players’ decisions to act (accurately and timely) are influenced by resource availability, especially capital, information, and knowledge. |
Publisher’s Note: MDPI stays neutral with regard to jurisdictional claims in published maps and institutional affiliations. |
© 2021 by the authors. Licensee MDPI, Basel, Switzerland. This article is an open access article distributed under the terms and conditions of the Creative Commons Attribution (CC BY) license (https://creativecommons.org/licenses/by/4.0/).
Share and Cite
Galarza-Villamar, J.A.; McCampbell, M.; Galarza-Villamar, A.; Leeuwis, C.; Cecchi, F.; Galarza-Rodrigo, J. A Public Bad Game Method to Study Dynamics in Socio-Ecological Systems (Part II): Results of Testing Musa-Game in Rwanda and Adding Emergence and Spatiality to the Analysis. Sustainability 2021, 13, 9353. https://doi.org/10.3390/su13169353
Galarza-Villamar JA, McCampbell M, Galarza-Villamar A, Leeuwis C, Cecchi F, Galarza-Rodrigo J. A Public Bad Game Method to Study Dynamics in Socio-Ecological Systems (Part II): Results of Testing Musa-Game in Rwanda and Adding Emergence and Spatiality to the Analysis. Sustainability. 2021; 13(16):9353. https://doi.org/10.3390/su13169353
Chicago/Turabian StyleGalarza-Villamar, Julissa Alexandra, Mariette McCampbell, Andres Galarza-Villamar, Cees Leeuwis, Francesco Cecchi, and John Galarza-Rodrigo. 2021. "A Public Bad Game Method to Study Dynamics in Socio-Ecological Systems (Part II): Results of Testing Musa-Game in Rwanda and Adding Emergence and Spatiality to the Analysis" Sustainability 13, no. 16: 9353. https://doi.org/10.3390/su13169353