
Thermal Behavior in Glass Houses through the Analysis of Scale Models


Abstract
:1. Introduction
2. Methods
2.1. Preliminary Theoretical Analysis of Passive Strategies in Buildings
2.2. Experimental Model
2.3. Monitoring Model
3. Results and Discussion
3.1. Experimental Data of Ambient Temperatures
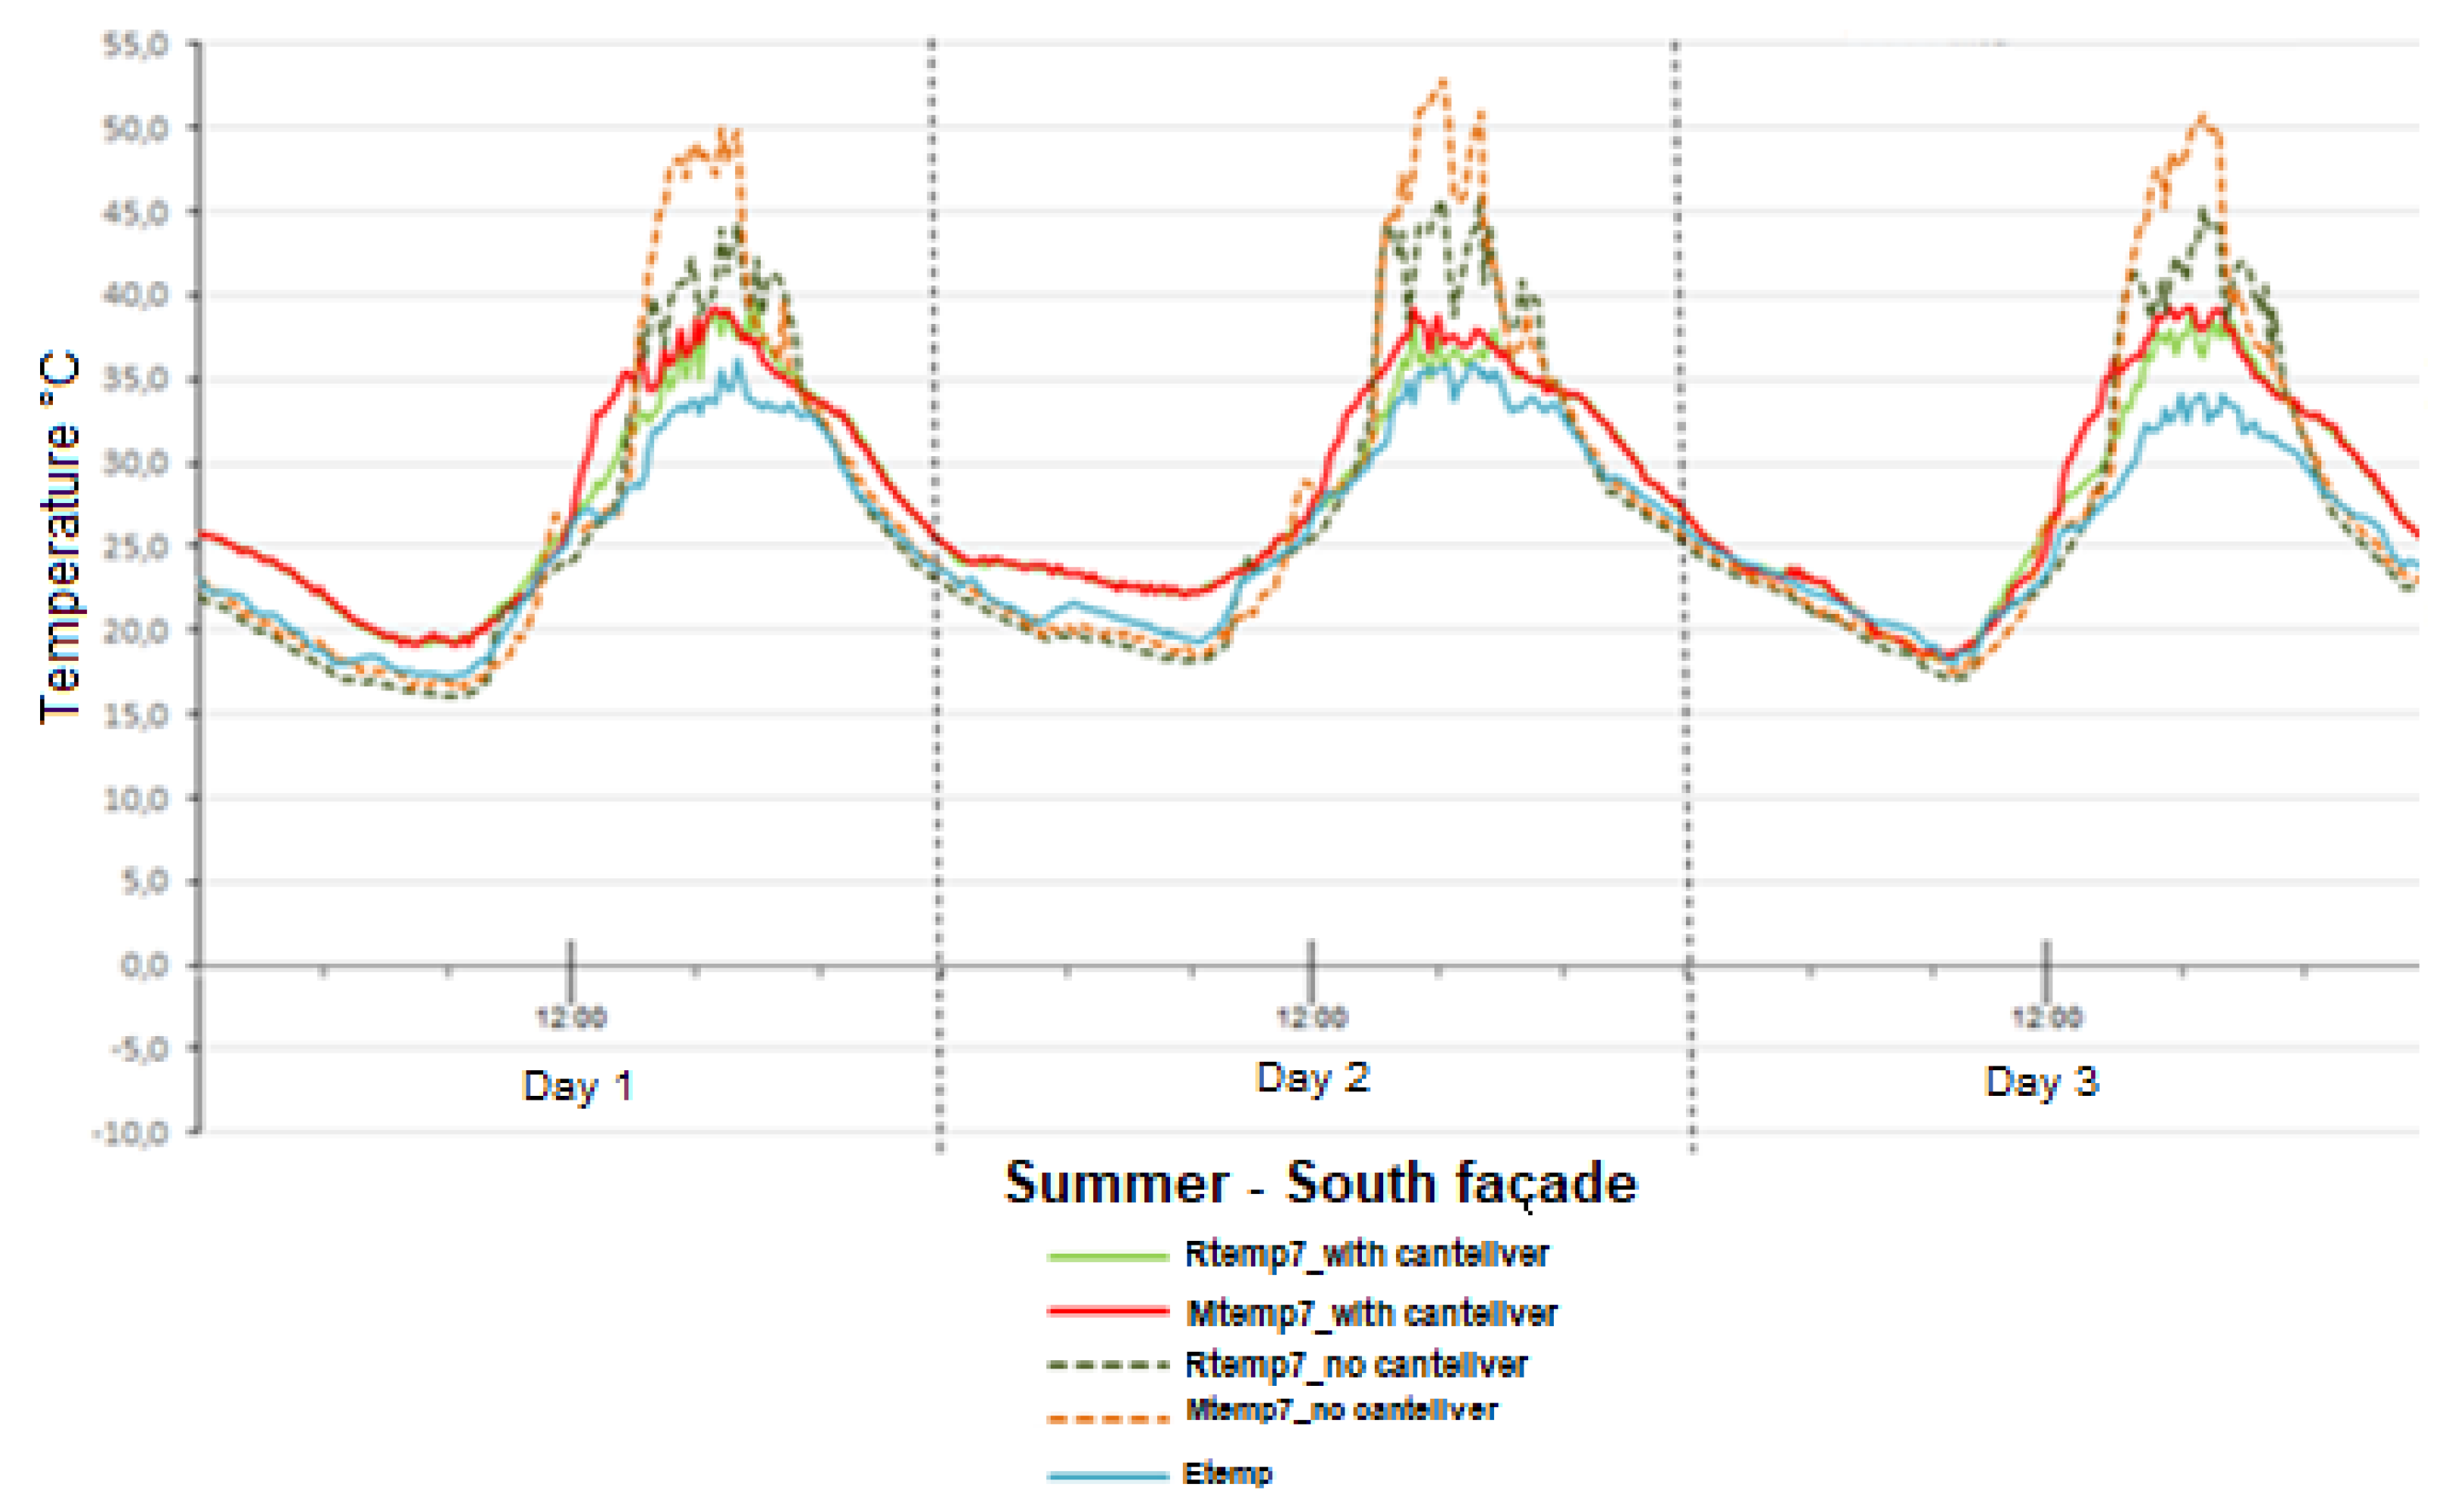
3.2. Experimental Data of Surface Temperatures
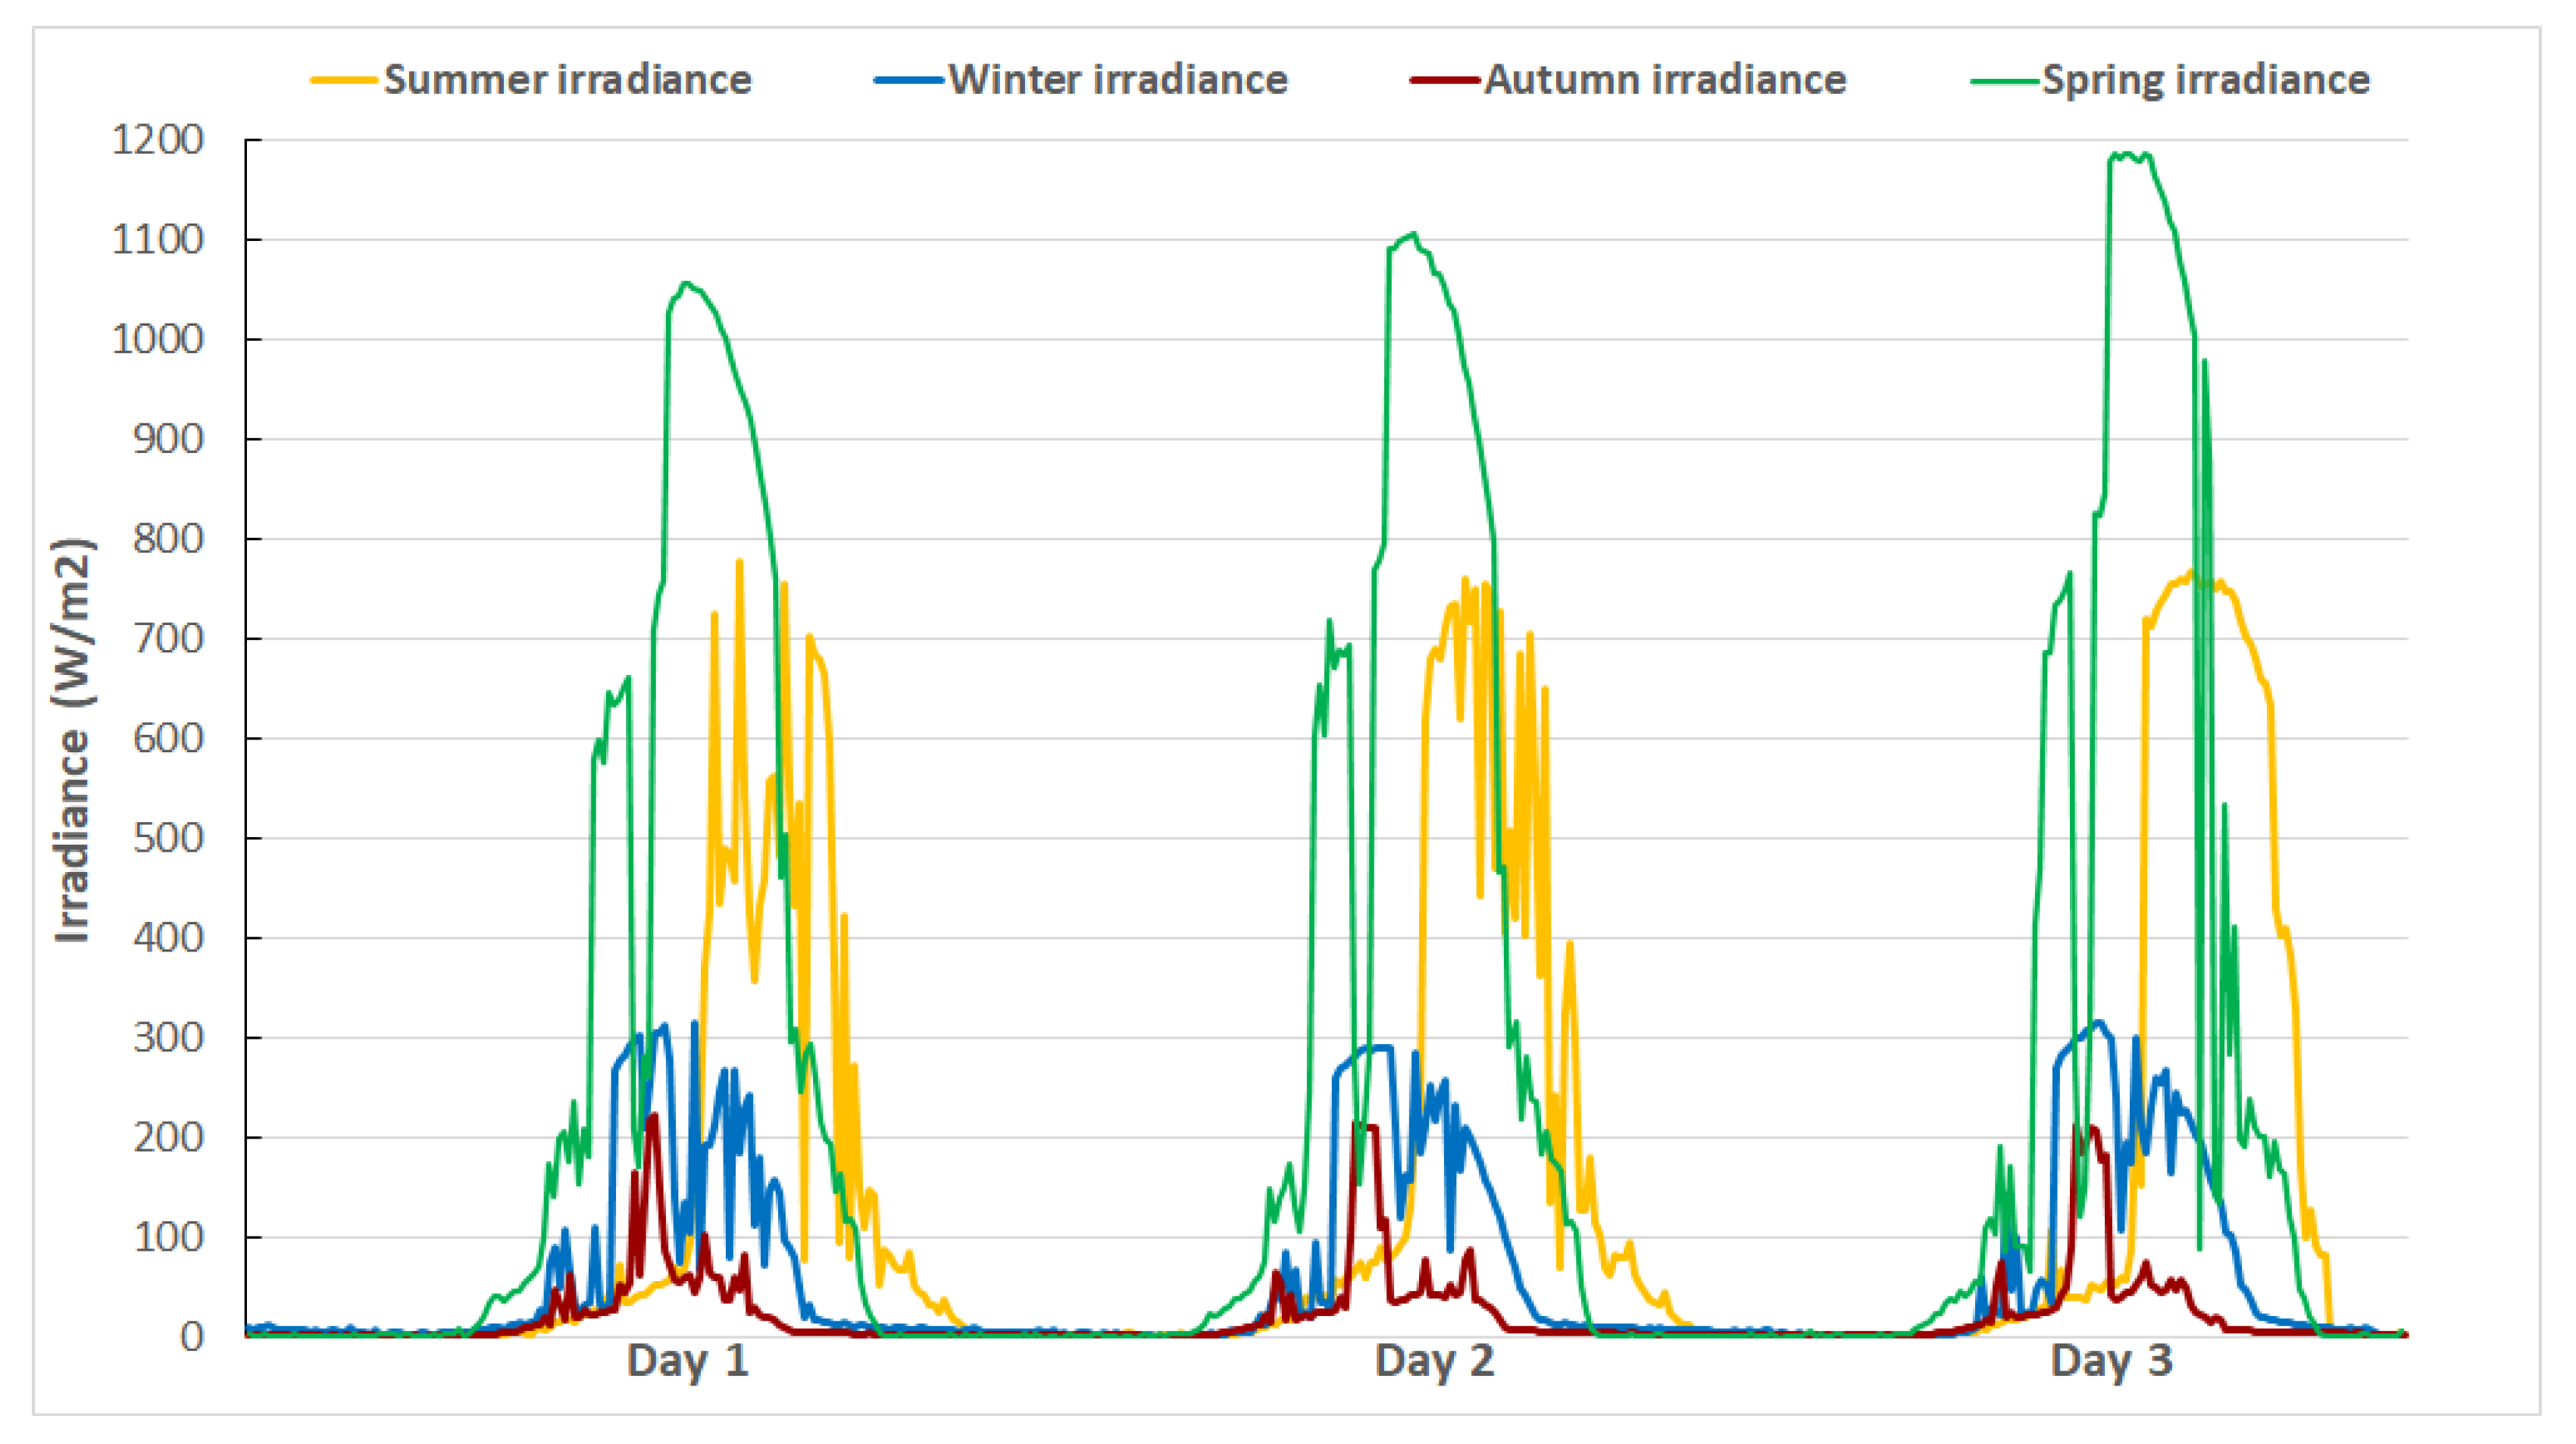
3.3. Experimental Data on Solar Radiation
4. Conclusions
Author Contributions
Funding
Institutional Review Board Statement
Informed Consent Statement
Conflicts of Interest
References
- Tian, X.; Li, B.; Ma, Y.; Liu, D.; Li, Y.; Cheng, Y. Experimental study of local thermal comfort and ventilation performance for mixing, displacement and stratum ventilation in an office. Sustain. Cities Soc. 2019, 50, 101630. [Google Scholar] [CrossRef]
- Parlamento y Consejo de la Unión Europea. Directiva 2009/28/CE del Parlamento Europeo y del Consejo de 23 de abril de 2009. Diario Oficial Unión Europea 2009, 140, 16–62. [Google Scholar]
- Ding, S.; Dang, Y.G.; Li, X.M.; Wang, J.J.; Zhao, K. Forecasting Chinese CO2 emissions from fuel combustion using a novel grey multivariable model. J. Clean. Prod. 2017, 162, 1527–1538. [Google Scholar] [CrossRef]
- Rodrigo, F.S. New documentary data on the climate in Southern Spain from 1792 to 1808. Geogr. Res. Lett. 2020, 46, 545–561. [Google Scholar] [CrossRef] [Green Version]
- Díaz-López, C.; Jódar, J.; Verichev, K.; Rodríguez, M.L.; Carpio, M.; Zamorano, M. Dynamics of Changes in Climate Zones and Building Energy Demand. A Case Study in Spain. Appl. Sci. 2021, 11, 4261. [Google Scholar] [CrossRef]
- Aldabesh, A.; Soufi, J.; Omer, S.; Haredy, A. Unlocking the Residential Retrofitting Potential in a Three-Degree World: A Holistic Approach to Passive Design in Hot Climates. Buildings 2021, 11, 228. [Google Scholar] [CrossRef]
- Overen, O.K.; Meyer, E.L.; Makaka, G. Indoor Daylighting and Thermal Response of a Passive Solar Building to Selective Components of Solar Radiation. Buildings 2021, 11, 34. [Google Scholar] [CrossRef]
- Balode, L.; Dolge, K.; Blumberga, D. The Contradictions between District and Individual Heating towards Green Deal Targets. Sustainability 2021, 13, 3370. [Google Scholar] [CrossRef]
- Echarri-Iribarren, V.; Wong, N.H.; Sánchez-Ostiz, A. Radiant Floors versus Radiant Walls Using Ceramic Thermal Panels in Mediterranean Dwellings: Annual Energy Demand and Cost-Effective Analysis. Sustainability 2021, 13, 588. [Google Scholar] [CrossRef]
- Chialastri, A.; Isaacson, M. Performance and optimization of a BIPV/T solar air collector for building fenestration applications. Energy Build. 2017, 150, 200–210. [Google Scholar] [CrossRef]
- Steininger, P.; Gaderer, M.; Steffens, O.; Dawoud, B. Experimental and Numerical Study on the Heat Transfer Characteristics of a Newly-Developed Solar Active Thermal Insulation System. Buildings 2021, 11, 123. [Google Scholar] [CrossRef]
- Mosey, G.; Deal, B. Optimizing Multi-Family Building Massing for Affordability and Envelope Performance: An Investigation of the Trade-Offs Implicit in Low Rise Residential Buildings. Buildings 2021, 11, 99. [Google Scholar] [CrossRef]
- Yin, R.; Xu, P.; Shen, P. Case study: Energy savings from solar window film in two commercial buildings in Shanghai. Energy Build. 2012, 45, 132–140. [Google Scholar] [CrossRef]
- Sáiz, J.L.E. Análisis sobre el almacenamiento térmico en la edificación (Analysis of the thermal storage in construction). Inf. Construcción 1991, 43, 81–96. [Google Scholar]
- Cannavale, A.; Ierardi, L.; Hörantner, M.; Eperon, G.E.; Snaith, H.J.; Ayr, U.; Martellotta, F. Improving energy and visual performance in offices using building integrated perovskite-based solar cells: A case study in Southern Italy. Appl. Energy 2017, 205, 834–846. [Google Scholar] [CrossRef]
- Vujošević, M.; Krstić-Furundžić, A. The influence of atrium on energy performance of hotel building. Energy Build. 2017, 156, 140–150. [Google Scholar] [CrossRef] [Green Version]
- Kumar, G.K.; Babu, T.A. Study of Various Glass Materials to Provide Adequate Day Lighting in Office Buildings of Warm and Humid Climatic Zone in India. Energy Procedia 2017, 109, 181–189. [Google Scholar] [CrossRef]
- Hatt, T.; Saelzer, G.; Hempel, R.; Gerber, A. Alto confort interior con minimo consumo energetico a partir de la implementacion del estandar “Passivhaus” en Chile. Rev. Constr. 2012, 11, 123–134. [Google Scholar] [CrossRef]
- Banihashemi, S.; Golizadeh, H.; Hosseini, M.R.; Shakouri, M. Climatic, arametric and non-parametric analysis of energy performance of double-glazed windows in different climates. Int. J. Sustain. Built Environ. 2015, 4, 307–322. [Google Scholar] [CrossRef] [Green Version]
- Xamán, J.; Jiménez-Xamán, C.; Álvarez, G.; Zavala-Guillén, I.; Hernández-Pérez, I.; Aguilar, J.O. Thermal performance of a double pane window with a solar control coating for warm climate of Mexico. Appl. Therm. Eng. 2016, 106, 257–265. [Google Scholar] [CrossRef]
- Sarigiannis, D.A. Combined or multiple exposure to health stressors in indoor built environments. In Proceedings of the World Health Organization Report for Europe, Bonn, Germany, 6–18 October 2013. [Google Scholar]
- Lepore, E.; Benito, A.; Ramírez, C.; Viccione, G. Indoors ventilation in times of confinement by SARS-CoV-2 epidemic: A comparative approach between Spain and Italy. Sustain. Cities Soc. 2021, 72, 103051. [Google Scholar] [CrossRef] [PubMed]
- Grynning, S.; Gustavsen, A.; Time, B.; Jelle, B.P. Windows in the Buildings of Tomorrow; Energy Losers or Energy Gainers? Energy Build. 2013, 61, 185–192. [Google Scholar] [CrossRef]
- Lirola, J.M.; Castañeda, E.; Lauret, B.; Khayet, M. A review on experimental research using scale models for buildings: Application and methodologies. Energy Build. 2017, 142, 72–110. [Google Scholar] [CrossRef] [Green Version]
- Luján, S.V.; Arrebola, C.V.; Sánchez, A.R.; Benito, A.; Cortina, M.G. Experimental comparative study of the thermal performance of the façade of a building refurbished using ETICS, and quantification of improvements. Sustain. Cities Soc. 2019, 51, 101713. [Google Scholar] [CrossRef]
- Aguilera, P.; Viñas, C.; Rodríguez, A.; Varela, S. Análisis de la influencia, en la demanda de climatización, de estrategias pasivas en viviendas con grandes superficies acristaladas, mediante un código de simulación. La casa Farnsworth = Analysis of the influence, in climate control demand, of passive st. Anales Edificación 2018, 4, 34. [Google Scholar] [CrossRef]
- Puertolas, R.F.; Gonzalez, J.C.L.; Castro, S.S.; Benito, A.; Arrebola, C.V. A bioclimatic building in Madrid: Analysis of the thermal response and long-term comfort indices review. Dev. Built Environ. 2020, 3, 100015. [Google Scholar] [CrossRef]
- Porras-Amores, C.; Mazarrón, F.R.; Cañas, I. Study of the Vertical Distribution of Air Temperature in Warehouses. Energies 2014, 7, 1193–1206. [Google Scholar] [CrossRef] [Green Version]
- Fries, W.A.; Rakhshan, K. A review of passive envelope measures for improved building energy efficiency in the UAE. Renew. Sustain. Energy Rev. 2017, 72, 485–496. [Google Scholar] [CrossRef]
- Chen, X.; Yang, H.; Wang, Y. Parametric study of passive design strategies for high-rise residential buildings in hot and humid climates: Miscellaneous impact factors. Renew. Sustain. Energy Rev. 2017, 69, 442–460. [Google Scholar] [CrossRef]
- Kumar, G.K.; Saboor, S.; Babu, T.A. Study of Various Glass Window and Building Wall Materials in Different Climatic Zones of India for Energy Efficient Building Construction. Energy Procedia 2017, 138, 580–585. [Google Scholar] [CrossRef]
- Cuce, E.; Cuce, M. Vacuum glazing for highly insulating windows: Recent developments and future prospects. Renew. Sustain. Energy Rev. 2016, 54, 1345–1357. [Google Scholar] [CrossRef]
- Aste, N.; Buzzetti, M.; del Pero, C.; Leonforte, F. Glazing’s techno-economic performance: A comparison of window features in office buildings in different climates. Energy Build. 2018, 159, 123–135. [Google Scholar] [CrossRef]
- Gil-Lopez, T.; Gimenez-Molina, C. Environmental, economic and energy analysis of double glazing with a circulating water chamber in residential buildings. Appl. Energy 2013, 101, 572–581. [Google Scholar]
- Xamán, J.; Olazo-Gómez, Y.; Zavala-Guillén, I.; Hernández-Pérez, I.; Aguilar, J.O.; Hinojosa, J.F. Thermal evaluation of a Room coupled with a Double Glazing Window with/without a solar control film for Mexico. Appl. Therm. Eng. 2017, 110, 805–820. [Google Scholar] [CrossRef]
- Ascione, F.; Bianco, N.; de Stasio, C.; Mauro, G.M.; Vanoli, G. A new comprehensive approach for cost-optimal building design integrated with the multi-objective model predictive control of HVAC systems. Sustain. Cities Soc. 2017, 31, 136–150. [Google Scholar] [CrossRef]
- Fazel, A.; Izadi, A.; Azizi, M. Low-cost solar thermal based adaptive window: Combination of energy-saving and self-adjustment in buildings. Sol. Energy 2016, 133, 274–282. [Google Scholar] [CrossRef]
- Ortiz, J.; Casas, A.F.I.; Salom, J.; Soriano, N.G.; i Casas, F. Cost-effective analysis for selecting energy efficiency measures for refurbishment of residential buildings in Catalonia. Energy Build. 2016, 128, 442–457. [Google Scholar] [CrossRef] [Green Version]
- Santamaría, J.; Girón, S.; Campano, M.A. Economic assessments of passive thermal rehabilitations of dwellings in Mediterranean climate. Energy Build. 2016, 128, 772–784. [Google Scholar] [CrossRef]
- Vandenberg, M. Farnsworth House: Ludwig Mies van der Rohe; Phaidon Press: New York, NY, USA, 2005. [Google Scholar]
- Archives at the Museum of Modern. Global Architecture Detail; ADA Edita: New York, NY, USA, 1976. [Google Scholar]
- Etheridge, M.S.D. Building Ventilation: Theory and Measurement; John Wiley & Sons: Hoboken, NJ, USA, 1996. [Google Scholar]
- Walker, C.; Tan, G.; Glicksman, L. Reduced-scale building model and numerical investigations to buoyancy-driven natural ventilation. Energy Build. 2011, 43, 2404–2413. [Google Scholar] [CrossRef]
- AENOR. UNE-EN 410. Vidrio para la Edificación; AENOR: Madrid, Spain, 2011. [Google Scholar]
- Benito, A. Optimización Del Comportamiento Energético Y Lumínico En Edificios Singulares De Vidrio a Través De Modelos a Escala; Universidad Politecnica de Madrid: Madrid, Spain, 2020. [Google Scholar]
- Martín-Consuegra, F.; de Frutos, F.; Oteiza, I.; Alonso, C.; Frutos, B. Minimal Monitoring of Improvements in Energy Performance after Envelope Renovation in Subsidized Single Family Housing in Madrid. Sustainability 2021, 13, 235. [Google Scholar] [CrossRef]
- Frota de Albuquerque Landi, F.; Fabiani, C.; Pisello, A.L. Experimental Winter Monitoring of a Light-Weight Green Roof Assembly for Building Retrofit. Sustainability 2021, 13, 4604. [Google Scholar] [CrossRef]
- Tran, L.N.; Gao, W.; Ge, J. Sensitivity analysis of household factors and energy consumption in residential houses: A multi-dimensional hybrid approach using energy monitoring and modeling. Energy Build. 2021, 239, 110864. [Google Scholar] [CrossRef]
- International Standard. ISO 7726 Ergonomics of the Thermal Environment—Instruments for Measuring Physical Quantities. Spain; 2004; Available online: https://www.iso.org/standard/14562.html (accessed on 14 July 2021).


| Month | Reference Model (from Dawn to:) | Improved Model (from Dawn to:) |
|---|---|---|
| March and September | 6:30 a.m. | 9:00 a.m. |
| April and August | 7:30 a.m. | 9:45 a.m. |
| May and July | 8:30 a.m. | 10:15 a.m. |
| June | 9:30 a.m. | 10:30 a.m. |
| Model | Orientation | Glass Type | Total Solar Transmission SHGC “g” (%) | Direct Solar Transmission (%) | U Value (ISO 10292) (W/m2·K) |
|---|---|---|---|---|---|
| Reference | All | 6 mm single glass (clear float glass) | 86.0 | 89.0 | 5.7 |
| Improved | North | Double glass (conventional DA) | 77.1 | 81.9 | 2.7 |
| South, east, and west | Double glass + SCL (SunGuard Solar Neutral 67) | 58.8 | 61.0 | 2.6 |
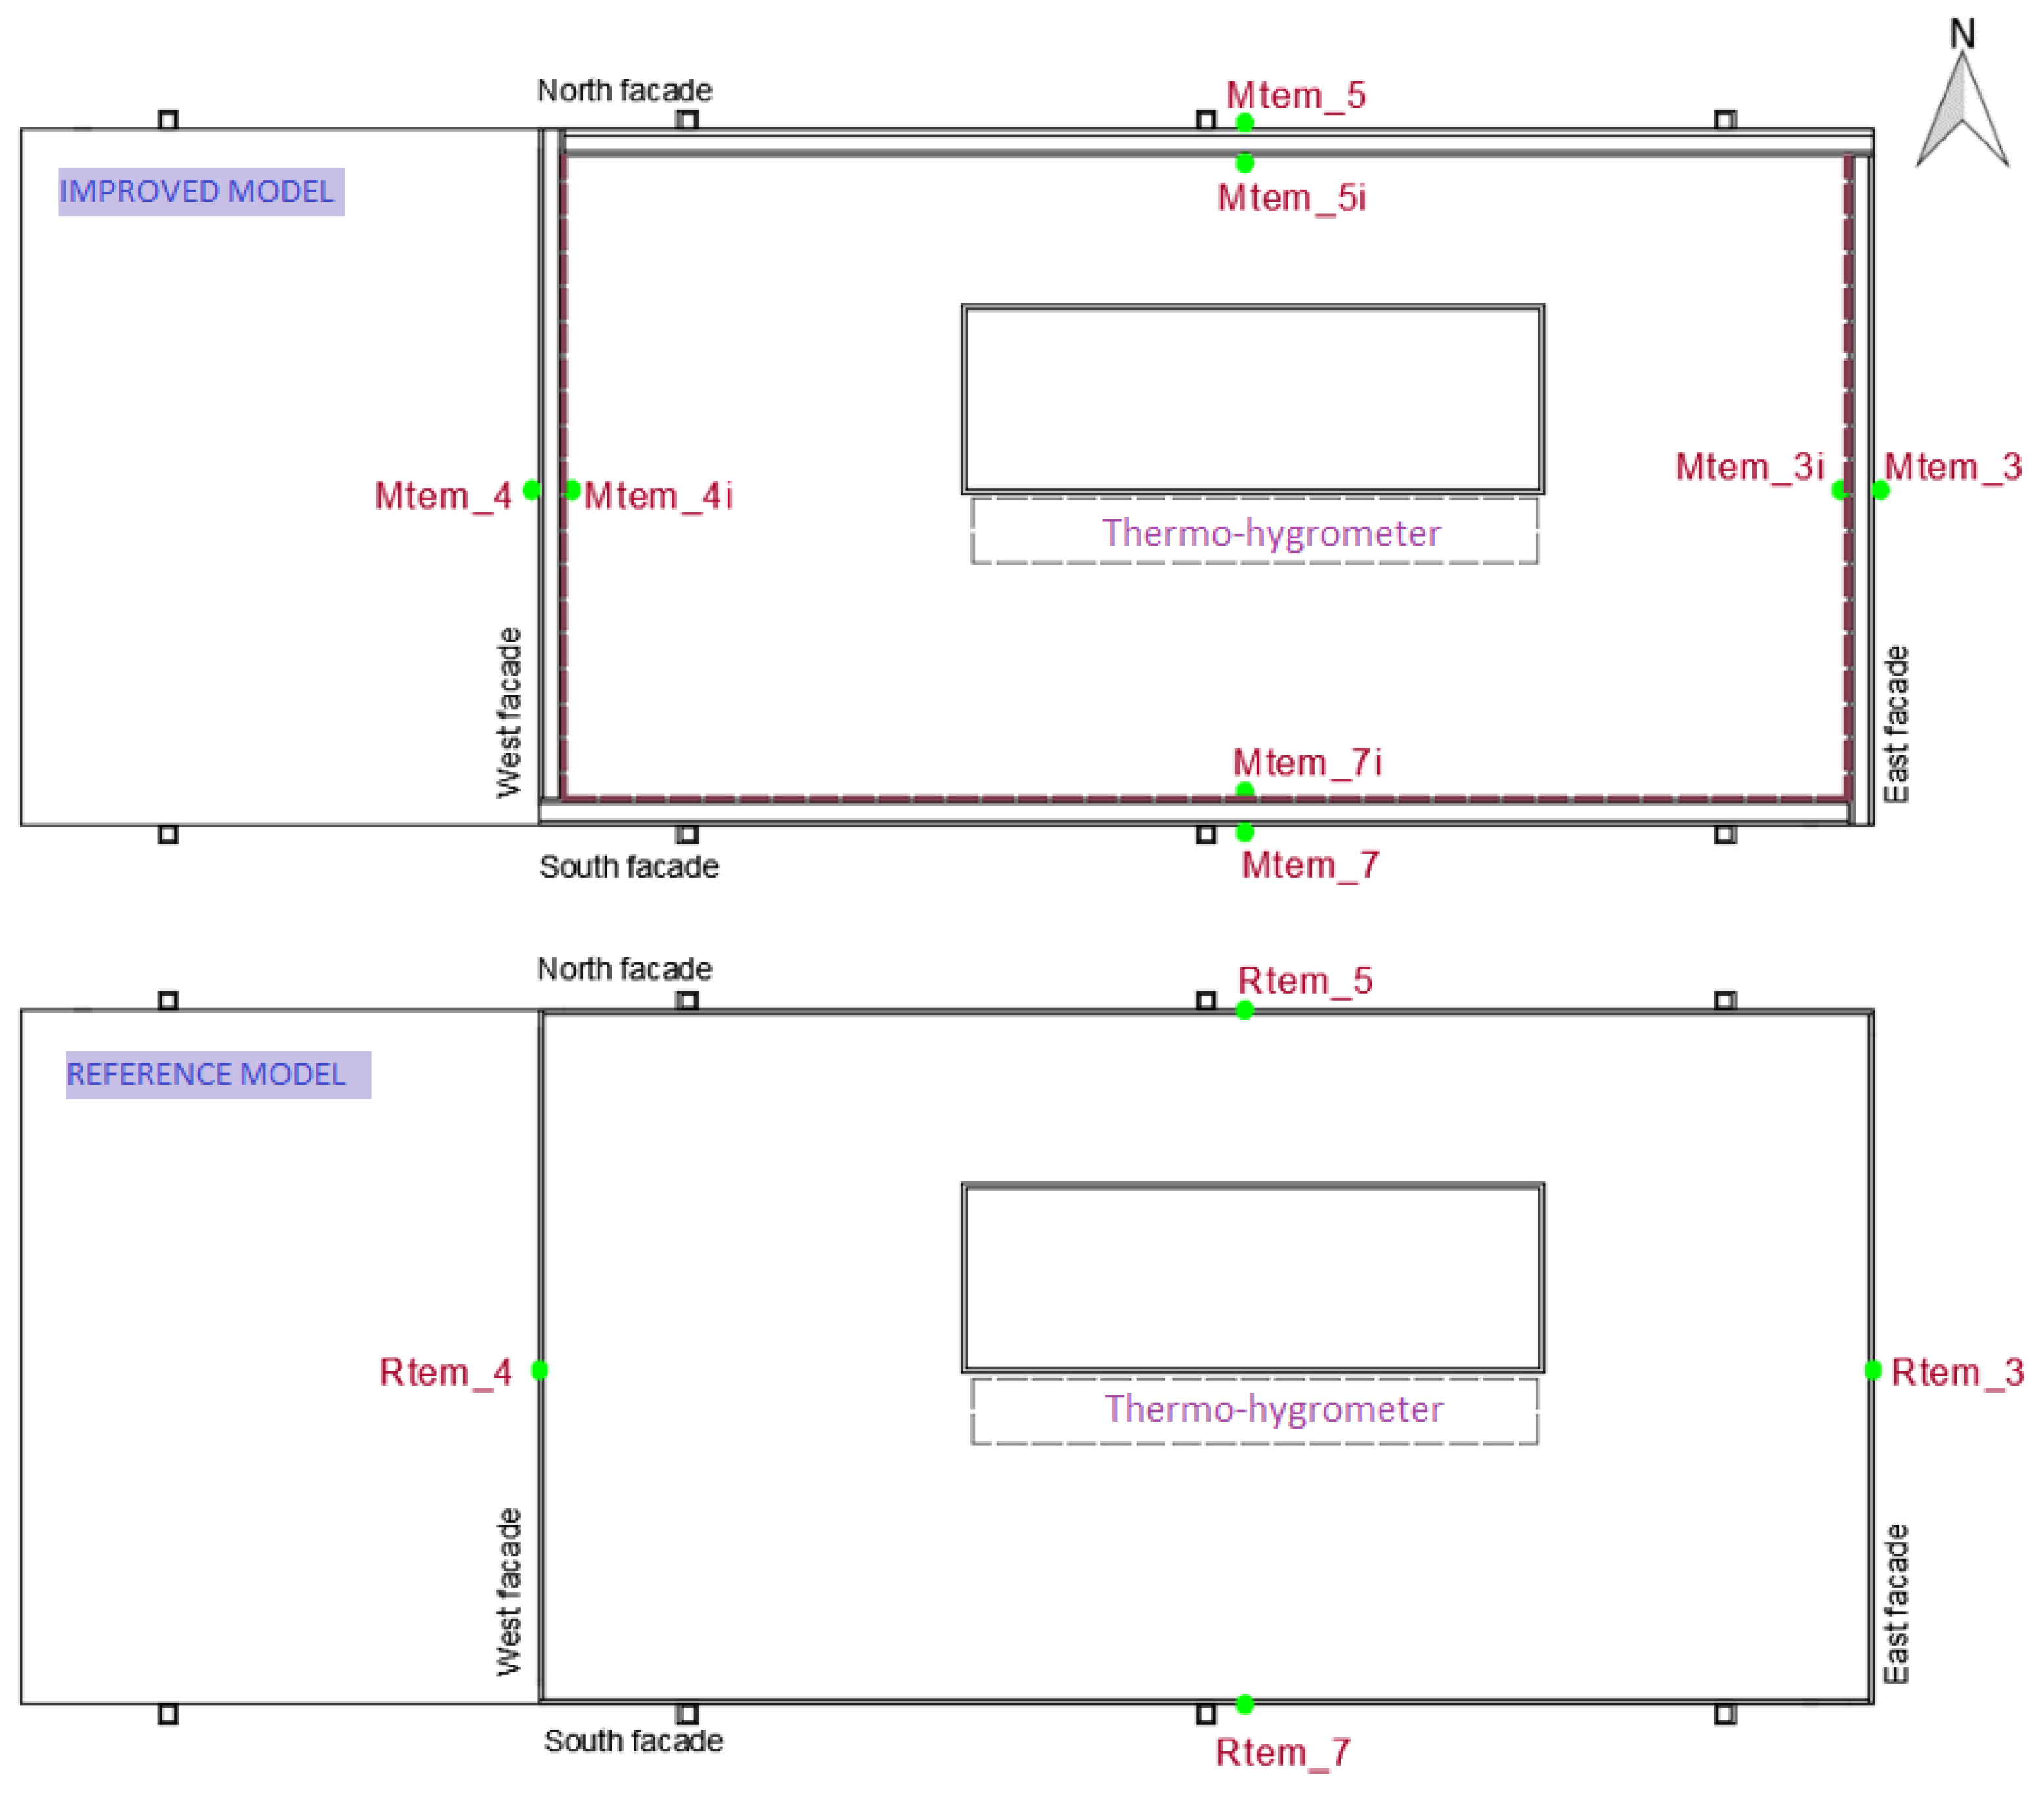
| Model | Units | Type of Sensor | Position |
|---|---|---|---|
| Reference | 4 | Thermocouple type K | One in each orientation |
| 1 | OPUS 20 + CO2 thermo-hygrometer | One located inside the scale model | |
| Improved | 8 | Thermocouple type K | Two in each orientation located inside and outside the glass |
| 1 | OPUS 20 + CO2 thermo-hygrometer | One located inside the scale model |
| Model | r (Tª Inside/Tª Outside) | R2 (%) (Tª Inside/Tª Outside) | |
|---|---|---|---|
| No Cantilever | Reference | 0.961914 | 92.527931 |
| Improved | 0.961174 | 92.385462 | |
| With Cantilever | Reference | 0.718107 | 51.567833 |
| Improved | 0.643541 | 41.414518 |
| Season | Average Outside Surface Temperature (°C) | Average Inside Surface Temperature (°C) | Average Difference between Exterior and Interior Surface Temperatures (°C) |
|---|---|---|---|
| Autumn | 7.59 | 9.34 | −1.75 |
| Spring | 20.53 | 22.97 | −2.44 |
| Winter | 4.97 | 8.01 | −3.04 |
| Summer, cantilever | 27.78 | 28.96 | −1.18 |
| Summer, no cantilever | 25.62 | 27.58 | −1.96 |
| Season | Average Outside Surface Temperature (°C) | Average Inside Surface Temperature (°C) | Average Difference between Exterior and Interior Surface Temperatures (°C) |
|---|---|---|---|
| Autumn | 10.37 | 12.00 | −1.63 |
| Spring | 22.88 | 24.83 | −1.95 |
| Winter | 9.75 | 11.70 | −1.95 |
| Summer, cantilever | 28.10 | 29.02 | −0.92 |
| Summer, no cantilever | 27.88 | 29.51 | −1.63 |
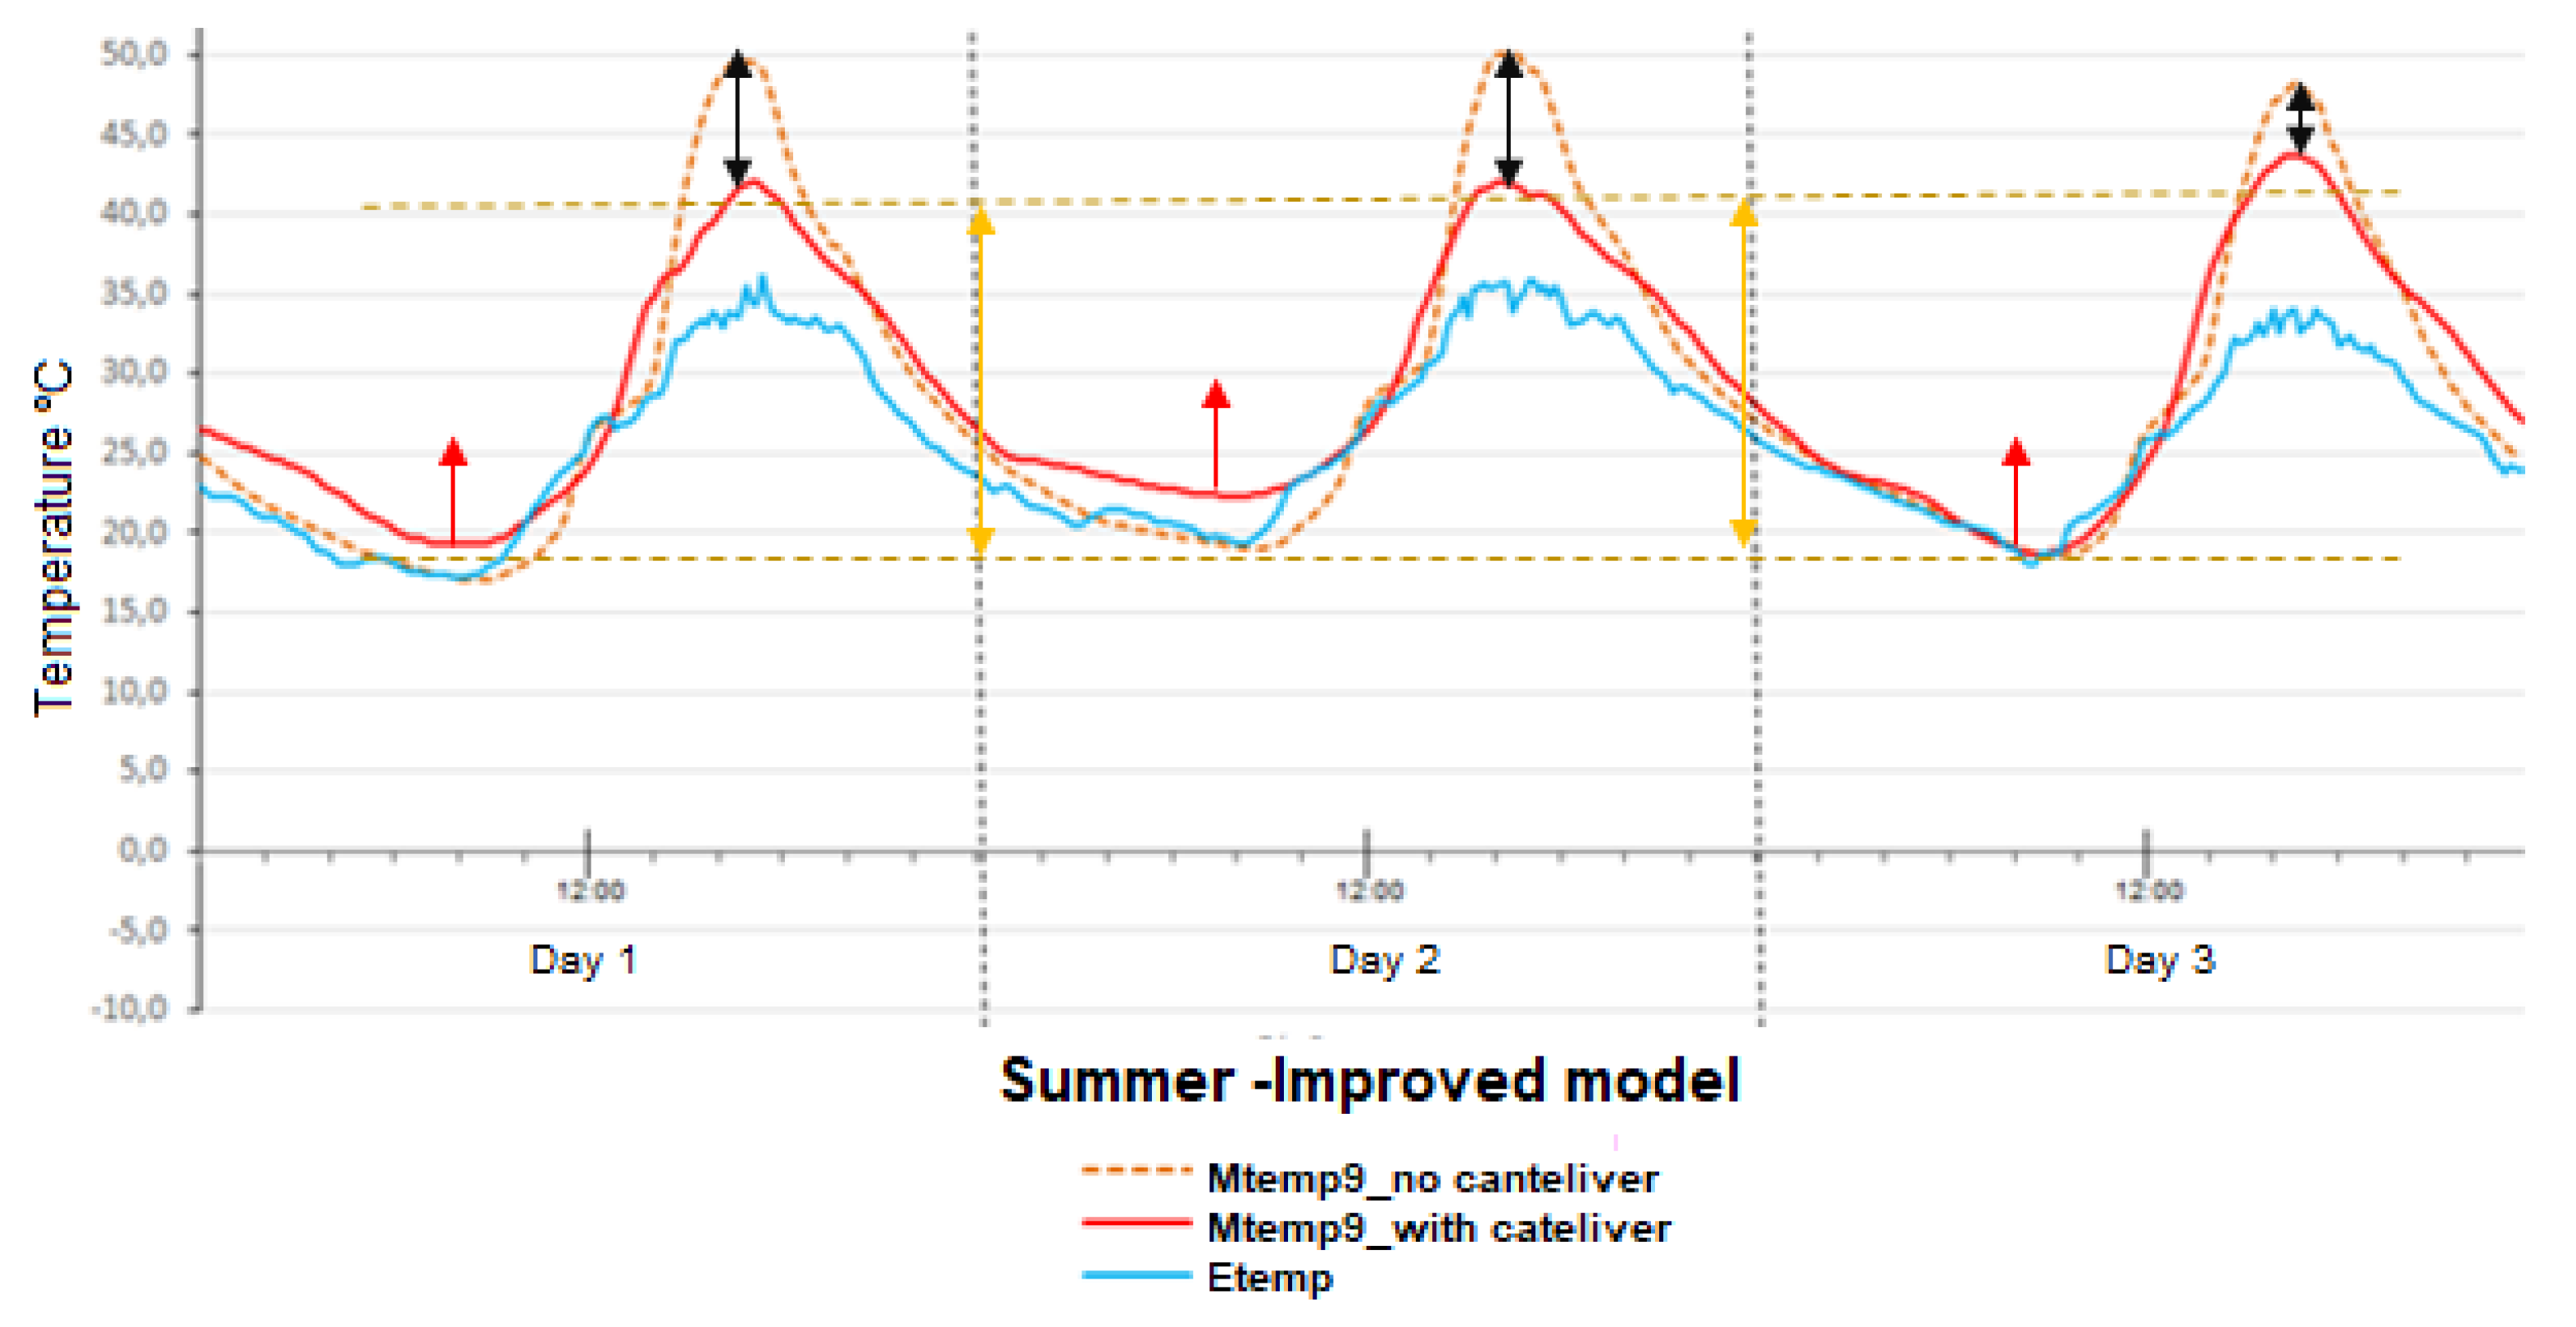
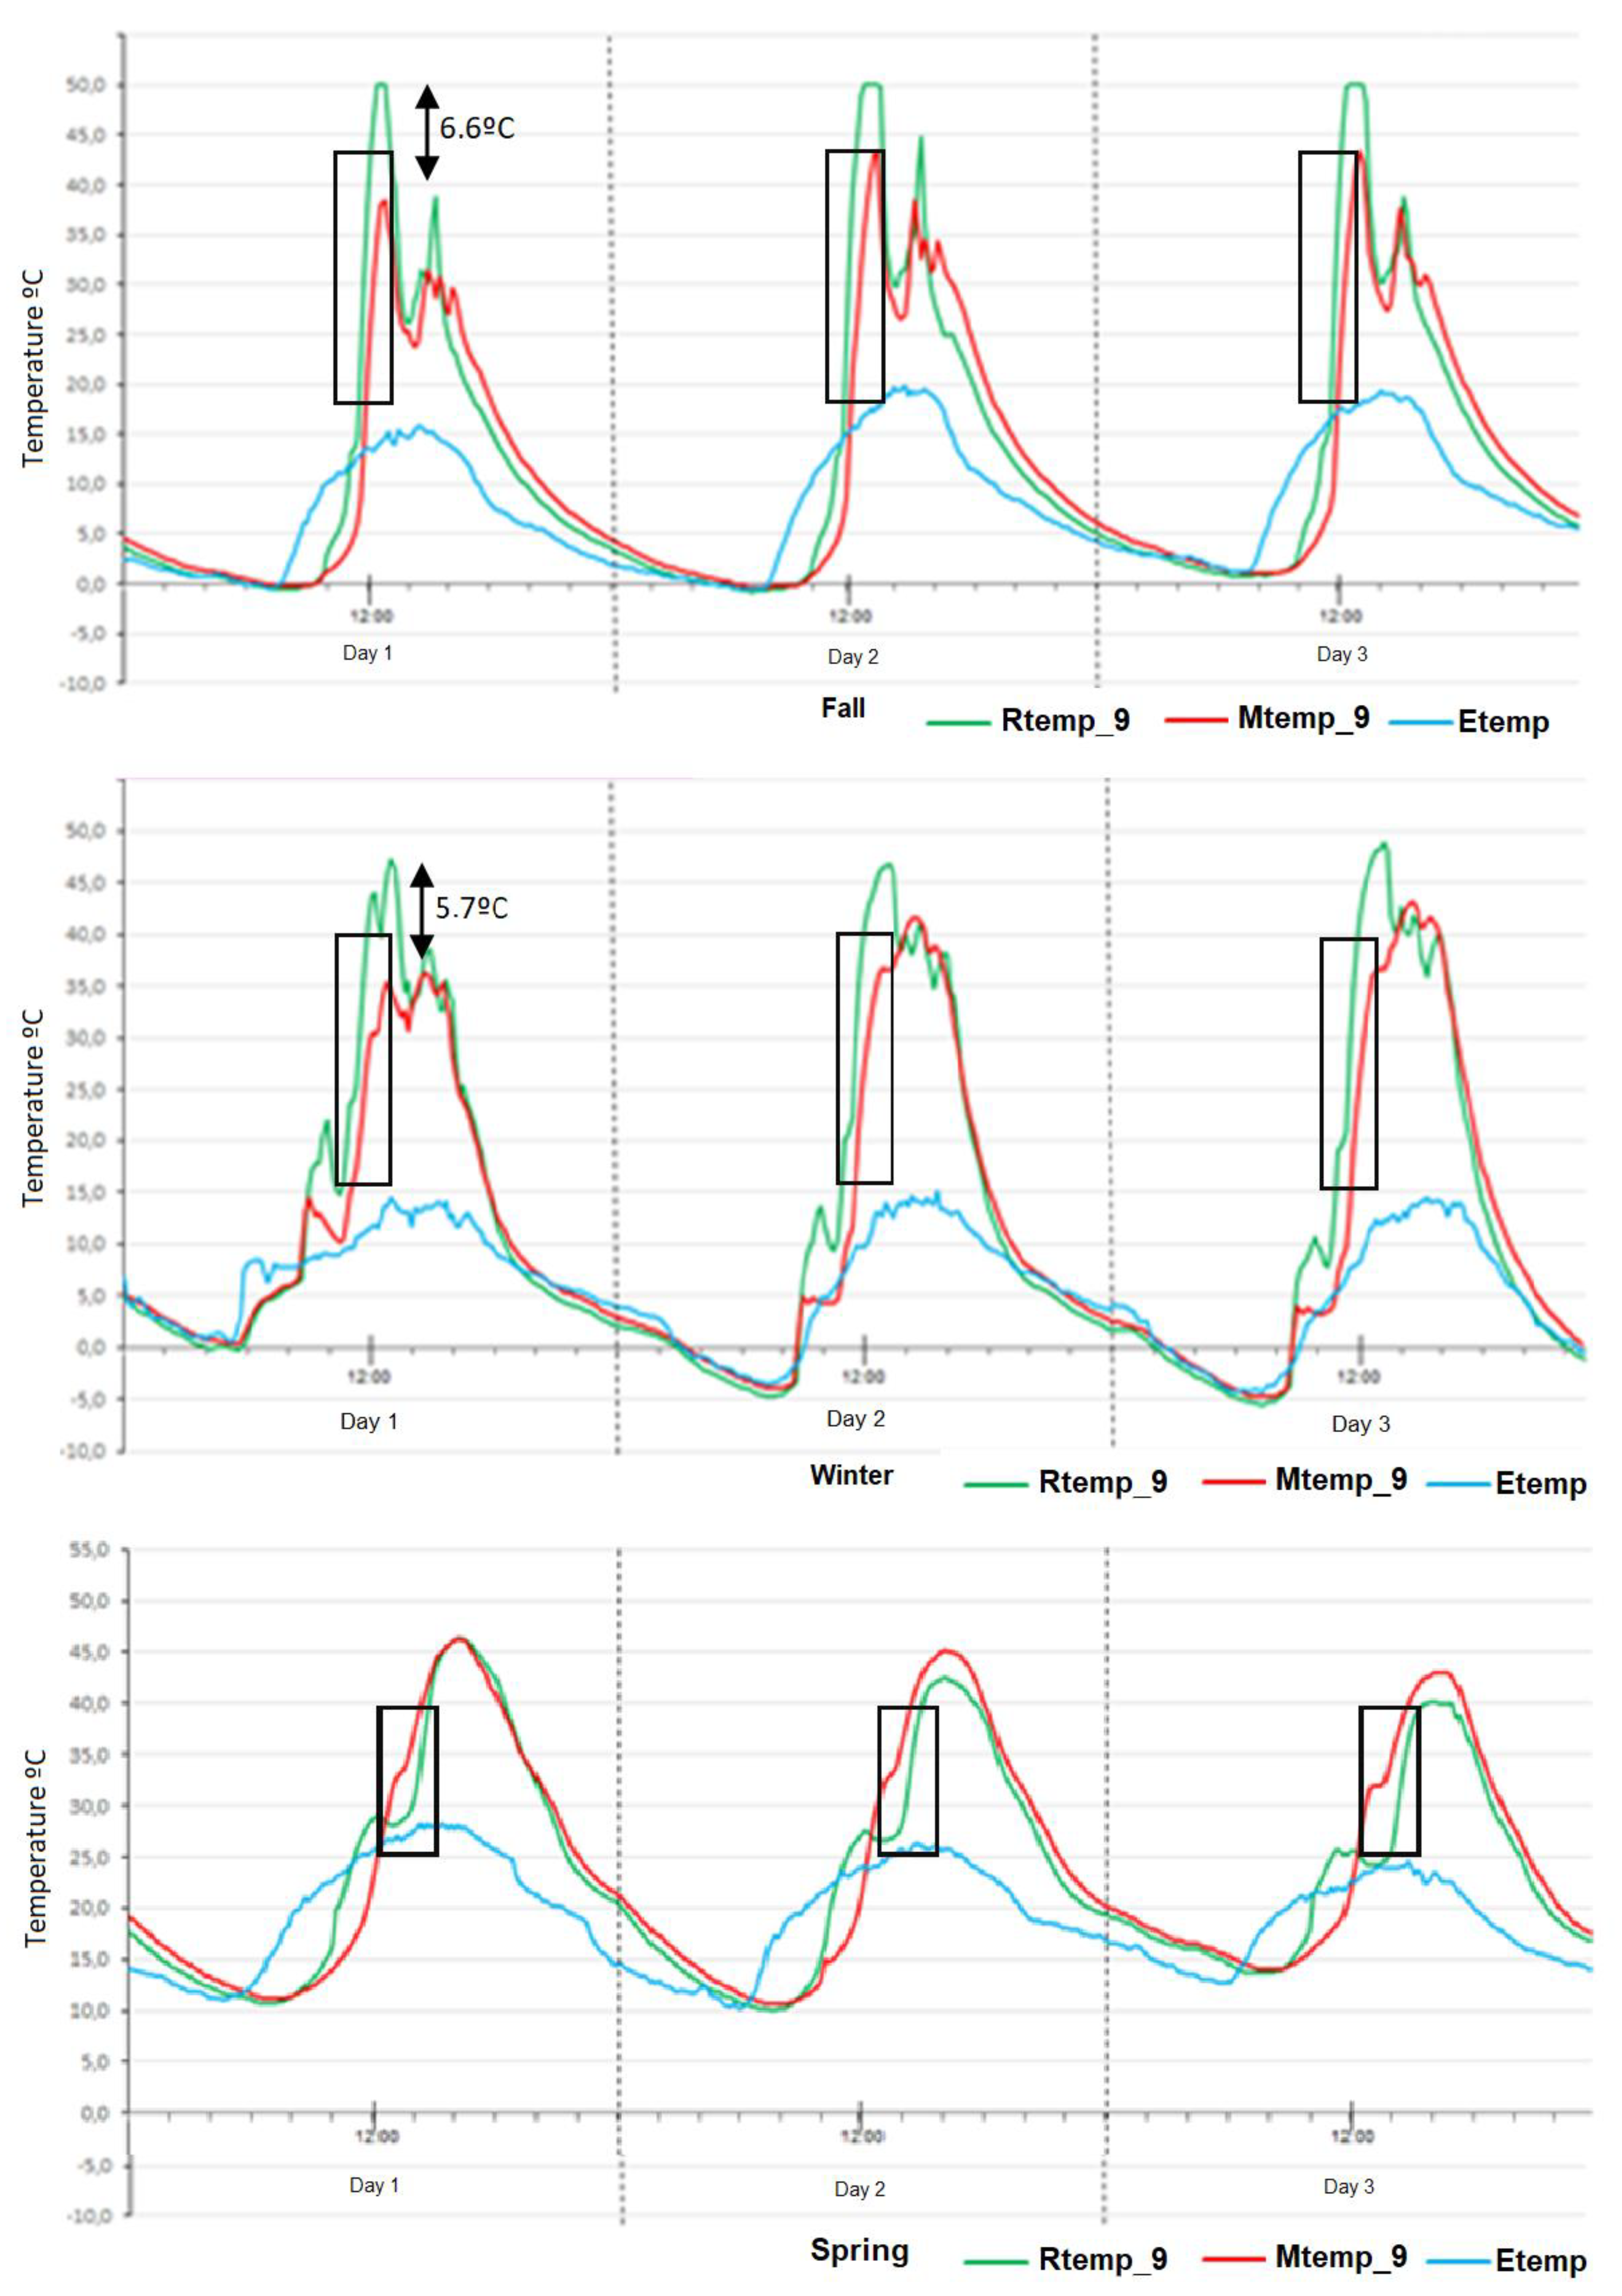
| Period | Outdoor Ambient Temperature (°C) | Solar Radiation (W/m2) | Indoor Ambient Temperature (°C) | Correlation Coeff. | Determination Coeff. | |||||||
|---|---|---|---|---|---|---|---|---|---|---|---|---|
| Max. Temp. | Min. Temp. | Average. Temp. | Max. Irrad. | Min. Irrad. | Average. Irrad. | Max. Temp. | Min. Temp. | Average. Temp. | r (Irrad./Ind.temp) | R2 (Irrad./Ind.temp) | ||
| Summer without cantilever | 35.1 | 16.9 | 24.8 | 777 | 0 | 144 | 50.0 | 16.8 | 28.6 | 0.48 | 0.23 | Ref. mod. |
| 50.0 | 17.1 | 28.7 | 0.51 | 0.26 | Imp. mod. | |||||||
| Summer with cantilever | 44.4 | 18.5 | 29.1 | 0.45 | 0.20 | Ref. mod. | ||||||
| 43.6 | 18.7 | 29.0 | 0.53 | 0.24 | Imp. mod. | |||||||
| Autumn | 19.9 | −0.6 | 7.7 | 216 | 0 | 23 | 50.0 | −0.9 | 12.1 | 0.70 | 0.48 | Ref. mod. |
| 43.4 | −0.4 | 11.6 | 0.92 | 0.84 | Imp. mod. | |||||||
| Winter | 15.1 | −4.3 | 5.6 | 312 | 0 | 66 | 48.9 | −5.5 | 12.2 | 0.76 | 0.58 | Ref. mod. |
| 43.2 | −4.8 | 11.3 | 0.87 | 0.76 | Imp. mod. | |||||||
| Spring | 28.1 | 19.0 | 12.7 | 1186 | 0 | 254 | 46.3 | 10.0 | 23.3 | 0.72 | 0.52 | Ref. mod. |
| 46.3 | 10.6 | 24.0 | 0.79 | 0.62 | Imp. mod. | |||||||
Publisher’s Note: MDPI stays neutral with regard to jurisdictional claims in published maps and institutional affiliations. |
© 2021 by the authors. Licensee MDPI, Basel, Switzerland. This article is an open access article distributed under the terms and conditions of the Creative Commons Attribution (CC BY) license (https://creativecommons.org/licenses/by/4.0/).
Share and Cite
Aguilera-Benito, P.; Varela-Lujan, S.; Piña-Ramirez, C. Thermal Behavior in Glass Houses through the Analysis of Scale Models. Sustainability 2021, 13, 7970. https://doi.org/10.3390/su13147970
Aguilera-Benito P, Varela-Lujan S, Piña-Ramirez C. Thermal Behavior in Glass Houses through the Analysis of Scale Models. Sustainability. 2021; 13(14):7970. https://doi.org/10.3390/su13147970
Chicago/Turabian StyleAguilera-Benito, Patricia, Sheila Varela-Lujan, and Carolina Piña-Ramirez. 2021. "Thermal Behavior in Glass Houses through the Analysis of Scale Models" Sustainability 13, no. 14: 7970. https://doi.org/10.3390/su13147970