Article

Statistical Assessment of the Effects of Grain-Structure Representation and Micro-Properties on the Behavior of Bonded Block Models for Brittle Rock Damage Prediction

by
Carlos Efrain Contreras Inga
1,*,
Gabriel Walton
1 and
Elizabeth Holley
2
1
Department of Geology and Geological Engineering, Colorado School of Mines, 1516 Illinois St., Golden, CO 80401, USA
2
Department of Mining Engineering, Colorado School of Mines, 1600 Illinois St., Golden, CO 80401, USA
*
Author to whom correspondence should be addressed.
Sustainability 2021, 13(14), 7889; https://doi.org/10.3390/su13147889
Submission received: 22 May 2021 / Revised: 30 June 2021 / Accepted: 9 July 2021 / Published: 14 July 2021
(This article belongs to the Special Issue Advances in Rock Mechanics and Geotechnical Engineering)

Abstract

:
The ability to predict the mechanical behavior of brittle rocks using bonded block models (BBM) depends on the accuracy of the geometrical representation of the grain-structure and the applied micro-properties. This paper evaluates the capabilities of BBMs for predictive purposes using an approach that employs published micro-properties in combination with a Voronoi BBM that properly approximates the real rock grain-structure. The Wausau granite, with Unconfined Compressive Strength (UCS) of 226 MPa and average grain diameter of 2 mm, is used to evaluate the effectiveness of the predictive approach. Four published sets of micro-properties calibrated for granites with similar mineralogy to the Wausau granite are used for the assessment. The effect of grain-structure representation in Voronoi BBMs is analyzed, considering grain shape, grain size and mineral arrangement. A unique contribution of this work is the explicit consideration of the effect of stochastic grain-structure generation on the obtained results. The study results show that the macro-properties of a rock can be closely replicated using the proposed approach. When using this approach, the micro-properties have a greater impact on the realism of the predictions than the specific grain-structure representation. The grain shape and grain size representations have a minor effect on the predictions for cases that do not deviate substantially from the real average grain geometry. However, the stochastic effect introduced by the use of randomly-generated Voronoi grain-structures can be significant, and this effect should be considered in future studies.

1. Introduction

The characterization of rock strength and fracturing processes usually relies on laboratory tests, such as uniaxial compression, triaxial compression and tensile strength tests. The results of multiple laboratory studies have revealed that the fracturing process of brittle rock under compression consists of several stages: (i) crack closure, (ii) linear elastic deformation, (iii) crack initiation and stable crack growth, (iv) crack damage and unstable crack growth and (v) failure and post-peak deformation [1,2,3,4]. In some cases, it can be difficult to characterize the fracturing behavior of a rock accurately. Various laboratory studies [5,6,7] show that individual specimens of the same rock type can exhibit distinct fracturing behavior and associated strength because of rock heterogeneities. Lan et al. [8] classified the sources of heterogeneity of intact rock in three groups: (i) grain-geometry heterogeneity related to variations in the size and shape of the mineral grains, (ii) grain deformability heterogeneity associated with the contrasts among mineral phases in terms of density and elastic properties and (iii) grain-grain contact heterogeneity linked to the variability of the stiffness, length, orientation and distribution of grain-contacts. When a rock undergoes compressive loading, the heterogeneity of the grain-structure leads to complex micro-mechanical behavior that produces localized stress concentrations within the intact rock, resulting in fracture development [9,10,11]. Accordingly, grain-structure heterogeneity also controls the macroscopic mechanical response of intact rock [8,9,12].
Multiple experimental studies have investigated the influence of grain-structure heterogeneity on the mechanical response of rock to loading. Numerous individual sets of compressive laboratory tests have identified a potential link between grain size and compressive strength [13,14,15,16,17,18,19,20,21]. These compressive tests were conducted mainly on granite, limestone and marble, and the results indicate that rock strength tends to decrease as the average grain size increases. Other studies focused on the effect of the mineral composition [20,21,22,23,24,25] found notable correlations between the unconfined compressive strength of granite and its mica, quartz and feldspar content, as well as the quartz to feldspar ratio. Based on this information, various relationships between grain size, mineral content and rock strength have been postulated [20,21,24,25]. A more recent longitudinal study [26] conducted using mechanical and geological (i.e., grain size and mineral composition) property data for granites compiled from the literature examined the previously proposed correlations and found these correlations to not be apparent in the context of the larger database used for the analysis. This discrepancy between studies was attributed to the potential influence of confounding variables in statistical analyses performed on individual data sets. Accordingly, the experimental literature offers no definitive consensus on the influences of geological characteristics on the mechanical attributes of granites.
Due to continued developments in computer power and numerical techniques, numerical modeling has been increasingly used in recent decades to quantitatively investigate damage and fracturing behavior of brittle rocks. Compared with experimental testing, numerical modeling can be more cost-effective and allows one to simulate conditions that are difficult to achieve in the laboratory [27,28]. Broadly speaking, numerical modeling approaches to simulate brittle rock damage can be classified into three categories: (i) continuum, (ii) discontinuum and (iii) hybrid continuum-discontinuum [29,30]. Continuum methods represent the rock as a single continuous body and define rock damage through constitutive relations and associated failure criteria [29]. Due to these premises, the continuum approach is unable to represent fracture development explicitly, and its results are highly dependent on the assigned constitutive relationship [11,31]. The limitations of continuum methods are partially overcome by discontinuum and hybrid continuum-discontinuum approaches, which can explicitly simulate rock damage development under diverse loading conditions, eliminating the need for pre-defined macroscopic constitutive models [32,33,34]. Among the discontinuum and hybrid methods, the Discrete Element Method (DEM) and the Finite Discrete Element Method (FDEM) are the most commonly applied approaches for brittle rock mechanical behavior modeling. The DEM simulates rocks as assemblies of discrete particles or blocks able to interact and separate as fractures develop [32,35]. The hybrid FDEM starts from a continuum representation of the rock that allows the progressive development of new fractures and, consequently, new discrete bodies [32].
Discontinuum and hybrid numerical modeling methods, in contrast to continuum methods, can more accurately represent the heterogeneity of crystalline rocks [33]. Various approaches have been developed to represent the grains within an intact rock and their respective contacts. Within the broad category of DEM, the Bonded Particle Model (BPM) and Bonded Block Model (BBM) methods are the most commonly applied. Conventional BPMs represent grains as circular or spherical particles (or balls) bonded at their contacts [30]. BBMs represent grain-structures as collections of blocks where each block represents a grain that can adopt distinct polygonal or polyhedral shapes, and the interfaces between blocks represent the grain-grain contacts. Voronoi tessellations are usually applied to generate the grain-structure for a BBM, since the mathematical process of Voronoi tessellation is the most convenient technique to randomly generate polygonal or polyhedral shapes. Typically, when blocks adopt triangular/tetrahedral shapes, grains are referred to as trigons. When blocks present four sides or more and are generated using tessellations, they are called Voronoi blocks [32,36,37]. The Grain-Based Model (GBM) approach was introduced in BPMs to improve grain-structure representation by adding a series of grain-boundaries defined by smooth joint elements to a BPM [38]. This approach is referred as PFC-GBM when it is applied using Itasca’s PFC software. In contrast to strictly discontinuum modeling methods, the hybrid FDEM approach explicitly models rock elastic deformation, crack initiation and crack propagation [39]. In the conventional approach of the FDEM, grains can adopt irregular shapes by connecting several triangular elements [40]. More recent developments employ the GBM approach to define the grain-structure using Voronoi tessellations (FDEM-GBM), such as IRAZU-GBM [41] or the “grain-based continuum-discontinuum method” (GBCDM) [42]. More details about all these methods can be found in the literature [32,33,37,38,40,41].
Wang and Cai [11,34] pointed out that, compared with other block shape assemblies, polygonal and polyhedral block assemblies have achieved a more realistic representation of the geometrical heterogeneity of the grain-structure within crystalline intact rocks. Based on that premise, Voronoi tessellations, which are increasingly applied to generate polygonal/polyhedral grain-structures [11,31,34,37,41,43], are used in this study for the development of BBMs.
In general terms, the macro-mechanical response of a BBM to loading depends on three factors: (i) numerical model physics, (ii) micro-properties and (iii) grain-structure attributes. The numerical model physics sets criteria and constraints that control the numerical simulation (e.g., explicit time-stepping solution method, damping method, etc.). The term micro-properties is commonly used to describe the grain and grain-grain contact properties of BBMs [9,11,34,37,44,45,46,47]. These properties govern the mechanical interactions within the grain-structure (i.e., interaction among grains). The grain-structure attributes define the geometry and distribution of the grains (i.e., size and shape and relative positioning of different grains). Consequently, they control localized stress concentrations within the intact rock. Additionally, the combination of the second and third factors controls the micro-mechanical behavior within the rock structure. Thus, once the model physics is properly defined, the ability to predict the mechanical behavior of a rock using BBMs directly depends on the grain-structure geometry represented in the model and the micro-properties assigned to the grains and contacts of such grain-structure. As stated by Potyondy [48], if one could replicate the grain-structure and the micro-mechanical interactions (i.e., micro-properties) within a model, then that model should reproduce the rock’s macro-mechanical behavior. With all that said, if we accept that the model physics as implemented in standard codes is correct and generate a BBM that provides a reasonable representation of the grain-structure of the rock, then we hypothesize that a set of micro-properties for a given mineral assemblage from a prior study should produce a realistic prediction of the macro-properties of the rock. Moreover, such a set of calibrated micro-properties should be generalizable across rocks with similar characteristics.
Most of the micro-properties outlined in the literature are obtained from a calibration process that employs a simulated grain-structure approximation to replicate rock macro-properties obtained in actual laboratory tests. Given the inability to reproduce the exact grain-structure geometry, the resulting calibrated micro-properties do not fully replicate the mechanical interactions between grains. Moreover, some simplification in the representation of the grain-structure could add significant variability to the resulting micro-properties. Conversely, a reasonably realistic representation of the grain structure used for the calibration of micro-properties can provide a more realistic approximation of the micro-mechanical behavior of the rock. The ideal representation of the grain-structure of a rock would replicate the exact grain geometry and grain distribution within the grain-structure. However, as mentioned before, it is not feasible to generate an exact grain-structure replica. Alternatively, a typical approach consists of developing a reasonable approximation of the grain-structure using the Voronoi tessellation technique. This approach randomly generates grain-structure representations that account for the grain size and grain shape, among other parameters. Even though Voronoi tessellations are increasingly used in numerical modeling, the degree to which Voronoi grain-structure models approximate real grain-structures has not been studied in depth. The effect of the grain-structure representation on the mechanical behavior of rock has been addressed by multiple authors using Voronoi tessellations. Several relevant studies have focused on the effects of grain size and grain size distribution using BBMs [9,37,44,49,50,51,52,53], PFC-GBMs [10,54,55,56,57] and FDEM-GBM [42]. The effects of grain shape have also been investigated, mostly using BBMs [46,50,52,58], and recently using FDEM-GBM [42]. The effects of mineral arrangement have been studied using BBM [8,44,51] and PFC-GBM [10,59]. There are few studies on the effects of mineral composition [42,49] and fabric orientation [37]. However, none of these studies accounted for the stochastic nature of Voronoi grain-structures and how it affects the numerical simulation results.
The present study examines the capabilities of BBMs for the prediction of brittle rock mechanical behavior by evaluating a predictive modeling approach that does not require micro-property calibration. Such an approach consists of using previously calibrated micro-properties in combination with a Voronoi model that approximates the grain-structure of a target rock to replicate its macro-mechanical behavior. BBMs representing the grain-structure of the Wausau granite under uniaxial compression were developed to evaluate the effect of the micro-properties on the predictions and the effectiveness of the predictive approach. In addition, a series of Voronoi grain-structures with different grain shapes, grain sizes and mineral arrangements were employed in a sensitivity analyses to assess the influence of the realism of the grain-structure representation on the predictions, as well as to indirectly demonstrate the ability of Voronoi grain-structures to reasonably approximate an actual grain-structure. In addition, the assessments conducted in this study examine the stochastic nature of the model results associated with the randomness of the grain-structure representations generated using Voronoi tessellations.

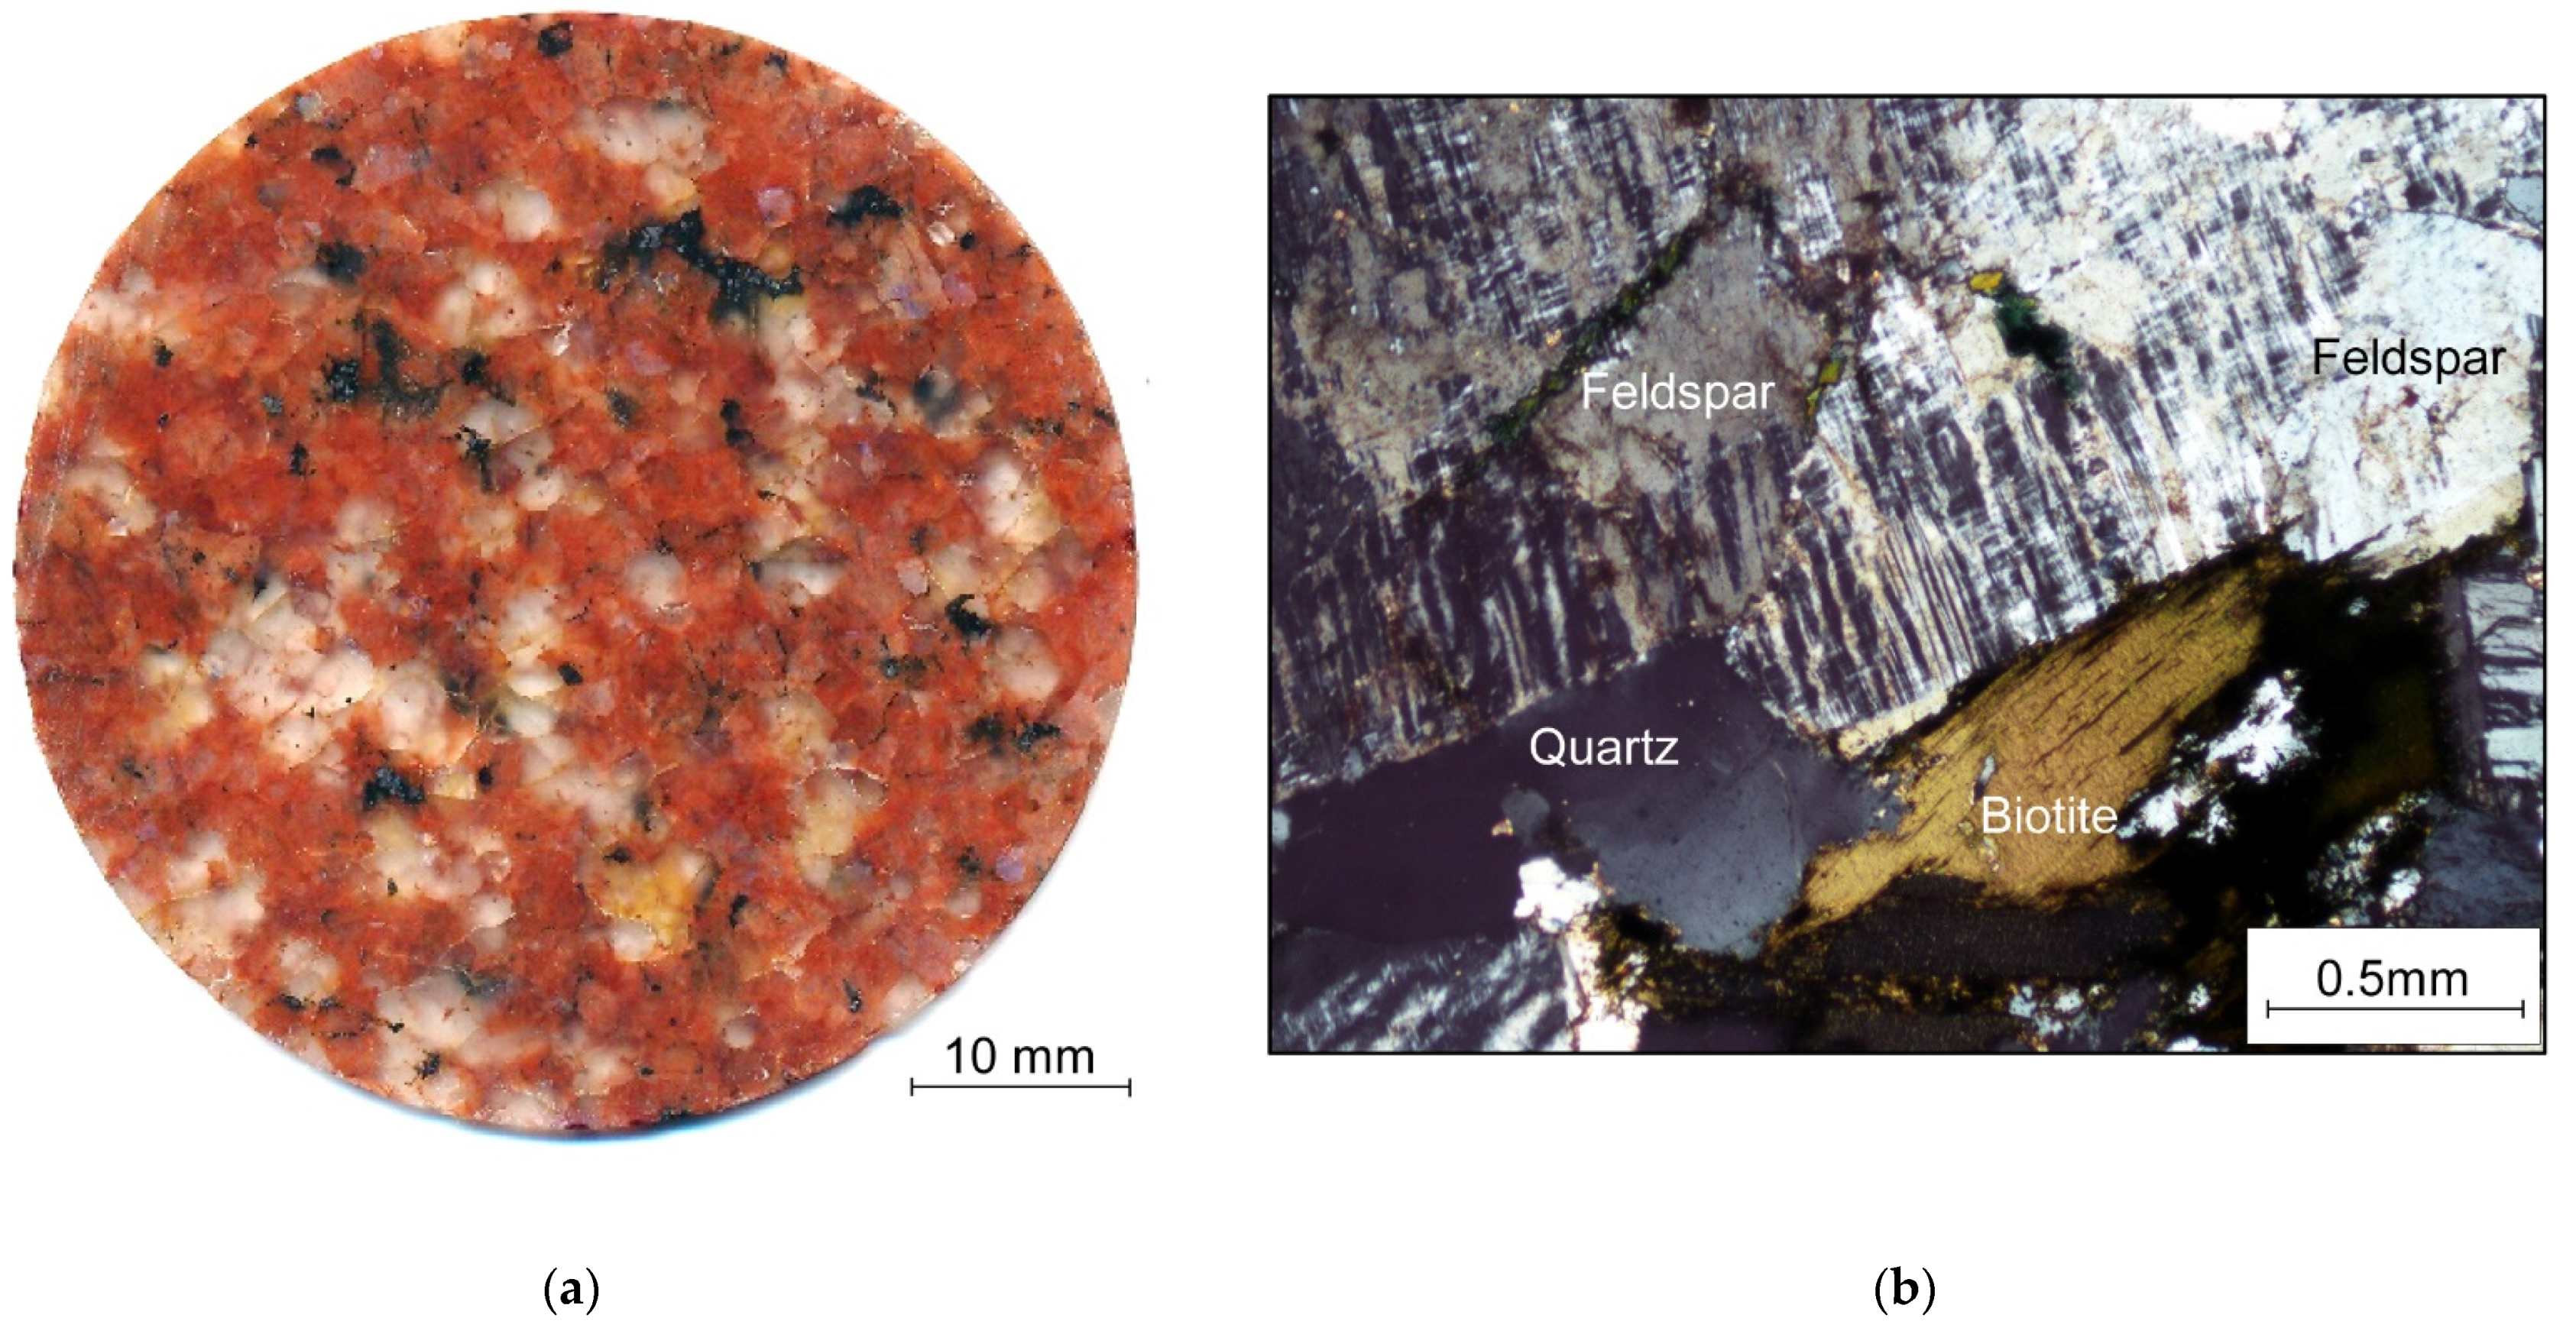
2. The Wausau Granite

The Wausau granite is a dark red alkali-feldspar granite from Marathon County, Wisconsin [60]. The specimens of Wausau granite for this study (Figure 1) were obtained from a quarry. Three standard thin sections were prepared for thin section petrography and Scanning Electron Microscopy (SEM)-based automated mineralogy. Thin section petrography identified the presence of quartz, biotite, K-feldspar and plagioclase. The specimens were observed to have negligible porosity, as is typical of most granites. The automated mineralogy analyses were performed on a TESCAN-VEGA-3 Integrated Mineral Analyzer (TIMA) model LMU VP-SEM in the Department of Geology and Geological Engineering at the Colorado School of Mines. The TIMA acquires spectral data using four energy dispersive X-ray (EDX) spectrometers set at a beam stepping interval of 15 μm, a beam intensity of 14 and an acceleration voltage of 24 keV. Interactions between the beam and the specimen were modeled through Monte Carlo simulation. The composition of each acquisition point was determined by comparing EDX spectra with spectra held in a look-up table. The assignment makes no distinction between mineral species and amorphous grains of similar chemical composition. Results were output by the TIMA3 software as a spreadsheet giving the area percent of each composition in the look-up table, with compositional assignments grouped appropriately. Table 1 summarizes the mineral modal abundances and grain size distributions for the specimens used in this study. The studies of LaBerge and Myers [61] and Sims et al. [60] identified an exsolution or irregular intergrowth of sodic and potassic feldspars in the Wausau granite. This intergrowth was also identified in this study.
In this case, 11 Uniaxial Compressive Strength (UCS) tests were conducted on cylindrical specimens, which were 51.4 mm in diameter, with a length-to-diameter ratio of 2.5:1. Four of these tests have complete stress-strain information recorded with electric resistance precision strain gauges. A total of four Omega linear strain gauges (two axial and two lateral, 30 mm long) were glued to the middle section of each specimen using epoxy resin. The strain gauges were attached at 90° intervals with the two axial and two lateral strain gauges diametrically opposed from each other.
The UCS test results show that the peak strength of the Wausau granite ranges from 204 MPa to 260 MPa. The crack damage (CD) stress was obtained from the instantaneous tangent modulus curve [62]. Note that it was possible to determine CD for all 11 specimens from the point of non-linearity of the stress-displacement curve recorded by the loading machine (since the absolute displacements are not reflective of the specimen displacements, but the linear/non-linear trends are). The crack initiation (CI) stress was estimated using the crack volumetric strain (εv,c) curve reversal [3,63], whereas Young’s modulus (Em) and Poisson’s ratio (νm) were determined directly from the strain-stress curves of those four tests. Table 2 summarizes the experimental mechanical properties obtained from the laboratory tests.

3. Modeling Strategy and Methods

This study employs an approach that does not require the calibration of model micro-properties. Instead, the mechanical behavior of a rock was replicated using previously calibrated micro-properties. This approach is based on the premise that a BBM that reasonably approximates a rock’s actual grain-structure can be used in combination with calibrated micro-properties from a prior study to provide realistic predictions of that rock’s macro-properties. The proposed approach is expected to be feasible when applied in rocks with similar mineral constituents. The first portion of the study evaluated which calibrated micro-properties selected from the literature can best approximate the macro-mechanical behavior of the Wausau granite and be utilized for prediction purposes. Four sets of micro-properties were used in this assessment as published in four different studies: Lan et al. [8], Chen and Konietzky [64], Farahmand and Diederichs [45] and Chen et al. [65]. These four sets of micro-properties were previously calibrated to match the macro-response of two types of granites (the Lac du Bonnet granite [8,45,64] and the Kirchberg-II granite [65]) with similar mineral compositions to the Wausau granite. Once the set of micro-properties that provides the best fit between the actual and predicted macro-properties of the Wausau granite was identified, this set was used to assess the model sensitivity to specific aspects of grain-structure representation. In the analyses, the experimentally determined variability of the Wausau granite’s macro-properties was considered to evaluate the accuracy of the numerical model predictions.

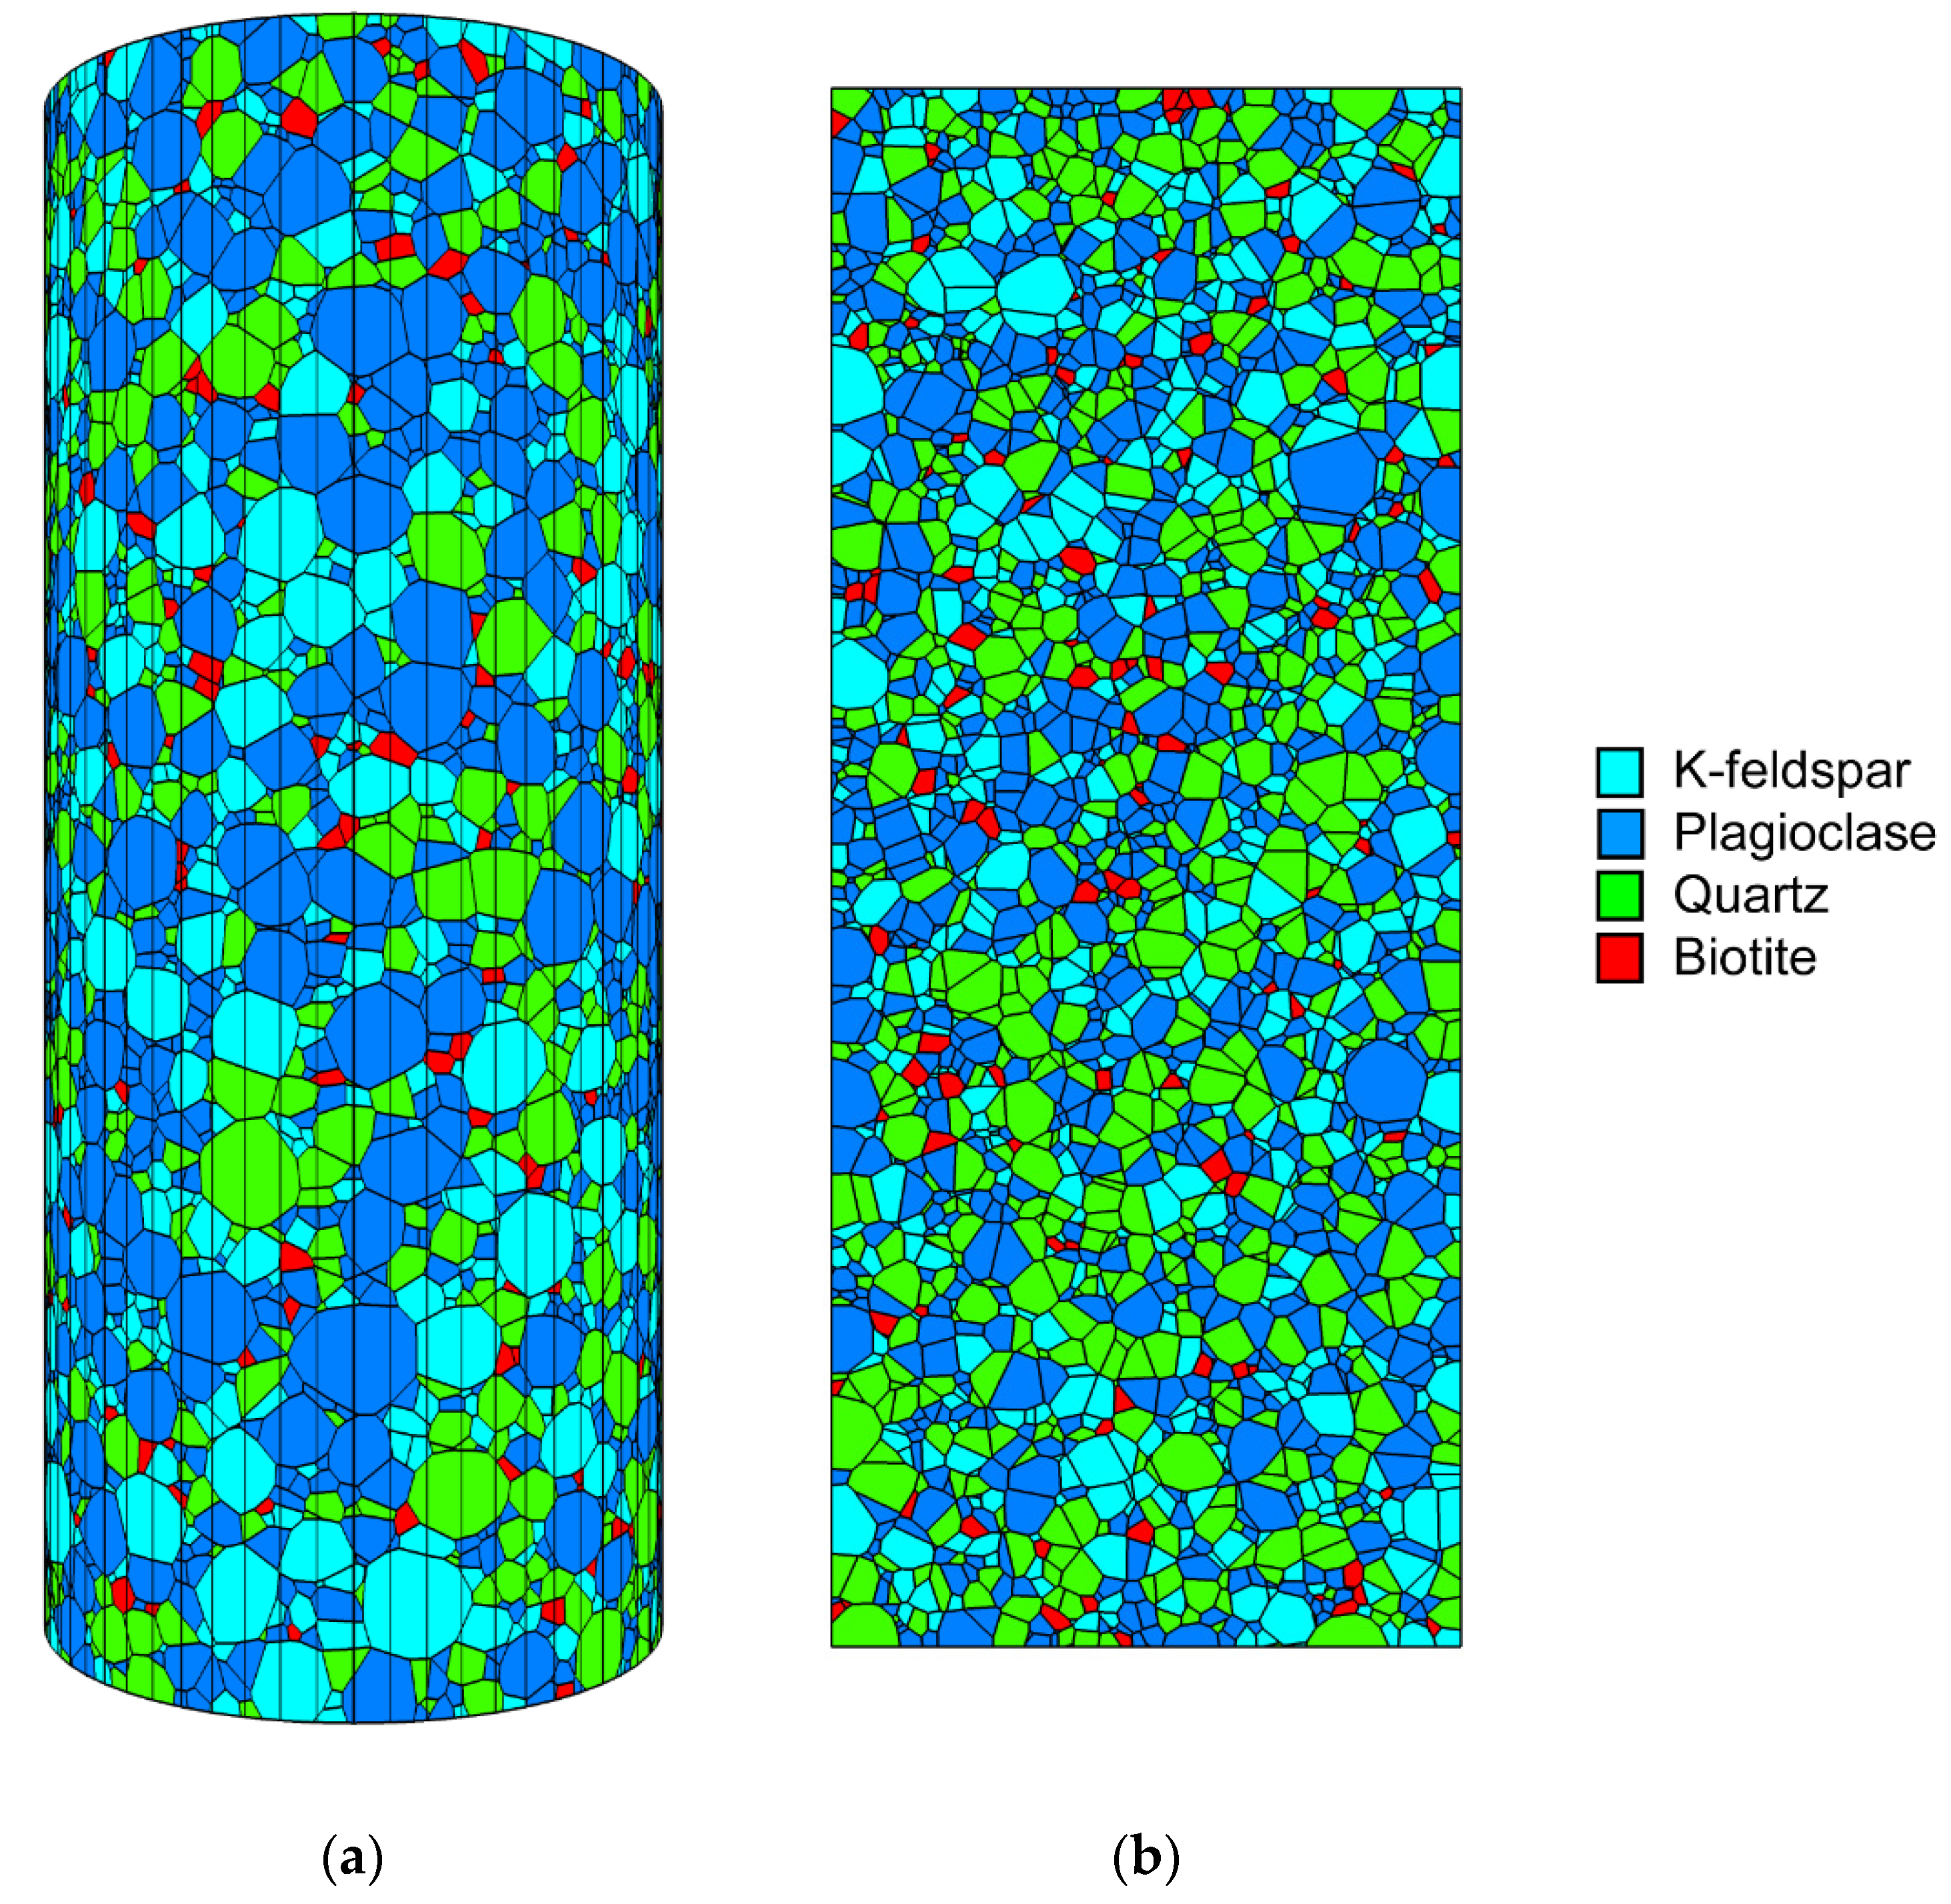
3.1. BBM Generation Approach

In this study, the grain-structure of intact rock was first generated in 3D using an assembly of Voronoi tessellations, where each tessellation or cell is equivalent to a mineral grain. Mathematically, a Voronoi tessellation is the partition of a n-D space in an assembly of n-D polyhedral entities defined as zones of influence of a particular set of seeds. The entities fill the space without overlaps nor gaps [66]. The resulting Voronoi tessellations (also referred to as Voronoi polyhedrons or Voronoi grains) are convex cells, which intersect along planar faces, straight edges and vertices. The software Neper [67] was employed to generate the 3D grain assemblies. Neper is an open-source software package for polycrystal generation and meshing in 3D or 2D using Voronoi or Laguerre tessellations created from a set of seeds [67]. As opposed to the former, Laguerre tessellations are a generalization of Voronoi tessellations that allow for geometries that are not possible to achieve with Voronoi cells. The Laguerre generalization can be achieved using distinct weighted seeds that make boundaries between cells non-equidistant between seeds [68].
In Neper, the morphological properties of the cells were defined to reproduce the morphology of real mineral grains. Neper allows one to specify grain (or cell) morphological properties using statistical distributions of grain size and grain shape, expressed in terms of mean, standard deviation and distribution type. The grain size is commonly defined in terms of the diameter, d, of a sphere of equivalent volume (or circle of equivalent area in 2D) [67], whereas the grain shape can be described in terms of grain sphericity. A variety of metrics for sphericity have been defined in the literature [42,69,70]. In this study, we adopt the definition of Wadell [69], as this is the definition implemented in Neper. Wadell [69] defines sphericity, s, as the ratio between the area of a sphere of equivalent volume and the area of the grain. The 2D equivalent of sphericity is called circularity defined as the ratio of the perimeter of a circle of equivalent area and the perimeter of the grain [71].
Since the micro-properties used from the literature were derived through calibration of 2D models, 2D grain structure representations were required for modeling purposes. To obtain 2D representations of the intact rock grain-structure, a set of 2D BBMs was generated by cutting multiple axial sections from the cylindrical 3D grain-structure created in Neper. The axial sections were cut using the software 3DEC [72]. This approach was adopted as an alternative to direct 2D tessellation generators, which in many cases do not allow for sufficient grain shape and grain size heterogeneity to realistically approximate the grain-structure of some rocks. Even though each 2D BBM presents a unique mineral arrangement and unique individual grain morphological characteristics, each group of 2D BBMs is a group of 2D simplifications of the same 3D grain-structure that therefore represent the same average mineral composition, average grain shape and average grain size depicted in the 3D grain-structure.

3.2. BBM Configuration

Six different 3D Voronoi grain-structures were developed in Neper for this study. The 3D Voronoi grain-structures were developed within cylindrical domains. All 3D grain-structures represent cylindrical rock specimens with a diameter of 51.4 mm and a height of 128.5 mm. The morphology of the grains was defined using the diameter and sphericity, as these are used as inputs in Neper [68]. Given that Voronoi grain-structures are stochastically generated, the mineral arrangement or spatial distribution of grains within the specimen domain is random. This is considered an appropriate approximation given Wausau granite’s lack of fabric.
The first 3D grain-structure model was designed to represent the actual Wausau granite grain-structure as closely as possible. This 3D grain-structure was established as a baseline for the sensitivity analyses (see Figure 2). This baseline grain-structure represents the average mineral composition, average grain size, grain size distribution and approximate typical grain shape of the Wausau granite. The average mineral composition was defined based on the results of the automated mineralogy. Thin-section microscopy and macroscopic observation were used to constrain the average grain shape within the specimens. The average grain shape was qualitatively assessed to resemble in Neper when using an average grain sphericity (s) equal to 0.8. Such approximate grain sphericity adequately resembles the average circularity measured on disk-shaped specimens of the Wausau granite (average circularity of 0.83, maximum circularity of 0.96 and minimum circularity of 0.55) considering the limitations of the Voronoi tessellation approach (i.e., only convex grains are generated within the model). The average grain shape approximated in Neper is comparable to a prismatic shape rather than a uniformly rounded polyhedron as used in previous studies [44,51,64,65]. The average grain size or grain diameter (d = 2.0 mm) and corresponding size distribution were defined through measurements of the apparent grain size made on specimens of the Wausau granite. These apparent grain size measurements made in 2D specimens properly capture the grain size variability and closely approximate the actual average grain size within the Wausau granite, which lacks fabric and presents an apparently random mineral arrangement. Once the 3D model generated in Neper was imported into 3DEC (but before the cutting of 2D sections), the mineral type was randomly assigned to the blocks within the 3D grain-structure. Each 2D BBM obtained from the 3D grain-structure maintains the mineral type distribution along the axial section from which it was generated. The mineral content proportions (i.e., 24% of k-feldspar, 41% of plagioclase, 32% of quartz and 3% of biotite) and the different size distributions per mineral type were used as constraints. Thus, 100% of the biotite grains have diameters between 0.0 and 2.0 mm; 16%, 68% and 16% of the quartz grains correspond to ranges of 0.0–2.0 mm, 2.0–3.5 mm and 3.5–7.0 mm, respectively; and 100% of the k-feldspar and plagioclase feldspar grains have diameters between 0.0 and 7.0 mm. Note that although some of the feldspars (i.e., k-feldspar and plagioclase) in the Wausau granite are present as exsolutions, all grains of the feldspar group were modeled as either pure k-feldspar or plagioclase. As both types of feldspars have similar mechanical properties [8,45,64], variations in the k-feldspar to plagioclase proportion within the exsolutions are expected to have a negligible influence on the overall rock mechanical behavior.
In addition to the baseline grain-structure, five additional 3D grain-structures with different grain geometric characteristics were developed for a sensitivity analysis. For the assessment of the grain shape effect, two grain-structures were generated with the same mineral composition, average grain diameter, and grain size variability but different grain shape (i.e., average sphericity). To evaluate the effect of the grain size, three more grain-structures were built with the same mineral composition, grain shape and equivalent grain size variability (i.e., same grain diameter standard deviation) but different average grain diameter. Table 3 summarizes the grain geometric characteristics of each one of the 3D grain-structures. Figure 3 shows a visual comparison of the different BBMs.
To assess the use of previously calibrated micro-properties for prediction purposes, only the baseline grain-structure was employed. In this case, 18 evenly distributed axial sections were cut from the 3D baseline model, and one 2D BBM was created from each axial section. Given that Voronoi BBMs are randomly generated, there is a possibility of obtaining grains with shapes that UDEC is unable to mesh while generating the axial sections. A FISH script in UDEC [73] helped identify such grains which, when projected onto a 2D section, resulted in a polygon with at least one corner having a highly acute angle (i.e., <5°). If a potentially problematic grain was identified, a new 3D grain-structure was generated with a different seed to obtain a full set of 18 sections. For comparison, four groups of 18 2D BBMs were established, one group for each of the four previously calibrated micro-property sets assessed in this study. The effect of variability in mineralogical arrangement was assessed by comparing the baseline model against four “clones” of itself. Each clone maintains the same original grain-structure geometry of the baseline model but has different randomly assigned mineral types for the grains. As in the previous analysis, 18 2D BBMs were generated from each grain distribution. For the assessment of the grain shape and grain size effects, a total of 90 2D BBMs were used to analyze each specific geometric configuration (18 sections for each of the five alternative 3D grain-structures).

3.3. Constitutive Behavior of Intact Rock and Micro-Property Assignment

The 2D numerical simulations of this study were run in the software UDEC [73]. UDEC allows for simulation of grains within a BBM as rigid, elastic (deformable) or plastic (damageable) bodies [11,33,37]. In the case of elastic or plastic grains, a constitutive relationship can be applied to each grain to model its behavior. The mechanical interaction between two grains along their common contact can be recreated using a joint constitutive model [73].
This study modeled the mineral grains as unbreakable elastic blocks, allowing failure to occur only along the grain-contacts [11,37,49]. The same simplification was applied in previous studies [8,37,45,49,53,64,65]. Since the present study is focused on the prediction of the pre-peak macro-properties of the rock under unconfined conditions only, such a simplification is expected to have a negligible effect on the results of the simulations [43]. The elastic blocks were discretized into a mesh of deformable triangular finite-difference zones. The simulation results are strongly sensitive to the mesh size [74,75]. To minimize the effect of mesh size, a maximum triangular zone edge length of 0.8 mm was applied in all the BBMs. Such a maximum zone edge length ensures that at least 16 zones are generated inside a grain of average size (i.e., a 4-edge grain with the average diameter represented in the model). The resulting average grain edge length to zone edge length ratio is greater than or equal to 2, which agrees with the recommended ratio used in previous studies [43,44] to achieve stable numerical results.
In UDEC, sets of calibrated micro-properties from four different studies [8,45,64,65] were applied to the models. These micro-properties from the literature were originally obtained through an iterative multi-step calibration process in each of the respective studies. Broadly speaking, such a process consists of adjusting the grain and contact micro-properties until a set of micro-properties that replicates the rock’s macro-response is identified. The grain micro-properties correspond to an elastic isotropic model with distinct density (ρ), Young’s modulus (E) and Poisson’s ratio (ν) for each mineral type. The grain-contact micro-properties were modeled using a Coulomb slip-joint constitutive model with residual strength properties. Each grain-contact was assigned a normal stiffness (kn), shear stiffness (ks), peak friction angle (φ), peak cohesion (C), peak tensile strength (σt) and residual friction angle (φr). The residual cohesion (Cr) and residual tensile strength (σtr) were assumed to be zero in accordance with the previously mentioned four studies. The grain and contact micro-properties used in this study are summarized in Table 4, Table 5, Table 6, Table 7, Table 8, Table 9, Table 10 and Table 11.

4. Numerical Simulation

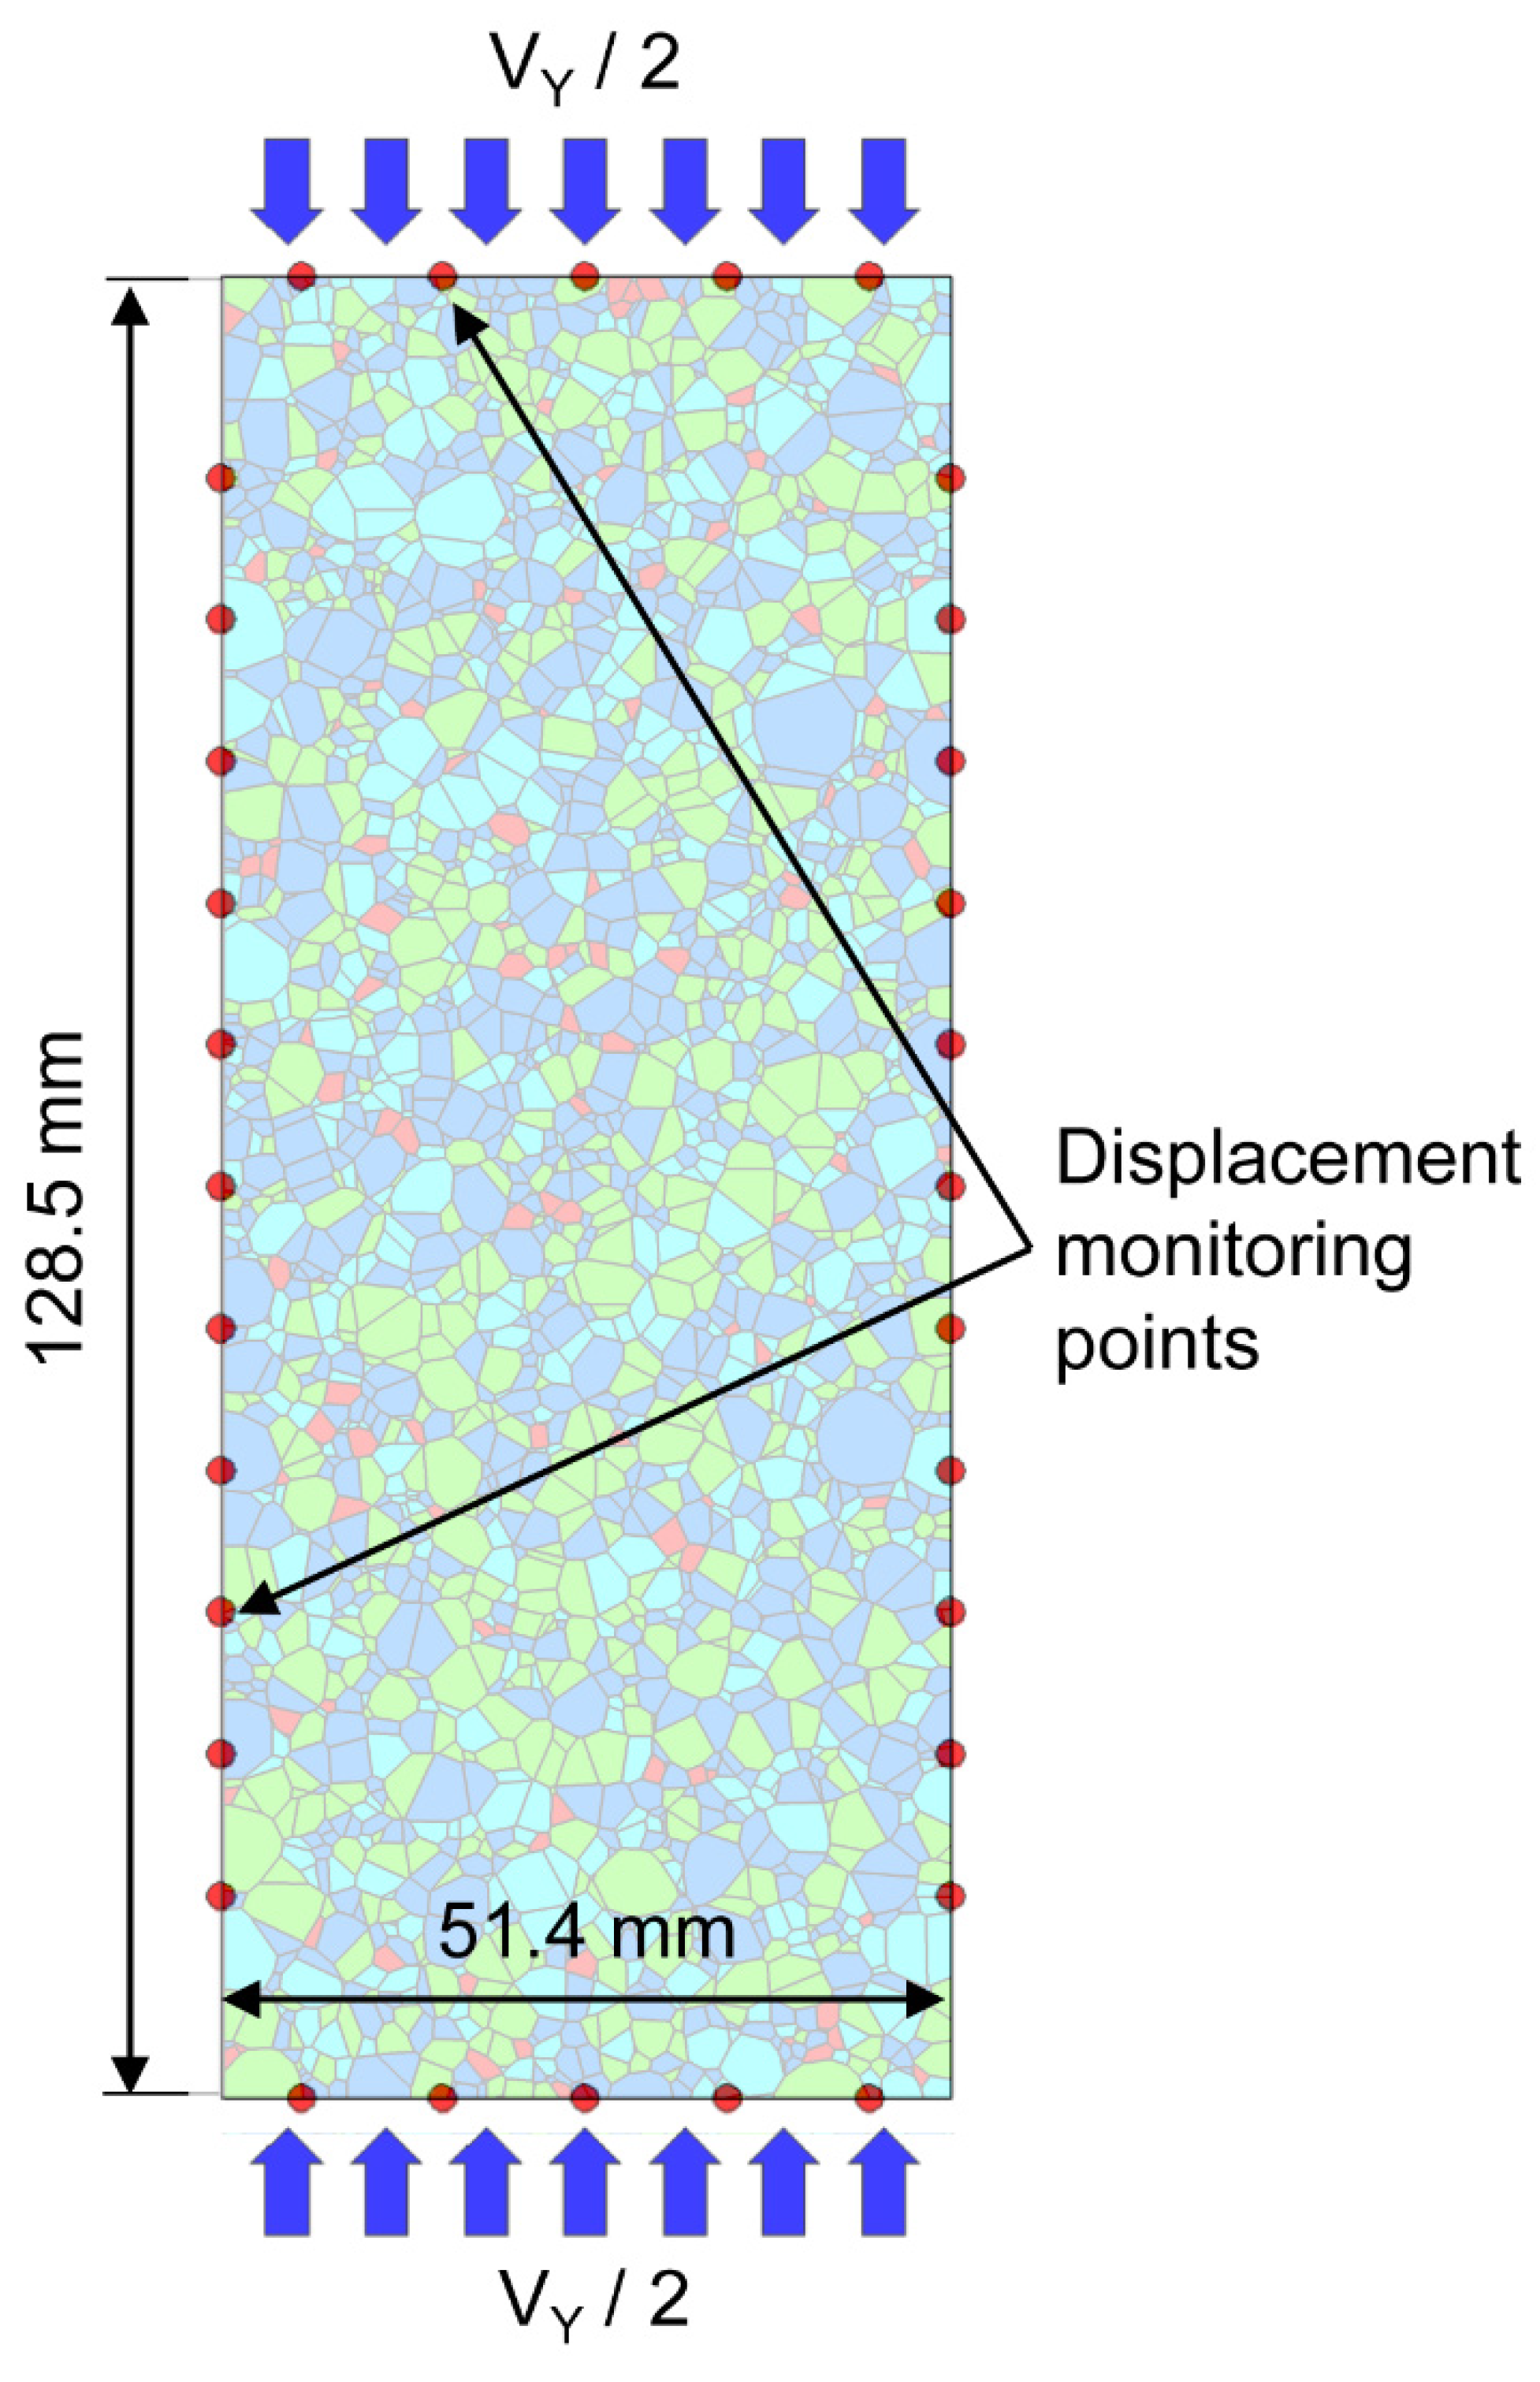
4.1. Numerical Test Setup

In the UCS test simulations, axial load was applied to the specimens via a constant vertical velocity directly to the top and bottom surfaces of the BBM to produce an effective loading velocity, v (i.e., −v/2 and v/2 applied to the top and bottom surfaces, respectively). By applying loading directly on the surface of the model, a frictionless loading condition is set, avoiding the end effect caused by loading platens [11,34]. The loading velocity and applied damping form have great influence on the modeling results. Thus, the loading rate must be appropriately slow and the damping high enough to ensure quasi-static equilibrium conditions for the model [46]. After a sensitivity analysis, a constant velocity of 0.1 m/s was established as a loading rate below which changes in velocity have limited influence on the model results. The “local” damping mode was set for the simulations in UDEC with the default damping coefficient of 0.8. This form of velocity-proportional damping minimizes any dynamic oscillation arising while failure occurs within the model [9,76]. For a loading rate of 0.1 m/s, UDEC automatically calculates a timestep of around 10–8 s for the models, which leads to a loading step of approximately 10–6 mm/step [11].
The axial and lateral strains were monitored using multiple pairs of control grid points. The strains were calculated by averaging the displacements between each pair of control points using a FISH script [73]. Five pairs of points were arranged for tracking the axial strains, and 11 pairs of points were arranged for tracking the lateral strains in the 2D models. The control grid points were located on the edges of the models. Figure 4 shows the strain tracking configuration for the 2D models. The axial stress was tracked and calculated by averaging the axial zone stresses (σyy) measured in all the blocks within the specimens through a FISH script.

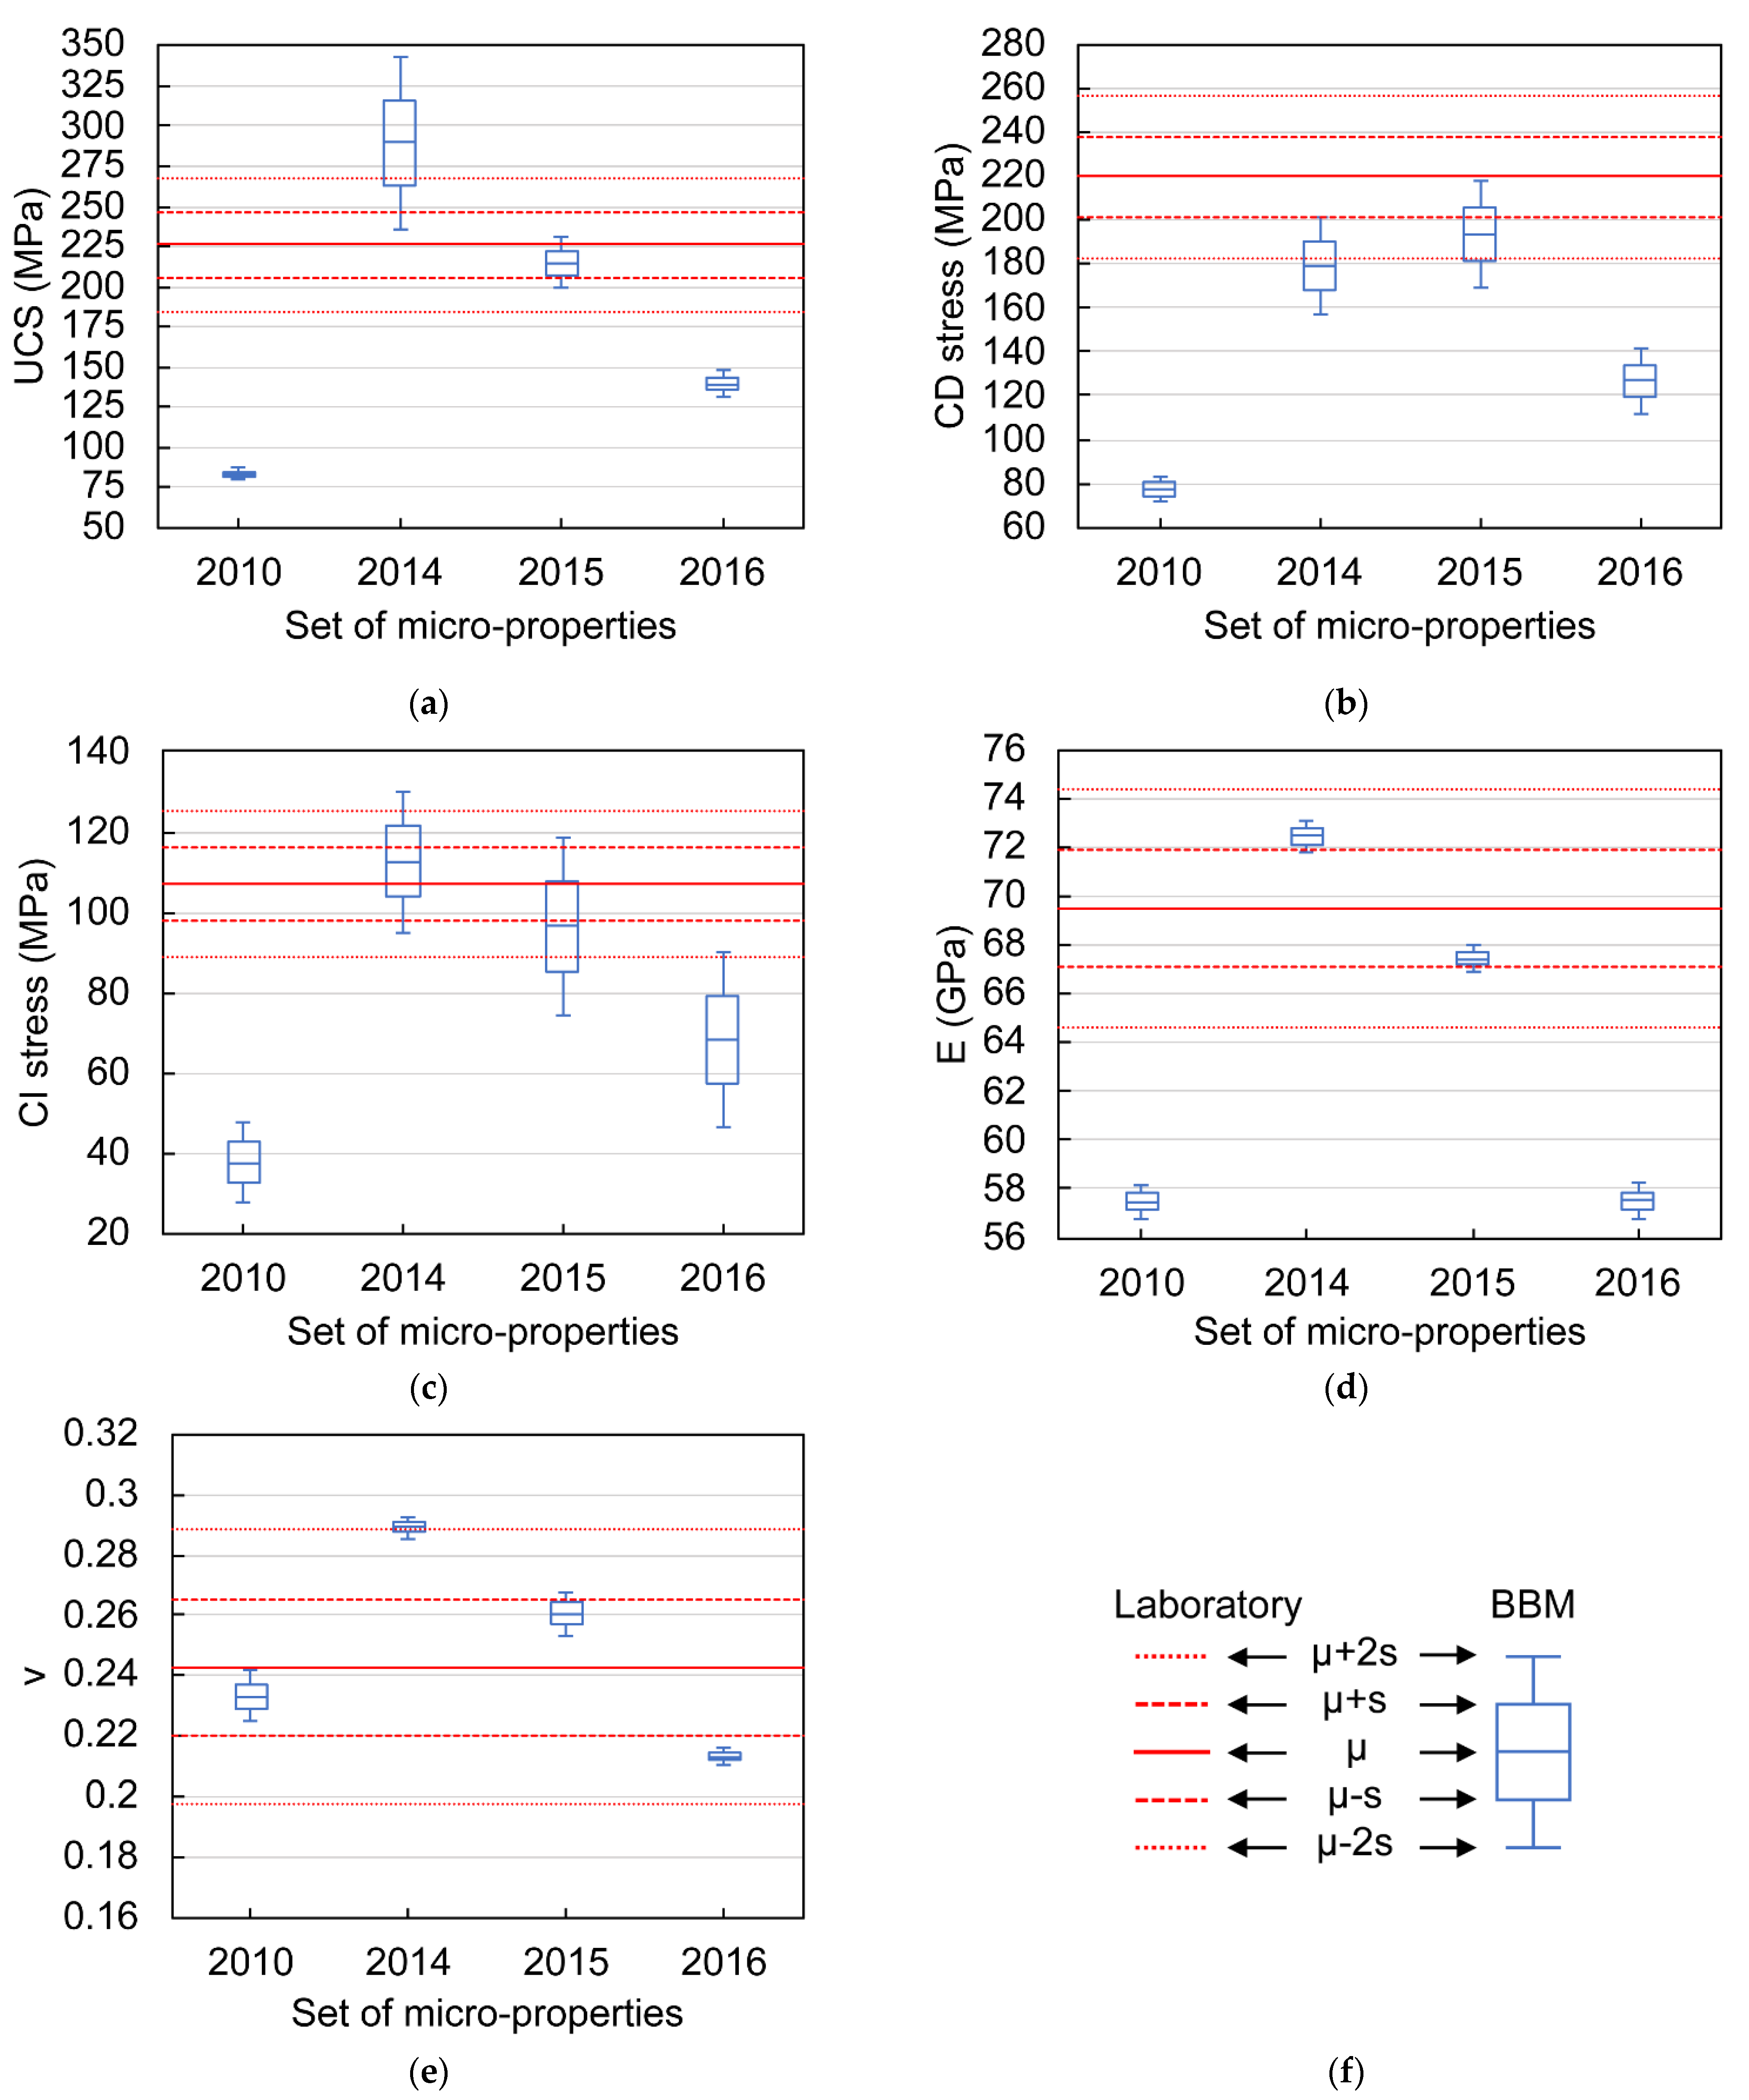
4.2. Evaluation of Micro-Properties for Predictive Modeling Purposes

This portion of the study assesses which one of the four previously calibrated sets of micro-properties can best replicate the macro-mechanical behavior of the Wausau granite when applied in combination with a Voronoi model that closely approximates its grain-structure. Figure 5 shows the stress-strain curve for the average UCS experimental results and representative stress-strain curves resulting from models with each one of the four sets of micro-properties. Note that the model curves show the stress-strain behavior resulting from the same grain-structure representation (in this case, axial Section 3 cut from the baseline model). The results of the simulations show that the micro-properties calibrated by Farahmand and Diederichs [45] provide the most accurate prediction of the Wausau granite’s macro-properties compared to the other three sets of micro-properties. The lack of any notable initial concave section of the stress-strain curve corresponding to a crack closure phase in the experimental strain-stress curve of the Wausau granite is consistent with the fact that the specimens of this granite have very low porosity. The similarities between the experimental curve and the simulated curves suggest that BBMs can closely resemble the initial section of the strain-stress curves of very low porosity rocks such as granites, which typically have less than 1% primary porosity. In other words, the assumption of zero porosity in the generated grain structure appears to be a reasonable approximation. Due to the very brittle nature of the Wausau granite, the post-peak behavior was not recorded during the UCS tests since the specimens failed violently right after they reached the peak strength. As observed in Figure 5, neither of the simulated curves shows a post-peak behavior that resembles the experimental results, nor the typical strength drop expected for most brittle rocks loaded under unconfined conditions. In contrast, the curves show a more ductile behavior associated with the increased post-peak grain interlocking resulting from modeling the grains as unbreakable elastic bodies. Accordingly, the post-peak results shown in Figure 5 should not be considered realistic and will not be analyzed in this paper. However, as stated previously, the use of unbreakable elastic grains has negligible effects on the pre-peak simulation results [43] and macro-property predictions.
Figure 6 presents the mean and variability (i.e., standard deviation) of the macro-properties (i.e., UCS, crack damage stress, crack initiation stress, Young’s modulus and Poisson’s ratio) predicted using 18 models for each set of micro-properties. The predicted macro-properties are compared with the actual macro-properties of the Wausau granite obtained in the laboratory, which are also presented in terms of mean and standard deviation.
On average, the micro-properties from Farahmand and Diederichs [45] predict UCS values very close to the average experimental peak strength of the Wausau granite (226 MPa). The micro-properties from Chen and Konietzky [64] produced higher peak strength values with an average of 289 MPa, 28% above the actual average peak strength of the Wausau granite. The sets of parameters from Lan et al. [8] and Chen et al. [65] provided estimations significantly below the real Wausau granite’s UCS, around 83 MPa (63% lower) and 139 MPa (38% lower), respectively (see Figure 6a).
The micro-properties from Chen and Konietzky [64] and Farahmand and Diederichs [45] provide the best approximations of the CD and CI stresses. In the case of the CD stress, the Chen and Konietzky [64] micro-parameters result in average values 18% lower than the actual average CD stress, whereas the set from Farahmand and Diederichs [45] results in values around 198 MPa (10% below the actual average CD stress). For the CI stress, the results from Chen and Konietzky [64] average 113 MPa (5% above the actual CI stress), whereas the results from Farahmand and Diederichs [45] average 97 MPa (10% below). The sets from Lan et al. [8] and Chen et al. [65] produced results well below the real CD and CI stresses. The micro-properties from Lan et al. [8] average 77 MPa (65% below) and 37 MPa (65% below) for the CD stress and CI stress, respectively. The set of Chen et al. [65] produces average CD and CI stress values of 127 MPa (42% below) and 68 MPa (36% below), respectively (see Figure 6b,c).
Regarding the prediction of the Young’s modulus (Figure 6d), again, the micro-properties from Chen and Konietzky [64] and Farahmand and Diederichs [45] achieve the best predictions. The results of Chen and Konietzky [64] average 72 GPa, and the results from Farahmand and Diederichs [45] average 67 GPa, 4% above and 3% below the actual average Young’s modulus of the Wausau granite, respectively. Both the sets of micro-properties from Lan et al. [8] and Chen et al. [65] predict on average 57 GPa for the Young’s modulus, which is 17% lower than the actual value. The four sets of micro-properties produce predictions of the Poisson’s ratio that are close to the average value measured in the laboratory (0.24). On average, the predictions differ 4% [8], 19% [64], 7% [45] and 12% [65] from the average actual Poisson’s ratio (see Figure 6e). Table 12 summarizes the average values of the predictions.

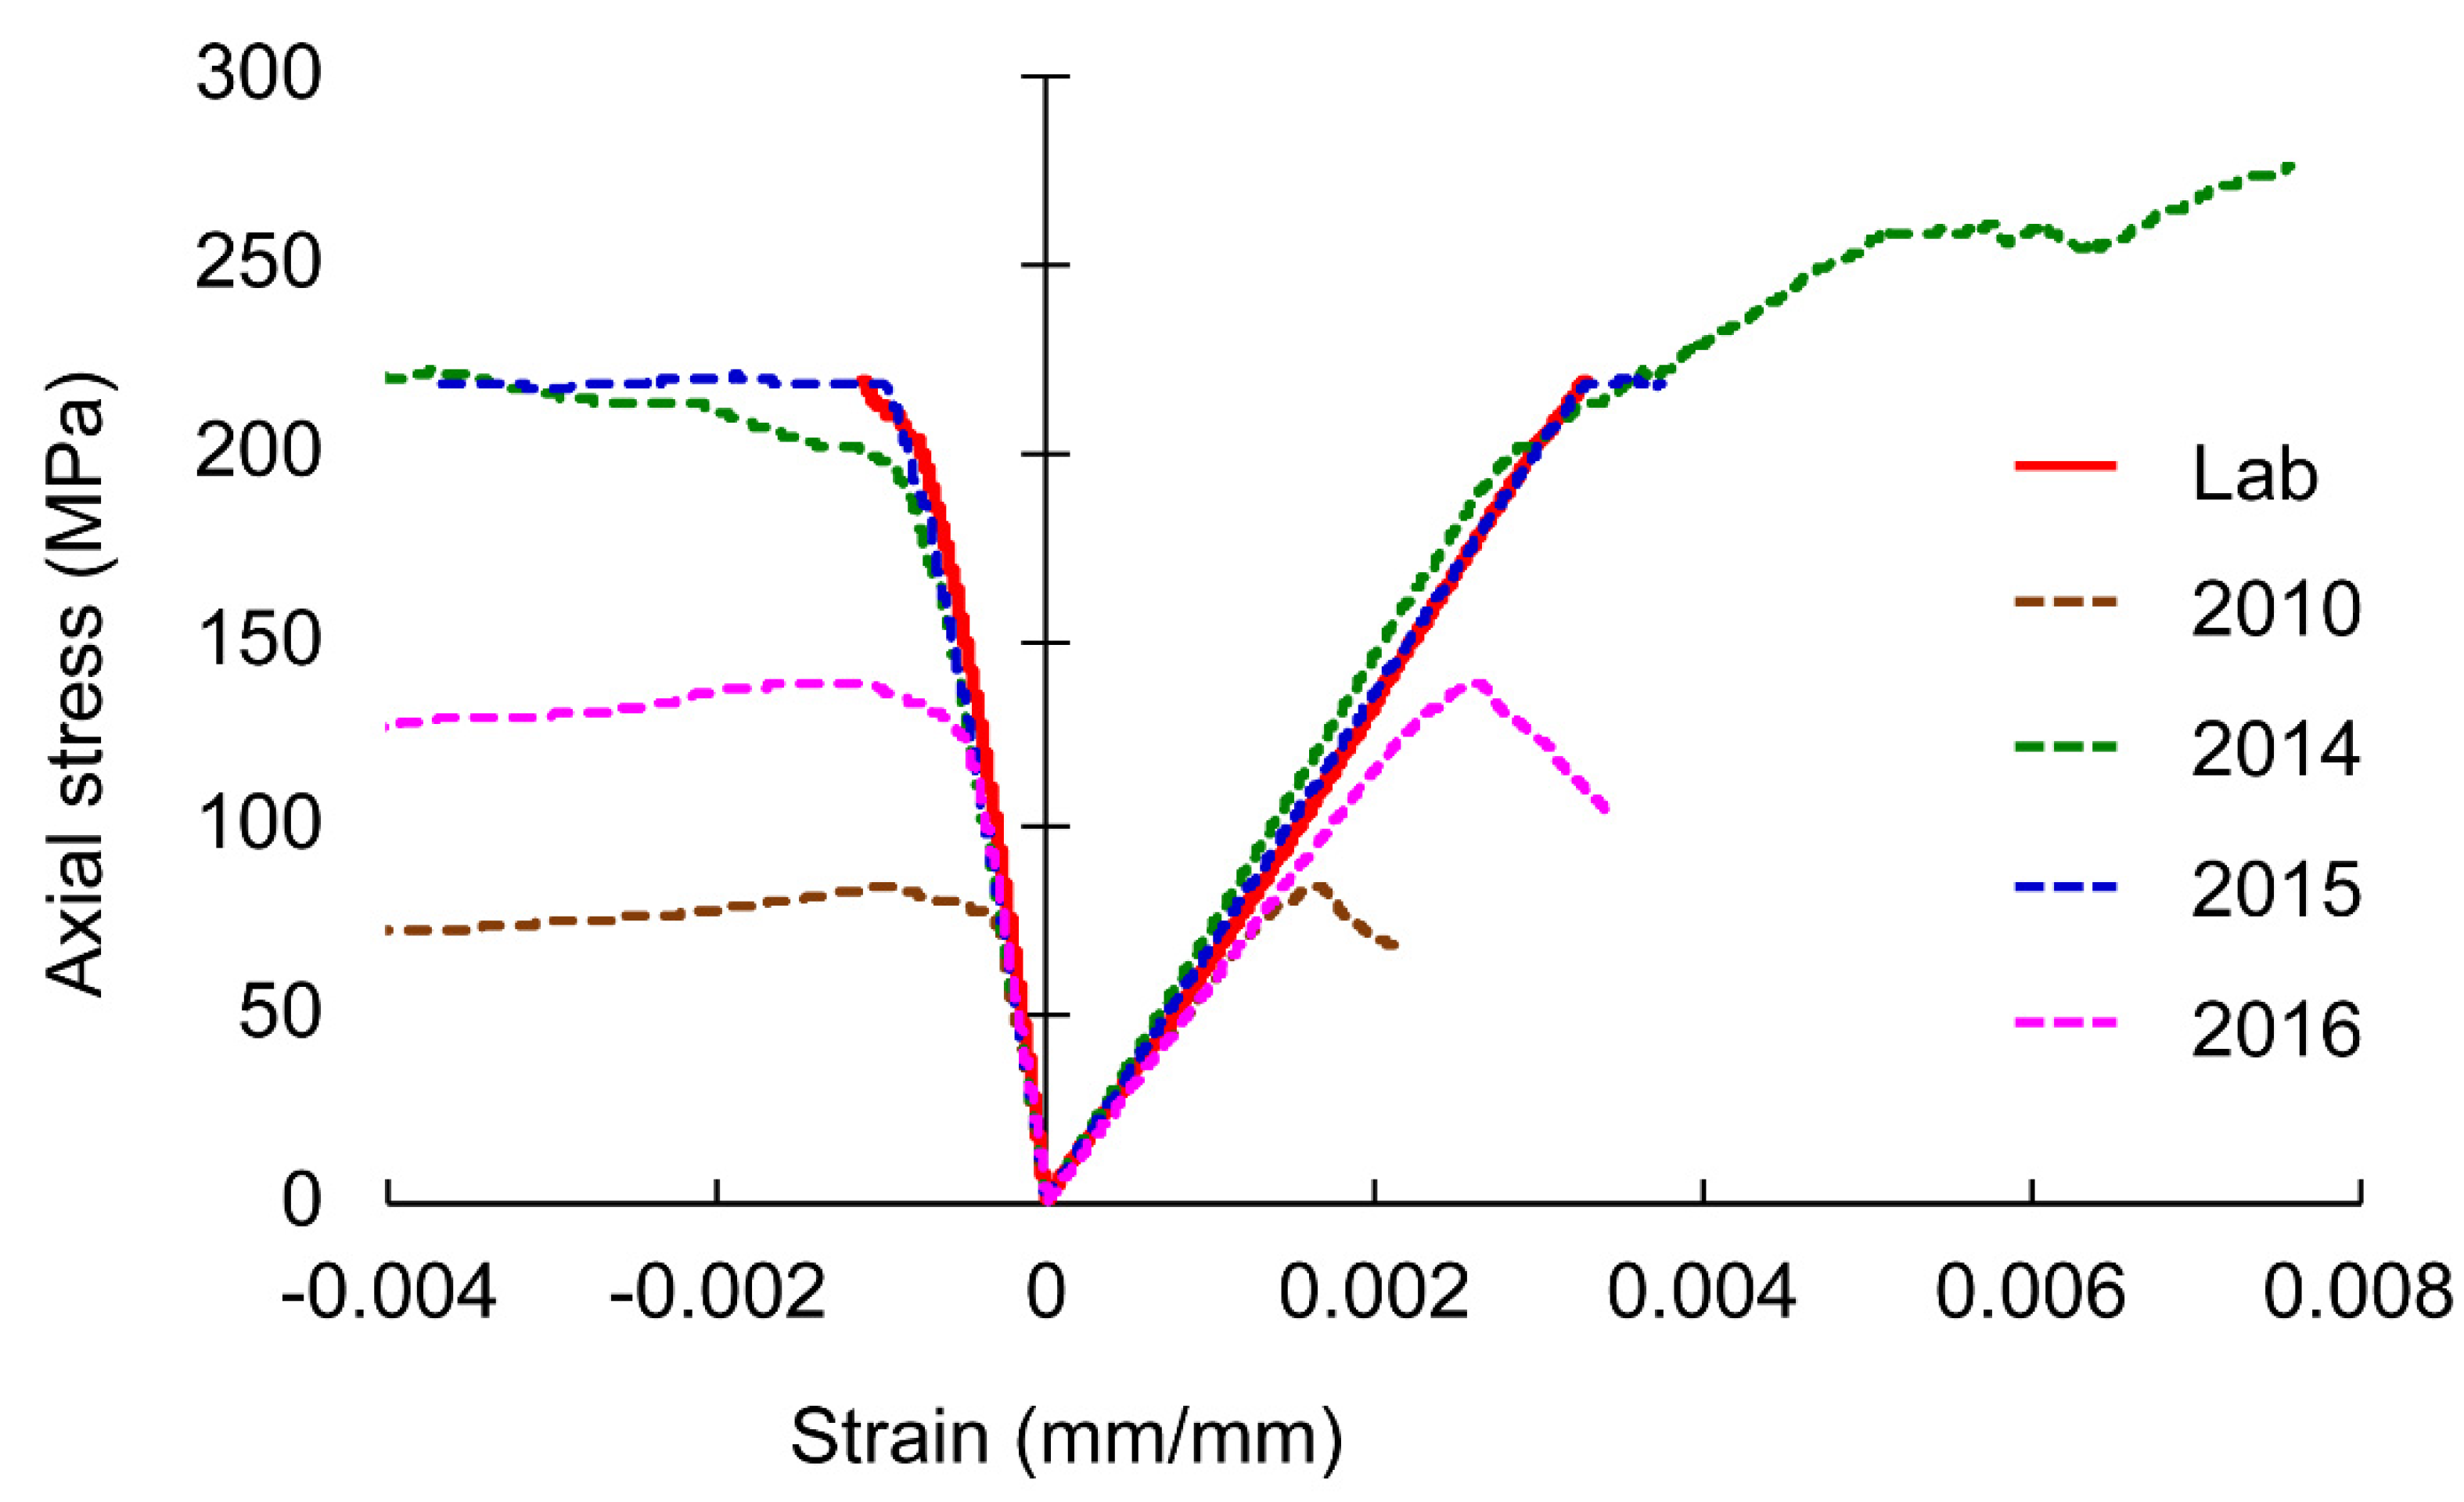
Discussion on the Capabilities of Published Micro-Properties for Prediction Purposes

Even though the micro-properties from Lan et al. [8], Chen and Konietzky [64] and Farahmand and Diederichs [45] were calibrated for the Lac du Bonnet granite, and the micro-properties from Chen et al. [65] were calibrated to a different granite with very similar characteristics, the values of the published parameters are very different from set to set. Consequently, when these sets of micro-properties were used to predict the macro-properties of the Wausau granite, the resulting parameters showed clear disparities, which are especially noticeable in the predicted UCS, CD and CI values. The differences in the calibration process and simplifications used for the calibration of the micro-properties within the four studies must be considered in order to explain the obtained results.
In the case of Lan et al. [8], the study used specimen models scaled to different sizes to perform the calibration and reduce the required simulation time. A reduced-scale model was used for the calibration of the contact stiffness micro-properties (i.e., normal and shear stiffness), whereas the rest of the contact micro-properties were calibrated using a full-scale model. Contact strength micro-properties (i.e., cohesion, friction angle and tensile strength) were adjusted applying a major simplification: the same values of friction, cohesion and tensile strength were assigned to all the contacts in the models. This suggests that the physics involved in the micro-mechanical behavior of each type of mineral grain is not properly represented. Chen and Konietzky [64], Farahmand and Diederichs [45] and Chen et al. [65] followed iterative multi-step processes to adjust the micro-properties using one single grain-structure model, resulting in unique values of stiffness and strength contact micro-properties for each type of contact. However, they adjusted the parameters under different test conditions (e.g., UCS tests, triaxial compression strength tests, Brazilian tensile strength tests, direct tensile strength and fracture toughness tests). Chen and Konietzky [64] calibrated the micro-properties based only on UCS, Brazilian tensile strength and fracture toughness test simulations. Therefore, their parameters are able to provide realistic predictions of the rock behavior only under unconfined or low-stress conditions. This explains the unrealistic post-peak behavior shown in the stress-strain curve predicted for the Wausau granite using this set of micro-parameters (see Figure 5). Chen et al. [65] used only triaxial compression test simulations for the calibration, obtaining a set of micro-properties that only provides realistic predictions of the mechanical behavior under confined compression conditions. Figure 5 shows that the set of micro-properties from Chen et al. [65] fails to predict the unconfined peak strength of the Wausau granite accurately. Finally, Farahmand and Diederichs [45] used UCS, triaxial compression strength and Brazilian tensile strength tests for the calibration of the micro-properties covering a broader spectrum of confining stress conditions, which in our view provided the most well-constrained and therefore broadly applicable set of micro-properties for the mineral and contact types considered. It is therefore somewhat unsurprising that these properties provided the best overall prediction of Wausau granite properties. The micro-properties calibrated by Farahmand and Diederichs [45] were used to analyze the effect of mineral arrangement, grain shape and grain size, in the following sections, since they provide the best approximations of the Wausau granite macro-properties.

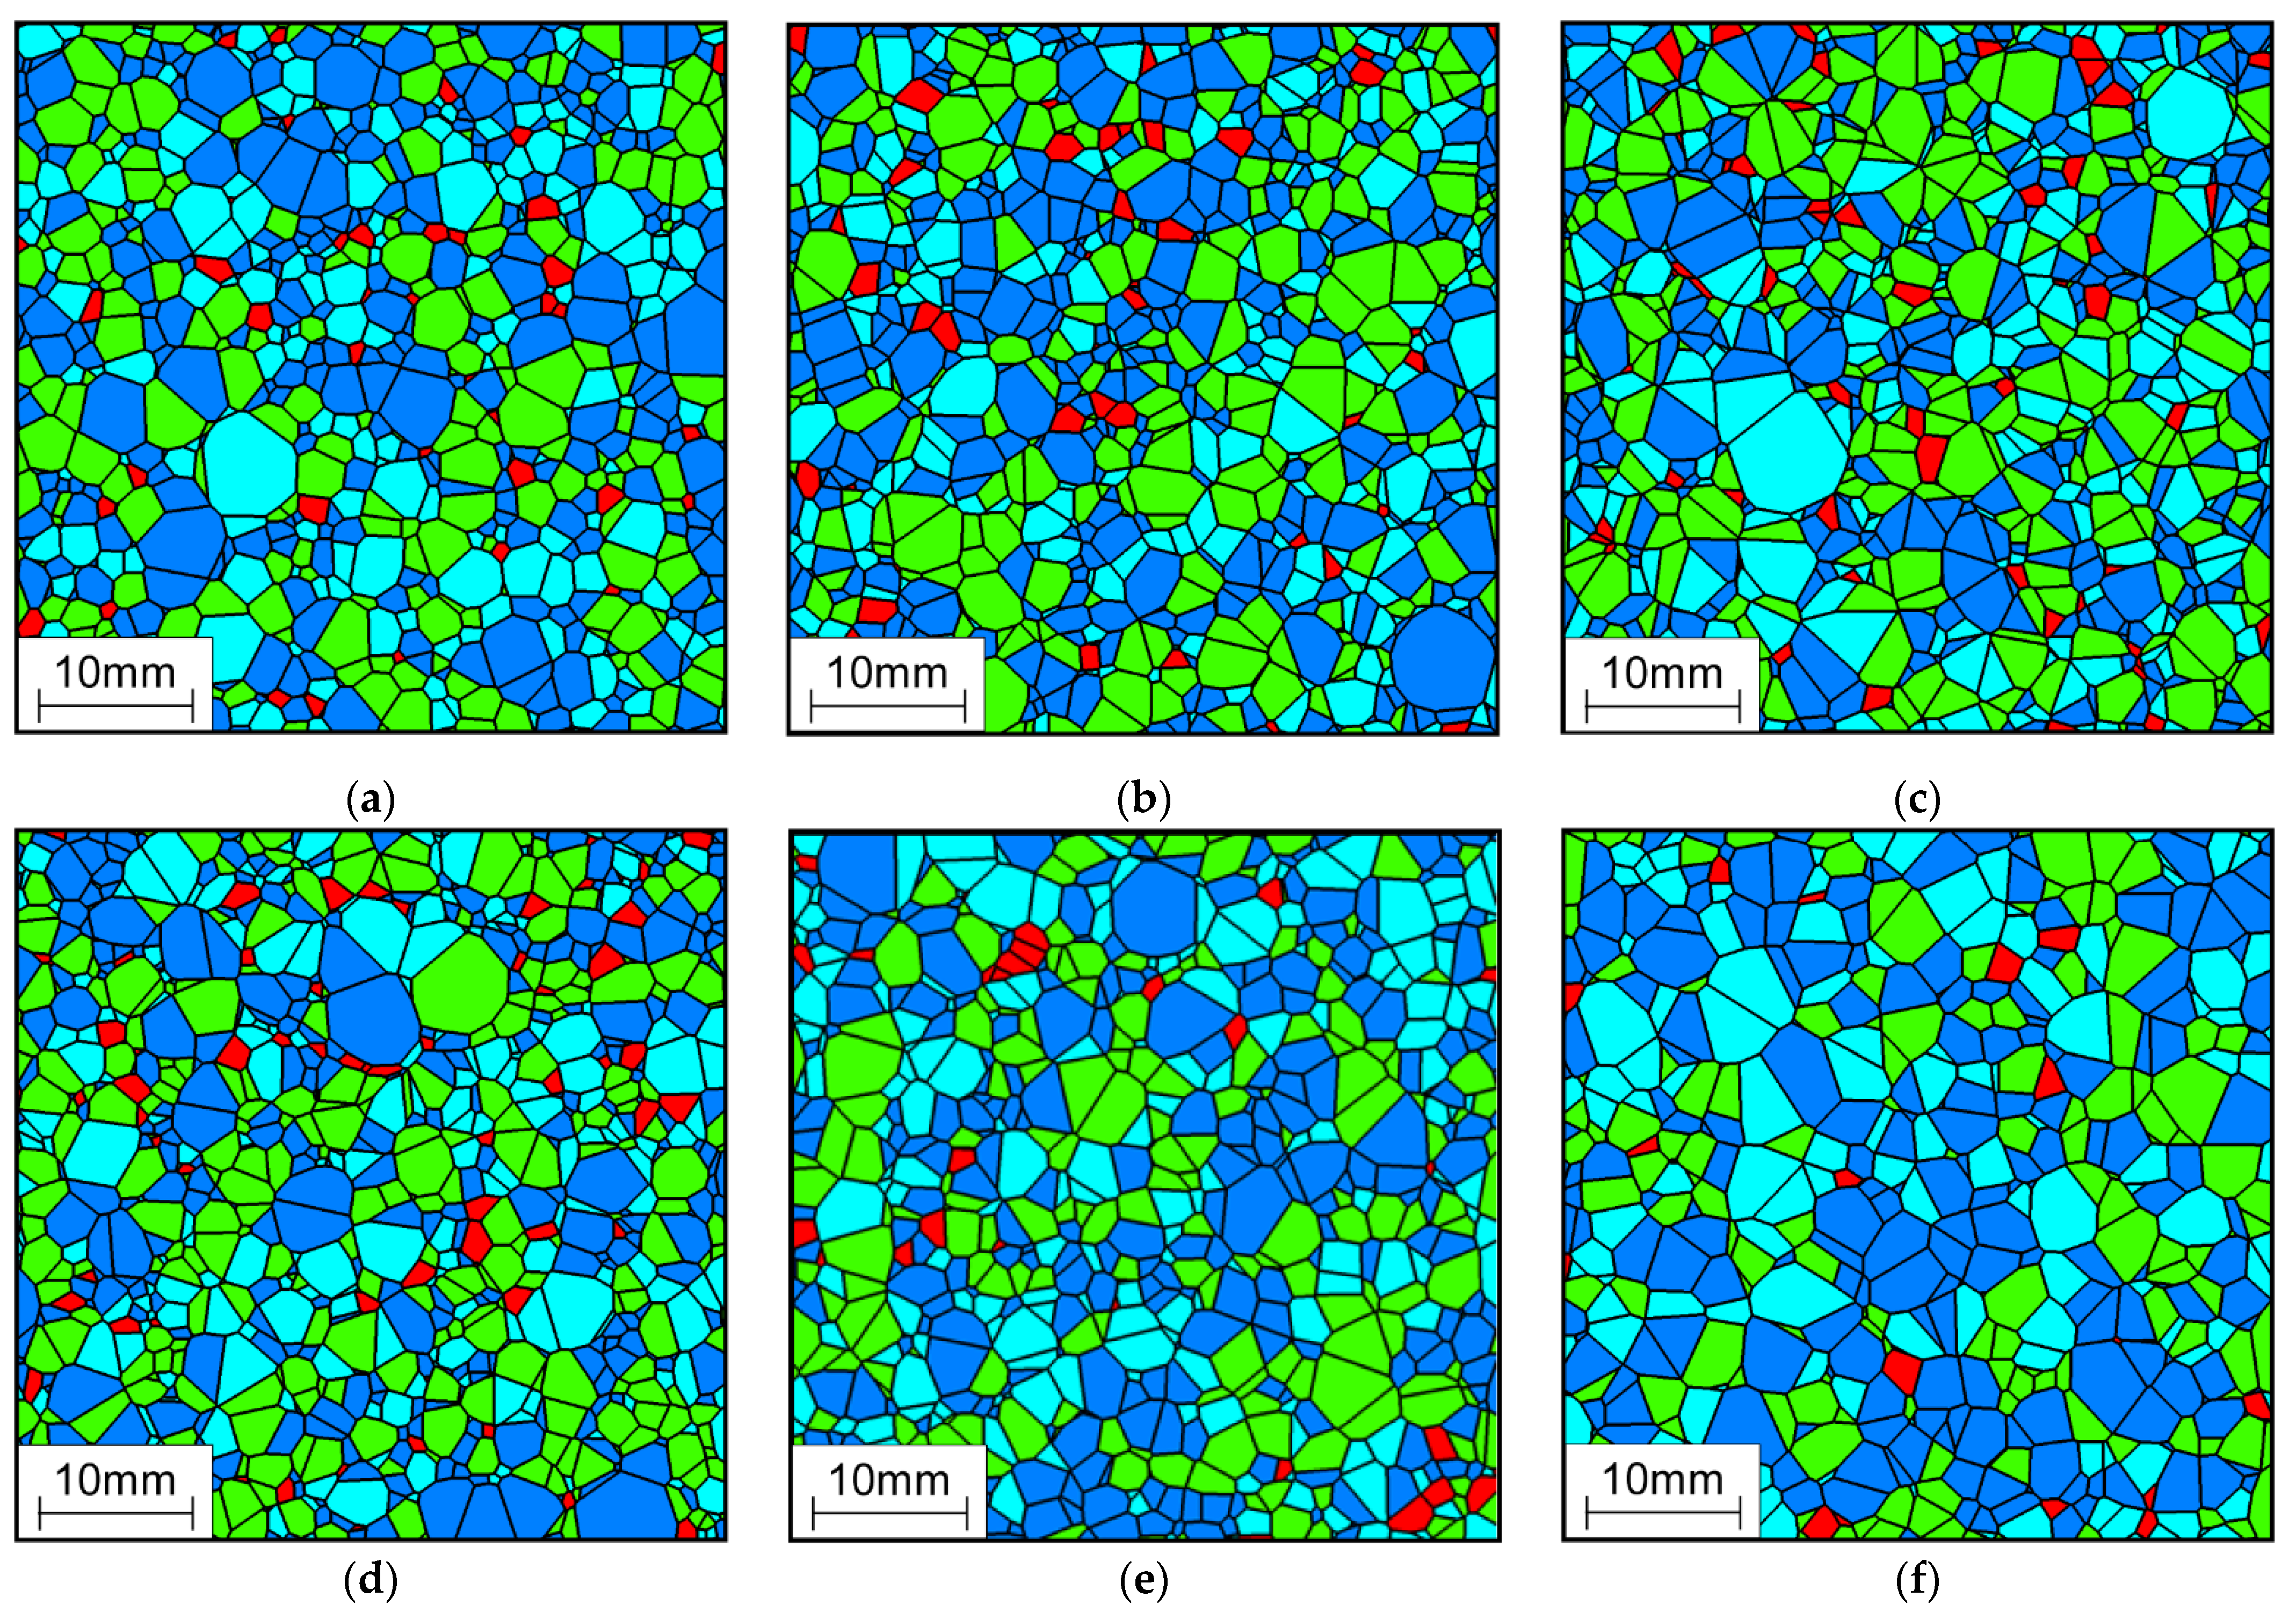
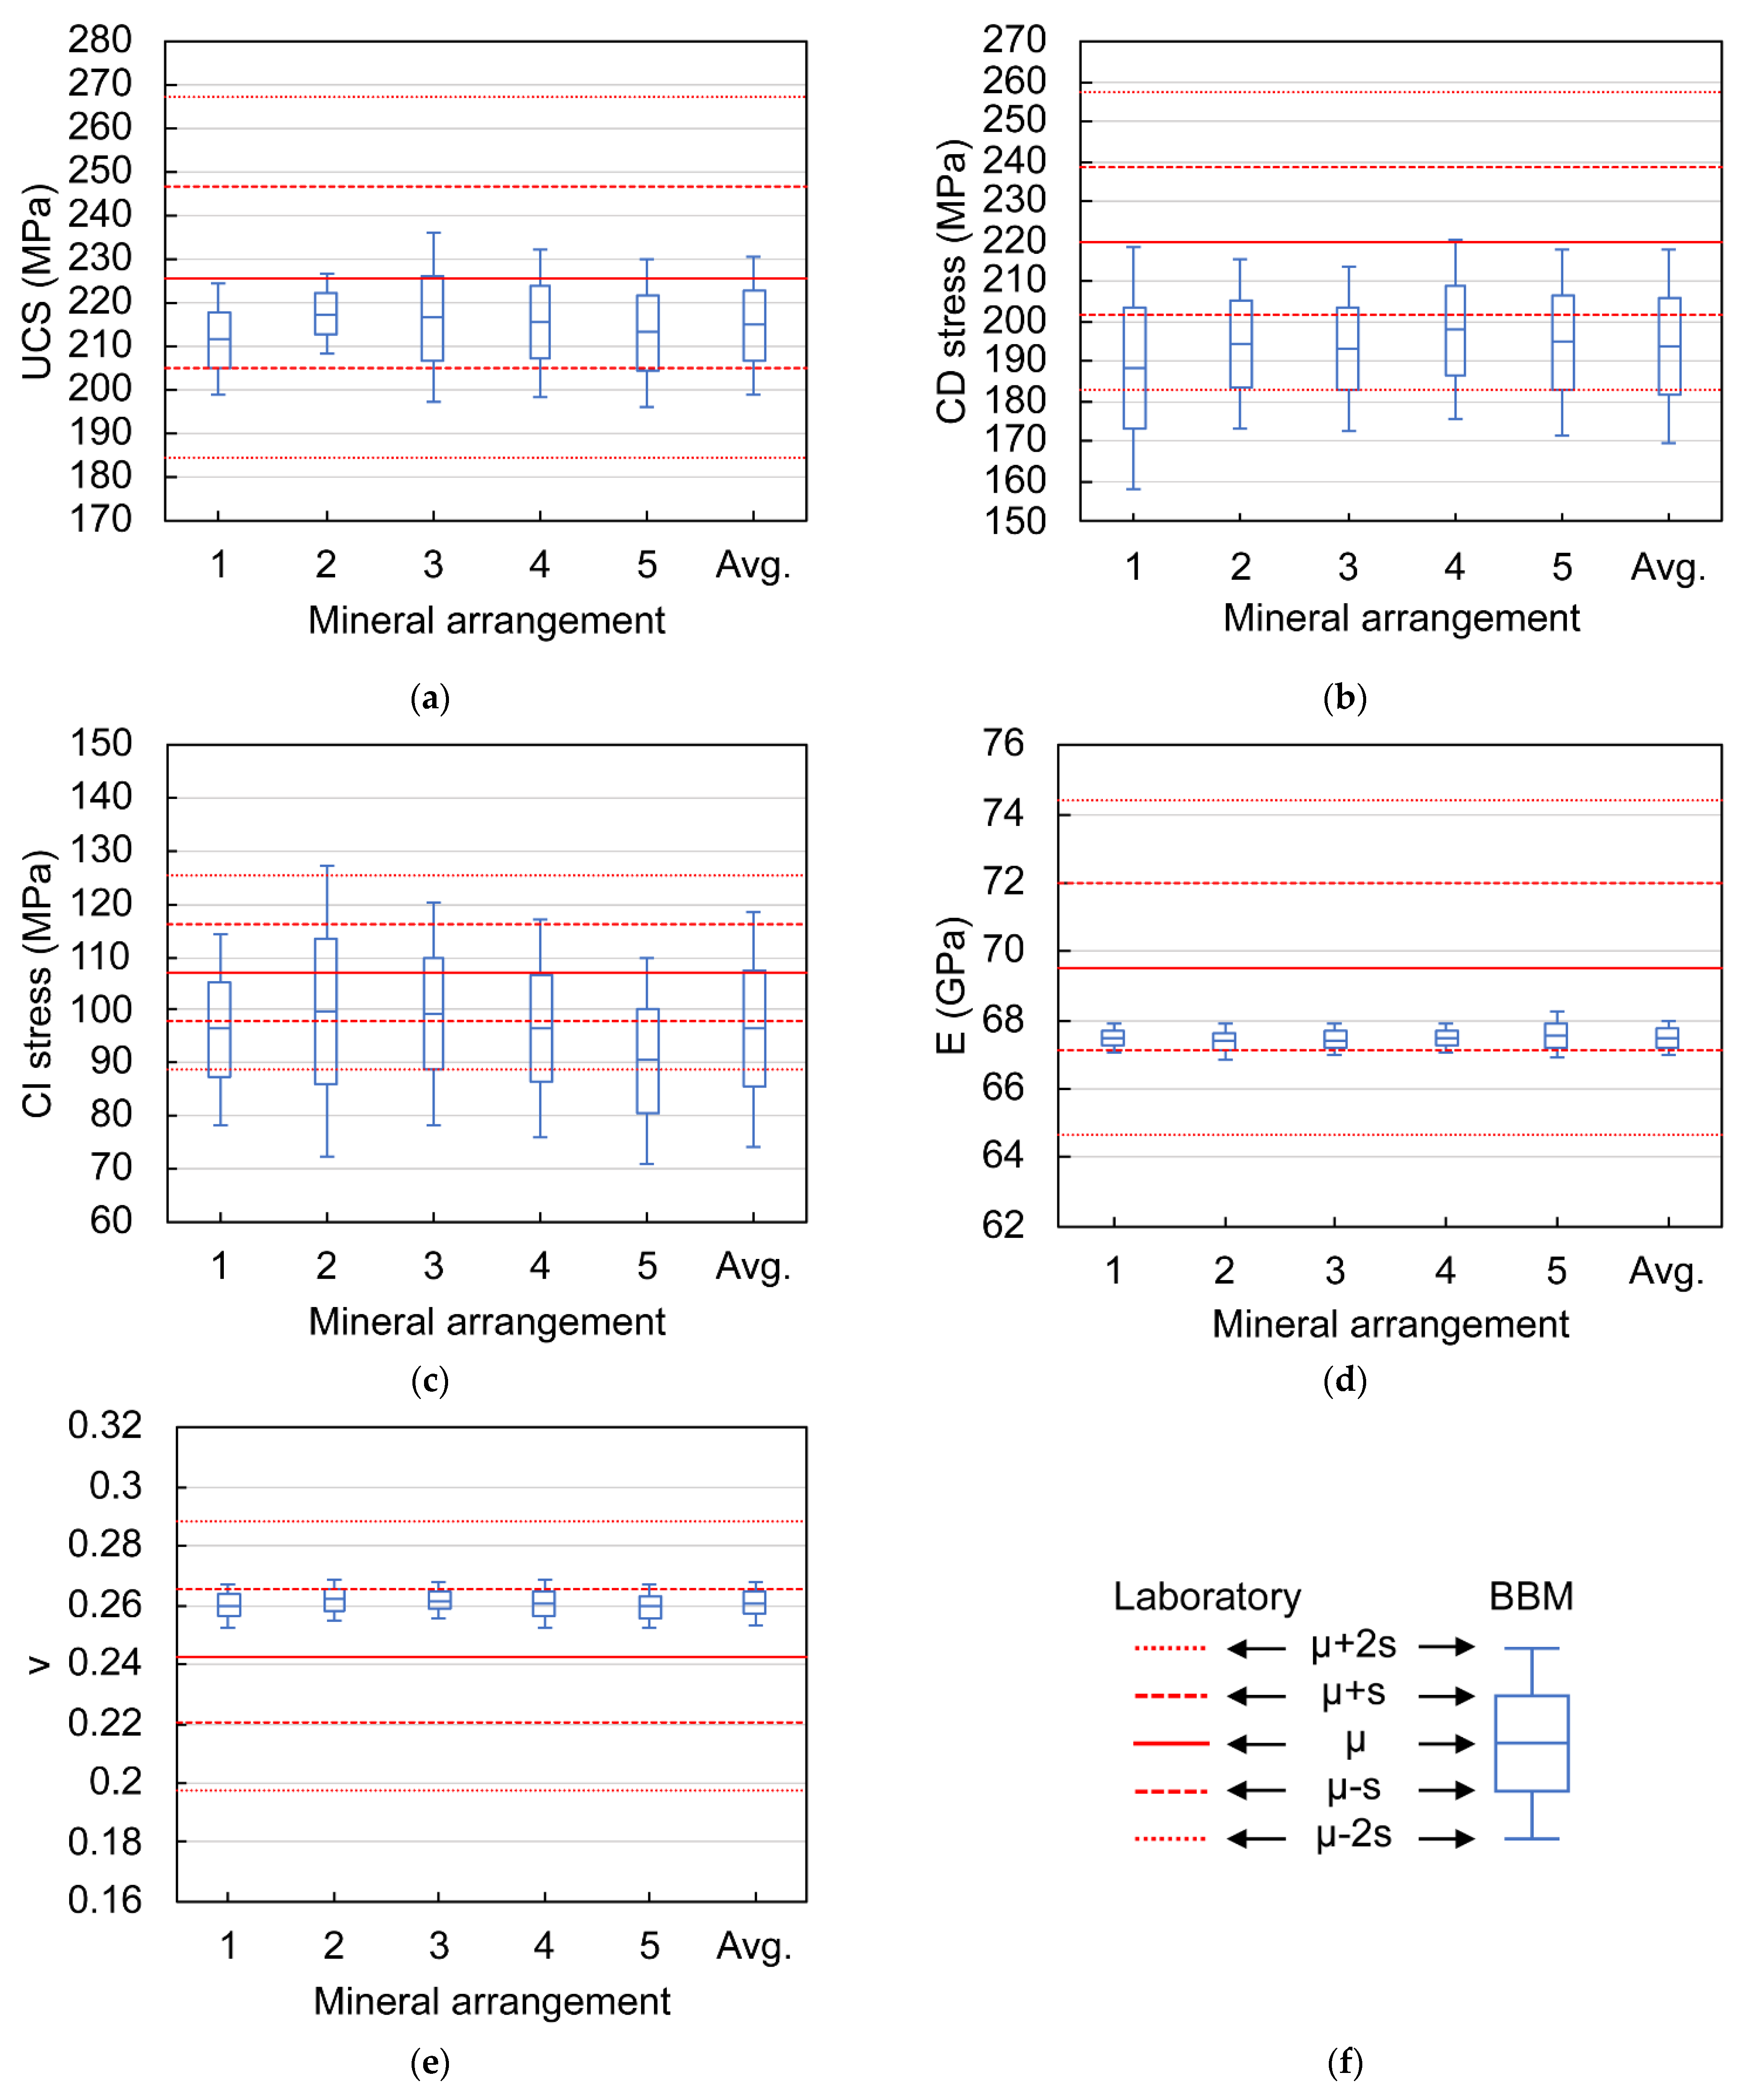
4.3. Effect of Mineral Arrangement and Voronoi Grain-Structures

The influence of the mineral arrangement was analyzed by comparing five sets of 18 2D BBMs generated from five 3D representations of the Wausau granite. These 3D representations are equivalent between each other in terms of mineral content and grain-structure geometry, but different with regards to mineral type assigned to each grain. In contrast, the influence of randomly-generated Voronoi grain-structures was analyzed through the variations in the predictions within each set of 2D models. Figure 7 shows the distribution of the predicted macro-properties per each one of the sets of 2D BBMs (1, 2, 3, 4 and 5) and the overall distribution. Table 13 and Table 14 summarize the results in terms of their means and standard deviations, respectively.
As expected, the different mineral arrangements represented in the BBMs led to a variety of rock macro-property predictions. This indicates that the stochastic effects introduced by mineral arrangement assignment and Voronoi grain-structures significantly affect the prediction results, independently of the mineral content and grain geometric features represented in the models. Even though the average macro-property predictions for each of the five sets of BBMs closely approximate the average experimental macro-properties (differences less than 16%), the standard deviations of the predictions differ significantly from one another.
Specifically, the UCS, CD stress and CI stress tend to vary more significantly based on differences in stochastic grain structure characteristics than the Young’s modulus and Poisson’s ratio. This is evident when comparing the distributions of the predictions of each set of 18 BBMs and the overall predictions. In addition, the results of this analysis show that compared to other macro-properties, the standard deviations of the CI stress predictions tend to exceed the experimental variability of the Wausau granite, ranging between 98 and 151% of the observed standard deviation among the five different grain structure cases. The standard deviations of the UCS and CD predictions range from 31 to 47% and 55 to 81% of the experimental standard deviations of these parameters, respectively. In the case of the Young’s modulus and Poisson’s ratio, the standard deviations range from 9 to 14% and 14 to 18% of the experimental standard deviations, respectively.
The final analysis of this section examined the predictions of macro-properties of the Wausau granite to determine whether these predictions were realistic. This was accomplished by comparing the range of predicted values against the range of laboratory results. Considering all the 90 2D models used in this assessment, the predicted values for the UCS, Young’s modulus and Poisson’s ratio fall within the observed range of the experimental macro-properties (i.e., μ ± 2σ interval), whereas the predictions for the CD stress and CI stress are within this experimentally constrained range in 82 and 71% of the simulations, respectively. Therefore, all predictions for the UCS, Young’s modulus and Poisson’s ratio can be considered reasonable approximations of the true values of these parameters. In contrast, some of the CD stress and CI stress predictions fell below the experimentally constrained range.

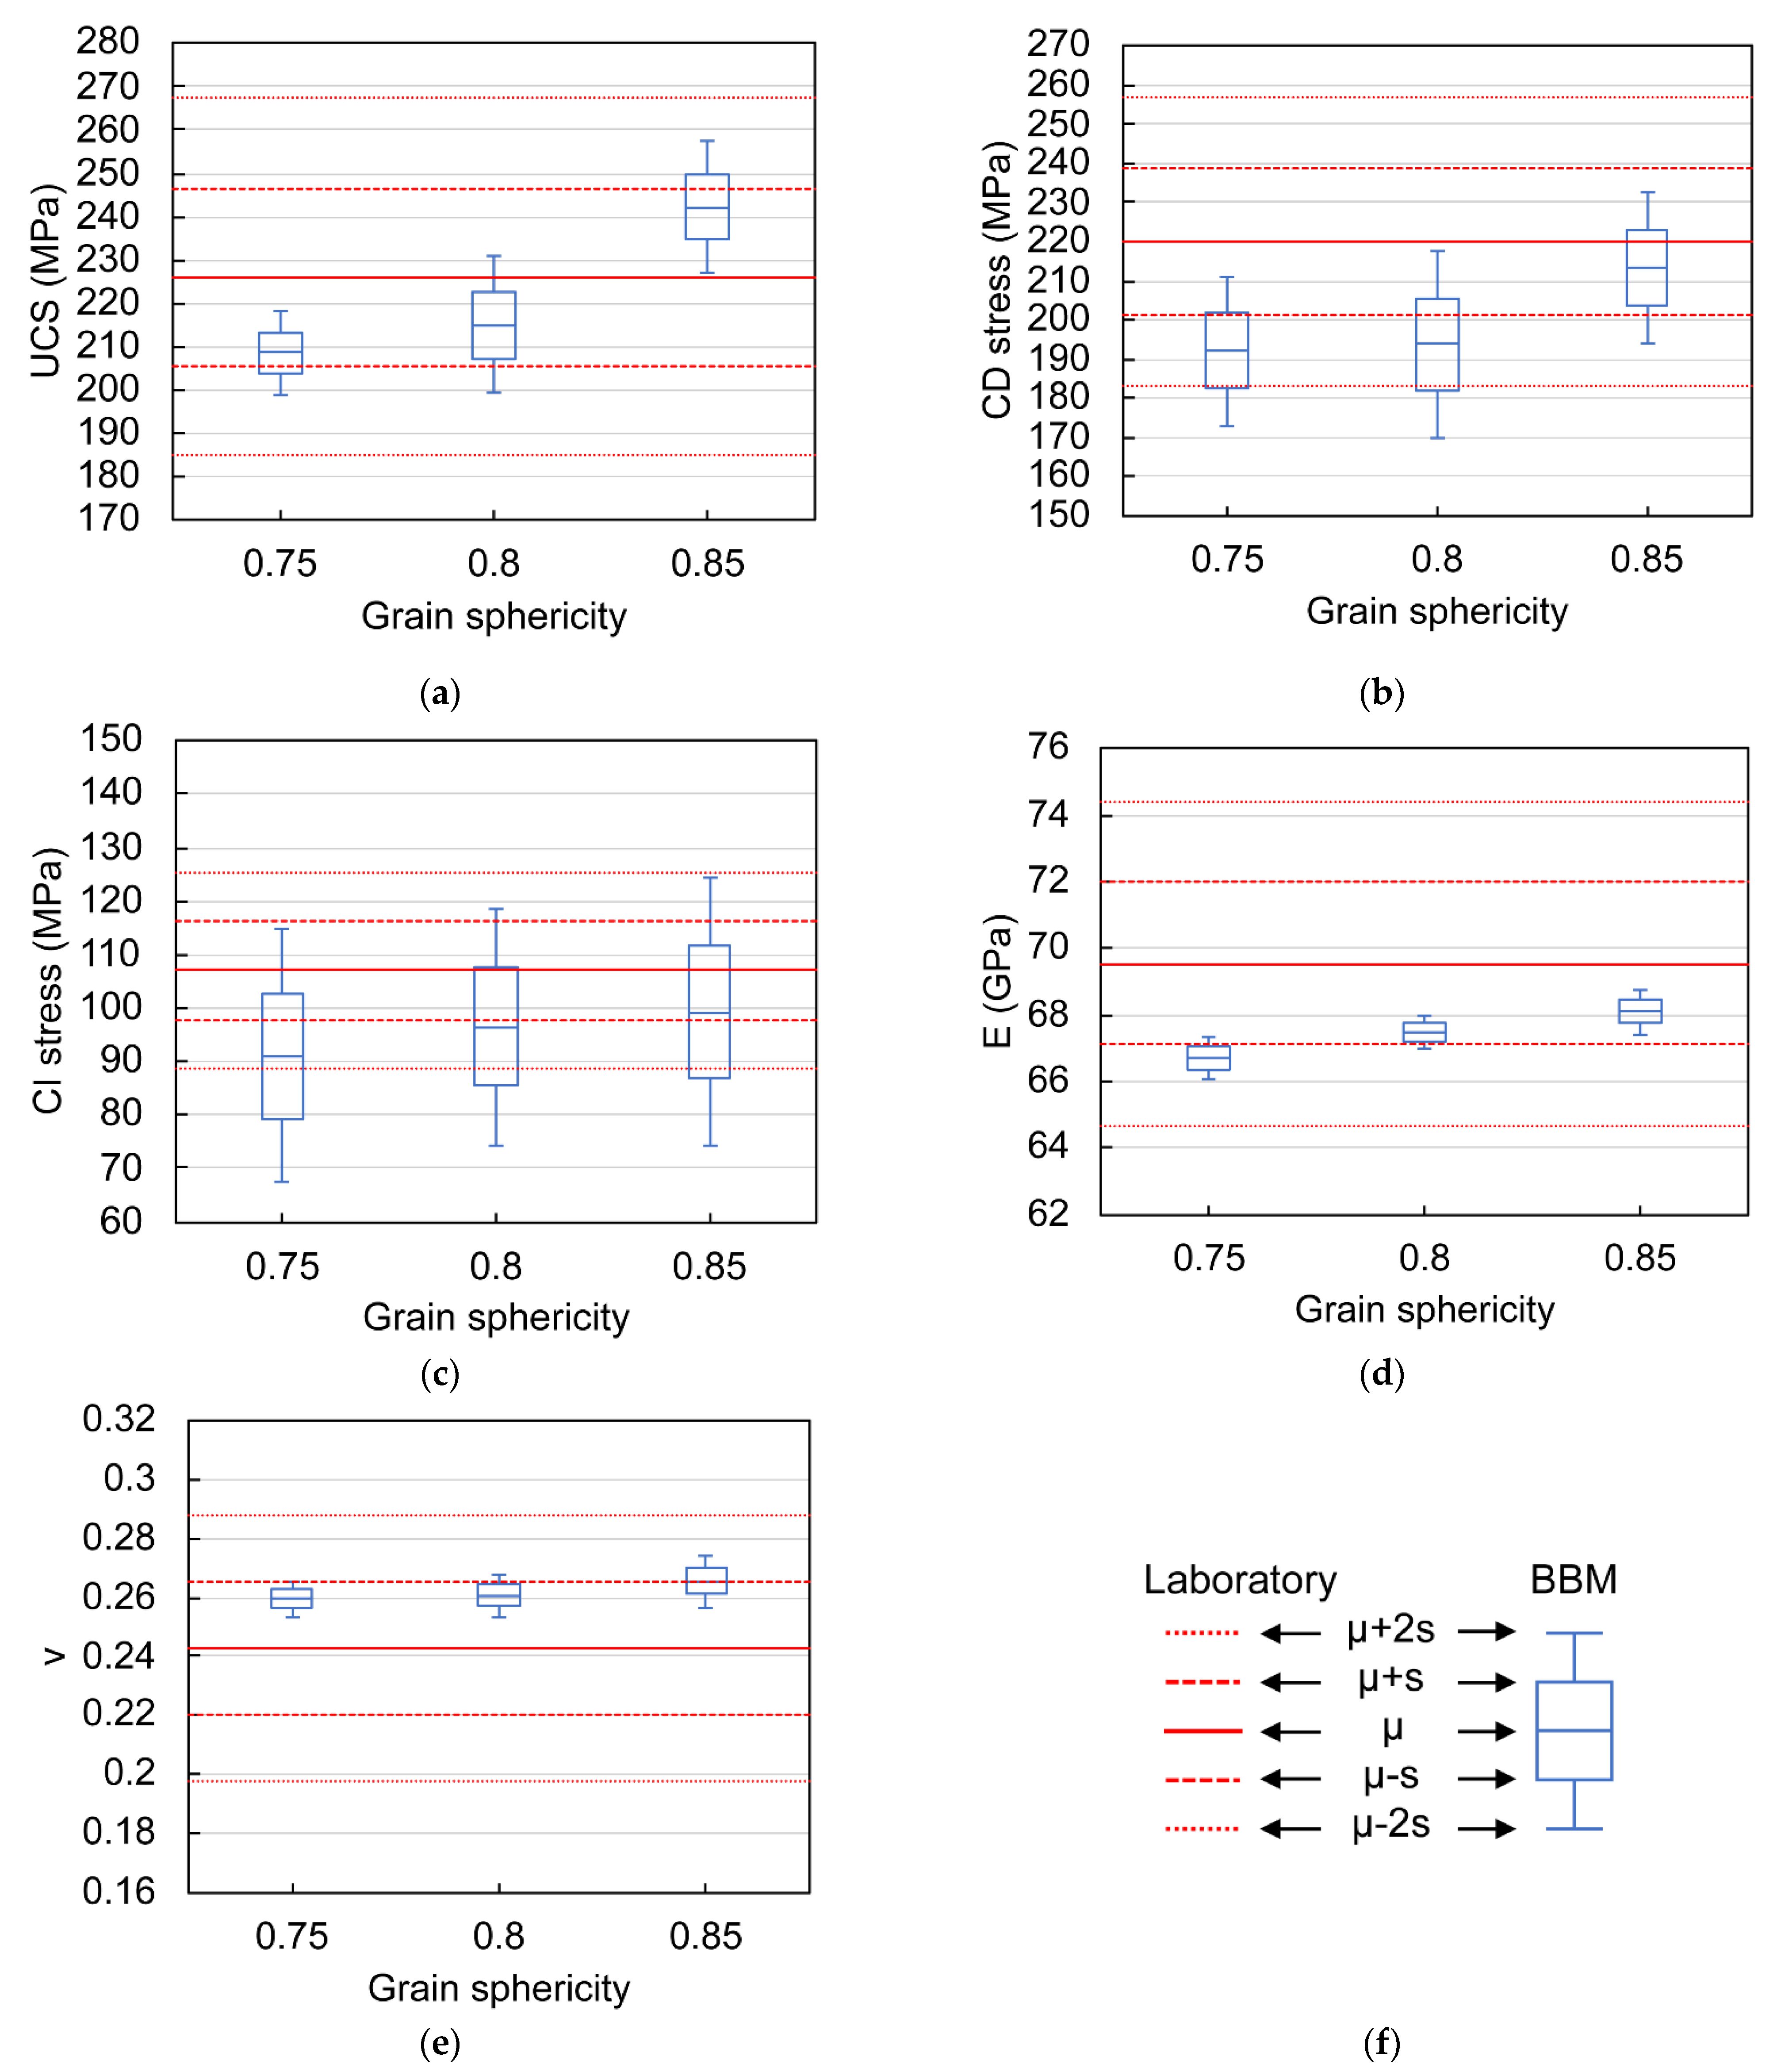
4.4. Effect of Grain Shape

In this analysis, the grain shape is expressed in terms of the sphericity parameter used in Neper [67]. Figure 8 shows the comparison of the predicted macro-properties for three different values of sphericity: low sphericity (0.75), moderate sphericity (0.80) and high sphericity (0.85), where the moderate sphericity case was qualitatively assessed to correspond to the most realistic representation of the average grain shape of the Wausau granite. Table 15 summarizes the average predictions for this analysis.
For all analyzed macro-properties, the results indicate a slight influence of the average grain sphericity on the predictions. For UCS, CD stress and CI stress, the predictions tend to show higher values as the sphericity increases. Regarding the UCS predictions (Figure 8a), the average values for low sphericity (209 MPa), moderate sphericity (215 MPa) and high sphericity (242 MPa) are very close to the actual peak strength of the rock, with differences of less than 8%, 5% and 7%, respectively. Note that the influence of sphericity on UCS is non-linear, with the average high sphericity strength prediction being significantly larger than the predictions in the low and moderate sphericity cases. The CD stress (Figure 8b) presents a similar behavior to the UCS. Low sphericity and moderate sphericity predictions average 192 MPa (13% below the real CD stress) and 194 MPa (12% below the real CD stress), whereas the high sphericity prediction reached an average of 213 MPa (3% below the real CD stress). In the case of the CI stress (Figure 8c), the average predictions corresponding to the different degrees of sphericities are all close to the average laboratory value (<15% difference), with the values again increasing with increasing sphericity.
The described behavior appears to be associated with the degree of interlocking within the grain structure. As previously described in the studies of Azocar [50], Mayer and Stead [46] and Zhu et al. [58], polyhedral grain shapes tend to provide higher degrees of interlocking within grains that favor tensile failure between grains and lead to higher peak strengths, in contrast to triangular grain shapes that favor shear failure between grains. Correspondingly, in this study, grains with high sphericity are more interlocked, resulting in a higher propensity for tensile failure between grains as opposed to shear failure, since grains with lower sphericity tend to more closely approximate triangular shapes.
The results also show a correlation between the degree of sphericity and the stiffness of the model: the greater the sphericity, the greater the Young’s modulus and the Poisson’s ratio. Nevertheless, the effects of sphericity on these parameters are relatively minor. The average predictions of Young’s modulus (Figure 8d) for the three degrees of sphericity are slightly below the average experimental value (differences up to 4%). The Poisson’s ratio predictions (Figure 8e) obtained for the three degrees of sphericity also present averages close to the actual Poisson’s ratio of the Wausau granite (differences up to 9%).
These findings differ from a recent study by Xu et al. [52] that indicates that grain sphericity has little or no influence on rock strength or mechanical behavior. Such a difference could be related to the variability of the results associated with the stochastic effect provided by the random nature of Voronoi grain-structures, which has greater potential to influence results when the number of simulations is limited, as in the case of Xu et al. [52].
All the predictions of the UCS, Young’s modulus and the Poisson’s ratio are within the observed range of the experimental macro-properties. Similarly, the CD stress predictions for high grain sphericity fall within the experimental range. The predictions of CD stress for low and moderate sphericities only fall within that range in around 86 and 82% of the simulations, respectively. The predictions of CI stress are within the experimental CI range only in 47%, 72% and 61% of the simulations for low, moderate and high sphericities, respectively.

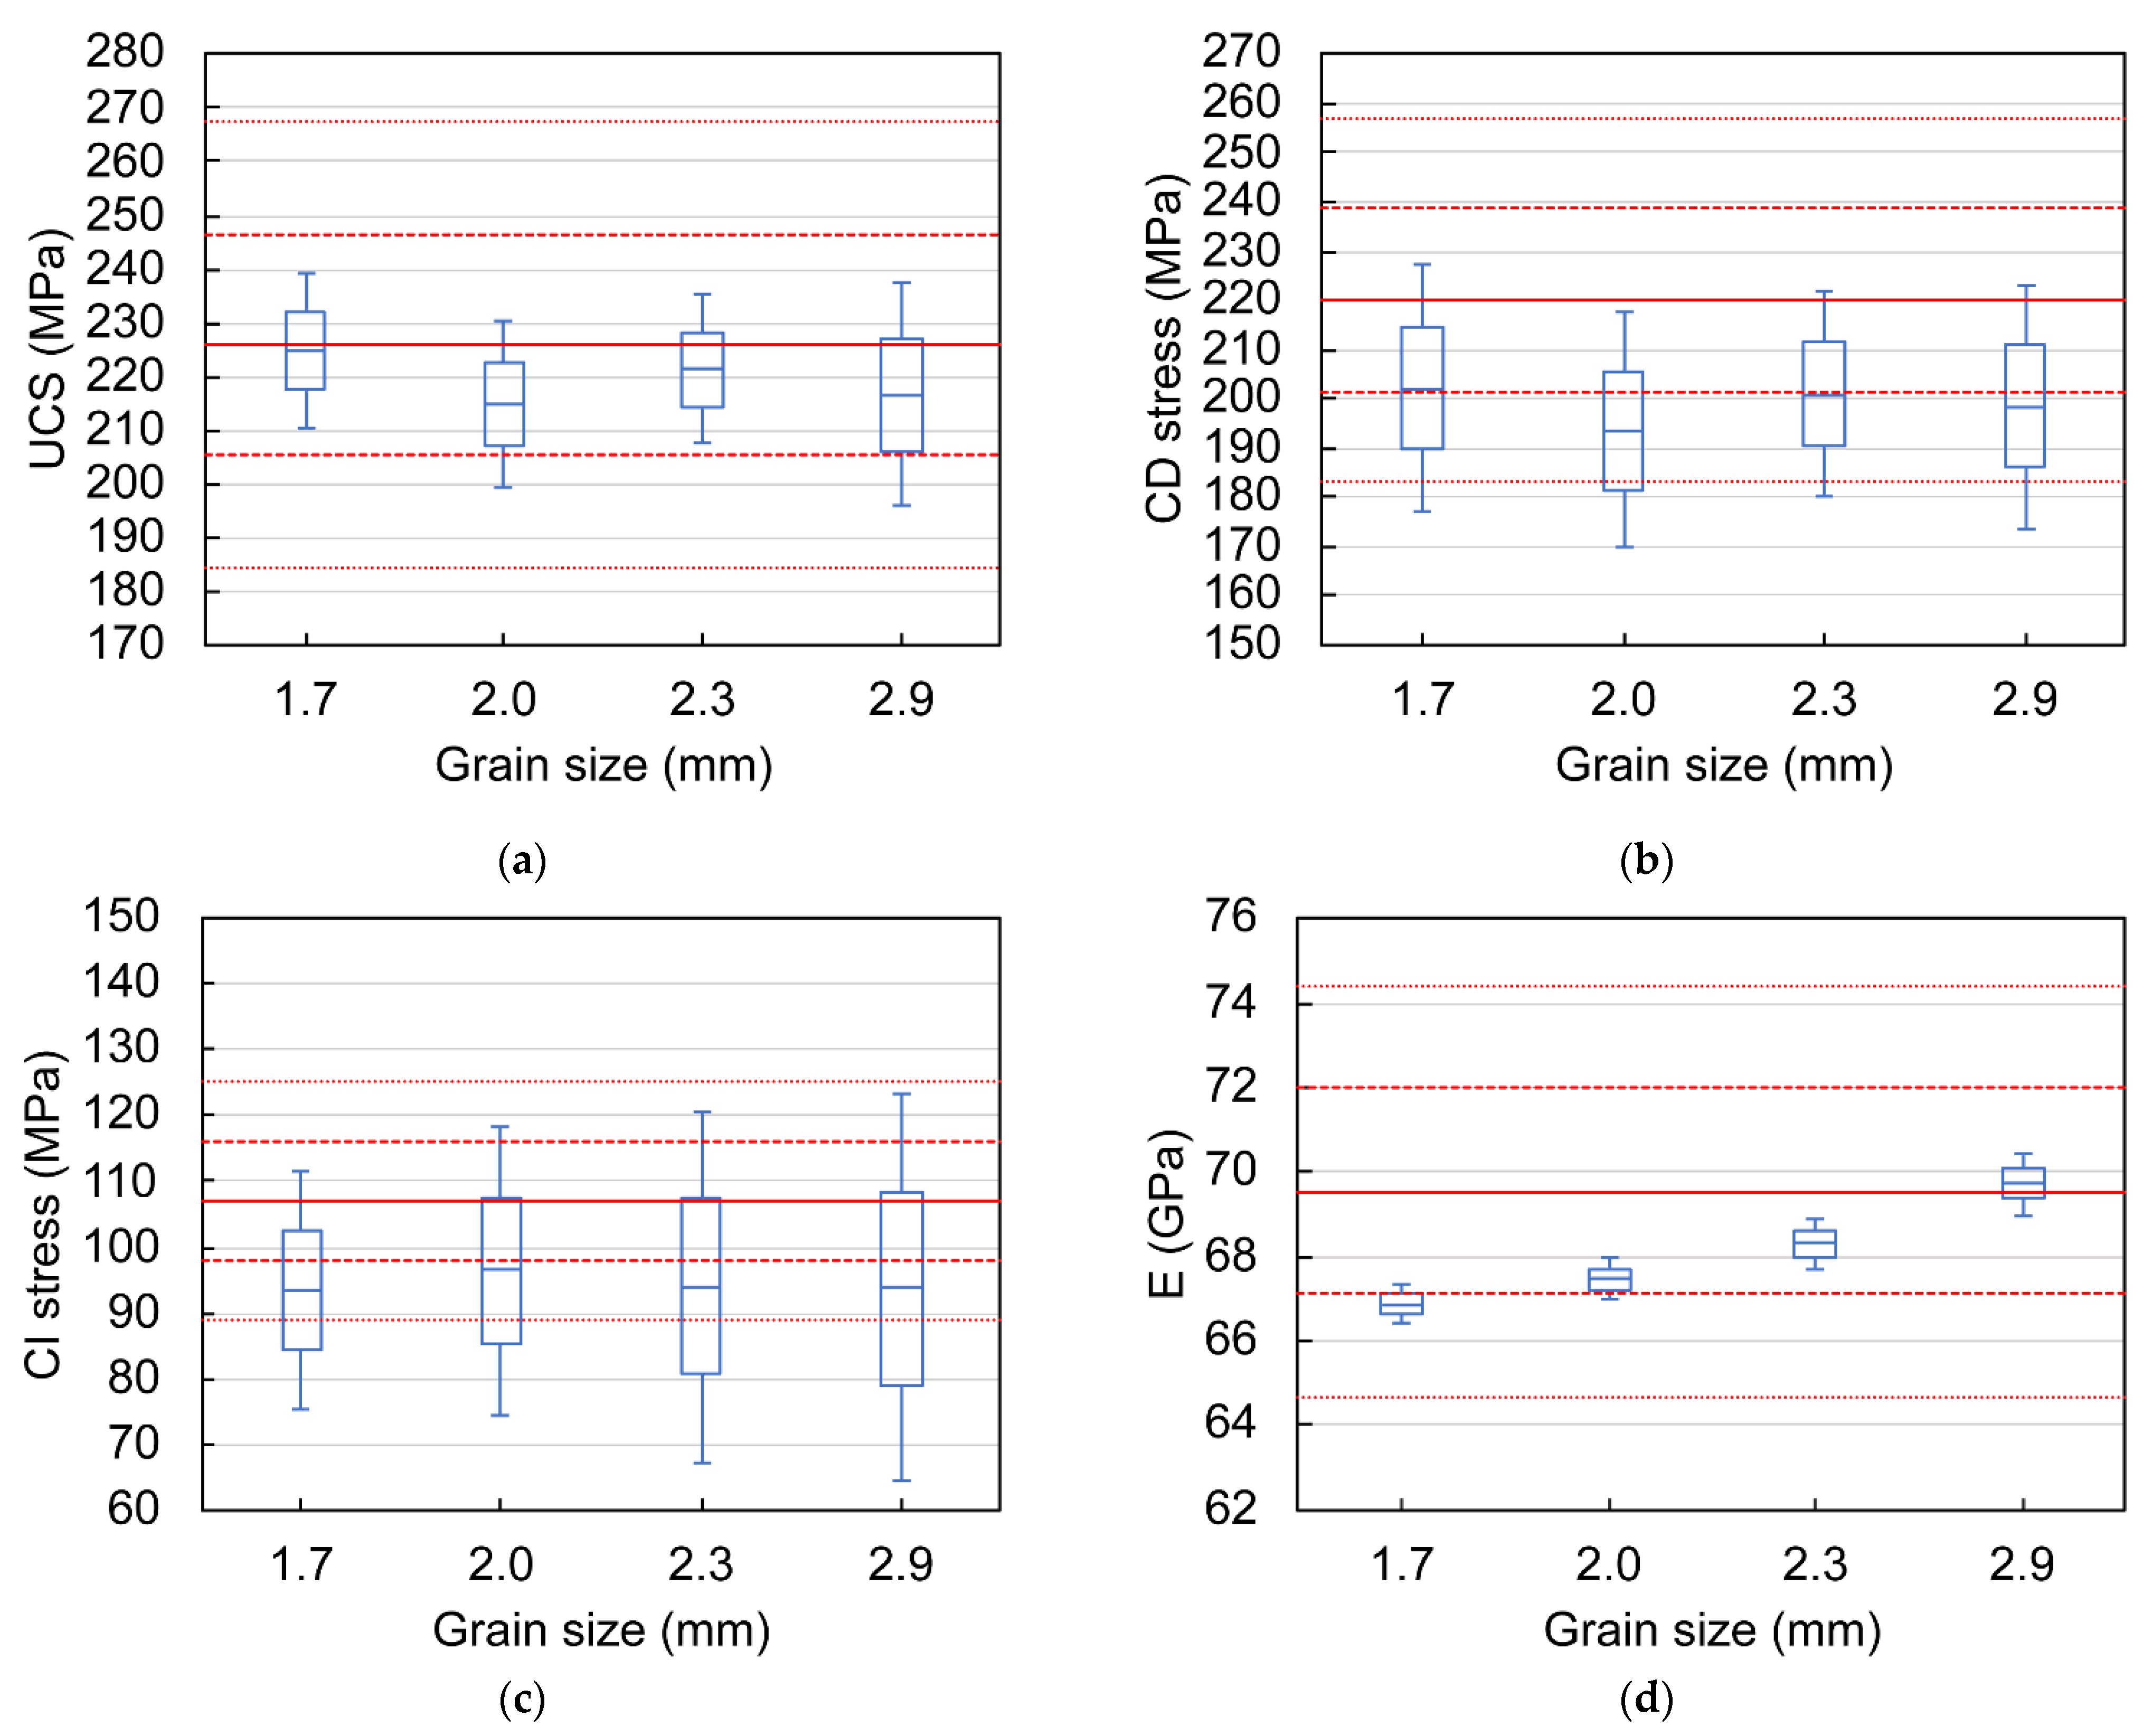
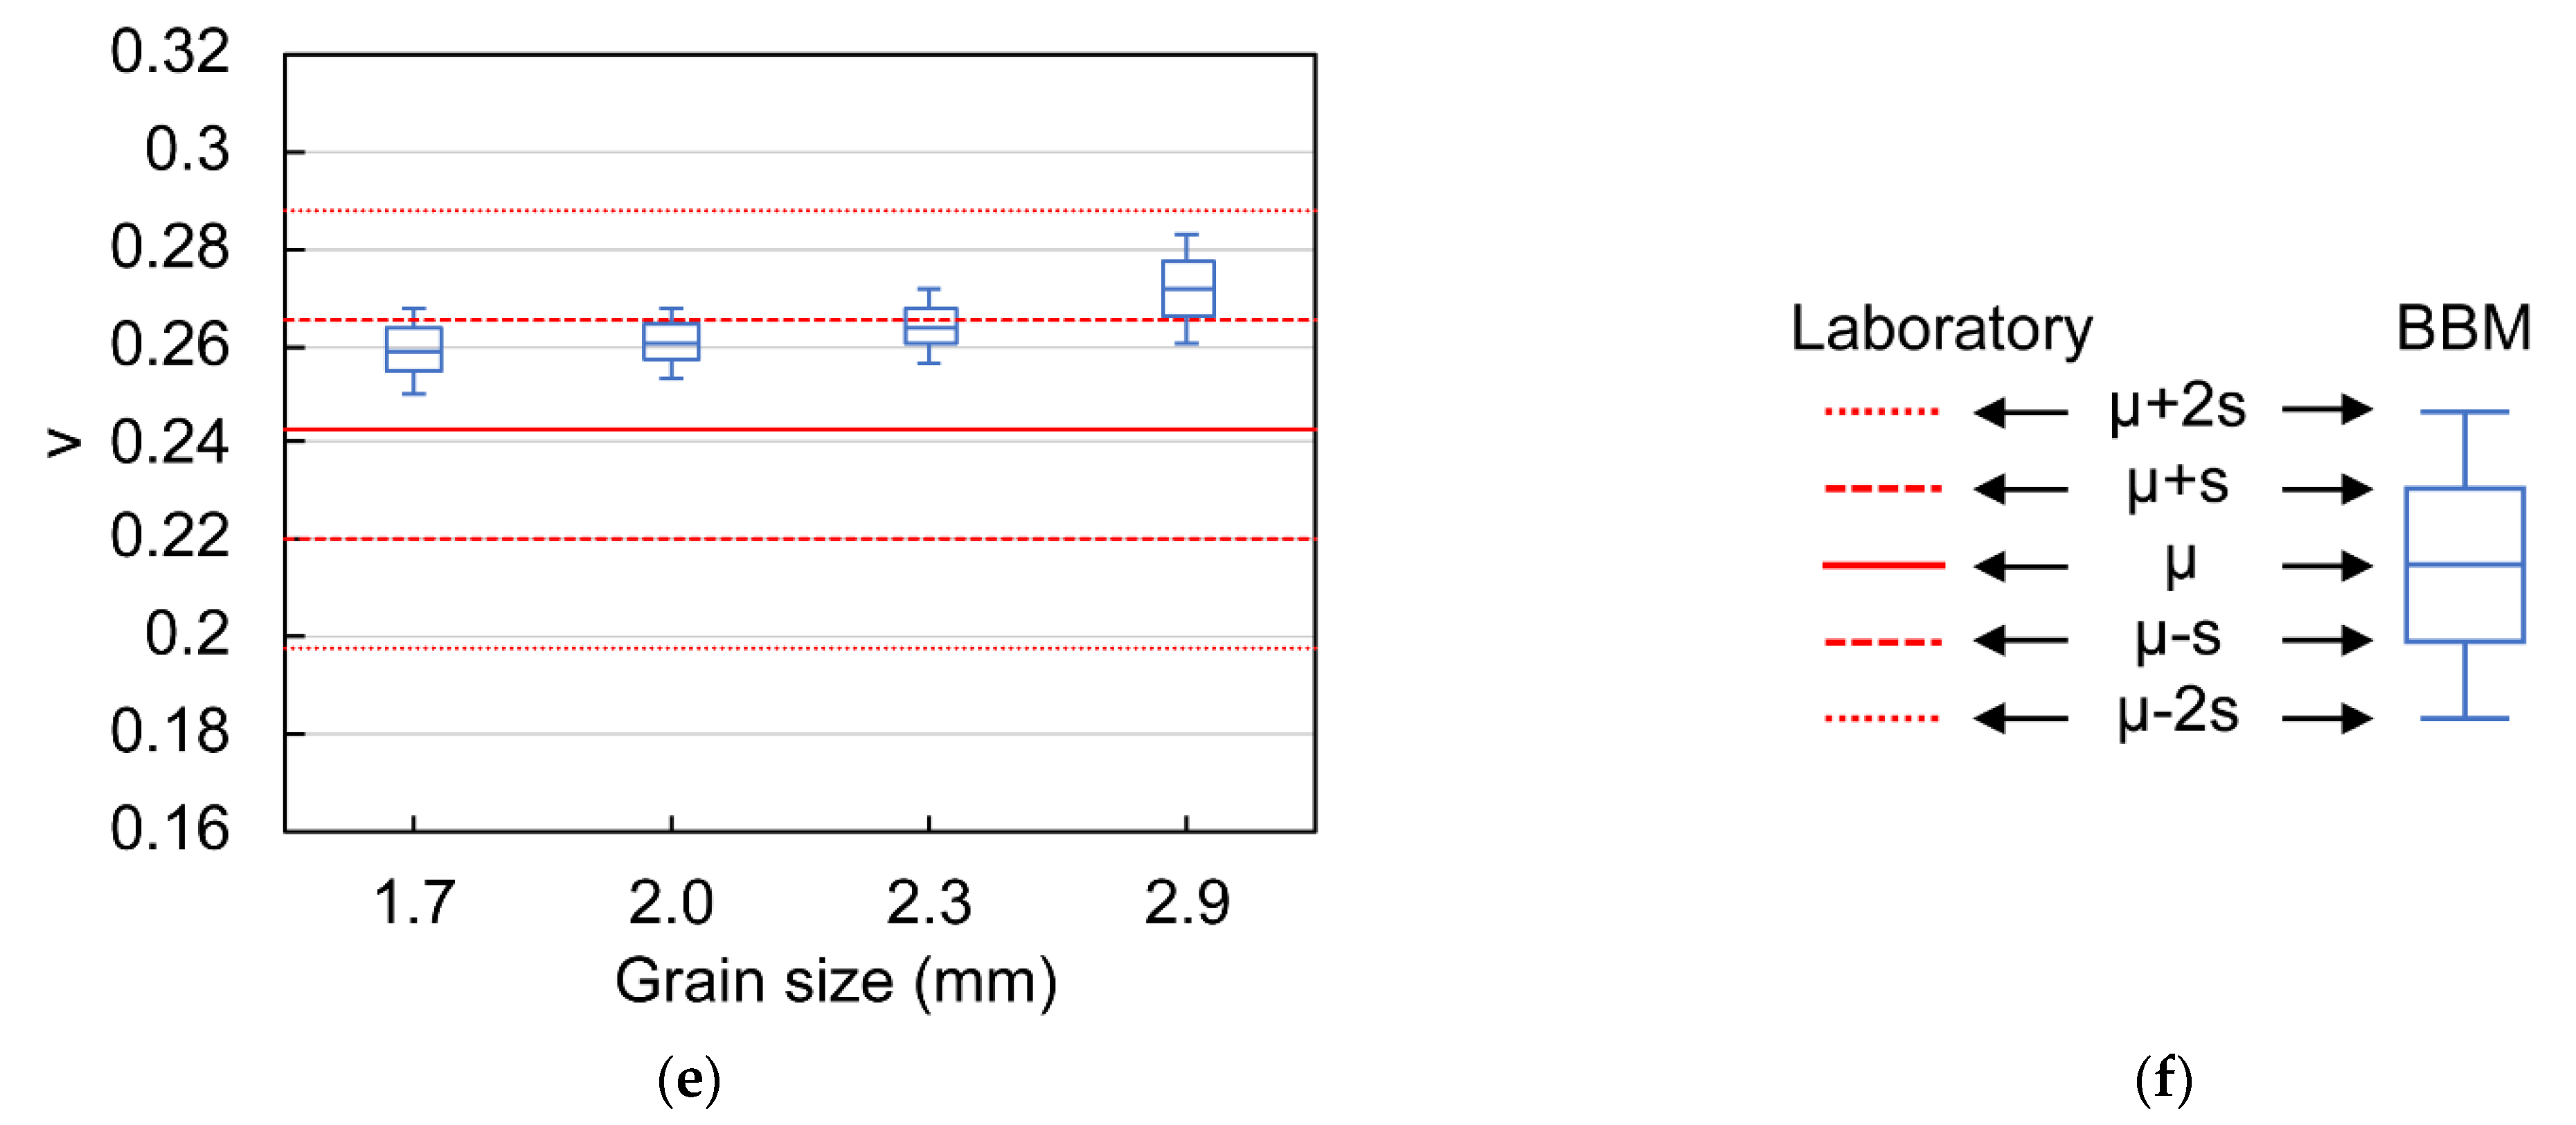
4.5. Effect of Grain Size

Four different average grain sizes were analyzed: 1.7 mm, 2.0 mm, 2.3 mm and 2.9 mm, where 2.0 mm is the average grain size measured in specimens of the Wausau granite. Table 16 presents the average mechanical property predictions by grain size.
In these results, there is no clear influence of the grain size on the predictions of UCS, CD stress and CI stress (Figure 9a–c) within the 1.7–2.9 mm grain size range. In the case of the UCS, the results for the four grain sizes present average predictions slightly below the actual peak strength of the Wausau granite (differences less than 5%). The average predictions of the CD stress differ by up to 12% from the average experimental value. On average, the predicted values of CI stress are very similar for the four different grain sizes and are between 10 and 13% below the average experimental CI value.
These results are consistent with the findings of some studies [37,49,51] that examined the effect of grain size on the peak strength and CI stress using similar grain diameter ranges (i.e., average diameters below 4.8 mm). Other studies using BBMs [51] that examined greater average grain sizes (i.e., up to 6 mm) reported a slight positive correlation that indicates that compressive strength is dependent on grain size. However, there is a conflict between the described results and the correlations between grain size and UCS identified using laboratory test data [42], as well as for the CI and CD stress thresholds [26]. In the future, additional simulations including a larger range of grain sizes should be conducted for further investigation of the influence of grain size on compressive strength.
An apparent influence of the grain size on the predicted values for the Young’s modulus and Poisson’s ratio was identified in Figure 9d,e, respectively. In both cases, the predicted average value tends to be higher when the grain size increases. The predictions for the Young’s modulus show average values with a difference of less than 4% compared to the average experimental Young’s modulus for the four grain size cases. For the Poisson’s ratio, the four grain size types predict average values between 7 and 12% above the actual Poisson’s ratio of the rock. The dependence of the elastic parameters on grain size is believed to be associated with the decrease in the number of grain-contacts when the grain size increases. When the soft grain-contacts reduce in number, the stiffness of the whole system increases as a result of the relative prevalence of larger stiff grains. The studies of Ghazvinian et al. [37] and Gui et al. [51] also identified a similar trend in the Young’s modulus in their analyses.
This analysis also indicates that realistic predictions of the Wausau granite macro-properties can be obtained even if the average grain size varies up to ±45%. This suggests that the variability of the average grain size within a given rock type would not significantly affect the predictions of rock mechanical behavior in a majority of cases.
All the predictions of the UCS, Young’s modulus and the Poisson’s ratio fall within the observed range of the experimental macro-properties. In contrast, when considering the four different grain sizes, only 82–94% of the CD stress predictions and 44–72% of the CI stress predictions are within the experimental range. Apparently, changes in grain size (within the 1.7–2.9 mm grain size range) do not significantly affect the realism of the predictions.

5. Conclusions

This paper presented an assessment of the capabilities of BBMs for rock mechanical behavior prediction using a predictive modeling approach that does not require micro-property calibration. The effectiveness of the proposed approach was analyzed, and the influences of the micro-properties and grain geometric features represented in BBMs on the predictions were evaluated. In contrast to previous similar works, this study explicitly accounted for the effects of stochastically generated Voronoi grain-structures on mechanical behavior predictions.
The proposed modeling approach can produce realistic predictions of brittle rock mechanical behavior using previously calibrated micro-properties in combination with a close approximation of the grain-structure of interest. Furthermore, the results obtained using this approach demonstrate that properly calibrated micro-properties can be transferrable from one rock to another. Thus, this approach could potentially be used for predictive modeling of rocks without available laboratory data. However, the applicability of this approach could be limited by the lack of availability of calibrated micro-properties for certain types of rocks and minerals.
The BBM grain-structure used for the calibration of micro-properties has a direct effect on the resulting set of micro-properties. Consequently, the effectiveness of this approach is limited by the realism of the grain-structure representation and simplifications applied in the initial calibration process used to obtain the required micro-properties. Our results demonstrate that micro-properties calibrated using an inadequate approximation of the grain structure will not likely be useful for predictive modeling.
The selection of an appropriate set of calibrated micro-properties is a critical factor in predicting brittle rock strength and can greatly affect the results of a prediction. In this study, the micro-properties calibrated by Farahmand and Diederichs [45] provided the most realistic predictions for the Wausau granite. In the calibration procedure of Farahmand and Diederichs [45], the simulated confining stress conditions and the grain-structure representation appear to be the key factors to obtain a reliable calibration of parameters.
The stochastic nature of Voronoi grain-structures used in BBMs shows an evident influence on the emergent mechanical properties predicted by these models. The variability of the predictions obtained from a set of BBMs that depict the same underlying grain-structure attributes is particularly significant in the case of the UCS, CD stress and CI stress. In addition, for the CD stress and CI stress, some of the predicted values (up to 29% of the predictions) fall outside the observed range of experimental macro-properties. With that said, any one simulation may provide an unrealistic prediction of macroscopic rock properties. Alternatively, the chances of achieving realistic predictions of rock macro-properties are higher when using the average prediction obtained from numerous simulations that stochastically approximate the same grain-structure.
According to the results of this study, the specific representation of the grain shape and grain size has a limited effect on the predictions relative to the variability related to stochastic effects associated with grain structure generation and mineral assignment. The grain sphericity has some influence on the results of the predictions, particularly at later stages of loading. In the case of the Wausau granite, low, moderate and high degrees of sphericity provide realistic estimations of the UCS and CD stress. Among the three sphericities considered, high sphericities (s = 0.85) can lead to significantly higher peak strength and CD stress estimations. The grain size does not show an evident influence on the prediction of the UCS, CD stress and CI stress. Still, grain size clearly impacts the elastic properties (Young’s modulus and Poisson’s ratio), as identified in previous studies [37,49]. Such an influence does not generate significant differences in the predictions, within the assessed range of average grain sizes (1.7 mm to 2.9 mm). Thus, a BBM created using the Voronoi tessellation method that realistically represents the average grain shape (i.e., sphericity) and properly approximates the average grain size (within a variability of ±45%) could potentially be used in combination with a set of properly calibrated micro-properties to provide realistic predictions of rock mechanical properties for other rock types.

Author Contributions

Conceptualization, C.E.C.I., G.W. and E.H.; methodology, C.E.C.I., G.W. and E.H.; software, C.E.C.I.; validation, C.E.C.I.; formal analysis, C.E.C.I.; investigation, C.E.C.I.; resources, G.W. and E.H.; data curation, C.E.C.I.; writing—original draft preparation, C.E.C.I.; writing—review and editing, C.E.C.I., G.W. and E.H.; visualization, C.E.C.I.; supervision, G.W.; project administration, G.W.; funding acquisition, G.W. All authors have read and agreed to the published version of the manuscript.

Funding

The research conducted for this study was funded by the National Institute for Occupational Safety and Health (NIOSH) under Grant Number 200-2016-90154.

Institutional Review Board Statement

Not applicable.

Informed Consent Statement

Not applicable.

Data Availability Statement

The data presented in this study are available on request from the corresponding author.

Acknowledgments

The authors extend their gratitude for the financial support. Special thanks to Katharina Pfaff of the automated mineralogy laboratory, Jae Erickson of the thin-section laboratory, and Bruce Yoshioka, Brent Duncan, Omid Frough and Muthu Vinayak of the Earth Mechanics Institute at the Colorado School of Mines for their help during various tests and analyses.

Conflicts of Interest

The authors declare no conflict of interest.

References

  1. Bieniawski, Z.T. Mechanism of Brittle Fracture of Rock: Part I—Theory of the Fracture Process. Int. J. Rock Mech. Min. Sci. 1967, 4, 395–404. [Google Scholar] [CrossRef]
  2. Wawersik, W.R.; Fairhurst, C. A Study of Brittle Rock Fracture in Laboratory Compression Experiments. Int. J. Rock Mech. Min. Sci. Geomech. 1970, 7, 561–575. [Google Scholar] [CrossRef]
  3. Martin, C.D.; Chandler, N.A. The Progressive Fracture of Lac Du Bonnet Granite. Int. J. Rock Mech. Min. Sci. 1994, 31, 643–659. [Google Scholar] [CrossRef]
  4. Eberhardt, E.; Stead, D.; Stimpson, B.; Read, R.S. Identifying Crack Initiation and Propagation Thresholds in Brittle Rock. Can. Geotech. J. 1998, 35, 222–233. [Google Scholar] [CrossRef]
  5. Martin, C.D. The Strength of Massive Lac Du Bonnet Granite around Underground Openings. Ph.D. Thesis, University of Manitoba, Winnipeg, MB, Canada, 1993. [Google Scholar]
  6. Staub, I.; Andersson, J.C.; Magnor, B. Äspö Pillar Stability Experiment: Geology and Mechanical Properties of the Rock in TASQ; Svensk Kar: Stockholm, Sweden, 2004. [Google Scholar]
  7. Eberhardt, E. Brittle Rock Fracture and Progressive Damage in Uniaxial Compression. Ph.D. Thesis, University of Saskatchewan, Saskatoon, Saskatchewan, 1998. [Google Scholar]
  8. Lan, H.; Martin, C.D.; Hu, B. Effect of Heterogeneity of Brittle Rock on Micromechanical Extensile Behavior during Compression Loading. J. Geophys. Res. 2010, 115. [Google Scholar] [CrossRef]
  9. Gao, F.; Stead, D.; Elmo, D. Numerical Simulation of Microstructure of Brittle Rock Using a Grain-Breakable Distinct Element Grain-Based Model. Comput. Geotech. 2016, 78, 203–217. [Google Scholar] [CrossRef]
  10. Liu, G.; Cai, M.; Huang, M. Mechanical Properties of Brittle Rock Governed by Micro-Geometric Heterogeneity. Comput. Geotech. 2018, 104, 358–372. [Google Scholar] [CrossRef]
  11. Wang, X.; Cai, M. Modeling of Brittle Rock Failure Considering Inter- and Intra-Grain Contact Failures. Comput. Geotech. 2018, 101, 224–244. [Google Scholar] [CrossRef]
  12. Mahabadi, O.K. Investigating the Influence of Micro-Scale Heterogeneity and Microstructure on the Failure and Mechanical Behaviour of Geomaterials. Ph.D. Thesis, University of Toronto, Toronto, ON, Canada, 2012. [Google Scholar]
  13. Olsson, W.A. Grain Size Dependence of Yield Stress in Marble. J. Geophys. Res. 1974, 79, 4859–4862. [Google Scholar] [CrossRef]
  14. Singh, S.K. Relationship among Fatigue Strength, Mean Grain Size and Compressive Strength of a Rock. Rock Mech. Rock Eng. 1988, 21, 271–276. [Google Scholar] [CrossRef]
  15. Wong, R.H.C.; Chau, K.T.; Wang, P. Microcracking and Grain Size Effect in Yuen Long Marbles. Int. J. Rock Mech. Min. Sci. Geomech. 1996, 33, 479–485. [Google Scholar] [CrossRef]
  16. Eberhardt, E.; Stimpson, B.; Stead, D. Effects of Grain Size on the Initiation and Propagation Thresholds of Stress-Induced Brittle Fractures. Rock Mech. Rock Eng. 1999, 32, 81–99. [Google Scholar] [CrossRef]
  17. Fredrich, J.T.; Evans, B. Teng-Fong Wong Effect of Grain Size on Brittle and Semibrittle Strength: Implications for Micromechanical Modelling of Failure in Compression. J. Geophys. Res. 1990, 95, 10907–10920. [Google Scholar] [CrossRef]
  18. Přikryl, R. Some Microstructural Aspects of Strength Variation in Rocks. Int. J. Rock Mech. Min. Sci. 2001, 38, 671–682. [Google Scholar] [CrossRef]
  19. Sajid, M.; Coggan, J.; Arif, M.; Andersen, J.; Rollinson, G. Petrographic Features as an Effective Indicator for the Variation in Strength of Granites. Eng. Geol. 2016, 202, 44–54. [Google Scholar] [CrossRef] [Green Version]
  20. Tuǧrul, A.; Zarif, I.H. Correlation of Mineralogical and Textural Characteristics with Engineering Properties of Selected Granitic Rocks from Turkey. Eng. Geol. 1999, 51, 303–317. [Google Scholar] [CrossRef]
  21. Güneş Yilmaz, N.; Mete Goktan, R.; Kibici, Y. Relations between Some Quantitative Petrographic Characteristics and Mechanical Strength Properties of Granitic Building Stones. Int. J. Rock Mech. Min. Sci. 2011, 48, 506–513. [Google Scholar] [CrossRef]
  22. Shea, W.T.; Kronenberg, A.K. Strength and Anisotropy of Foliated Rocks with Varied Mica Contents. J. Struct. Geol. 1993, 15, 1097–1121. [Google Scholar] [CrossRef]
  23. Lajtai, E.Z. Microscopic Fracture Processes in a Granite. Rock Mech. Rock Eng. 1998, 31, 237–250. [Google Scholar] [CrossRef]
  24. Yesiloglu-Gultekin, N.; Sezer, E.A.; Gokceoglu, C.; Bayhan, H. An Application of Adaptive Neuro Fuzzy Inference System for Estimating the Uniaxial Compressive Strength of Certain Granitic Rocks from Their Mineral Contents. Expert Syst. Appl. 2013, 40, 921–928. [Google Scholar] [CrossRef]
  25. Keikha, T.; Keykha, H.A. Correlation between Mineralogical Characteristics and Engineering Properties of Granitic Rocks. Electron. J. Geotech. Eng. 2013, 18, 4055–4065. [Google Scholar]
  26. Cowie, S.; Walton, G. The Effect of Mineralogical Parameters on the Mechanical Properties of Granitic Rocks. Eng. Geol. 2018, 240, 204–225. [Google Scholar] [CrossRef]
  27. Li, X.F.; Li, H.B.; Zhao, J. 3D Polycrystalline Discrete Element Method (3PDEM) for Simulation of Crack Initiation and Propagation in Granular Rock. Comput. Geotech. 2017, 90, 96–112. [Google Scholar] [CrossRef]
  28. Li, X.F.; Li, H.B.; Zhao, J. The Role of Transgranular Capability in Grain-Based Modelling of Crystalline Rocks. Comput. Geotech. 2019, 110, 161–183. [Google Scholar] [CrossRef]
  29. Jing, L. A Review of Techniques, Advances and Outstanding Issues in Numerical Modelling for Rock Mechanics and Rock Engineering. Int. J. Rock Mech. Min. Sci. 2003, 40, 283–353. [Google Scholar] [CrossRef]
  30. Potyondy, D.O.; Cundall, P.A. A Bonded-Particle Model for Rock. Int. J. Rock Mech. Min. Sci. 2004, 41, 1329–1364. [Google Scholar] [CrossRef]
  31. Sinha, S.; Walton, G. Application of Micromechanical Modeling to Prediction of In-Situ Rock Behavior. In Proceedings of the 52nd US Rock Mechanics/Geomechanics Symposium, Seattle, WA, USA, 17–20 June 2018. [Google Scholar]
  32. Lisjak, A.; Grasselli, G. A Review of Discrete Modeling Techniques for Fracturing Processes in Discontinuous Rock Masses. J. Rock Mech. Geotech. Eng. 2014, 6, 301–314. [Google Scholar] [CrossRef] [Green Version]
  33. Zhang, Y.; Wong, L.N.Y. A Review of Numerical Techniques Approaching Microstructures of Crystalline Rocks. Comput. Geosci. 2018, 115, 167–187. [Google Scholar] [CrossRef]
  34. Wang, X.; Cai, M. A Comprehensive Parametric Study of Grain-Based Models for Rock Failure Process Simulation. Int. J. Rock Mech. Min. Sci. 2019, 115, 60–76. [Google Scholar] [CrossRef]
  35. Jing, L.; Stephansson, O. Fundamentals of discrete element methods for rock engineering—Theory and applications. In Developments in Geotechnical Engineering; Elsevier: Amsterdam, The Netherlands, 2007; pp. 365–398. [Google Scholar]
  36. Jing, L.; Hudson, J.A. Numerical Methods in Rock Mechanics. Int. J. Rock Mech. Min. Sci. 2002, 39, 409–427. [Google Scholar] [CrossRef]
  37. Ghazvinian, E.; Diederichs, M.S.; Quey, R. 3D Random Voronoi Grain-Based Models for Simulation of Brittle Rock Damage and Fabric-Guided Micro-Fracturing. J. Rock Mech. Geotech. Eng. 2014, 6, 506–521. [Google Scholar] [CrossRef] [Green Version]
  38. Bahrani, N.; Kaiser, P.K.; Valley, B. Distinct Element Method Simulation of an Analogue for a Highly Interlocked, Non-Persistently Jointed Rockmass. Int. J. Rock Mech. Min. Sci. 2014, 71, 117–130. [Google Scholar] [CrossRef] [Green Version]
  39. Mahabadi, O.K.; Lisjak, A.; Munjiza, A.; Grasselli, G. Y-Geo: New Combined Finite-Discrete Element Numerical Code for Geomechanical Applications. Int. J. Geomech. 2012, 12, 676–688. [Google Scholar] [CrossRef]
  40. Munjiza, A. The Combined Finite-Discrete Element Method; John Wiley & Sons: Chichester, UK, 2004. [Google Scholar]
  41. Abdelaziz, A.; Zhao, Q.; Grasselli, G. Grain Based Modelling of Rocks Using the Combined Finite-Discrete Element Method. Comput. Geotech. 2018, 103, 73–81. [Google Scholar] [CrossRef]
  42. Li, X.F.; Li, H.B.; Zhao, J. Transgranular Fracturing of Crystalline Rocks and Its Influence on Rock Strengths: Insights from a Grain-Scale Continuum–Discontinuum Approach. Comput. Methods Appl. Mech. Eng. 2021, 373, 113462. [Google Scholar] [CrossRef]
  43. Sinha, S.; Walton, G. A Study on Bonded Block Model (BBM) Complexity for Simulation of Laboratory-Scale Stress-Strain Behavior in Granitic Rocks. Comput. Geotech. 2020, 118, 103363. [Google Scholar] [CrossRef]
  44. Fabjan, T.; Ivars, D.M.; Vukadin, V. Numerical Simulation of Intact Rock Behaviour via the Continuum and Voronoi Tessellation Models: A Sensitivity Analysis. Acta Geotech. Slov. 2015, 12, 5–23. [Google Scholar]
  45. Farahmand, K.; Diederichs, M.S. A Calibrated Synthetic Rock Mass (SRM) Model for Simulating Crack Growth in Granitic Rock Considering Grain Scale Heterogeneity of Polycrystalline Rock. In Proceedings of the 49th US Rock Mechanics/Geomechanics Symposium, San Francisco, CA, USA, 29 June–1 July 2015; Volume 1. [Google Scholar]
  46. Mayer, J.M.; Stead, D. Exploration into the Causes of Uncertainty in UDEC Grain Boundary Models. Comput. Geotech. 2017, 82, 110–123. [Google Scholar] [CrossRef]
  47. Gao, F.Q.; Stead, D. The Application of a Modified Voronoi Logic to Brittle Fracture Modelling at the Laboratory and Field Scale. Int. J. Rock Mech. Min. Sci. 2014, 68, 1–14. [Google Scholar] [CrossRef]
  48. Potyondy, D.O. A Flat-Jointed Bonded-Particle Material for Hard Rock. In Proceedings of the 46th US Rock Mechanics/Geomechanics Symposium 2012, Chicago, IL, USA, 24–27 June 2012; Volume 3, pp. 1510–1519. [Google Scholar]
  49. Nicksiar, M.; Martin, C.D. Factors Affecting Crack Initiation in Low Porosity Crystalline Rocks. Rock Mech. Rock Eng. 2014, 47, 1165–1181. [Google Scholar] [CrossRef]
  50. Azocar, K. Investigating the Mesh Dependency and Upscaling of 3D Grain-Based Models for the Simulation of Brittle Fracture Processes in Low-Porosity Crystalline Rock. Master’s Thesis, Queen’s University, Kingston, ON, Canada, 2016. [Google Scholar]
  51. Gui, Y.L.; Zhao, Z.Y.; Ji, J.; Wang, X.M.; Zhou, K.P.; Ma, S.Q. The Grain Effect of Intact Rock Modelling Using Discrete Element Method with Voronoi Grains. Geotech. Lett. 2016, 6, 136–143. [Google Scholar] [CrossRef]
  52. Xu, T.; Fu, T.F.; Heap, M.J.; Meredith, P.G.; Mitchell, T.M.; Baud, P. Mesoscopic Damage and Fracturing of Heterogeneous Brittle Rocks Based on Three-Dimensional Polycrystalline Discrete Element Method. Rock Mech. Rock Eng. 2020, 53, 5389–5409. [Google Scholar] [CrossRef]
  53. Kazerani, T.; Zhao, J. Micromechanical Parameters in Bonded Particle Method for Modeling of Brittle Material Failure. Int. J. Numer. Anal. Methods Geomech. 2010, 34, 1877–1895. [Google Scholar] [CrossRef]
  54. Peng, J.; Yuen Wong, L.N.; Teh, C.I. Influence of Grain Size on Strength of Polymineralic Crystalline Rock: New Insights from DEM Grain-Based Modeling. J. Rock Mech. Geotech. Eng. 2021, 1–12. [Google Scholar] [CrossRef]
  55. Peng, J.; Wong, L.N.Y.; Teh, C.I. Influence of Grain Size Heterogeneity on Strength and Microcracking Behavior of Crystalline Rocks. J. Geophys. Res. Solid Earth 2017, 122, 1054–1073. [Google Scholar] [CrossRef] [Green Version]
  56. Peng, J.; Wong, L.N.Y.; Teh, C.I. Effects of Grain Size-to-Particle Size Ratio on Micro-Cracking Behavior Using a Bonded-Particle Grain-Based Model. Int. J. Rock Mech. Min. Sci. 2017, 100, 207–217. [Google Scholar] [CrossRef]
  57. Li, H.; Ma, H.; Shi, X.; Zhou, J.; Zhang, H.; Daemen, J.J.K. A 3D Grain-Based Model for Simulating the Micromechanical Behavior of Salt Rock. Rock Mech. Rock Eng. 2020, 53, 2819–2837. [Google Scholar] [CrossRef]
  58. Zhu, D.-F.; Tu, S.-H.; Ma, H.; Zhang, X. A 3D Voronoi and Subdivision Model for Calibration of Rock Properties. Model. Simul. Mater. Sci. Eng. 2017, 25, 085005. [Google Scholar] [CrossRef] [Green Version]
  59. Zhou, J.; Lan, H.; Zhang, L.; Yang, D.; Song, J.; Wang, S. Novel Grain-Based Model for Simulation of Brittle Failure of Alxa Porphyritic Granite. Eng. Geol. 2019, 251, 100–114. [Google Scholar] [CrossRef]
  60. Sims, P.K.; Schulz, K.J.; Dewitt, E.; Brasaemle, B. Petrography and Geochemistry of Early Proterozoic Granitoid Rocks in Wisconsin Magmatic Terranes of Penokean Orogen, Northern Wisconsin; US Government Printing Office: Washington, DC, USA, 1993; pp. 1–31.
  61. LaBerge, G.L.; Myers, P.E. Precambrian Geology of Marathon County, Wisconsin. Wis. Geol. Nat. Hist. Surv. Inf. Circ. 1983, 45, 88. [Google Scholar]
  62. Ghazvinian, E. Fracture Initiation and Propagation in Low Porosity Crystalline Rocks: Implications for Excavation Damage Zone (EDZ) Mechanics. Ph.D. Thesis, Queen’s University, Kingston, ON, USA, 2015. [Google Scholar]
  63. Nicksiar, M.; Martin, C.D. Evaluation of Methods for Determining Crack Initiation in Compression Tests on Low-Porosity Rocks. Rock Mech. Rock Eng. 2012, 45, 607–617. [Google Scholar] [CrossRef]
  64. Chen, W.; Konietzky, H. Simulation of Heterogeneity, Creep, Damage and Lifetime for Loaded Brittle Rocks. Tectonophysics 2014, 633, 164–175. [Google Scholar] [CrossRef]
  65. Chen, W.; Konietzky, H.; Tan, X.; Frühwirt, T. Pre-Failure Damage Analysis for Brittle Rocks under Triaxial Compression. Comput. Geotech. 2016, 74, 45–55. [Google Scholar] [CrossRef]
  66. Quey, R.; Dawson, P.R.; Barbe, F. Large-Scale 3D Random Polycrystals for the Finite Element Method: Generation, Meshing and Remeshing. Comput. Methods Appl. Mech. Eng. 2011, 200, 1729–1745. [Google Scholar] [CrossRef] [Green Version]
  67. Quey, R. Neper Reference Manual: The Documentation for Neper 3.5.1. 2019, pp. 1–106. Available online: https://neper.info/docs/neper.pdf (accessed on 27 November 2019).
  68. Quey, R.; Renversade, L. Optimal Polyhedral Description of 3D Polycrystals: Method and Application to Statistical and Synchrotron X-Ray Diffraction Data. Comput. Methods Appl. Mech. Eng. 2018, 330, 308–333. [Google Scholar] [CrossRef] [Green Version]
  69. Wadell, H. Volume, Shape, and Roundness of Quartz Particles. J. Geol. 1935, 43, 250–280. [Google Scholar] [CrossRef]
  70. Bullard, J.W.; Garboczi, E.J. Defining Shape Measures for 3D Star-Shaped Particles: Sphericity, Roundness, and Dimensions. Powder Technol. 2013, 249, 241–252. [Google Scholar] [CrossRef]
  71. Wadell, H. Sphericity and Roundness of Rock Particles. J. Geol. 1933, 41, 310–331. [Google Scholar] [CrossRef]
  72. Itasca Consulting Group Inc. 3DEC Version 5.2: 3 Dimensional Distinct Element Code, User’s Guide, 4th ed.; Itasca Consulting Group Inc.: Minneapolis, MN, USA, 2016. [Google Scholar]
  73. Itasca Consulting Group Inc. UDEC Version 6.0: Universal Disctinct Element Code, User’s Guide, 4th ed.; Itasca Consulting Group Inc.: Minneapolis, MN, USA, 2014. [Google Scholar]
  74. Cai, J.G.; Zhao, J. Effects of Multiple Parallel Fractures on Apparent Attenuation of Stress Waves in Rock Masses. Int. J. Rock Mech. Min. Sci. 2000, 37, 661–682. [Google Scholar] [CrossRef]
  75. Chen, S.G.; Cai, J.G.; Zhao, J.; Zhou, Y.X. Discrete Element Modelling of an Underground Explosion in a Jointed Rock Mass. Geotech. Geol. Eng. 2000, 18, 59–78. [Google Scholar] [CrossRef]
  76. Kazerani, T.; Yang, Z.Y.; Zhao, J. A Discrete Element Model for Predicting Shear Strength and Degradation of Rock Joint by Using Compressive and Tensile Test Data. Rock Mech. Rock Eng. 2012, 45, 695–709. [Google Scholar] [CrossRef] [Green Version]
Figure 1. (a) Disk-shaped specimen and (b) thin-section photomicrograph of the Wausau granite under cross-polarized light.
Sustainability 13 07889 g001
Figure 2. (a) Three-dimensional and (b) two-dimensional (cross-section) views of the baseline BBM.
Sustainability 13 07889 g002
Figure 3. Two-dimensional views of the different 3D BBMs. (a) s = 0.85, d = 2.0 mm; (b) s = 0.8, d = 2.0 mm [baseline]; (c) s = 0.75, d = 2.0 mm; (d) s = 0.8, d = 1.7 mm; (e) s = 0.8, d = 2.3 mm; and (f) s = 0.8, d = 2.9 mm.
Sustainability 13 07889 g003
Figure 4. Loading conditions and strain tracking points for UCS test simulations.
Sustainability 13 07889 g004
Figure 5. Stress-strain curve for the average UCS experimental results of the Wausau granite (red) and representative UCS test simulations using micro-properties calibrated by Lan et al. [8], Chen and Konietzky [64], Farahmand and Diederichs [45] and Chen et al. [65].
Sustainability 13 07889 g005
Figure 6. Predicted rock properties obtained by combining the baseline set of 18 2D models with each set of micro-properties, shown on the X-axis by publication year: Lan et al. [8], Chen and Konietzky [64], Farahmand and Diederichs [45] and Chen et al. [65]. (a) UCS, (b) crack damage stress, (c) crack initiation stress, (d) Young’s modulus and (e) Poisson’s ratio. (f) Chart legend.
Sustainability 13 07889 g006
Figure 7. Predicted rock properties for the baseline model (1), each of the four “clone” grain-structures (2, 3, 4 and 5) and the global average for all the simulation results (Avg.). (a) UCS, (b) crack damage stress, (c) crack initiation stress, (d) Young’s modulus and (e) Poisson’s ratio. (f) Chart legend.
Sustainability 13 07889 g007
Figure 8. Predicted rock properties per grain sphericity (a) UCS; (b) crack damage stress; (c) crack initiation stress; (d) Young’s modulus; (e) Poisson’s ratio. (f) Chart legend.
Sustainability 13 07889 g008
Figure 9. Predicted rock properties per grain size (a) UCS; (b) crack damage stress; (c) crack initiation stress; (d) Young’s modulus; (e) Poisson’s ratio. (f) Chart legend.
Sustainability 13 07889 g009aSustainability 13 07889 g009b
Table 1. Grain size distribution of the Wausau granite.
MineralModal Abundance (%)Grain Diameter (mm)
Mean (μ)S.D. (σ)
Biotite30.90.4
Quartz322.51.0
Plagioclase412.00.6
K-feldspar242.00.6
All grains1002.00.8
Table 2. Experimentally determined macro-mechanical properties of the Wausau granite.
PropertyNumber of TestsMean (μ)S.D. (σ)MedianMinimumMaximum
Density, ρm (kg/m3)1126058260225942619
Uniaxial Compressive Strength, UCS (MPa)1122621221203260
Crack damage stress, CD (MPa)1122019219198246
Crack initiation stress, CI (MPa)4107910995115
Young’s Modulus, Em (GPa)4702706672
Poisson’s Ratio, νm40.240.020.240.220.27
Table 3. Geometric characteristics of the 3D Bonded Block Models.
Bonded Block ModelGrain Diameter (mm)Grain Sphericity, sNumber of GrainsDescription
μσμσ
BBM-12.00.80.800.0240,700Baseline (BL) model with moderate average sphericity (s = 0.80) and average grain diameter of 2.0 mm
BBM-22.00.80.850.0240,700Model with high average sphericity (s = 0.85) and average grain diameter of 2.0 mm
BBM-32.00.80.750.0240,700Model with low average sphericity (s = 0.75) and average grain diameter of 2.0 mm
BBM-41.70.80.800.0256,800Model with moderate average sphericity (s = 0.80) and average grain size of 1.7 mm
BBM-52.30.80.800.0229,700Model with moderate average sphericity (s = 0.80) and average grain size of 2.3 mm
BBM-62.90.80.800.0216,700Model with moderate average sphericity (s = 0.80) and average grain size of 2.9 mm
Table 4. Grain micro-properties used by Lan et al. [8].
Mineral TypeBulk Modulus
K (GPa)
Shear Modulus
G (GPa)
Young’s Modulus
E (GPa)
Poisson’s Ratio
ν
Density
ρ (g/cc)
K-Feldspar53.727.269.80.282.56
Plagioclase50.829.388.10.262.63
Quartz37.044.094.50.082.65
Biotite41.112.433.80.363.05
Table 5. Contact micro-properties determined by Lan et al. [8].
Contact Typekn
(GPa/m)
ks/knC
(MPa)
φ
(°)
σt
(MPa)
KF/KF9.20 × 1040.6740.027.014.4
KF/PL8.56 × 1040.6740.027.014.4
KF/QZ1.29 × 1050.6740.027.014.4
KF/BT1.51 × 1050.6740.027.014.4
PL/PL9.28 × 1040.6740.027.014.4
PL/QZ1.24 × 1050.6740.027.014.4
PL/BT1.49 × 1050.6740.027.014.4
QZ/QZ2.55 × 1050.6740.027.014.4
QZ/BT3.13 × 1050.6740.027.014.4
BT/BT4.70 × 1050.6740.027.014.4
Table 6. Grain micro-properties used by Chen and Konietzky [64].
Mineral TypeYoung’s Modulus
E (GPa)
Poisson’s Ratio
ν
K-Feldspar620.27
Plagioclase690.23
Quartz910.20
Biotite350.25
Table 7. Contact micro-properties determined by Chen and Konietzky [64].
Contact Typekn
(GPa/m)
ks/knC
(MPa)
φ, φr
(°)
σt
(MPa)
KF/KF7.75 × 1051.0052.055.0, 27.523.0
KF/PL7.87 × 1051.0054.557.0, 28.523.5
KF/QZ8.93 × 1051.0057.058.5, 29.324.5
KF/BT5.97 × 1051.0044.551.5, 25.821.0
PL/PL8.00 × 1051.0057.059.0, 29.524.0
PL/QZ9.06 × 1051.0059.560.5, 30.325.0
PL/BT6.10 × 1051.0047.053.5, 26.821.5
QZ/QZ1.01 × 1061.0062.062.0, 31.026.0
QZ/BT7.16 × 1051.0049.555.0, 27.522.5
BT/BT4.20 × 1051.0037.048.0, 24.019.0
Table 8. Grain micro-properties used by Farahmand and Diederichs [45].
Mineral TypeYoung’s Modulus
E (GPa)
Poisson’s Ratio
ν
Density
ρ (g/cc)
K-Feldspar96.80.282.56
Plagioclase88.10.262.63
Quartz94.50.082.65
Biotite33.80.363.05
Table 9. Contact micro-properties determined by Farahmand and Diederichs [45].
Contact Typekn
(GPa/m)
ks/knC
(MPa)
φ, φr
(°)
σt
(MPa)
KF/KF2.3 × 1050.65110.062.0, 5.035.0
KF/PL2.1 × 1050.65108.061.0, 5.032.0
KF/QZ2.7 × 1050.6576.053.0, 5.028.2
KF/BT2.3 × 1050.6560.048.0, 5.011.4
PL/PL2.5 × 1050.65112.063.0, 5.037.0
PL/QZ2.3 × 1050.6580.049.0, 5.028.2
PL/BT2.3 × 1050.6554.045.0, 5.022.4
QZ/QZ2.8 × 1050.65130.065.0, 5.035.0
QZ/BT2.3 × 1050.6557.052.0, 5.023.4
BT/BT1.3 × 1050.6588.055.0, 5.025.3
Table 10. Grain micro-properties used by Chen et al. [65].
Mineral TypeYoung’s Modulus
E (GPa)
Poisson’s Ratio
ν
Feldspar520.19
Quartz810.16
Biotite250.22
Table 11. Contact micro-properties determined by Chen et al. [65].
Contact Typekn
(GPa/m)
ks/knC
(MPa)
φ, φr
(°)
σt
(MPa)
FL/FL5.71 × 1051.0052.048.0, 0.4823.0
FL/QZ7.17 × 1051.0057.053.0, 0.5324.5
FL/BT4.28 × 1051.0044.543.0, 0.4321.0
QZ/QZ8.63 × 1051.0062.058.0, 0.5826.0
QZ/BT5.74 × 1051.0049.548.0, 0.4822.5
BT/BT2.85 × 1051.0037.038.0, 0.3819.0
Table 12. Summary of average predictions obtained from the baseline set of 18 2D models in combination with each set of micro-properties [8,45,64,65].
Micro-
Properties
Lab2010201420152016
MeanMeanDif. 1MeanDif. 1MeanDif. 1MeanDif. 1
UCS (MPa)225.983.2−63289.528215.5−5139.3−38
CD (MPa)220.077.3−65179.4−18197.9−10126.8−42
CI (MPa)107.037.7−65112.5596.6−1068.4−36
E (GPa)69.557.5−1772.5467.5−357.5−17
ν0.2430.233−40.28990.26170.213−12
1 Dif. = difference expressed as a percentage of the laboratory mean value.
Table 13. Summary of average predictions per mineral arrangement.
Mineral
Arrangement
Lab1 (BL 1)2345Global Average
MeanMeanDif. 2MeanDif. 2MeanDif. 2MeanDif. 2MeanDif. 2MeanDif. 2
UCS (MPa)225.9215.5−5211.6−6217.6−4216.6−4213.1−6214.9−5
CD (MPa)220.0197.9−10188.2−14194.5−12193.3−12194.8−11193.7−12
CI (MPa)107.096.6−1096.4−1099.7−799.3−790.4−1696.5−10
E (GPa)69.567.5−367.5−367.4−367.4−367.6−367.6−3
ν0.2430.26170.26070.26280.26280.25970.2597
1 BL = baseline; 2 Dif. = difference expressed as a percentage of the laboratory mean value.
Table 14. Summary of the prediction variability per mineral arrangement.
Mineral
Arrangement
Lab1 (BL 1)2345Global Average
S.D. 2S.D. 2Dif. 3S.D. 2Dif. 3S.D. 2Dif. 3S.D. 2Dif. 3S.D. 2Dif. 3S.D. 2Dif. 3
UCS (MPa)20.68.4−596.4−694.5−789.8−538.4−597.9−62
CD (MPa)18.611.2−4015.1−1910.7−4310.3−4511.7−3712.1−35
CI (MPa)9.210.2129.0−213.85110.5149.7611.121
E (GPa)2.40.2−910.2−910.3−890.2−910.3−860.3−89
ν0.0230.004−820.004−840.003−850.003−860.004−840.004−84
1 BL = baseline; 2 S.D. = standard deviation; 3 Dif. = difference expressed as a percentage of the laboratory standard deviation.
Table 15. Summary of average predictions per grain shape (sphericity).
Grain ShapeLabs = 0.75s = 0.80s = 0.85
MeanMeanDif. 1MeanDif. 1MeanDif. 1
UCS (MPa)225.9208.6−8214.9−5242.27
CD (MPa)220.0192.1−13193.7−12213.3−3
CI (MPa)107.091.1−1596.5−1099.3−7
E (GPa)69.566.7−467.5−368.1−2
ν0.2430.26070.26170.2659
1 Dif. = difference expressed as a percentage of the laboratory mean value.
Table 16. Summary of average predictions per grain size (diameter).
Micro-
Properties
Labd = 1.7 mmd = 2.0 mmd = 2.3 mmd = 2.9 mm
MeanMeanDif. 1MeanDif. 1MeanDif. 1MeanDif. 1
UCS (MPa)225.9224.90214.9−5221.4−2216.7−4
CD (MPa)220.0202.2−8193.7−12200.9−9198.5−10
CI (MPa)107.093.5−1396.5−1094.0−1293.7−12
E (GPa)69.566.9−467.5−368.3−269.70
ν0.2430.25970.26170.26490.27212
1 Dif. = difference expressed as a percentage of the laboratory mean value.
Publisher’s Note: MDPI stays neutral with regard to jurisdictional claims in published maps and institutional affiliations.

