Article

Analysis of Power Generation for Solar Photovoltaic Module with Various Internal Cell Spacing

1
Mold and Die Engineering Department, National Kaohsiung University of Science and Technology, Kaohsiung City 807618, Taiwan
2
Mechanical and Allied Engineering Department, Technological University of the Philippines—Taguig, Taguig City 1630, Philippines
3
Department of Business Administration, National Taipei University of Business, Taipei 100025, Taiwan
*
Author to whom correspondence should be addressed.
Sustainability 2021, 13(11), 6364; https://doi.org/10.3390/su13116364
Submission received: 8 May 2021 / Revised: 18 May 2021 / Accepted: 26 May 2021 / Published: 3 June 2021
(This article belongs to the Special Issue Energy Development for Sustainability)

Abstract

:
Photovoltaic (PV) systems directly convert solar energy into electricity and researchers are taking into consideration the design of photovoltaic cell interconnections to form a photovoltaic module that maximizes solar irradiance. The purpose of this study is to evaluate the cell spacing effect of light diffusion on output power. In this work, the light absorption of solar PV cells in a module with three different cell spacings was studied. An optical engineering software program was used to analyze the reflecting light on the backsheet of the solar PV module towards the solar cell with varied internal cell spacing of 2 mm, 5 mm, and 8 mm. Then, assessments were performed under standard test conditions to investigate the power output of the PV modules. The results of the study show that the module with an internal cell spacing of 8 mm generated more power than 5 mm and 2 mm. Conversely, internal cell spacing from 2 mm to 5 mm revealed a greater increase of power output on the solar PV module compared to 5 mm to 8 mm. Furthermore, based on the simulation and experiment, internal cell spacing variation showed that the power output of a solar PV module can increase its potential to produce more power from the diffuse reflectance of light.

1. Introduction

Photovoltaic (PV) systems directly convert solar energy into electricity. The main structure of a solar PV system is the PV cell, which is a semiconductor device that converts solar energy into direct current (DC) electricity. PV cells are interconnected to form a PV module, typically with a capacity of 290 watts (W) to almost 400 W. PV modules and other components such as inverters, energy storage, electrical and mechanical equipment are assembled to form a PV system [1]. PV systems are extremely modular such that a PV module can be linked together to provide a few watts to hundreds of megawatts (MW) of power [2]. Solar PV cells are grouped into modules with transparent glass in front, a weatherproof material for the back, and regularly surrounded by a frame [3]. When designing a solar cell module, it is necessary to consider the arrangement of the cell sheets. The solar cell module is composed of multiple interconnected solar cells connected in series and the module is designed and packaged. To increase the packing density of a solar module, the arrangement of solar cells to the module should be maximized so that the actual area occupied by the cells over the total area of the solar module must be high [4]. Thus, more occupied areas and less space mean more packing density. Cells in a module with a white rear surface can also provide marginal increases in output via the light reflection effect [5]. This phenomenon shows the power enhancement in solar PV module output due to the light scattered in the backsheet at angles greater than the critical angle of the cover glass [6]. The solar PV cells that are interconnected together in the module are then combined to form modules, arrays, and systems.
The silicon solar cells have been identified as the most viable option suitable for large volume production [7]. However, it has been reported that the continual generation of electricity by PV modules, manufactured using this type of cell, in the field for a minimum life span of 20 years has been a concern [8,9,10]. One of the key challenges is the conversion efficiency improvement of the existing module structure while increasing the light absorption on reflection from the backsheet of the module. To use the benefits of theory, some module designs take advantage of the light passing between the cells. The scattered light reflection from the rear back of the module can still be absorbed by solar cells and contribute to both objectives at once. Several light-trapping methods have been implemented over the last few years to enhance the light absorption within the solar cell that is much smaller compared to the material’s intrinsic absorption length [11,12,13,14,15,16]. The average efficiency of solar panels during this period has increased but mainly because of higher performance solar cells.
Previous research has analyzed the performance of photovoltaic modules with internal reflection, encapsulation, internal and external light-trapping structures, photonic nanostructure, front side metallization, and cell interconnection that increase both performances and efficiency of the solar cell [17,18,19,20,21,22]. Despite this, past research did not take into account the layout of the module rear side, such as the effect of different cell spacing on light absorption and increase in power output of the module. For this reason, the study proposed a different approach whereby light falling between the cells is deliberately steered using the common solar PV module layout. In this way, three solar PV modules with three different cell spacings will be compared for power output.
Therefore, the researchers used an optical simulation engineering program, solar PV module simulator, and outdoor testing facility to analyze light absorption and solar PV module power output. The researchers considered three different cell spacing such as 2 mm, 5 mm, and 8 mm that would fit the available module area. Then, an analysis of the scattered light absorption from the rear side of the module was reflected to the upper surface of the glass and air interface until it reached the solar cell top surface. At the same time, output power produced by three different modules was evaluated. In this manner, the power production capacity of solar PV modules was optimized.
This paper is arranged as follows: Section 2 briefly describes optical principles and solar cell measurement. Section 3 describes the general approach in methodology. Section 4 provides results and discussions of the simulation and experiments, followed by a conclusion in Section 5.

2. Principles of Optical Principles and Principles of Solar Cell Measurement

2.1. Basic Principle of Optics

The physical phenomena are related to the generation, transmission, processing, detection, and application of light, as well as technological developments that cover a wide range of fields. The optical processing model is composed of physical optics which simply refers to seeing light as optics in an electromagnetic wave. Its physical optics can establish a model of amplitude and phase through the optical system. By this principle, it can provide a qualitative interpretation of the linear and spherical propagation of light waves and derive the law of reflection and the law of refraction [23]. Then, geometrical optics describes the light propagation of rays. A ray in geometric optics is useful for approximating the path along which the light propagates under certain circumstances [24]. Lastly, quantum optics are energy packets called photons. Their energy ( E ) can be expressed by:
E = h f
where the Planck constant ( h ) is higher than the frequency of light ( f ). The concept of photons can be used to accurately explore the role of light and matter, optoelectronic semiconductor components and photodetectors, laser systems, and quantum theory [25].
In the application of optical principles, there are roughly applications such as reflection, refraction, total internal reflection (TIR), forward scatter, backward scatter, and absorption. Both belong to the field of optics of geometric optics. Reflection can be divided into three forms: specular reflection, spread reflection, and diffuse reflection [26,27]. Specular reflection refers to the angle of incidence of light equal to the angle of reflection, spread reflection occurs on an uneven surface and the reflected light exceeds an angle, and the reflected angle of all reflected light is the same as the incident angle. Diffuse-type reflection, sometimes referred to as “Lambertian scattering” or “Diffusion”, occurs on rough or matte surfaces with many different angles of reflected light [28]. Specular reflection occurs when the light shines on a perfectly smooth surface obeying the law of reflection, the angle of incidence (the angle between the incident ray and the normal of the vertical surface, and incident angle θ 1 is equal to the angle of reflection), the angle between the reflected ray and the normal to the vertical surface, reflected angle θ 2 . When the light reflects on a rough surface, the light will immediately reflect or penetrate in many different directions on the material of the backlight.
Refraction is when light travels from one material to another, such as from air to glass, the light is refracted, that is, the light bends and changes speed [29]. The refraction depends on two factors. One is the incident angle, represented by the symbol θ 1 , the other is the refractive index of the material, denoted by the letter n , and expressed by:
n = c v   ,
denotes the refractive index equal to the speed of light in the vacuum ( c ), and the speed of light ( v ) in the material rather than the glazing.
The speed of light in air is almost the same as the speed of light in a vacuum, and the refractive index of almost all other substances is greater than 1 because the speed of light passing through these substances is reduced [30]. The relationship between the angle of incidence and the angle of reflection of light passing through the air and the refraction through the glass is called Snell’s law that is expressed as:
n 1 s i n θ 1 = n 2 s i n θ 2 ,
where n 1 is the refractive index of medium 1, n 2 is the refractive index of medium 2, θ 1 is the incident angle of light, and θ 2 is the angle of refraction of light. Total reflection light travels from a material with a higher refractive index to a material with a lower refractive index, and as the angle of incidence increases, the refracted light will deviate from the normal. If the angle of incidence increases, all the light will be reflected into the interior of the material.
Absorption is a phenomenon when the incident light is absorbed, and many materials absorb light of a specific wavelength, called selective absorption [31]. The absorption of light by materials can be expressed by Lambert’s law of absorption:
I = I o e α x ,
where I o is the incident light intensity, I is the transmitted light intensity, α is the material absorption coefficient, and x is the material thickness. From Equation (4), homogenous materials of the same thickness have the same absorption rate of light.

2.2. Solar Cell Measurement

The voltammetric characteristic curve is when the operating current of a solar cell under short-circuit conditions, this is called short-circuit current density ( I s c ). The short-circuit photocurrent is equal to the absolute number of a photon that is converted into electron-hole pairs [32]. The output voltage of the solar cell under open-circuit conditions is called open-circuit voltage. Open-circuit voltage ( V o c ) is the voltage that the solar cell is exposed to when the load is infinite (R~∞), the voltage that is measured when the external current is disconnected, which is the maximum voltage that the photocell can generate. Fill factor ( F F ) in the I-V characteristic curve under illumination, the maximum output power is equal to the product of the current density corresponding to the maximum voltage [33]. Photoelectric conversion efficiency is the total cell efficiency that represents the performance of a solar cell, defined as the ratio of the maximum output power of a solar cell to the power of incident light [34]. These solar cell measurements were used in the solar cell simulator.

Measurement Principle of Solar Cell

The thermal and electrical properties of solar cell modules are indicated in their module product specifications. This information is a value obtained from standard test conditions (STC): irradiance 1000 W-m−2, module temperature 25 °C, and AM 1.5. However, the operation of the solar cell module power generation system erected on site is rarely able to measure the power production capacity under STC conditions [35]. The reasons are as follows:
  •  Accurate solar cell operating temperature is unknown.
  •  When the incident irradiance reaches 1000 W-m−2, the solar cell temperature of the module is higher than 25 °C.
  •  The incident sunlight is not perpendicular to the solar cell module.
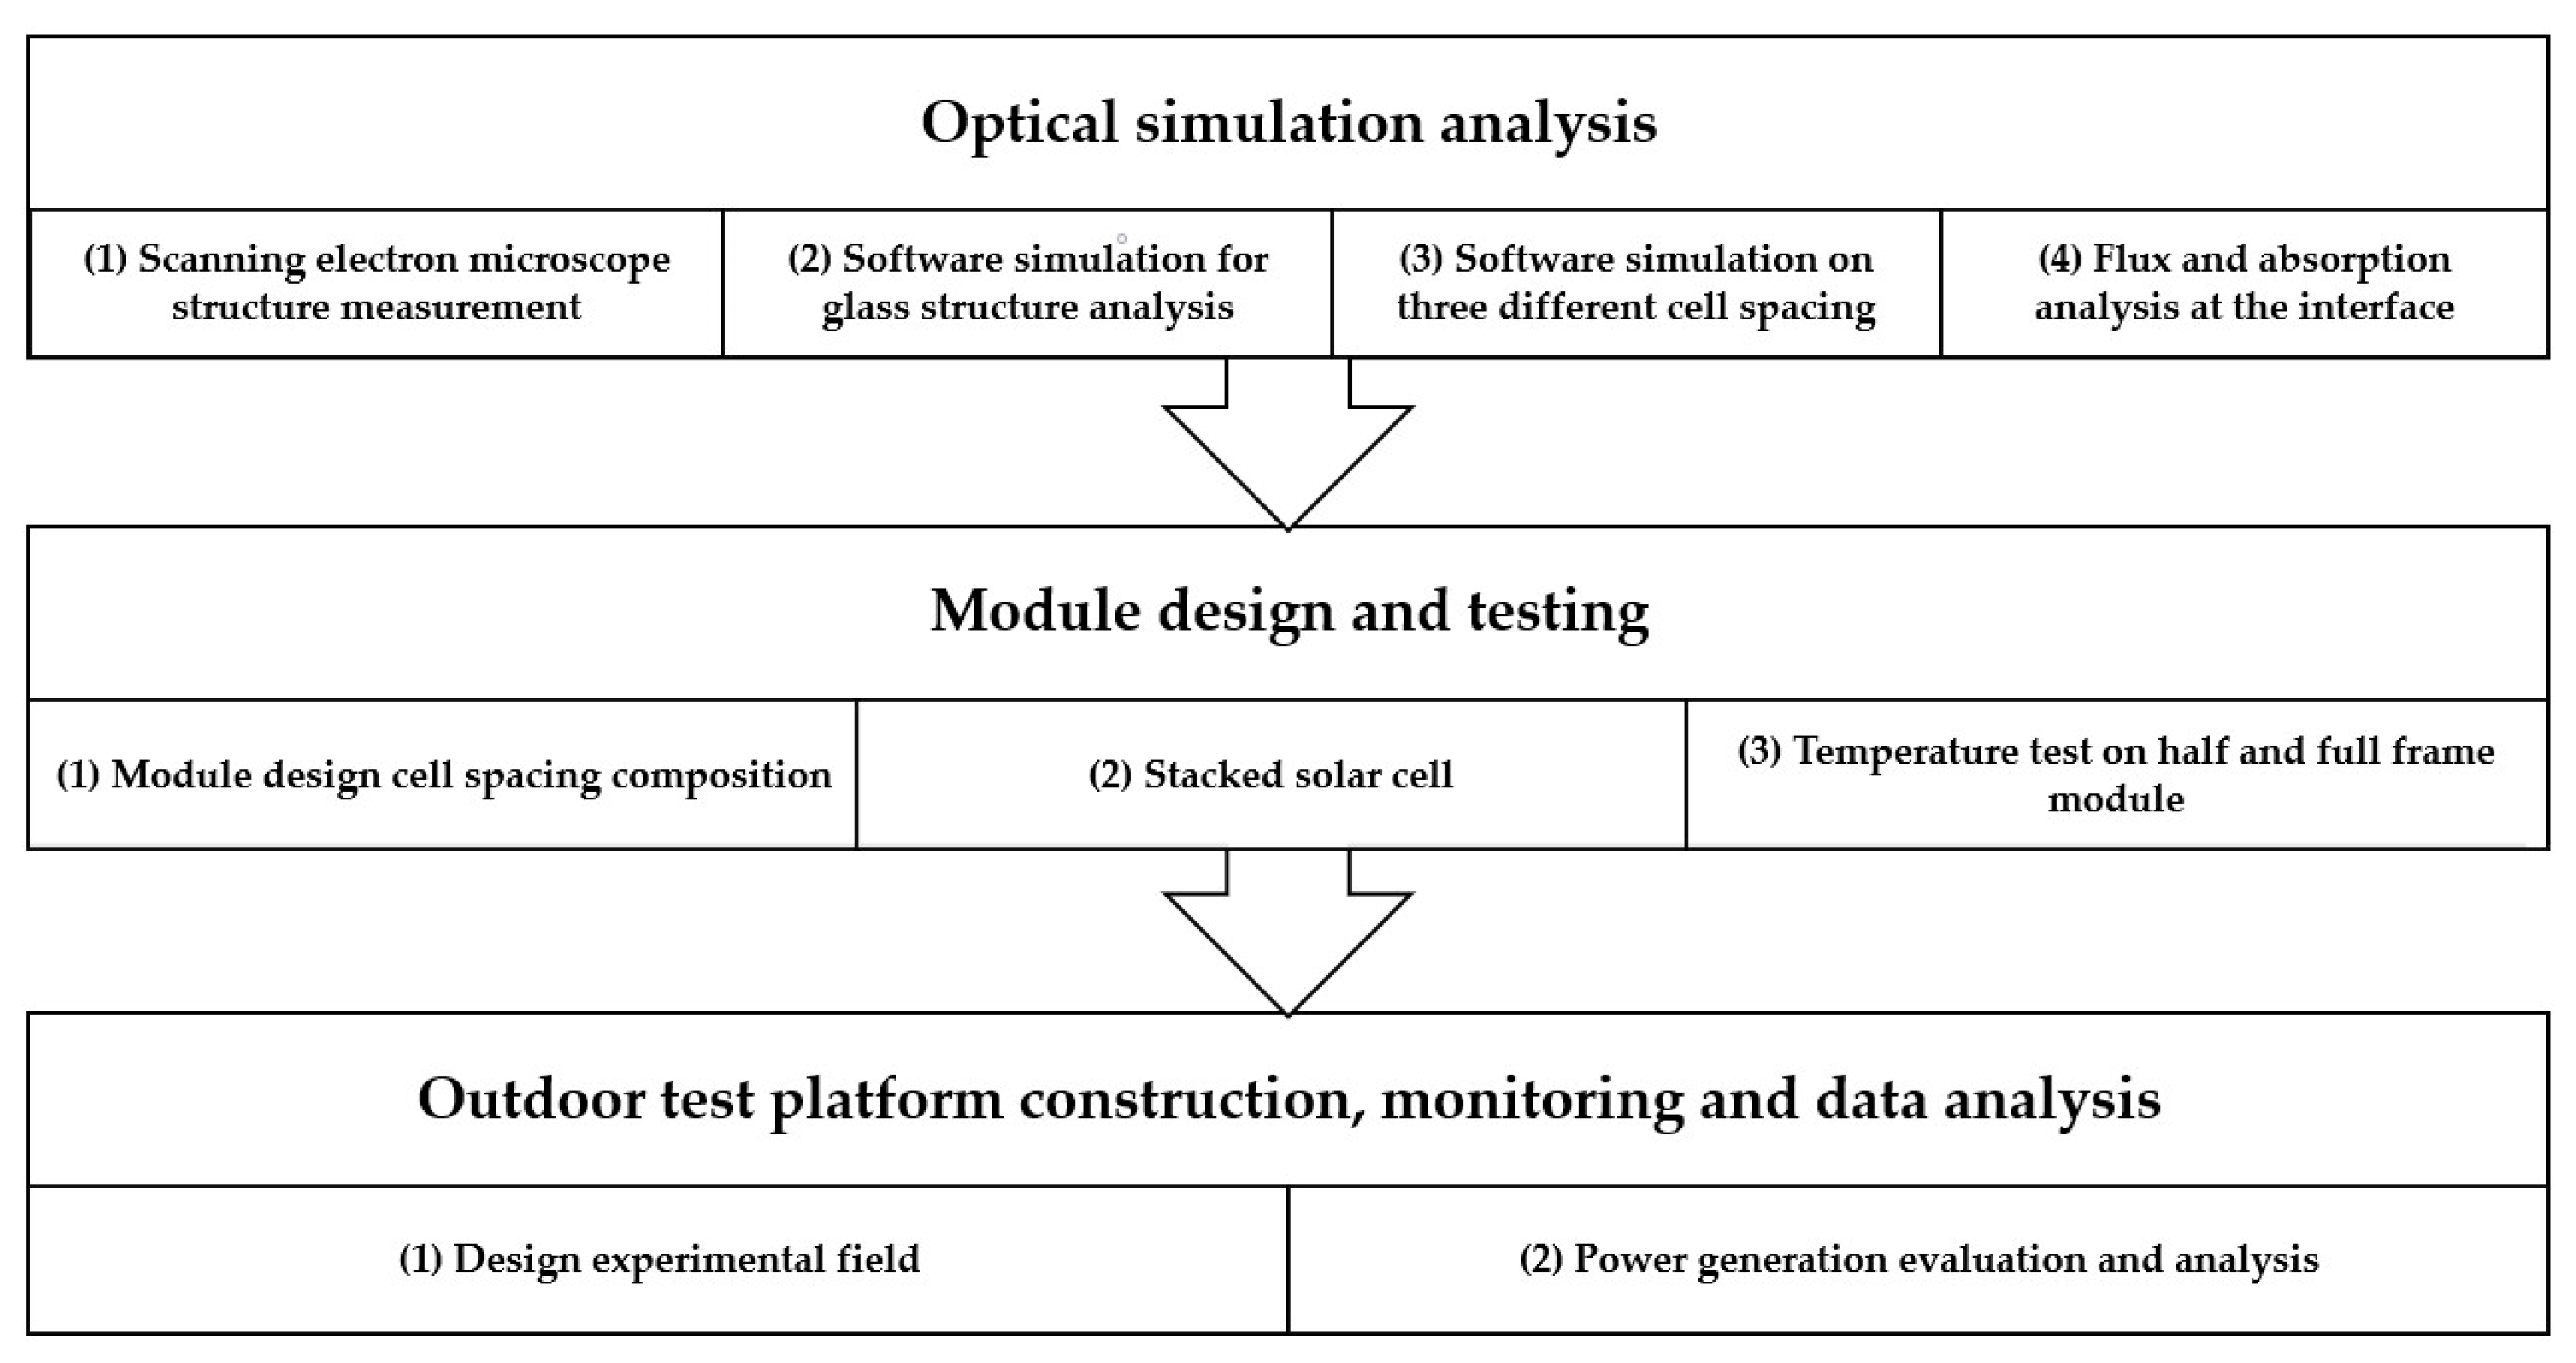
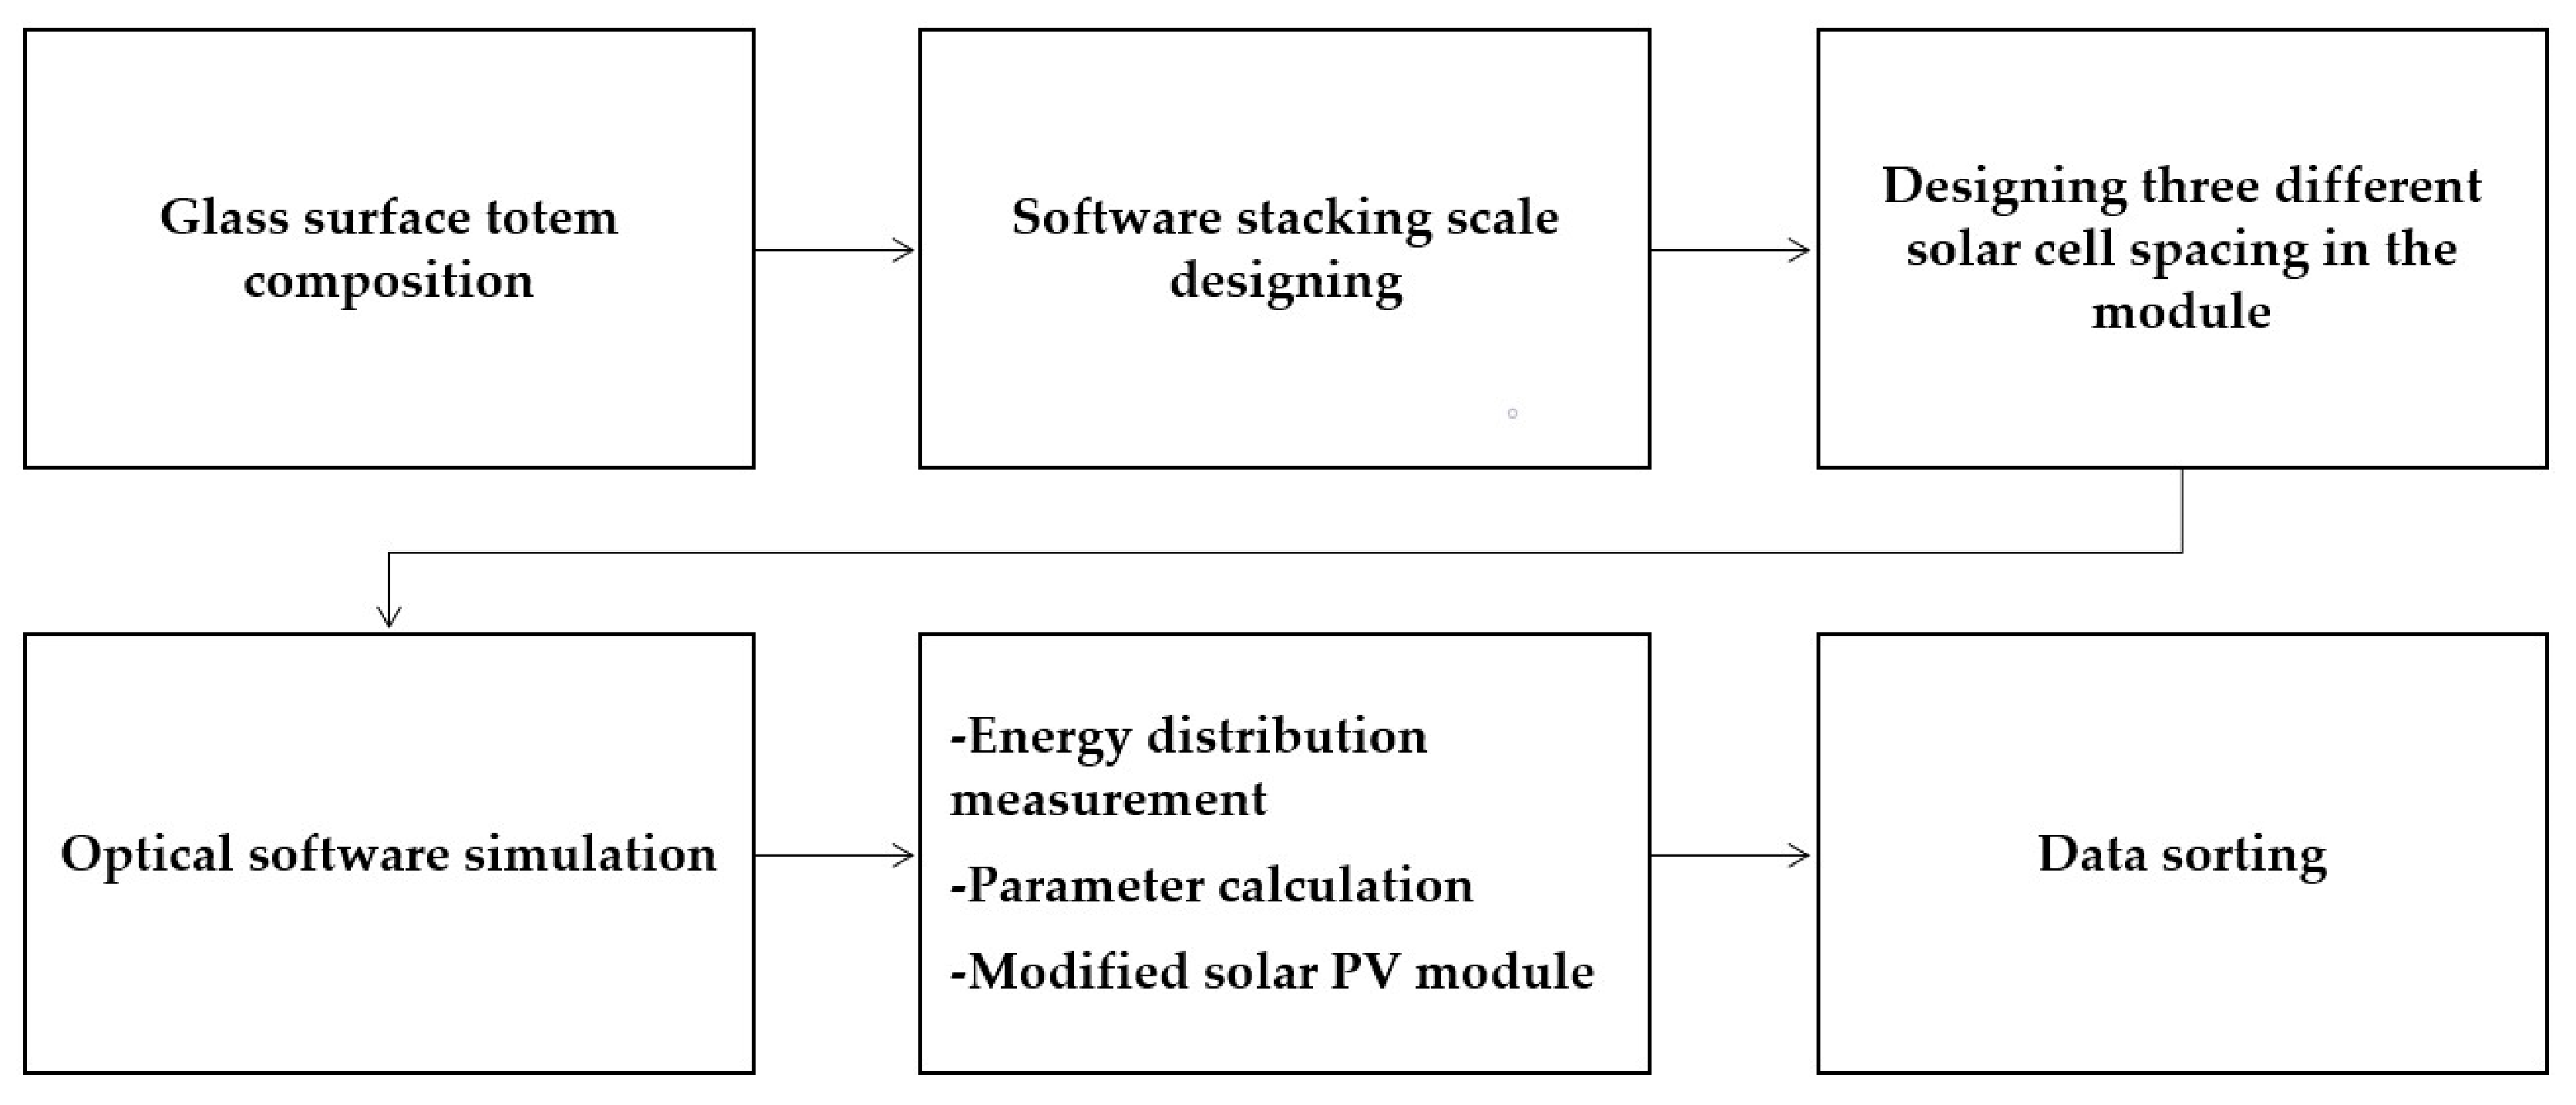
Under actual operating conditions, the module output is affected by various environmental conditions such as irradiance, temperature, spectrum, and angle of incidence.
The main content includes all parameters related to the aging of the solar module board, and different qualification tests are carried out based on the weather resistance of the simulated materials. Among them, the measurement of the IEC 61215, section 10.4 measure of temperature coefficient and IEC 61215, section 10.5 Nominal Operating Cell Temperature (NOCT), determines the power generation characteristics of the solar cell module in outdoor operation and are also important parameters in expressing the relationship between electrical output and temperature change. The power generation system is designed in a real working environment, and the electrical output that can be obtained in the outdoor operation can be calculated according to the temperature coefficient and NOCT [36]. The electrical I-V characteristics of solar cells have a critical impact on their output power. Since the semiconductor is very sensitive to temperature, the overall efficiency is reduced for every 1 °C increase in temperature of the solar cell above 25 °C. Therefore, before establishing the I-V characteristics of the solar cell, it is necessary to understand the temperature coefficient of the solar cell module [37].
The solar cell module equivalent circuit, combined with the semiconductor P-N junction characteristics, can obtain the output voltage and current equation of the solar cell module. The photovoltaic module is a power generation principle that is based on the photovoltaic effect, which converts light energy into electrical energy, including a photo-current source, connected diodes, and series and parallel resistors, then connected to the load.
The maximum output power ( P m a x ) of a solar cell is shown as:
P m a x = V o c I s c F F ,
when the voltage and current of the solar cell module change under different irradiation amounts, the open-circuit voltage of the same environment is almost unchanged, and the short-circuit current will change significantly, so the output power and the maximum power point will also change significantly. The equations show that the module voltage and power change under different irradiation amounts, the open-circuit voltage does not change much when the irradiation intensity changes. But the maximum current generated will vary considerably. The power and maximum power point will change accordingly. Under the fixed irradiation intensity, when the temperature increases, the open-circuit voltage of the solar cell will decrease, and the short circuit current will rise slightly. The output power will decrease slightly with increasing temperature, and the maximum power output will decrease with increasing temperature. The maximum power value will also change linearly corresponding to temperature change. The rise of module voltage and power in temperature will cause the solar cell output power to decrease, so the temperature of the working environment will directly affect the efficiency of the solar cell.

3. Method

The method is composed of three major stages that are shown in Figure 1. First is the optical simulation analysis of the structural part of the solar cell module. The second is the solar module design, fabrication, and testing in indoor environments. The third is the outdoor test platform construction, monitoring, and data analysis. The optical parameter is initially established by optical simulation software that is shown in Figure 2. The glass microstructure is observed using a scanning electron microscope (SEM). Then, simulation is used to explore the ray tracing inside the solar cell with the glass surface microstructure and with different cell spacing. The solar PV module is designed with a half-frame module that is composed of 30 solar cells and a series of tests at different temperatures is performed. After the experiment is completed, the module is packaged into a full-frame module for STC measurement. Finally, a test is conducted to analyze and monitor the effects of the outdoor photoelectric conversion of power at different angles and cell spacing.
The multicrystalline cell with three busbars is used in the study. The dimension of the cell of 156 mm × 156 mm is shown in Figure 3. The solar cell will be connected in series to form a full-length module that is composed of 60 pieces of solar cell that are shown in Figure 4 and a half-frame module in Figure 5 that is composed of 30 pieces of a solar cell. This design is used to analyze under optical simulation, indoor testing, outdoor testing. The microstructure of the glass surface is measured by an electron microscope with a dimension of 0.8333 mm in length and 0.525 mm wide. It has an elliptical hemispherical protrusion surface facing the cell. The material parameters in Table 1 for the optical simulation software are used. Then, draw the solar cell array with the fixed backplate with different cell spacing to facilitate immediate simulation from replacing the glass, as shown in Figure 6. The actual design of the solar PV module is shown in Figure 7 that will be used in outdoor testing.

4. Results

The result of optical simulation, indoor, and outdoor testing is presented and discussed in this section.

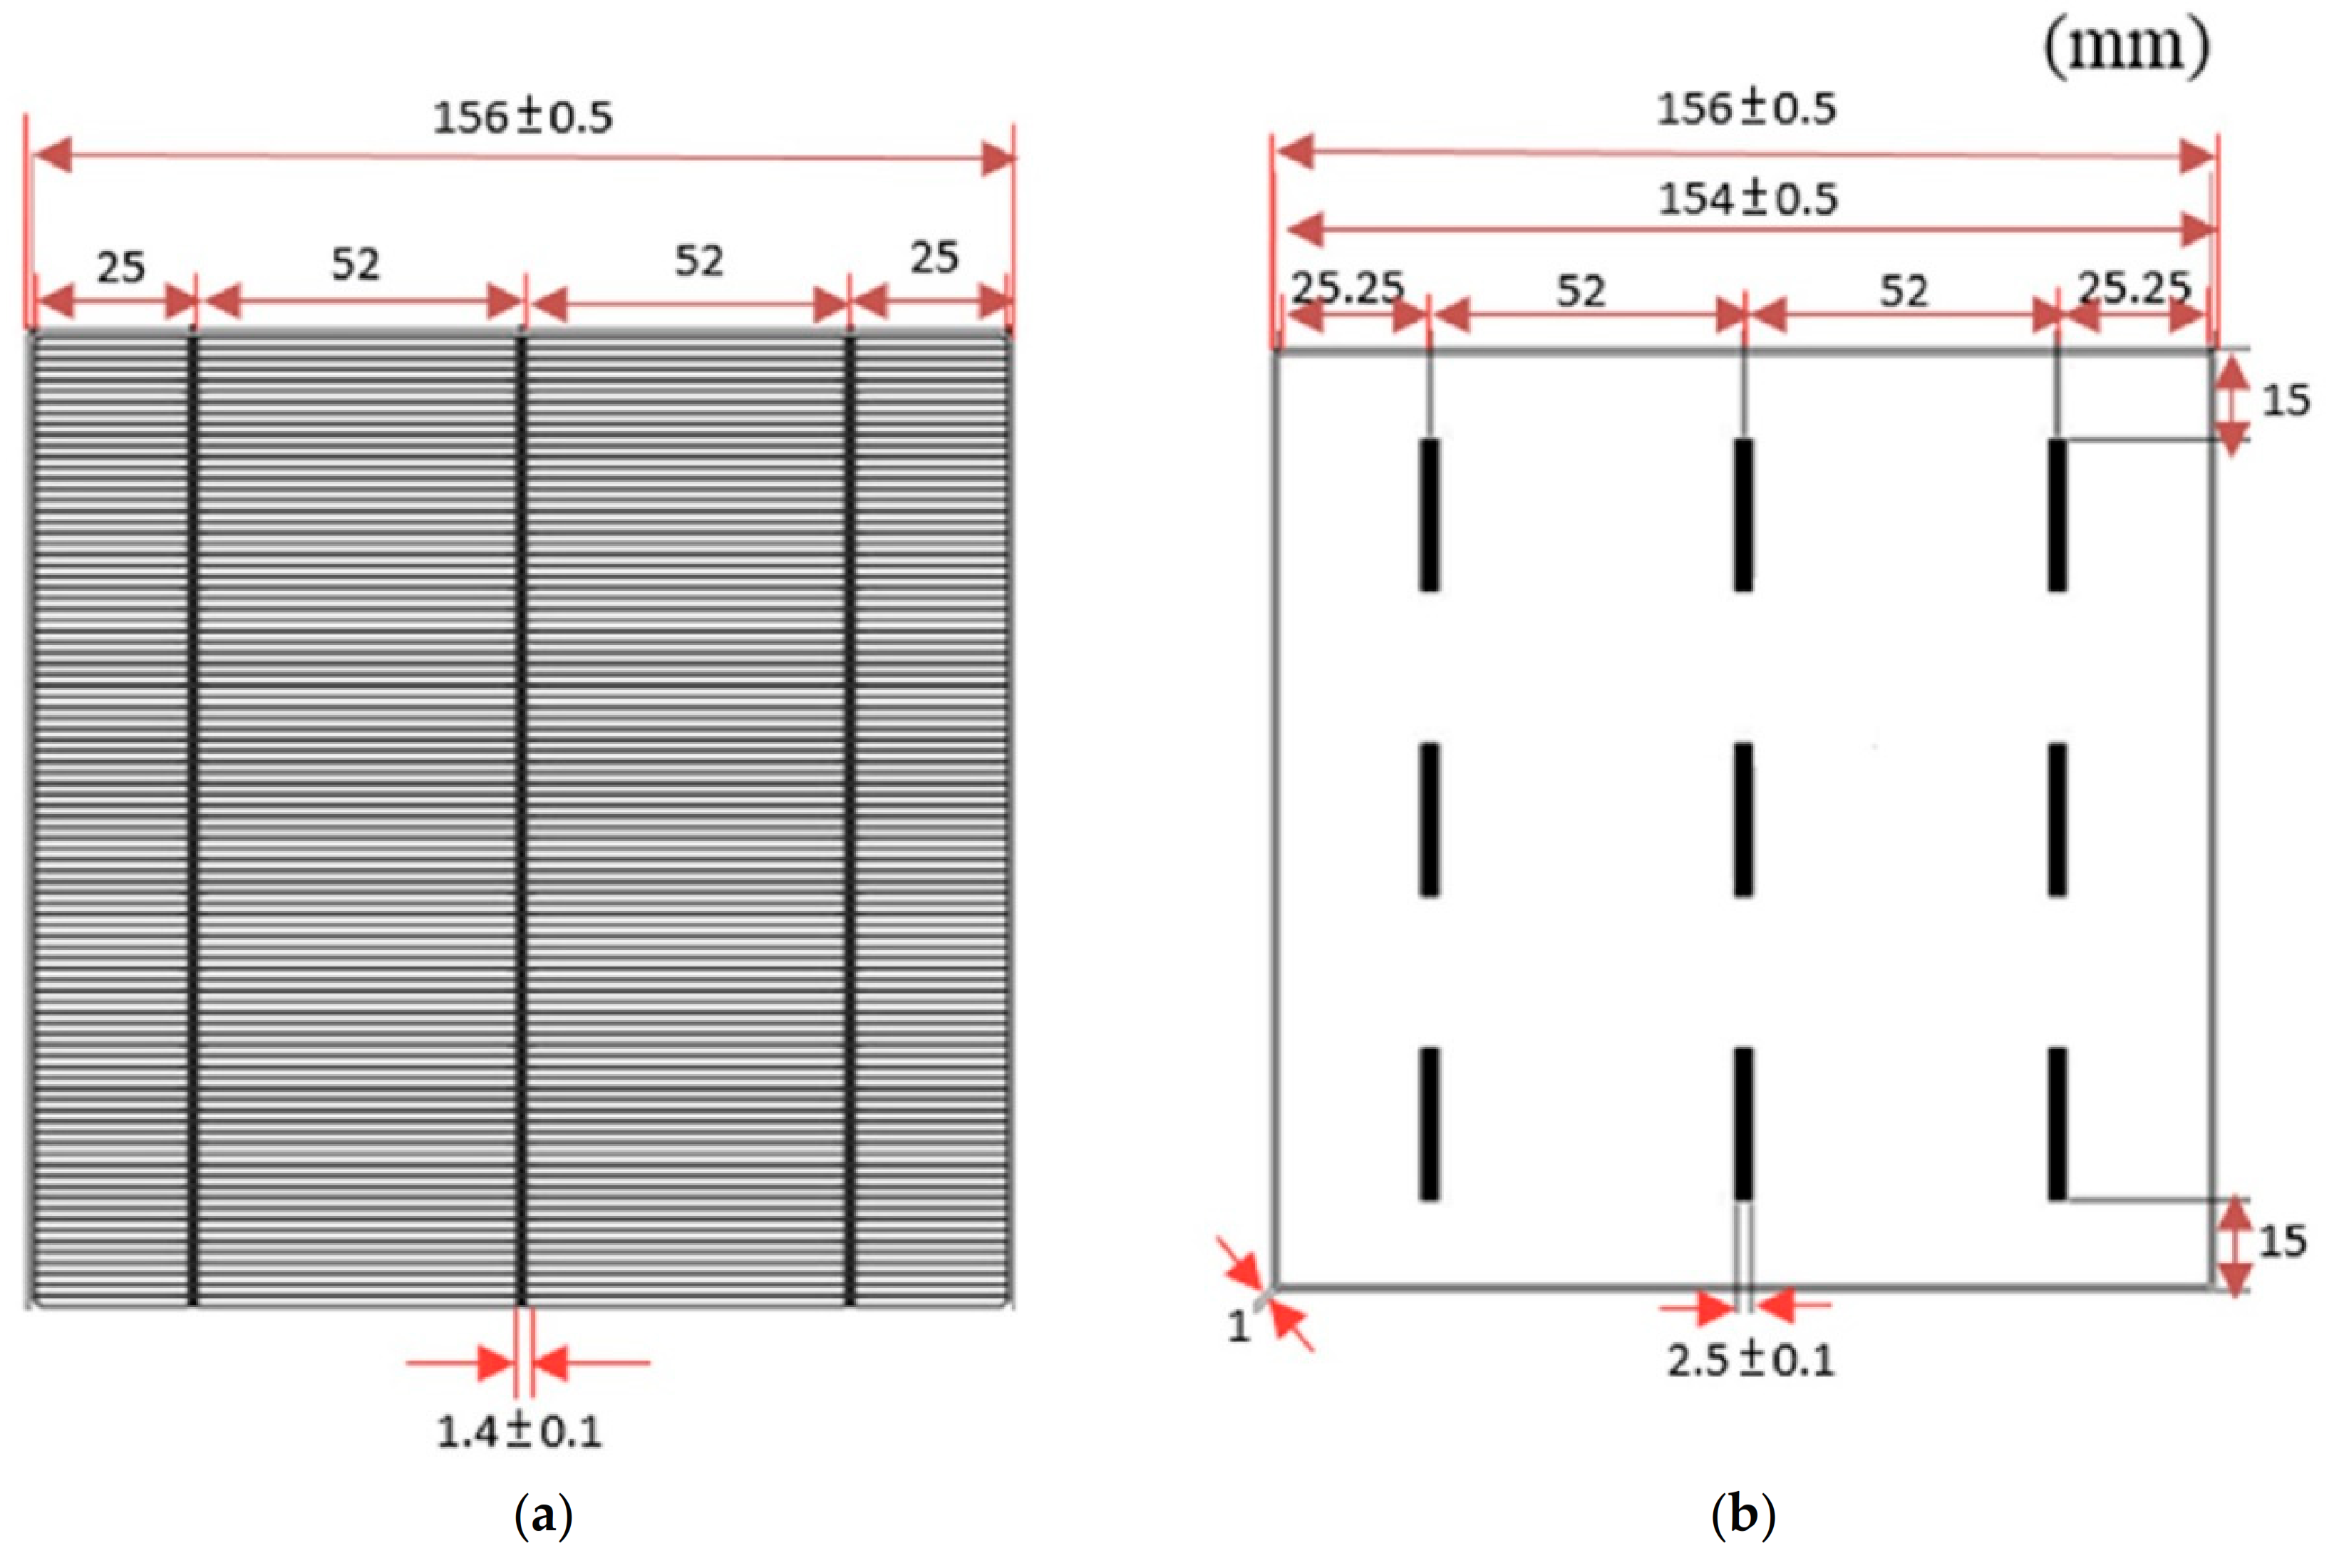
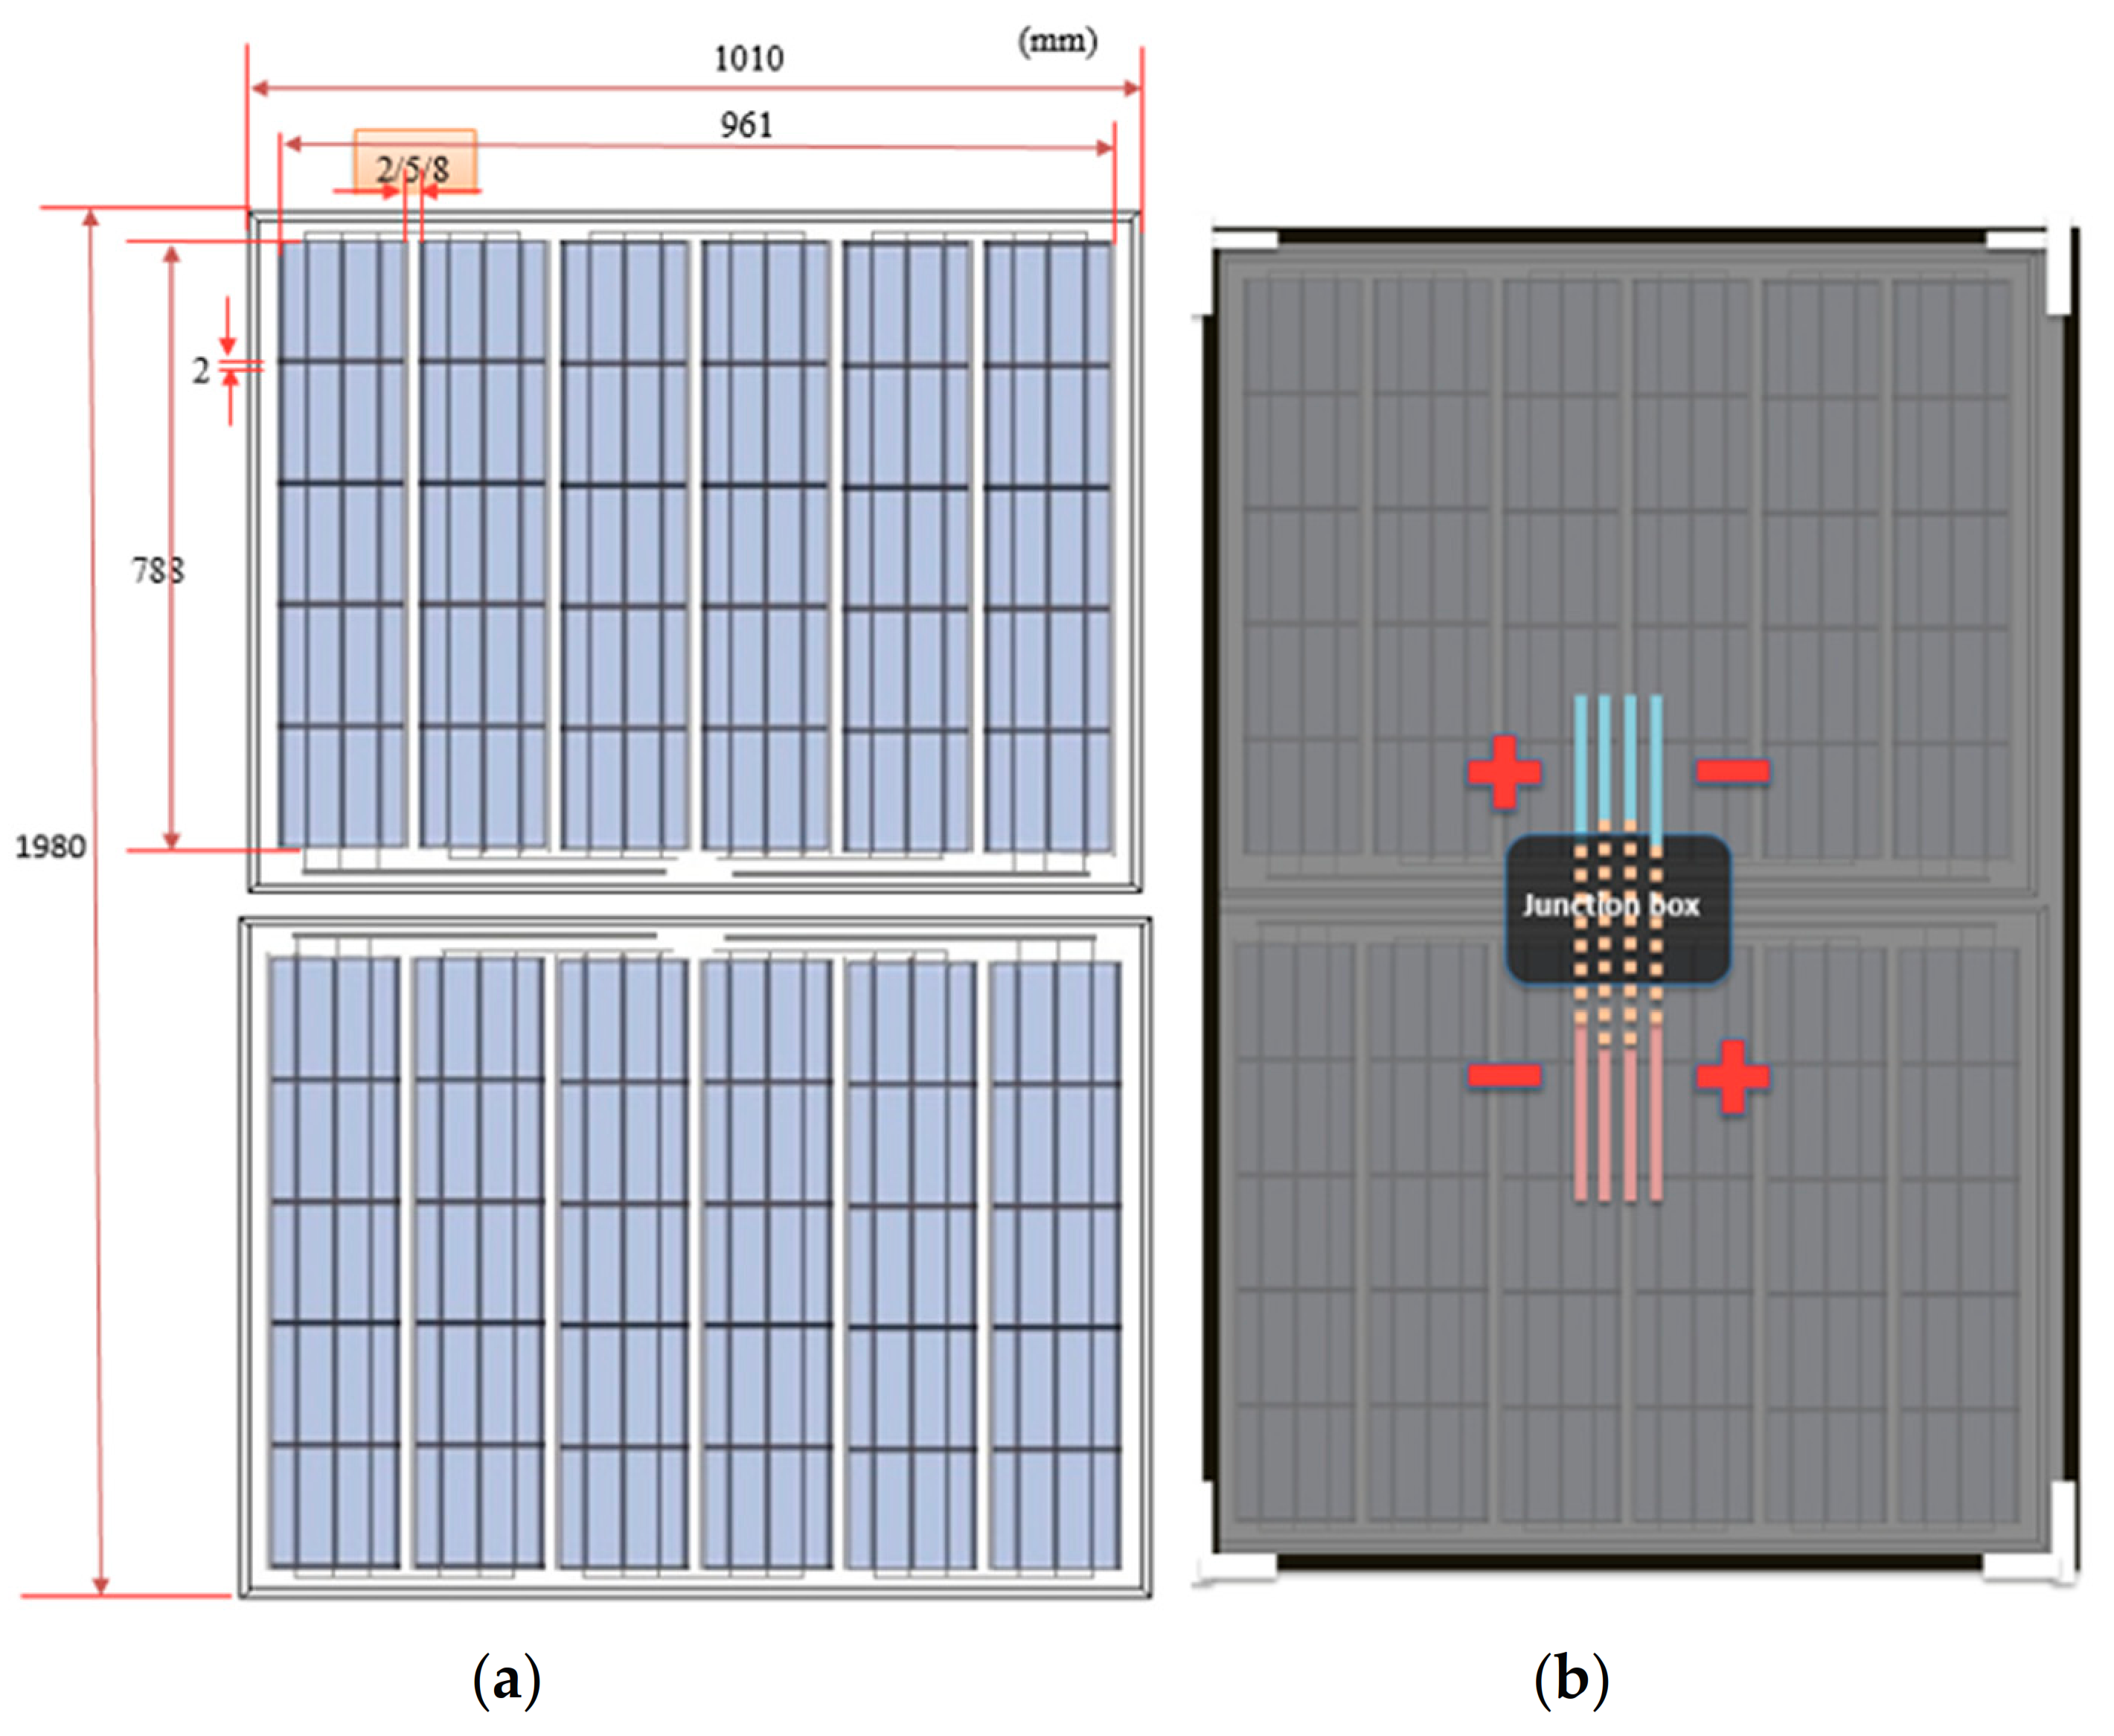
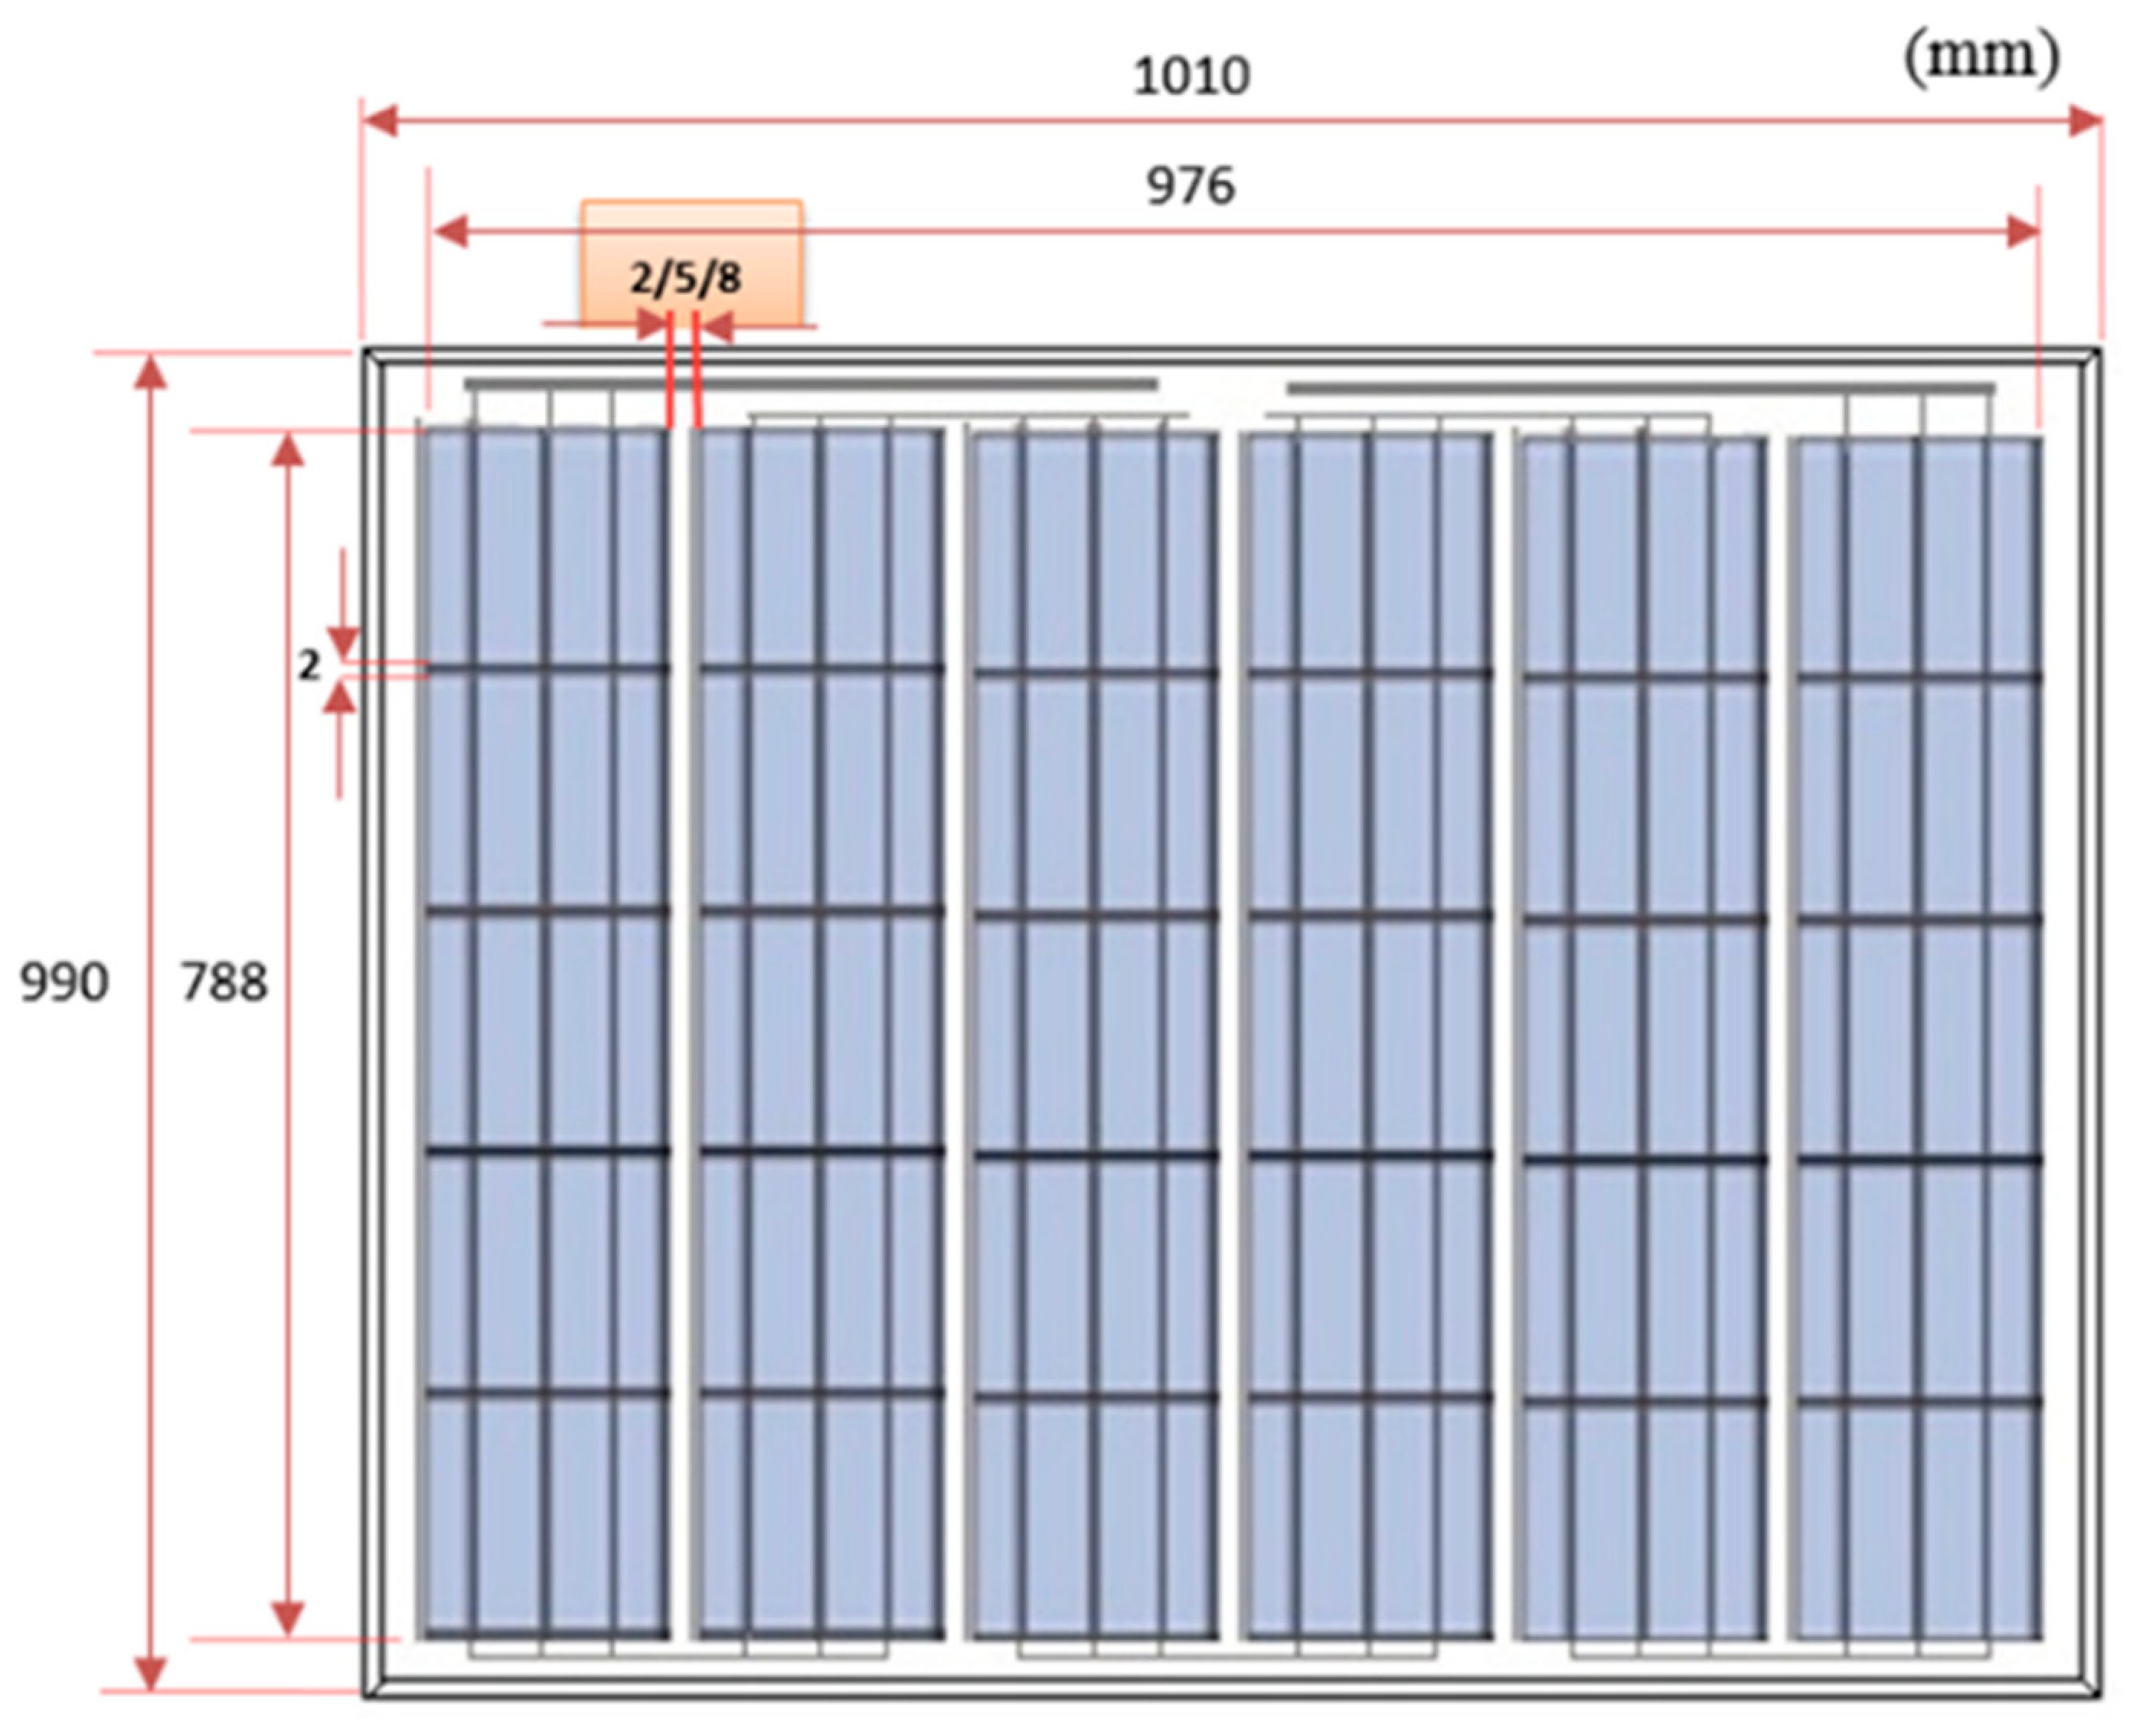
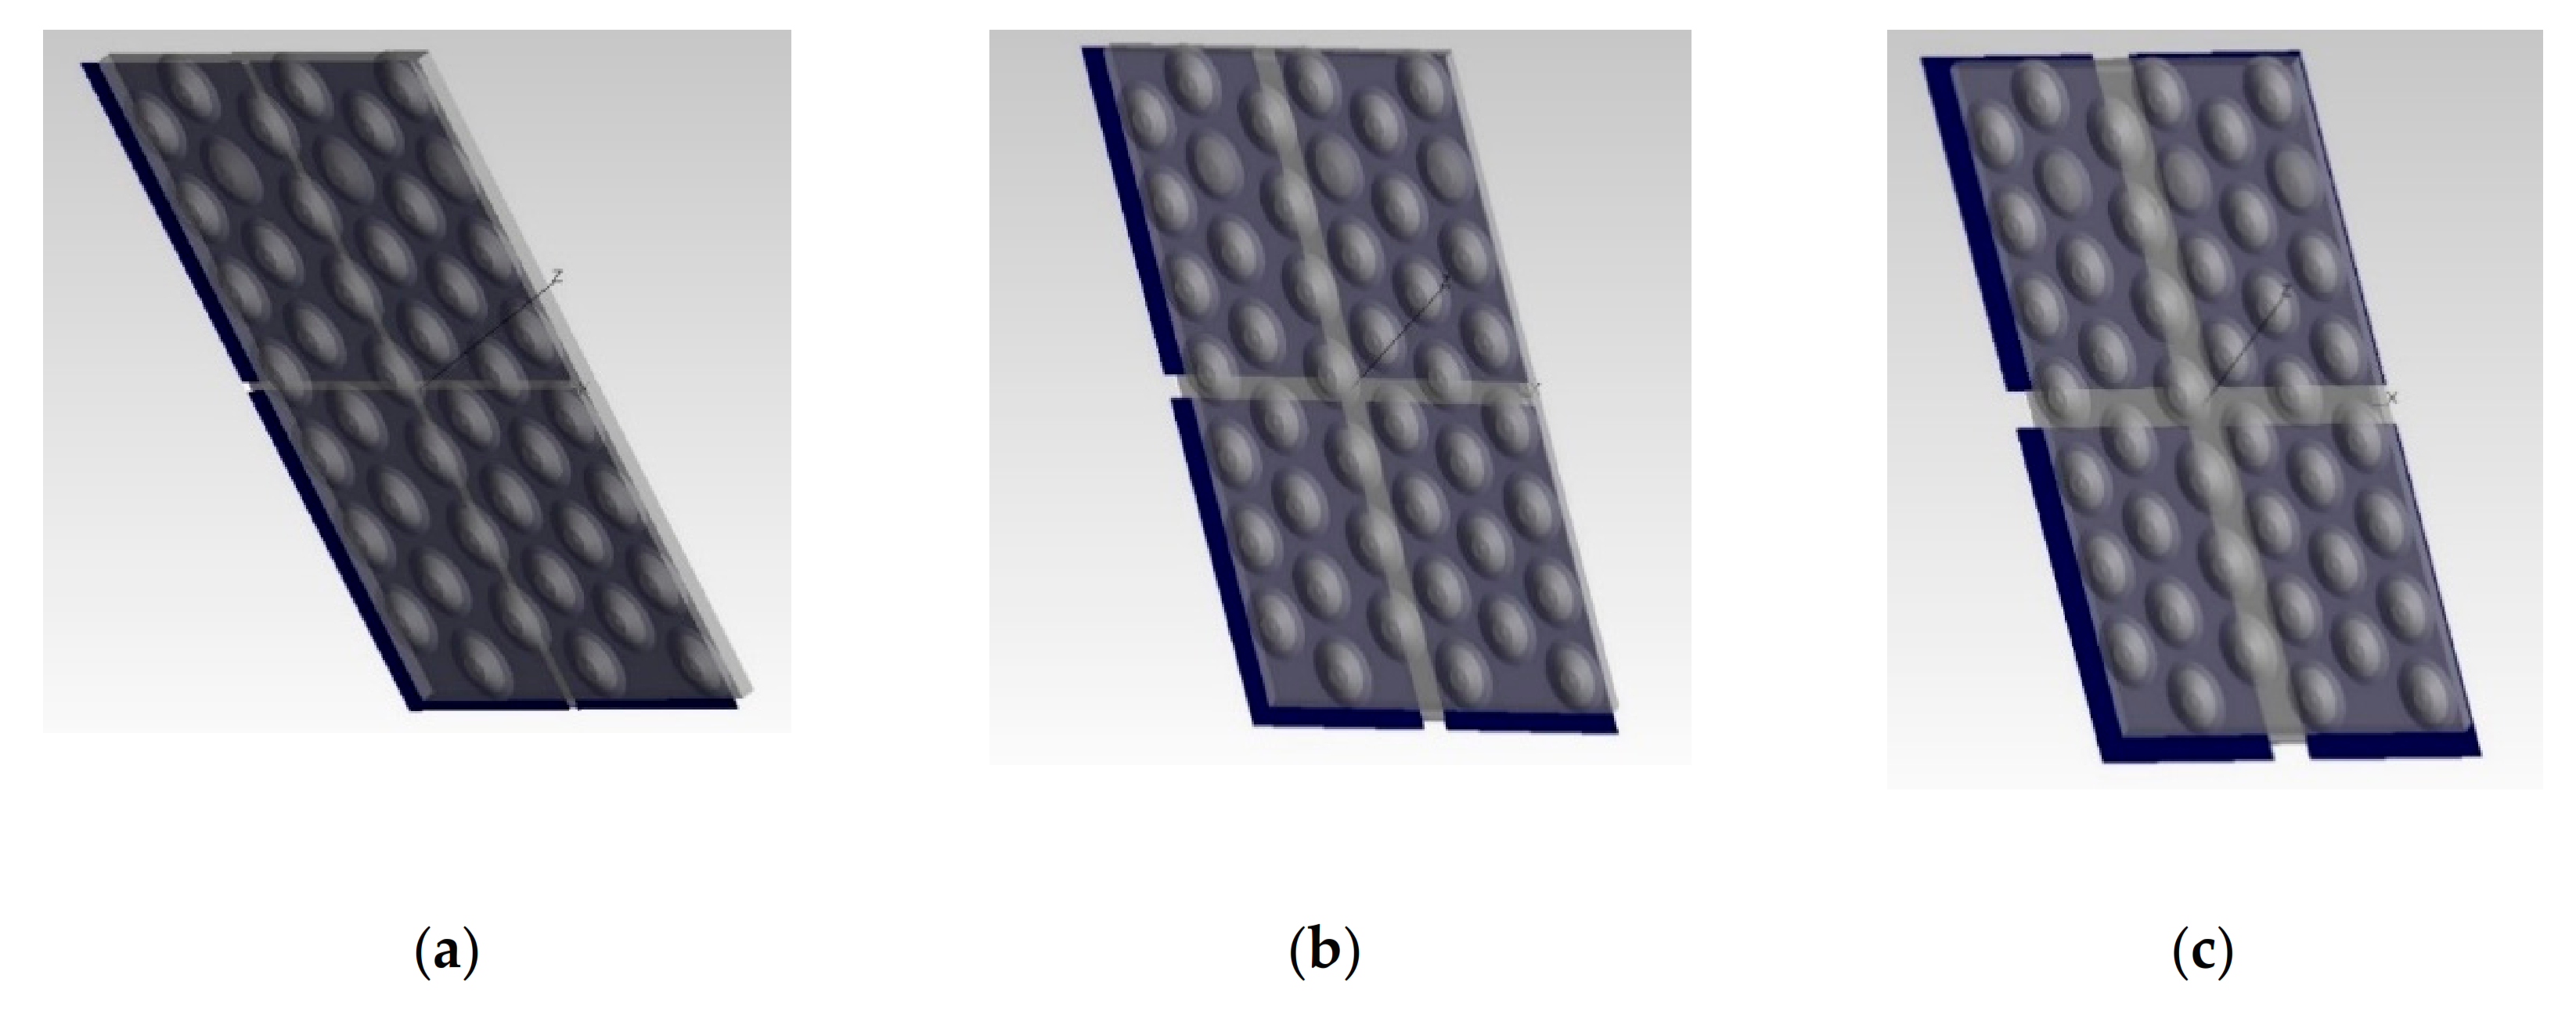
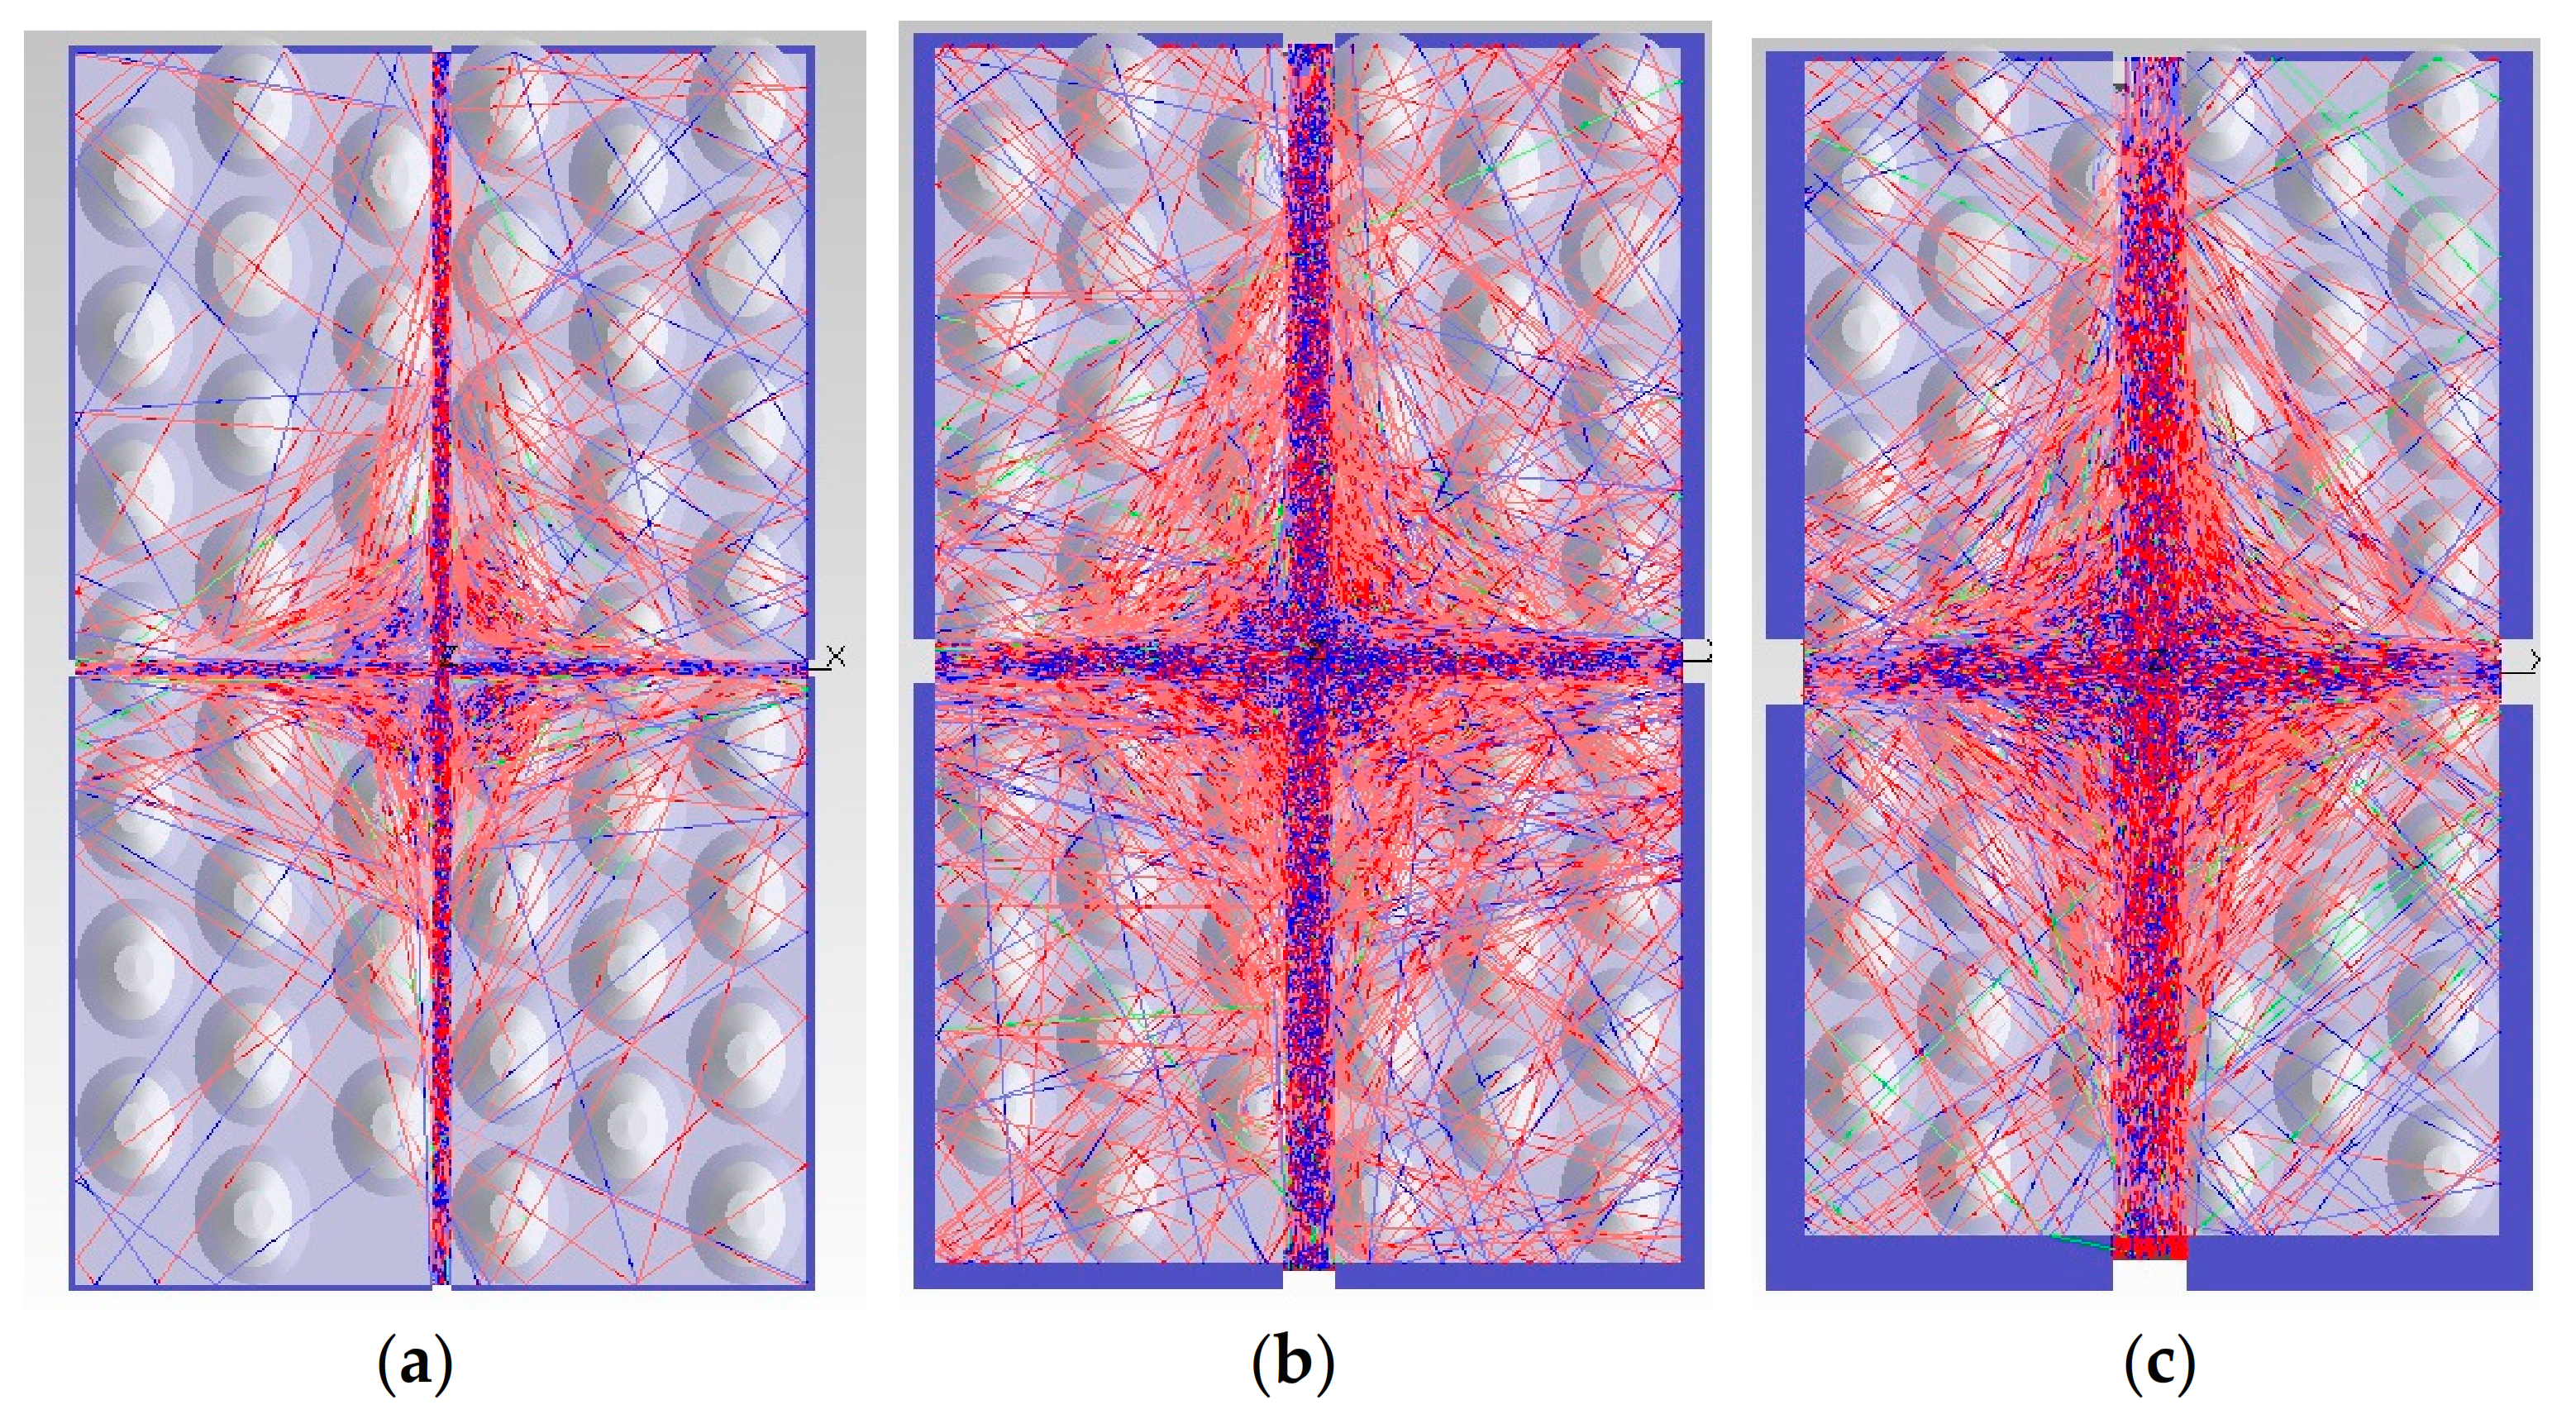
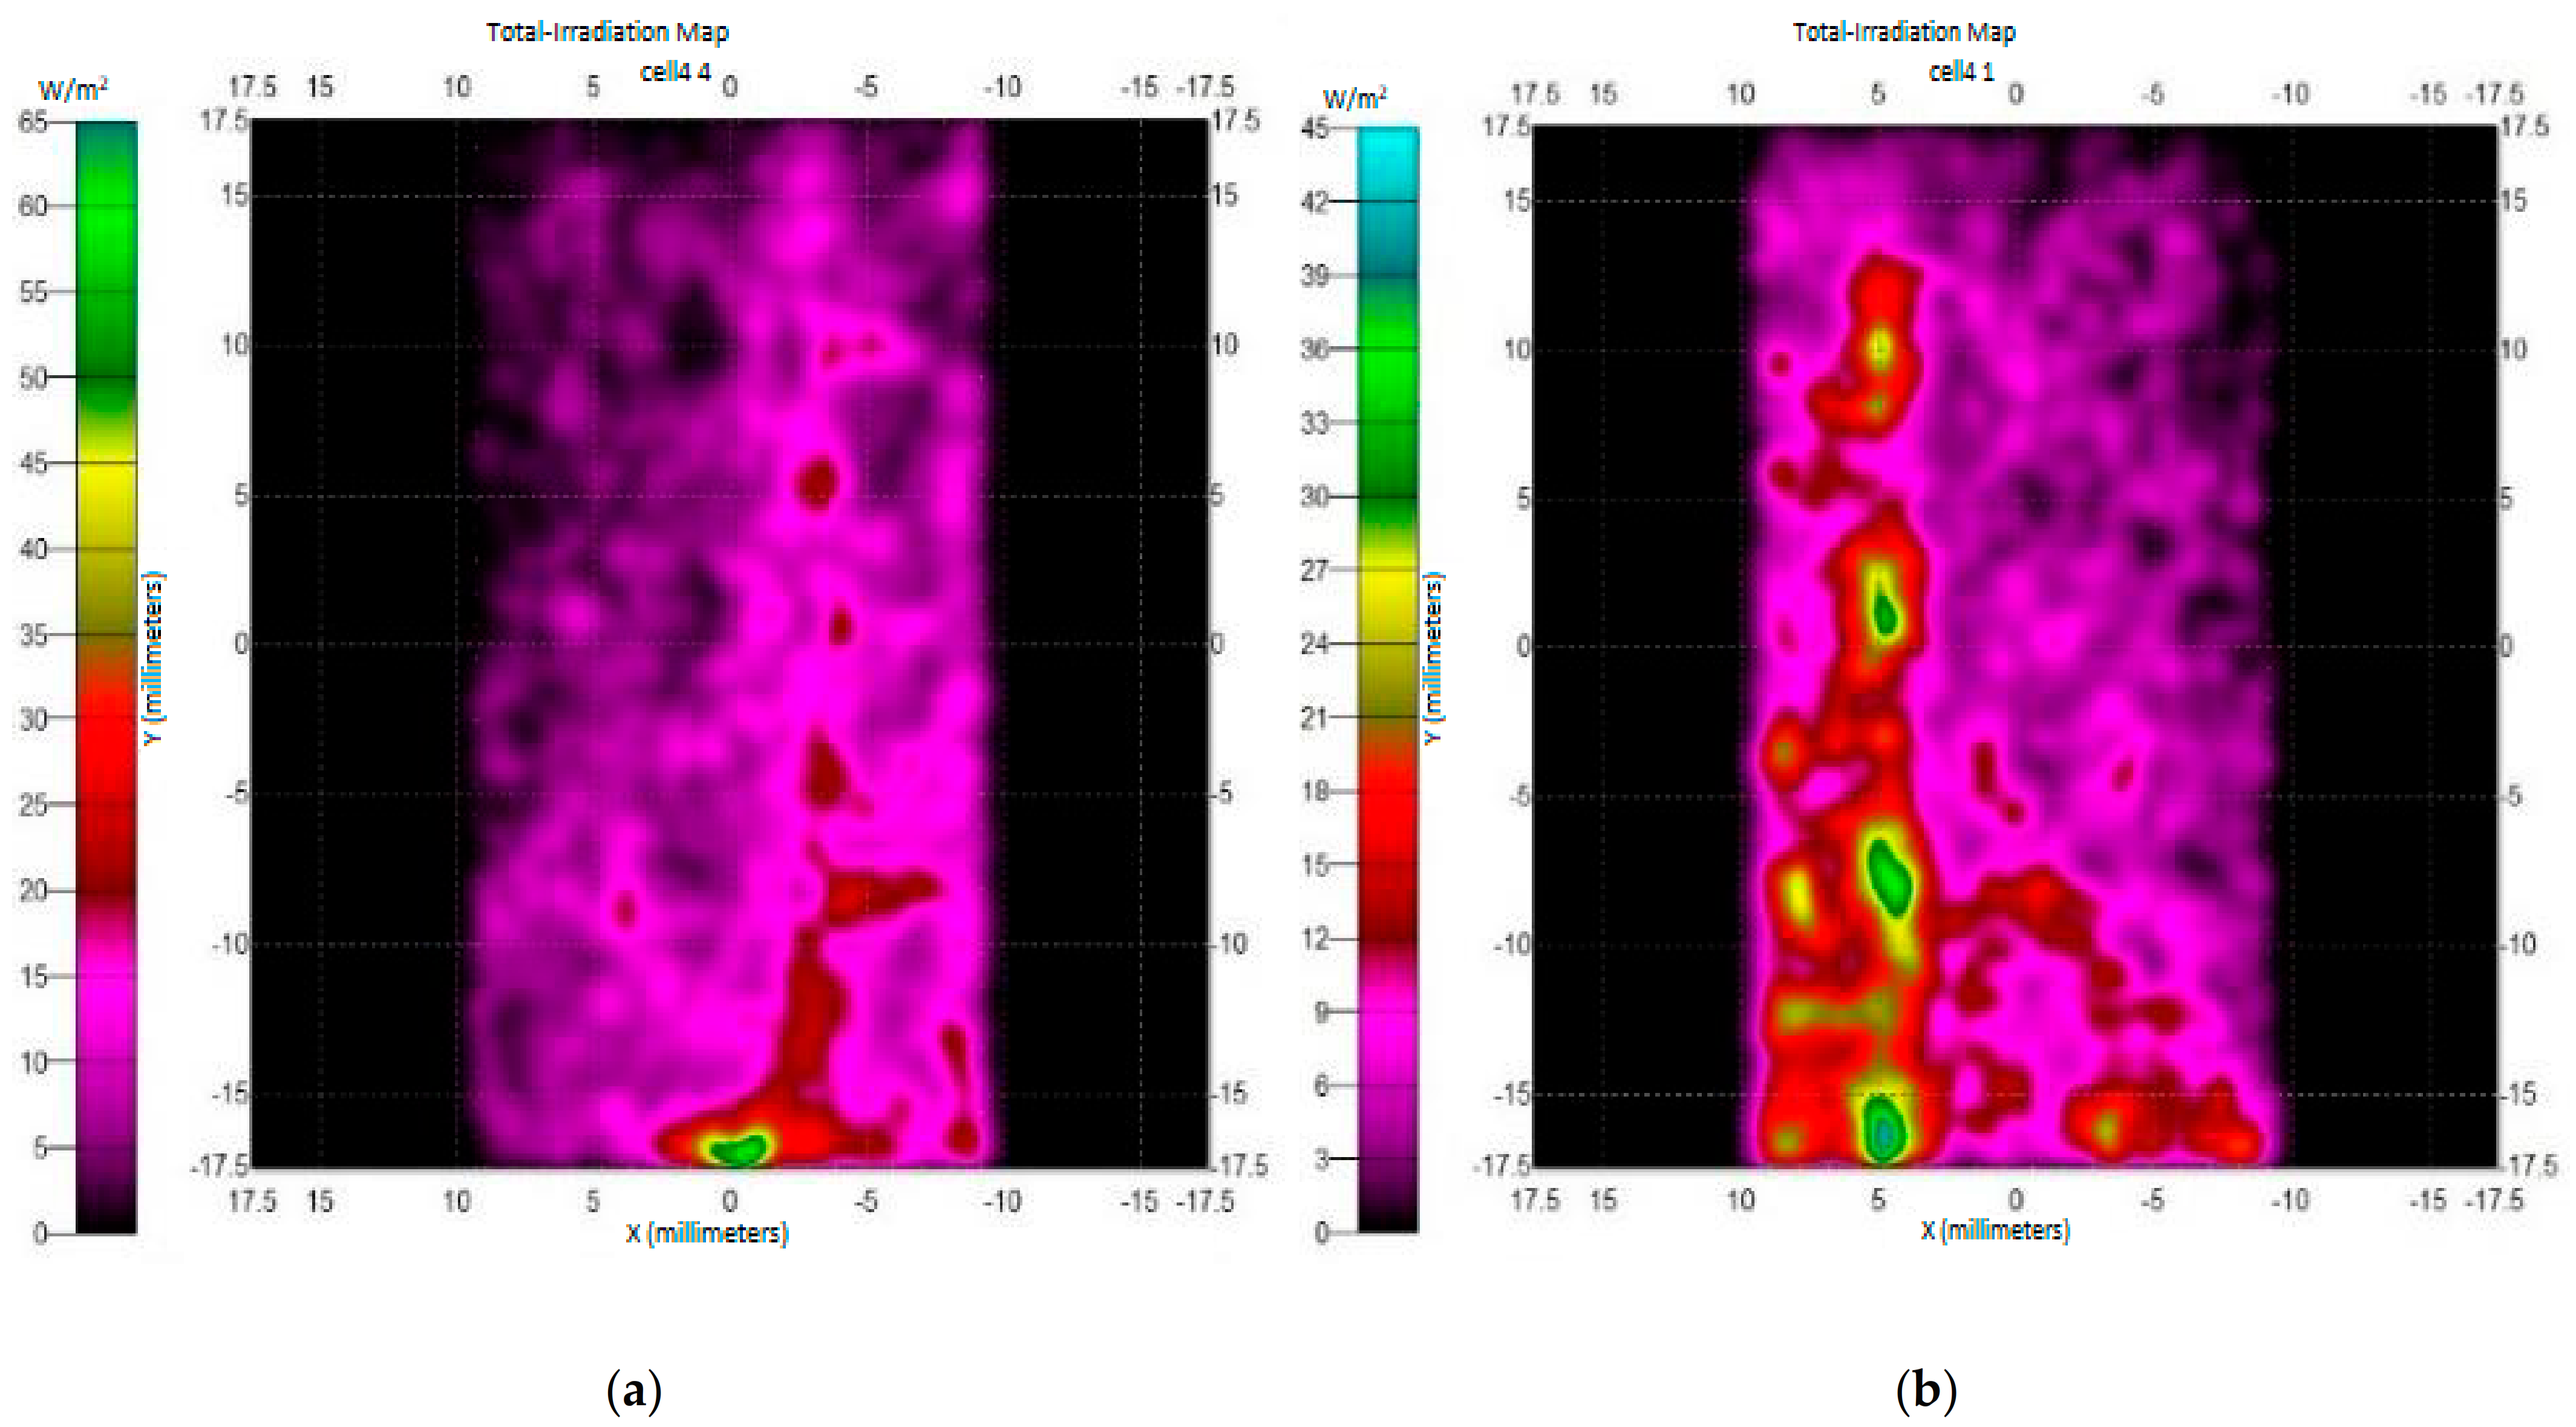
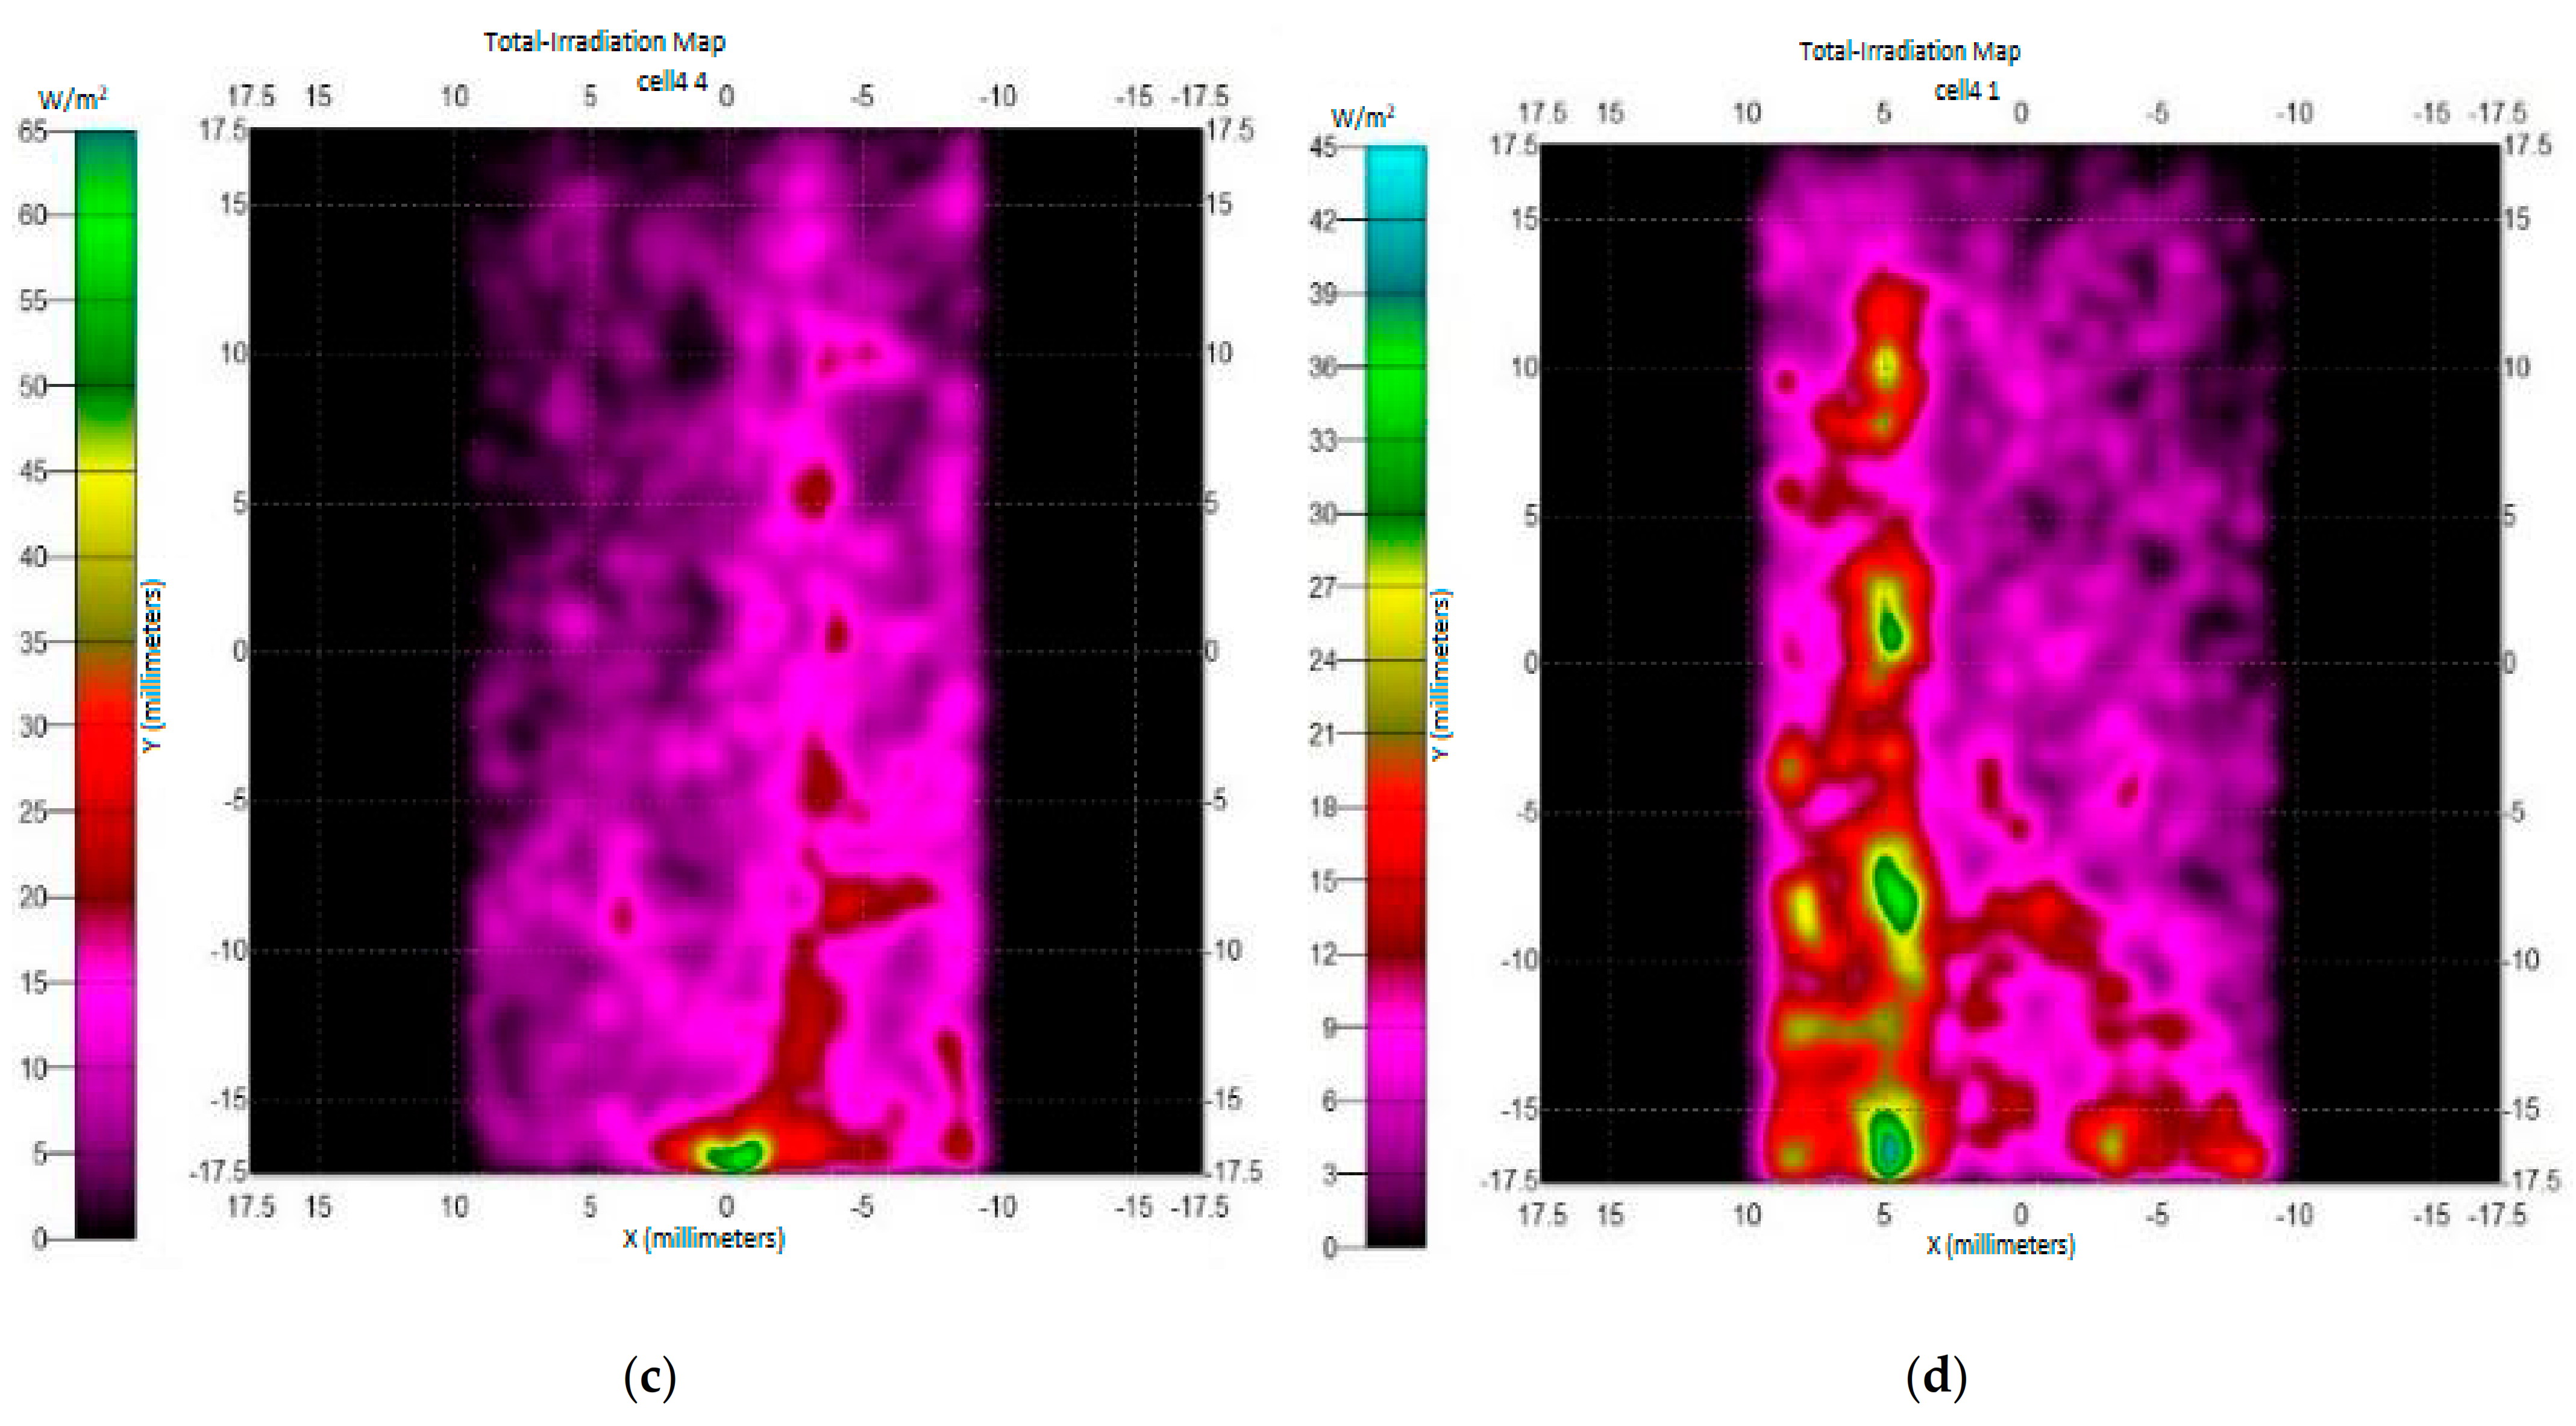
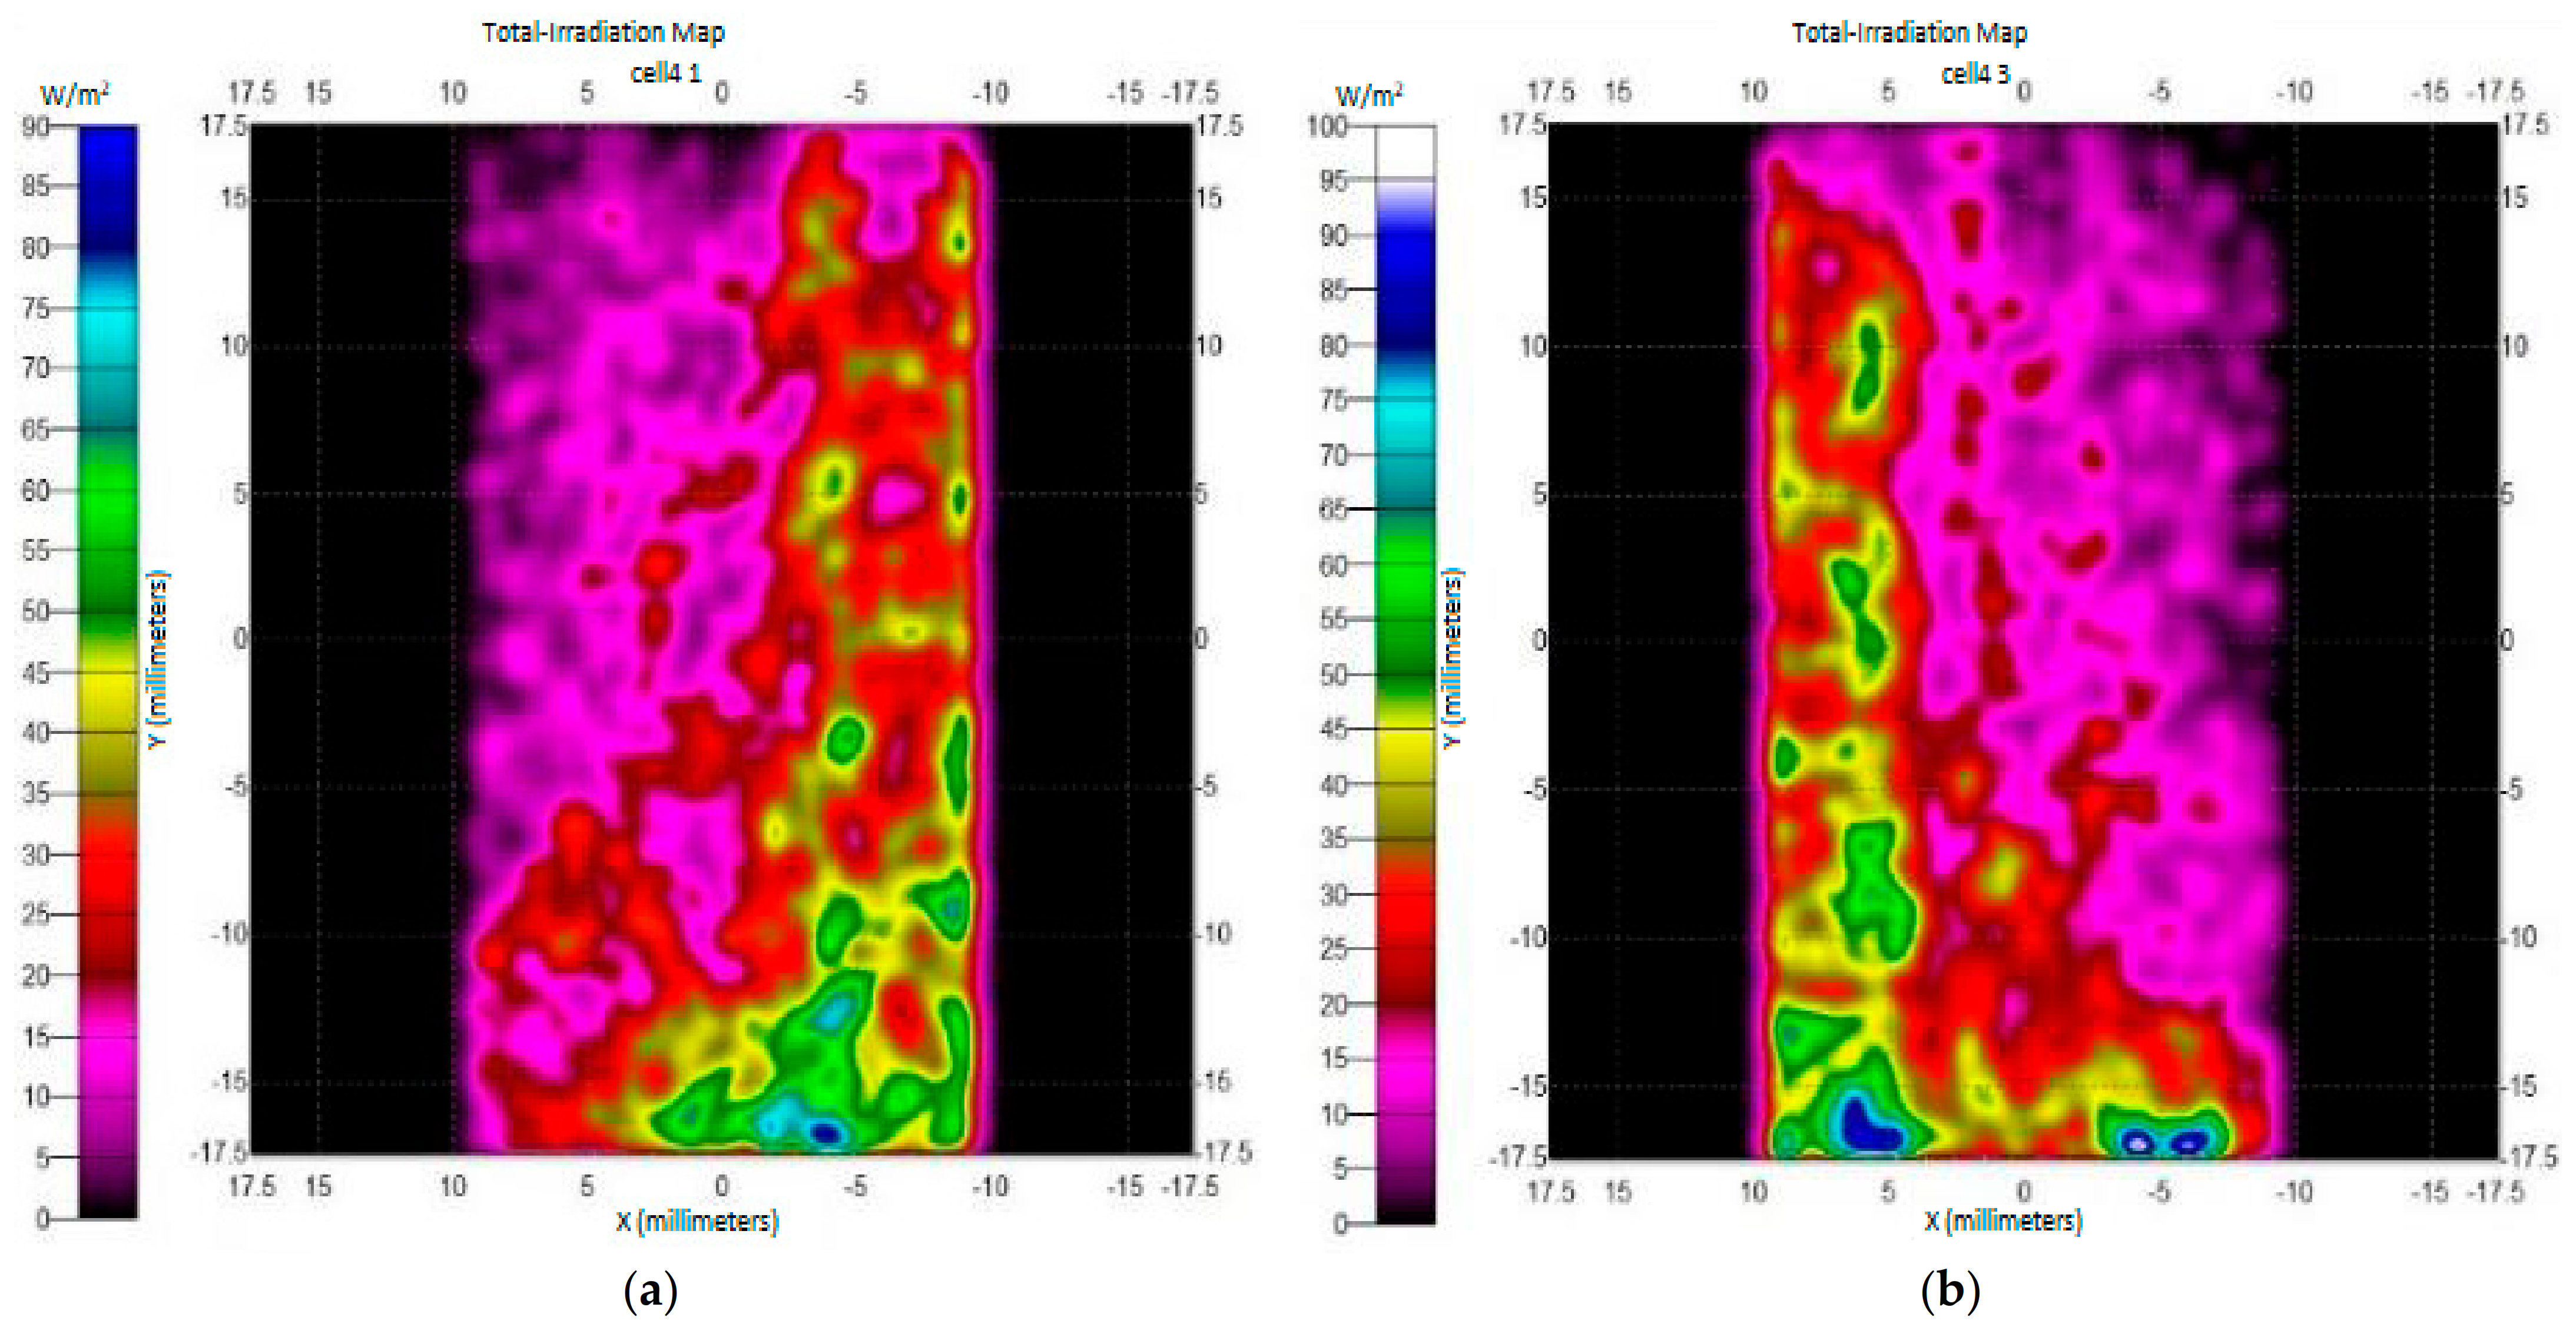
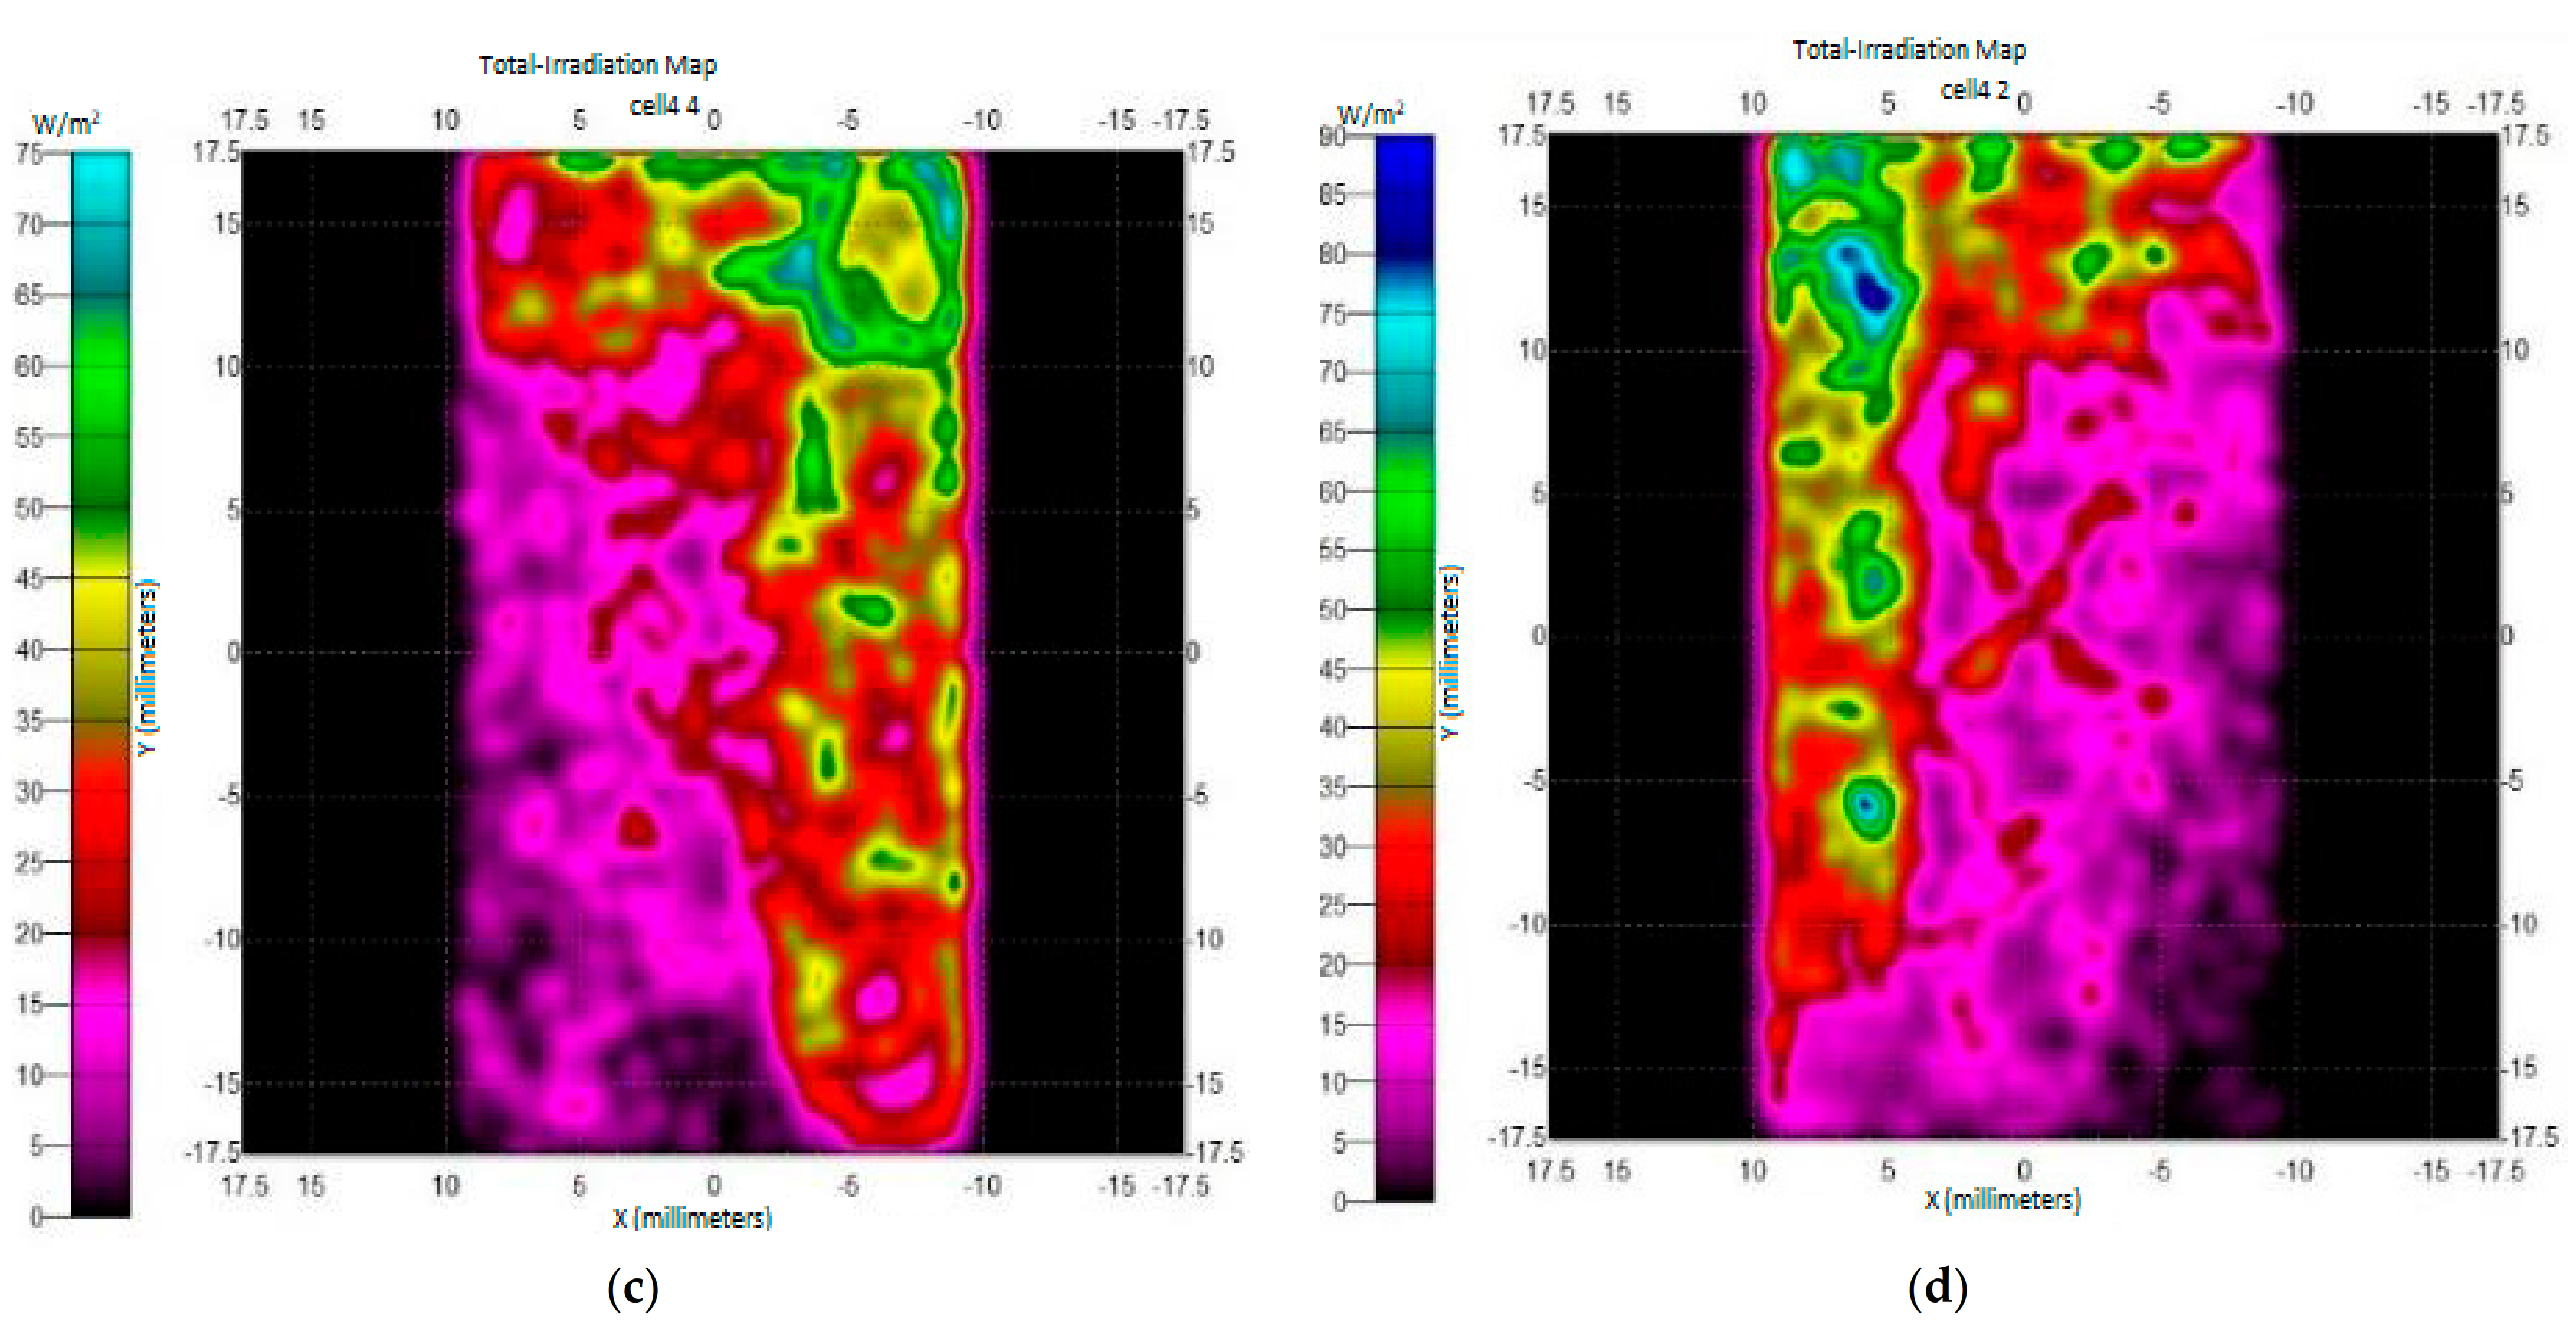
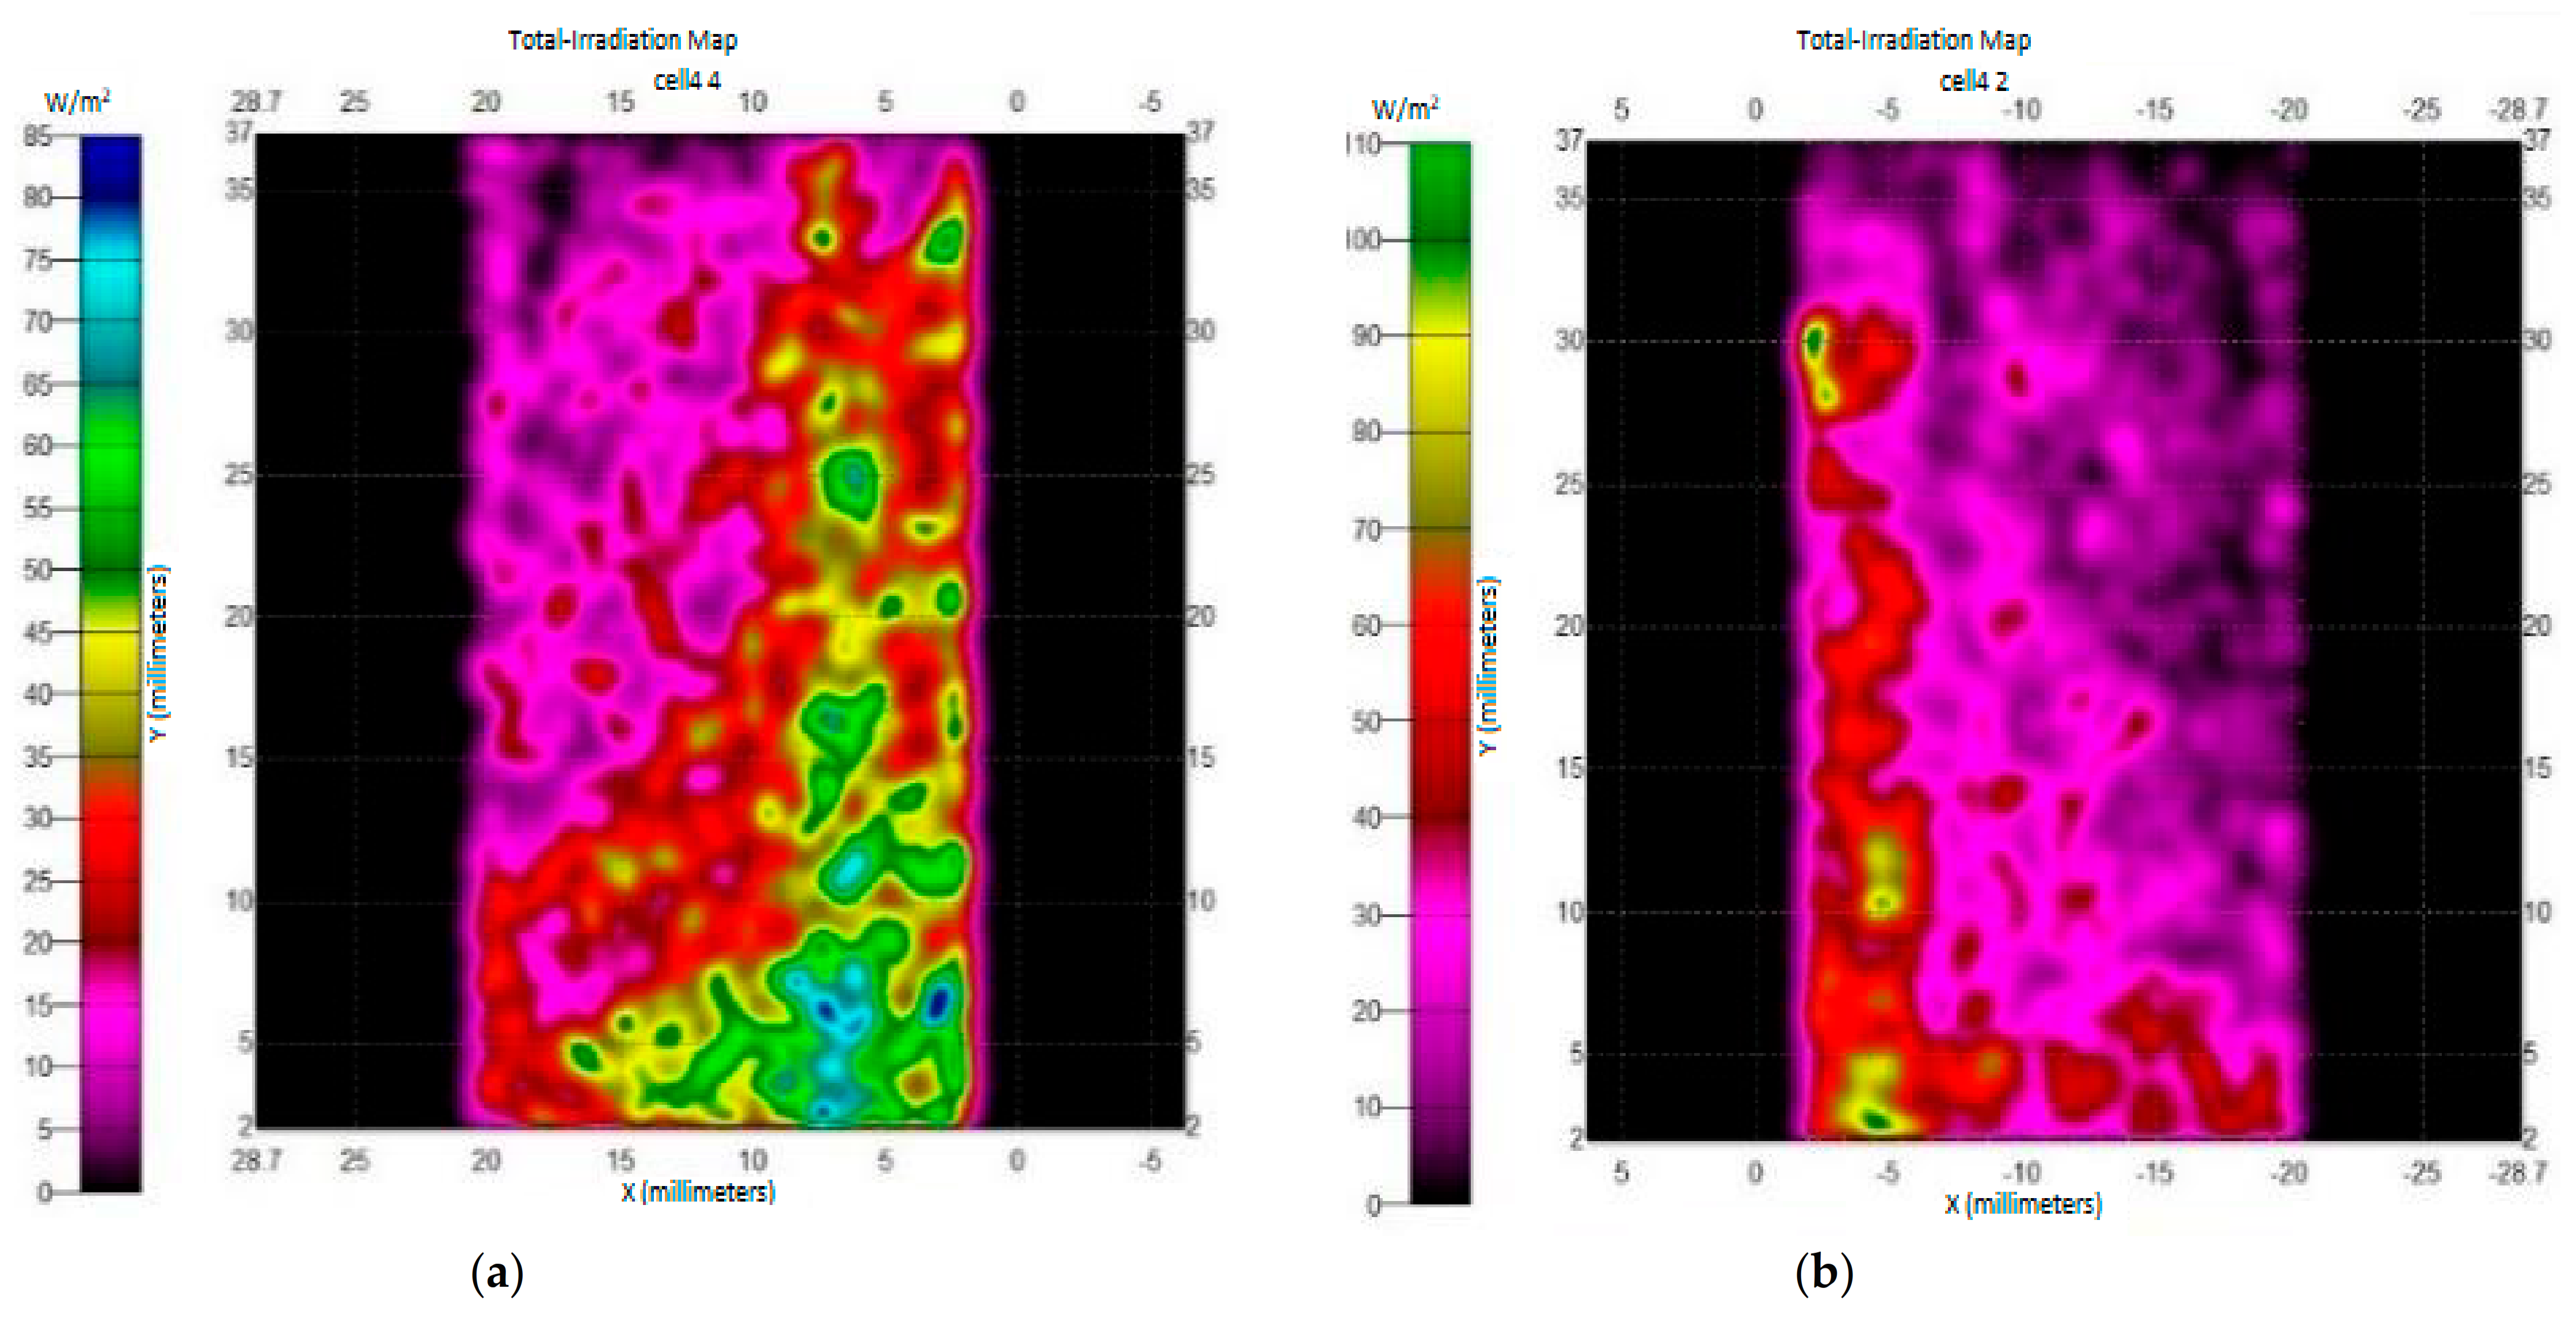
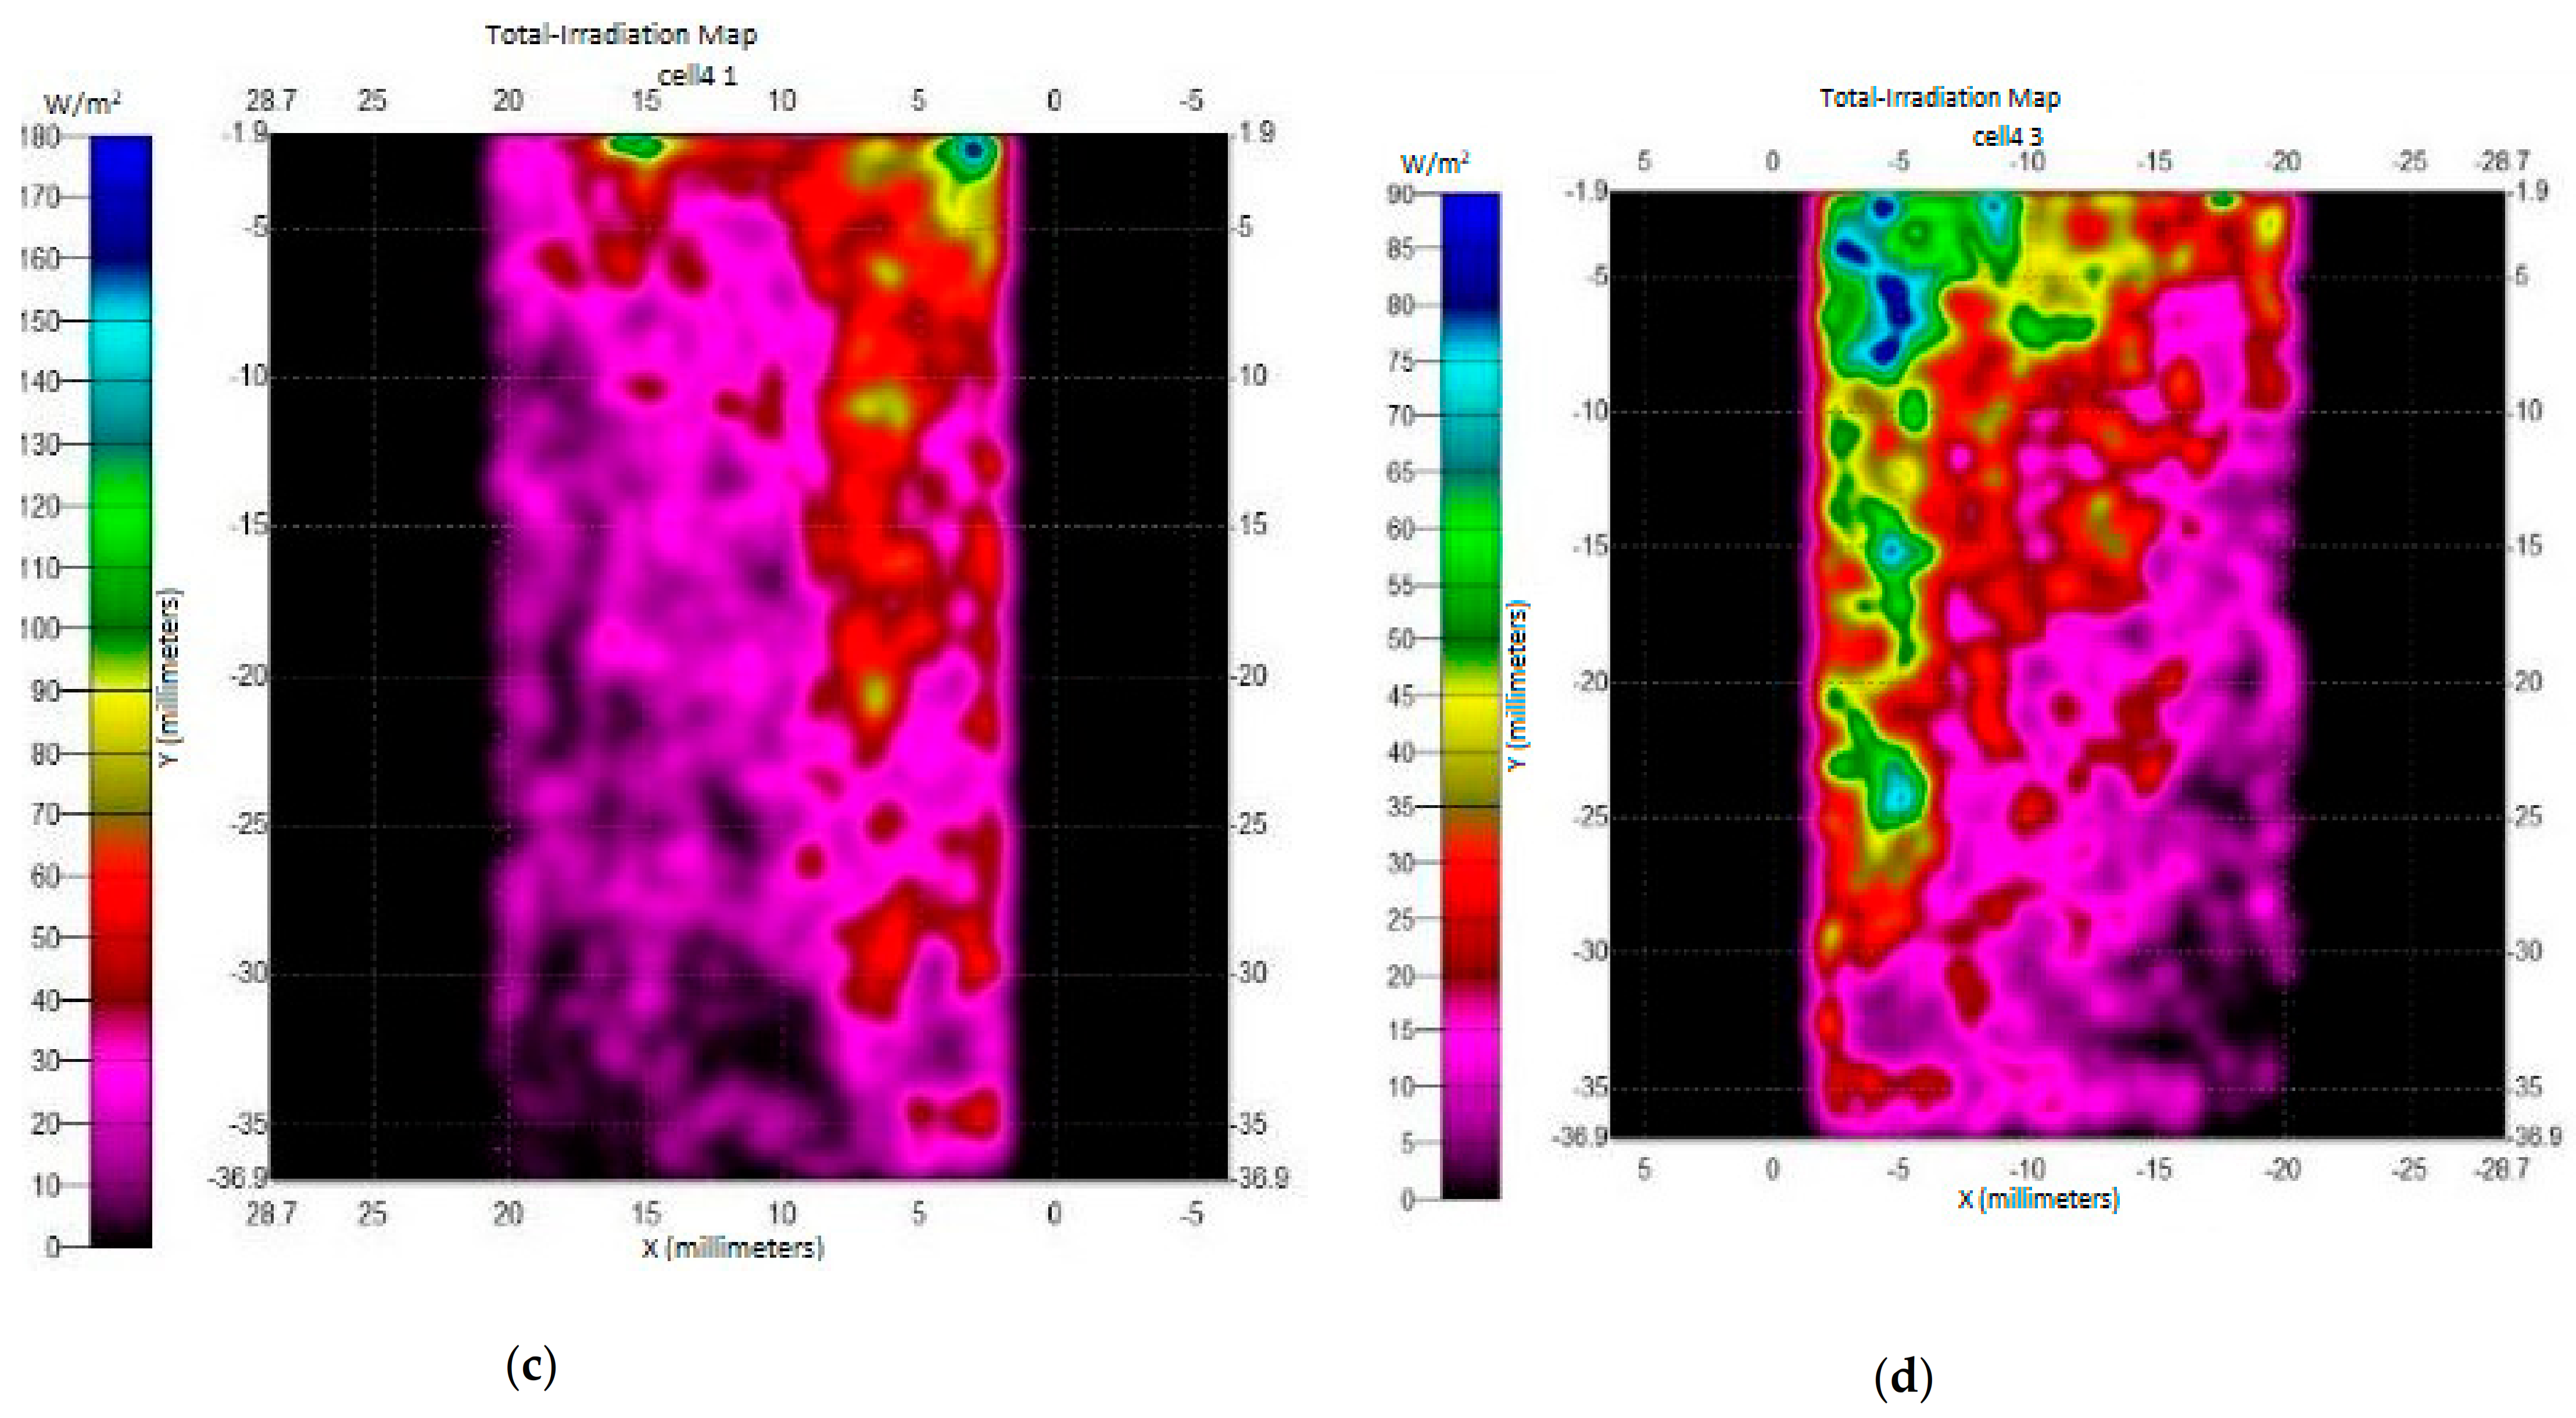
4.1. Optical Simulation Analysis of the Internal Structure of the Solar Cell Module

With the use of functional light tracing to observe the penetration and reflection of light in the glass, it was found that the high-energy red light in 2 mm cell spacing of the transparent glass could not be reflected, but directly penetrated the glass, which had the least reflected light. Figure 8 shows that the ray tracing of reflected light in 5 mm was more extreme than 2 mm cell spacing, while 8 mm is better than 5 mm cell spacing. Although the cell spacing and light source increase, the high-energy red light does not increase significantly, but slows down the secondary light and increases the energy. Blue light indicates low energy. When the cell spacing exceeds 5 mm, the reflected energy slows down. However, the reflective area is increased after the cell spacing is enlarged. The light at the surface is refracted back to the solar cell at a limited angle. The illumination of the light source is 1000 W-m−2. Since the absorption range of the solar cell is 0.2–2 μm, the simulation was carried out at a wavelength of 0.55 μm, and the average acceptance ratio of the solar cell was calculated by irradiance analysis.
The microstructure is shown in Figure 9 with a 2 mm cell spacing having a value of 0.00515% average absorption of irradiation, Figure 10 with a cell spacing of 5 mm having 0.01483% average absorption of irradiation, and Figure 11 with a cell spacing of 8 mm having 0.01667% average absorption of irradiation from the reflected light cause diffuse reflectance on the rear back of the module. These results show an increase of 0.689% average irradiation absorption on 2 mm to 5 mm while 5 mm to 8 mm cell spacing shows an increase in average irradiation absorption by 0.124% on the solar PV power output. Therefore, the increase in light reflection on 2 mm to 5 mm cell spacing was greater than the cell spacing of 5 mm to 8 mm. The results only show that the power generation increases, but the possibility of solar cells receiving light will gradually slow down after it exceeds 5 mm cell spacing.

4.2. Influence of Indoor Temperature, Irradiation Amount, and Solar Photovoltaic (PV) Module Cell Spacing in Power Generation

In the field of solar photovoltaic applications, there are almost no single-use examples of solar cells, and most of them are used in series and pack solar cells with the same characteristics. Ideally, the solar cell in the module will exhibit the same characteristics of current and voltage that have the same curve as the current and voltage characteristics of the individual cell, but the scale of the corresponding coordinate axis of the curve will be different.
In actual situations, the cells in the module have slightly different characteristics from each other. Coupled with the irradiance unevenness and the contact resistance of the cell connection, the output characteristics of the module are not completely the coordinate change of the solar cell characteristic curve.
Since the photoelectric conversion of the solar cell module has a spectral response phenomenon, its I-V characteristic is related to the module temperature and irradiation intensity of sunshine, and the description of the IV characteristics of the solar cell module requires spectral irradiance distribution and module temperature. The solar simulator parameters were air mass (AM1.5), module temperature of 25 °C, and irradiance of 1000 W-m−2 to conduct a standard experiment.
The measurement results shown in Table 2 were the comparison of temperature and power generation on half-frame and full-frame modules. The cell spacing of 2 mm, 5 mm, and 8 mm in the upper and lower half-frame show a decreasing power while temperature increases. The cell spacing from 2 mm to 5 mm and 5 mm to 8 mm shows an increase of 0.95% and 0.35% of power generation in the upper and lower half-frame under 25 ℃, respectively, while full-frame with 2 mm to 5 mm and 5 mm to 8 mm cell spacing has an increase of 0.98% and 0.14%, respectively.

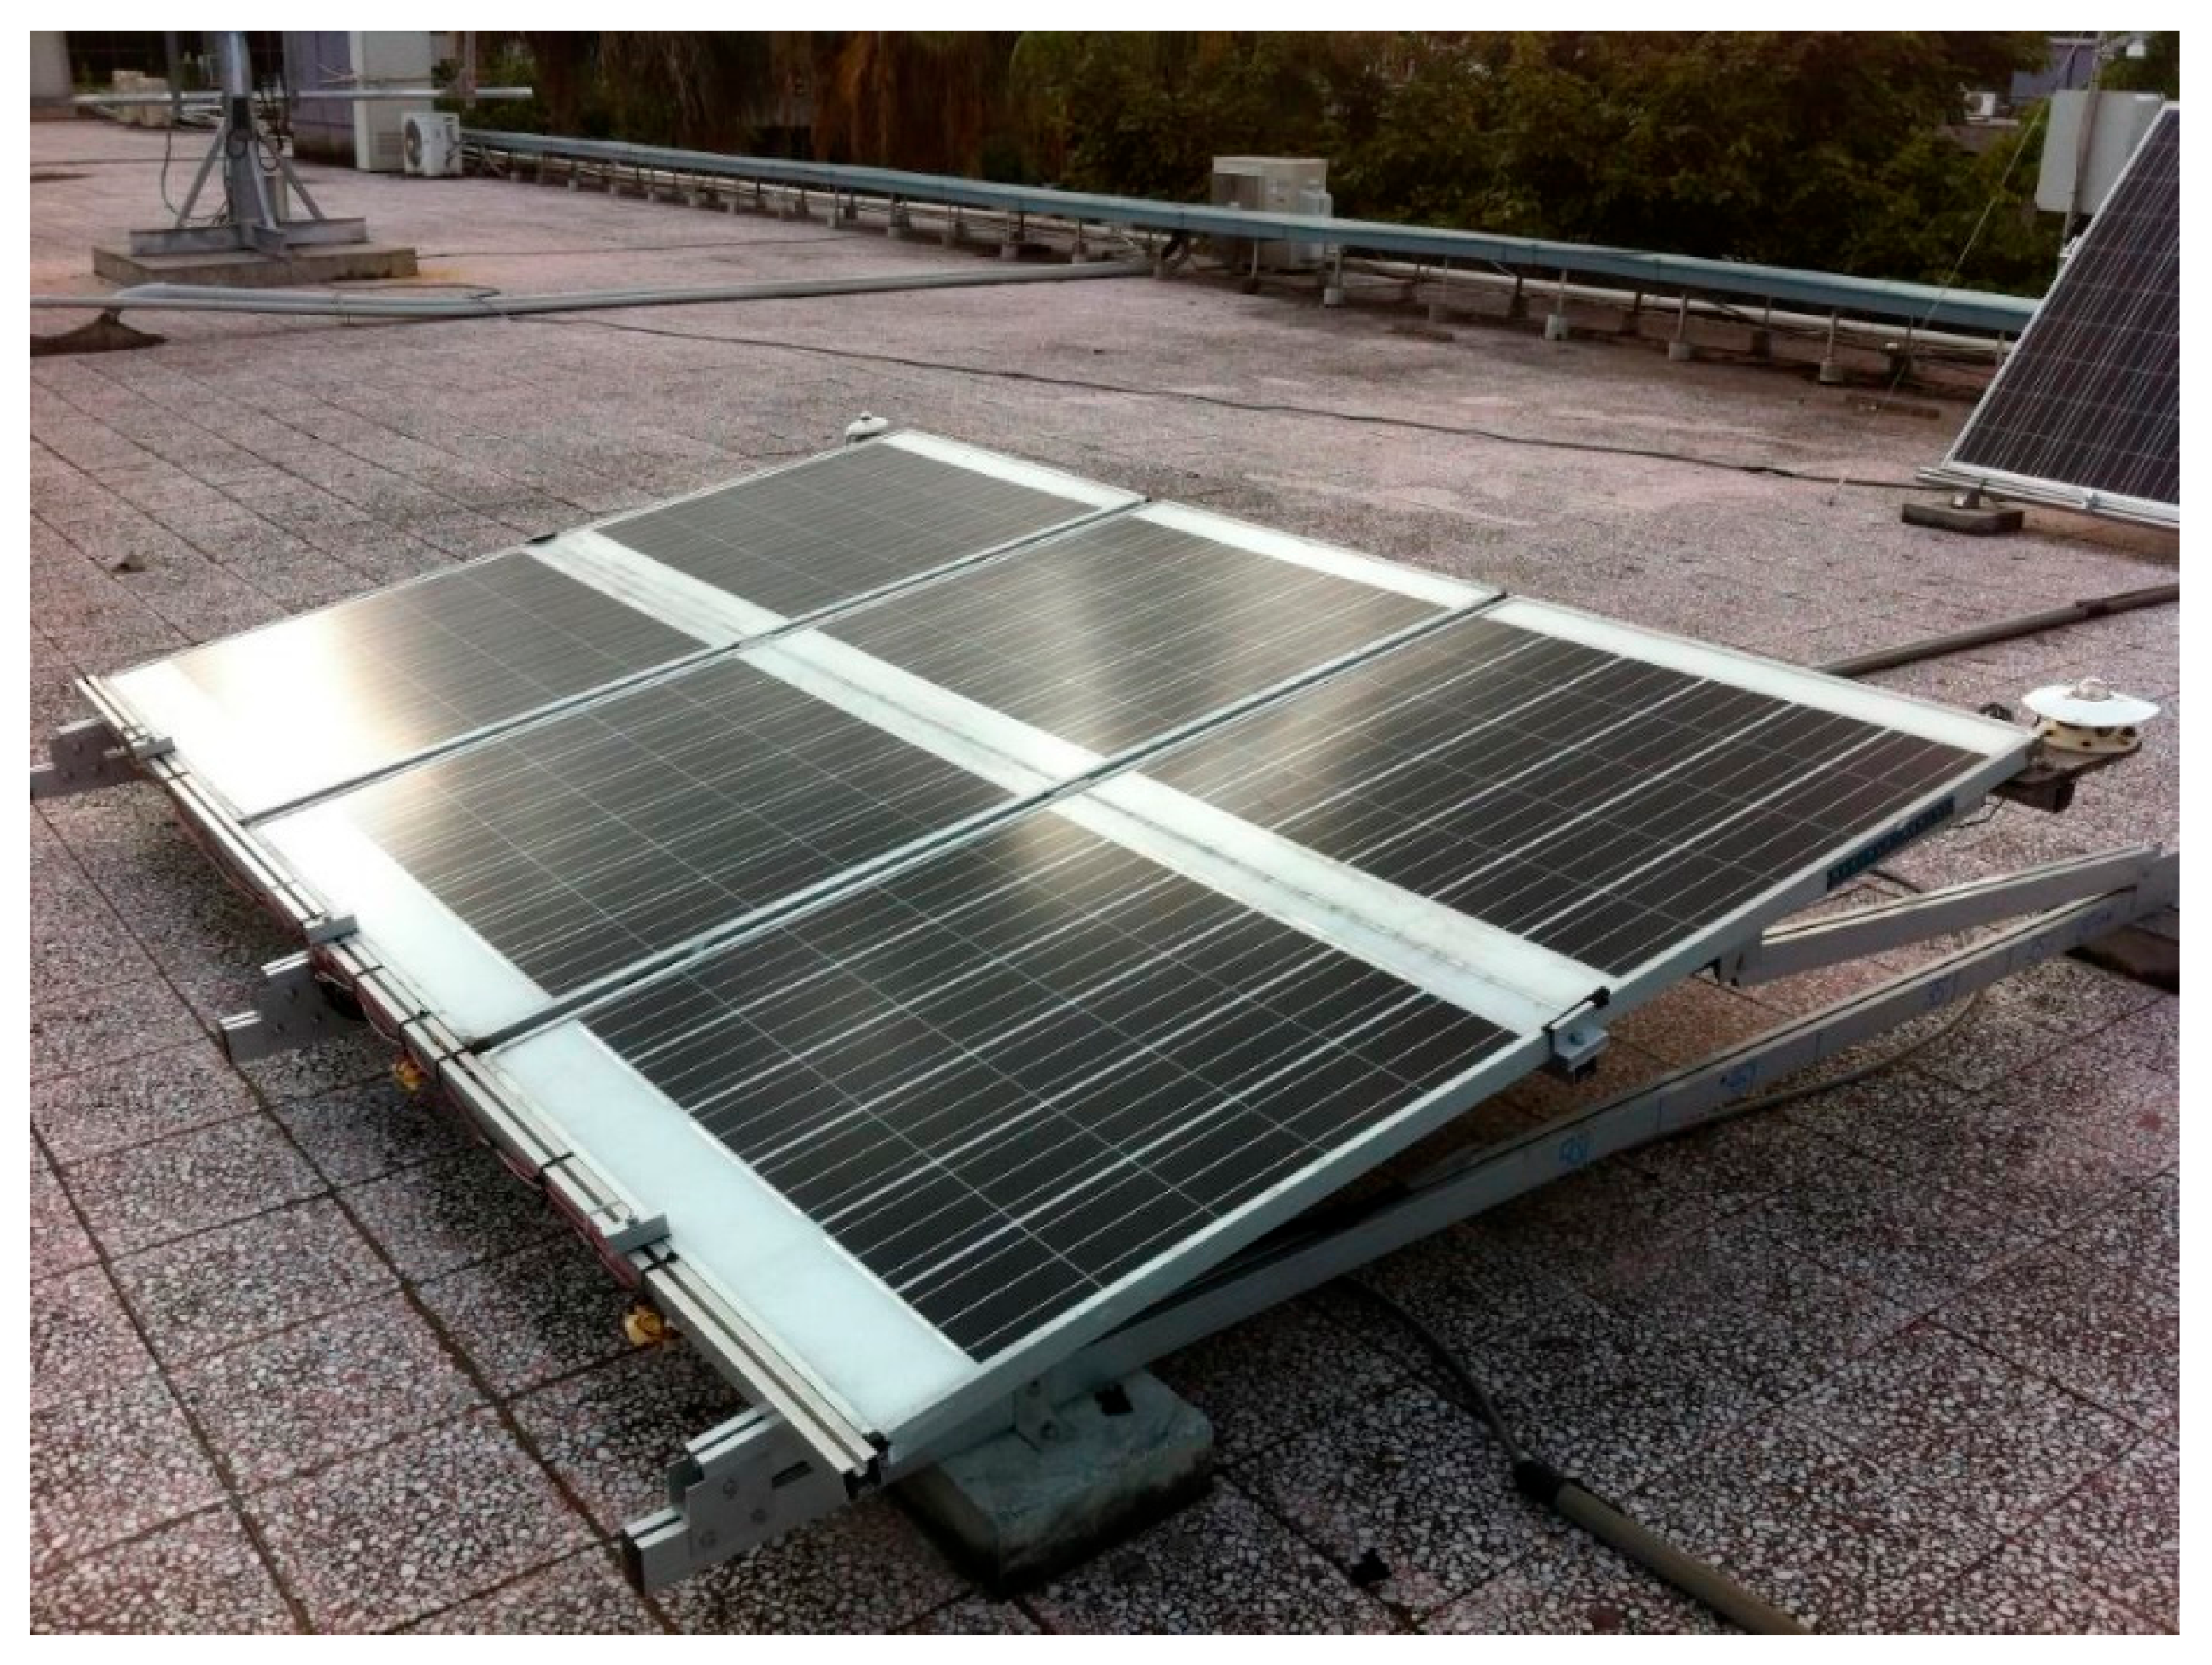
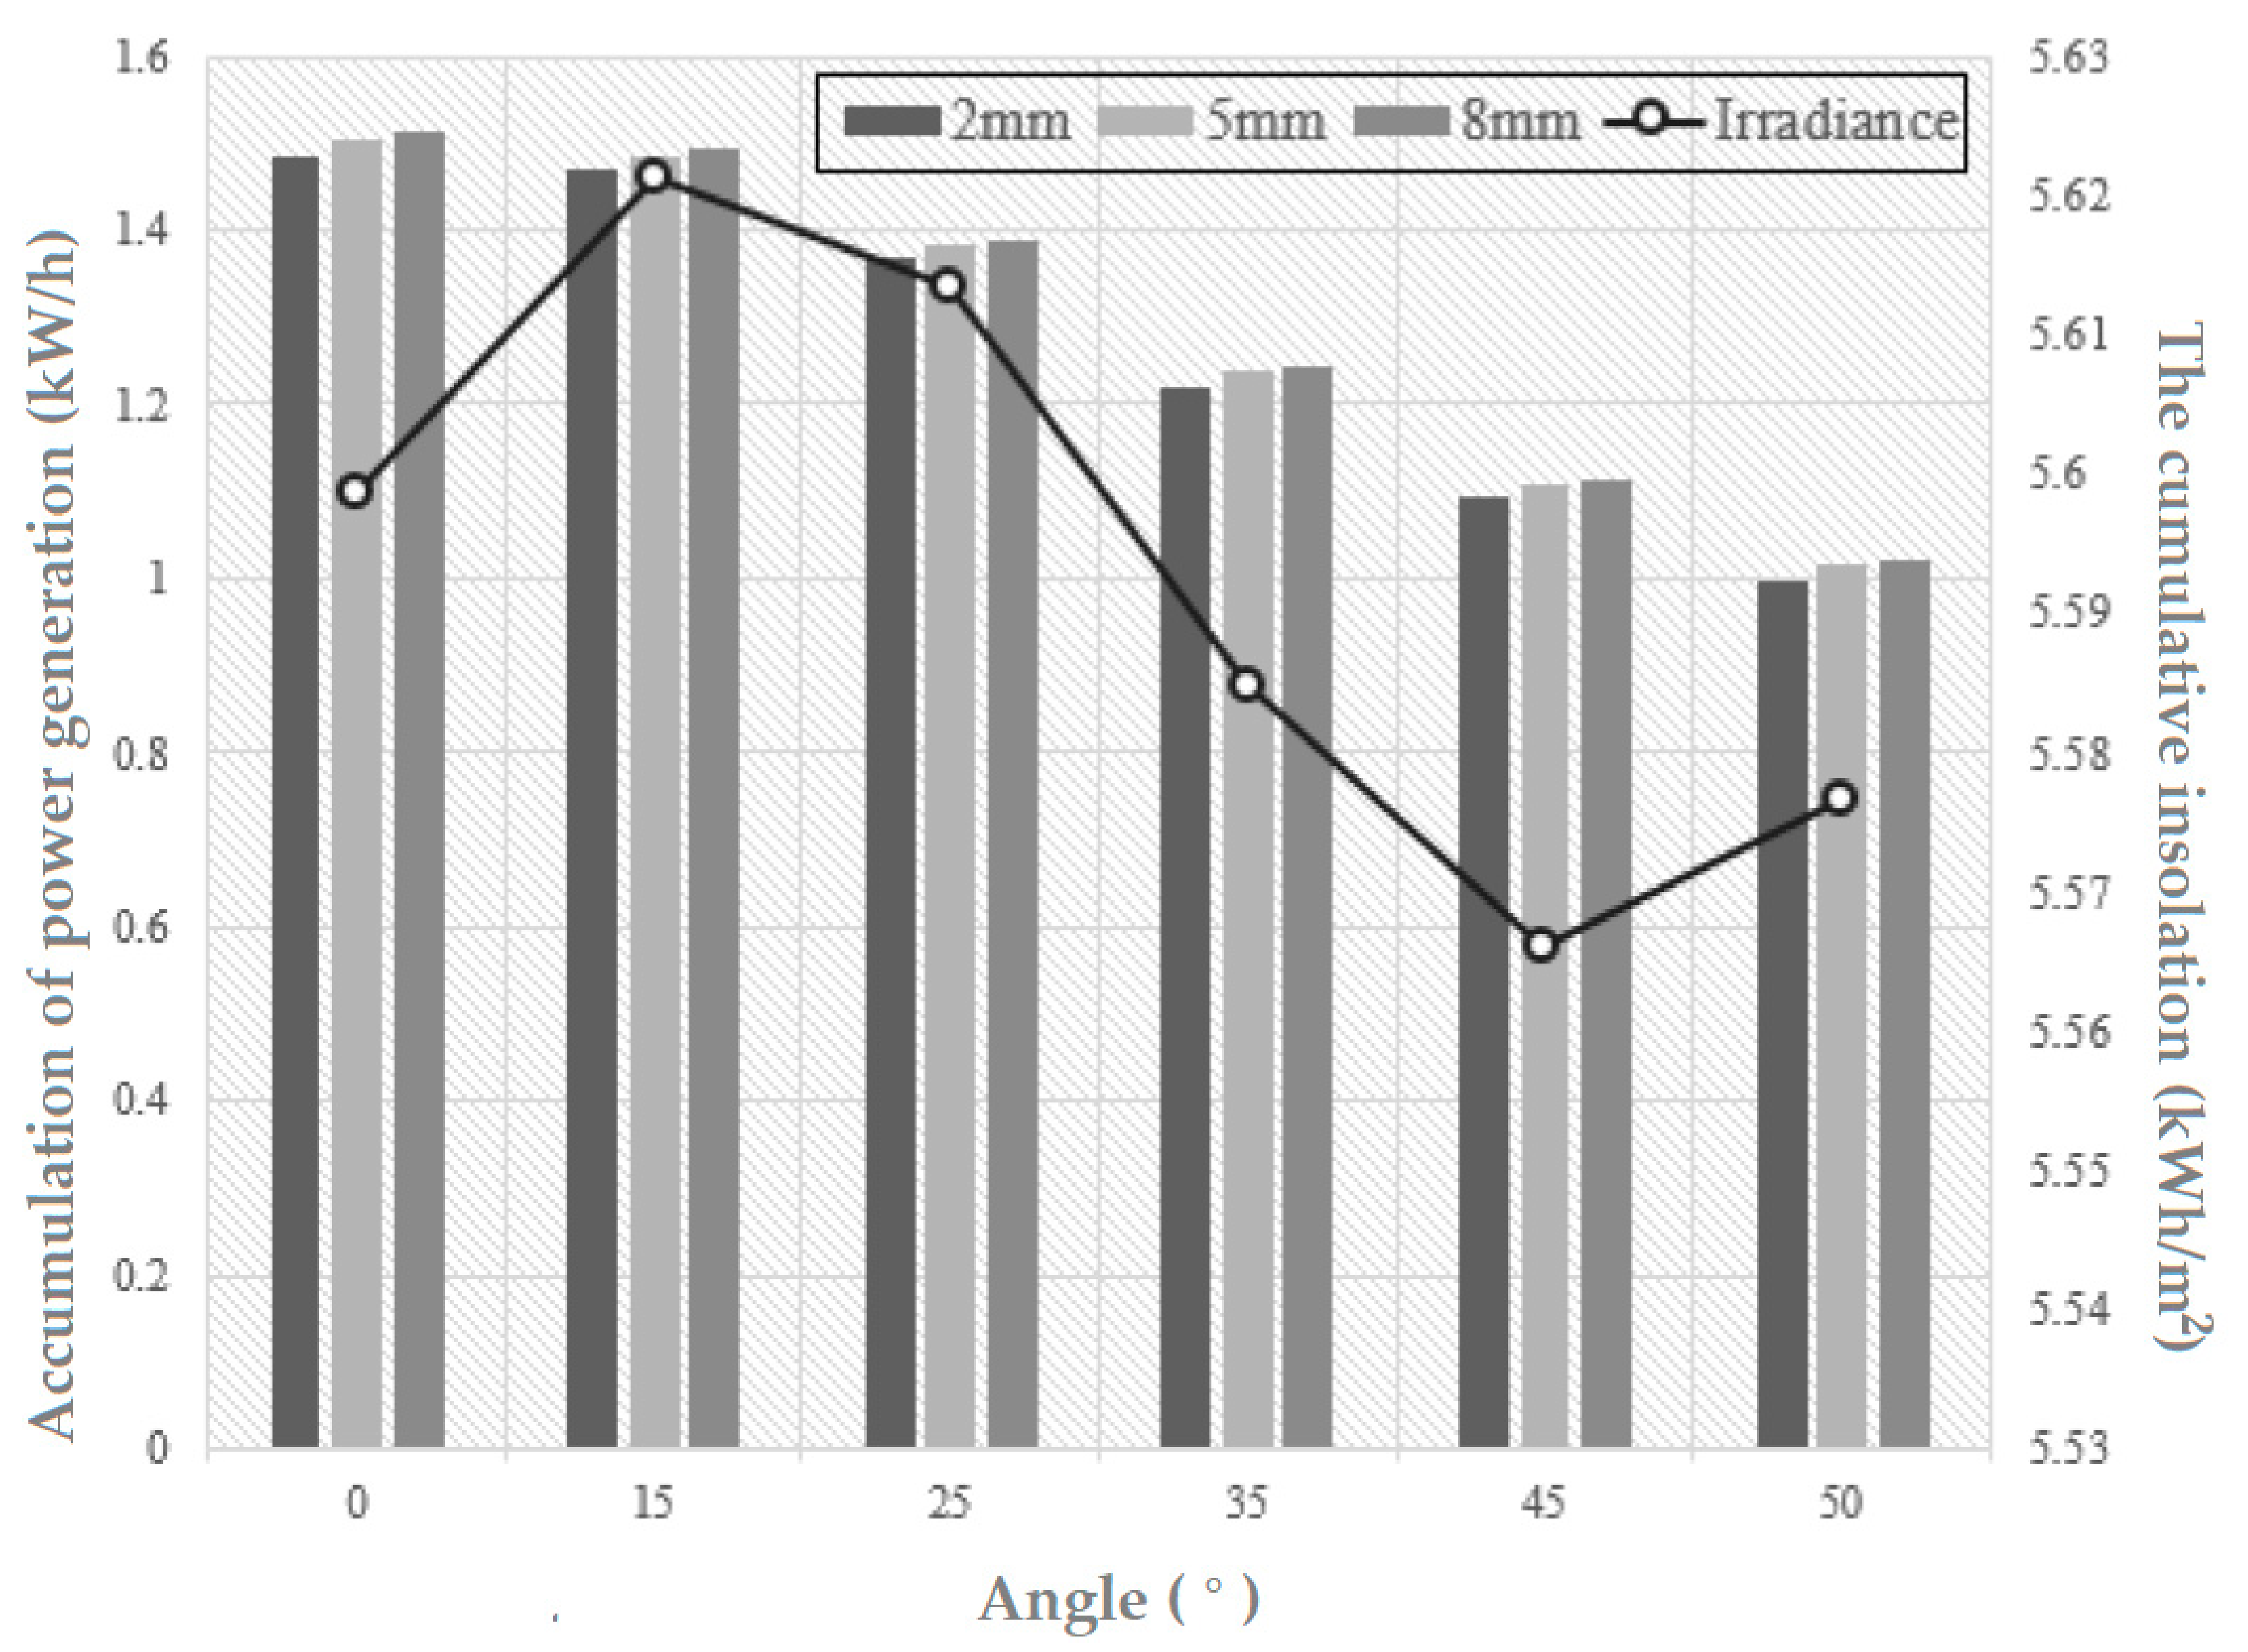
4.3. Effect of Outdoor Irradiation and Solar PV Module Cell Spacing and Tilt Angle on Power Generation

The actual solar PV module shown in Figure 7 were the half and full-frame designs, and this is the basis of the experiment conducted in the study. There are two major factors in evaluating the use of solar cell modules and the performance of the system. They are the changes in the amount of solar radiation and temperature. In terms of temperature, the solar cell module package, the type of solar cell, and the solar cell module must be considered. The local climatic conditions, thermal properties of the materials after installation, and the irradiation amount were uncontrollable in the same environment. The efficiency of the solar cell depends on the operating temperature. The temperature of the solar cell during normal operation is 58 °C and its performance in power generation is reduced. The amount of irradiation is fixed for one day but will change with the influence of clouds or the atmosphere. The outdoor experiment time was from 15–25 June 2020, which is just the summer solstice period. Facing the south at 0° is ideal. At the beginning of the experiment, the temperature coefficient monitoring under IEC 61215, section 10.4, and section 10.5 of the NOCT was simulated. The test determined angle changes to 50°, 35°, 25°, 15°, and 0°.
The measurement tolerance was ±5° of the surfaces of the solar module. The sunshine intensity needs to be stable, and the wind speed was lower than 2 m-s−1. Under stable sunlight intensity, the module rises in temperature as soon as it is illuminated by the sun and is electrically measured at the temperature point of interest. In the test environment, the solar cell module uses the board to block the sunlight, and the module and the environment reach a temperature balance state. The whole day of data monitoring is downloaded from the cloud to a personal computer for data sorting and experiment. After the operation and data acquisition, the analysis found that the trend in Figure 12 shows that as the angle increases from 0° to 50° as the accumulating power decreases at three different cell spacings. The average power generation in three different cell spacings at 0° reach 1.513 kW-hr−1, 15° produces 1.485 kW-hr−1, 25° produces 1.367 kW-hr−1, 35° produces 1.232 kW-hr−1, 45° produces 1.14 kW-hr−1, and 50° produces 1.18 kW-hr−1 with accumulative irradiation of 5.56 kWh-m−2 to 5.63 kWh-m−2. This only shows that the larger the tilt angle, the smaller the power generation.

5. Conclusions

This study presents the analysis and effect of three different solar cell spacing designs in irradiation absorption from the diffuse reflectance on the backsheet as well as the power gain of the solar PV module. Optical simulation and indoor and outdoor tests showed that the diffuse reflectance of light from 2 mm to 5 mm cell spacing showed a greater increase in output power compared to 5 mm to 8 mm solar cell spacing in the solar PV module. It also showed a gradual increase in power generation when the solar cell spacing was greater than 5 mm. However, the output power of 8 mm cell spacing was greater than 2 mm and 5 mm cell spacing. The light absorption of the solar cell from the diffuse reflectance showed enhanced power output. Even though the study was successful, various limitations remain. As the solar PV module is dependent on solar irradiation, weather conditions were not included in the study which may affect its performance. For future evaluation, the experiment can be conducted for a longer period to consider the effects of weather conditions on power generation. Since renewable energy is the future of clean energy that will lessen the negative effect of climate change [38], the development of solar PV module design can contribute to a sustainable energy solution. Future research can employ methodical engineering and construction methods to optimize the solar PV module design and obtain the full potential of this study.

Author Contributions

Conceptualization, H.A., J.R.L.M., M.L. and Y.-C.L.; Methodology, H.A. J.R.L.M. and Y.-C.L.; Software, data curation, formal analysis, and investigation, J.R.L.M. and Y.-C.L.; Project administration, J.R.L.M. and Y.-C.L.; writing-original draft, J.R.L.M.; writing-review and editing, J.R.L.M., H.A. and M.L. All authors have read and agreed to the published version of the manuscript.

Funding

National Taipei University of Business, Project No.: 109051313453 “The research on improving the production efficiency of photovoltaic modules”.

Institutional Review Board Statement

Not applicable.

Informed Consent Statement

Not applicable.

Data Availability Statement

Not applicable.

Acknowledgments

The authors appreciate the support from the National Kaohsiung University of Science and Technology, Ministry of Education of Taiwan, and National Taipei University of Business.

Conflicts of Interest

The authors declare no conflict of interest.

References

  1. Chen, Y.; Altermatt, P.P.; Chen, D.; Zhang, X.; Xu, G.; Yang, Y.; Wang, Y.; Feng, Z.; Shen, H.; Verlinden, P.J. From Laboratory to Production: Learning Models of Efficiency and Manufacturing Cost of Industrial Crystalline Silicon and Thin-Film Photovoltaic Technologies. IEEE J. Photovolt. 2018, 8, 1531–1538. [Google Scholar] [CrossRef]
  2. Wilson, G.M.; Al-Jassim, M.; Metzger, W.K.; Glunz, S.W.; Verlinden, P.; Xiong, G.; Mansfield, L.M.; Stanbery, B.J.; Zhu, K.; Yan, Y.; et al. The 2020 photovoltaic technologies roadmap. J. Phys. D Appl. Phys. 2020, 53, 493001. [Google Scholar] [CrossRef]
  3. International Energy Agency. Photovoltaic Power Systems Program: Annual Report 2019. Available online: https://iea-pvps.org/wp-content/uploads/2020/05/IEA-PVPS-AR-2019-1.pdf (accessed on 23 May 2020).
  4. Packing Density. Available online: http://pveducation.org/pvcdrom/modules/packing-density (accessed on 20 February 2020).
  5. Chen, Z.; Jia, H.; Zhang, Y.; Fan, L.; Zhu, H.; Ge, H.; Cao, B.; Wang, S. Research on Performance Improvement of Photovoltaic Cells and Modules Based on Black Silicon. Crystals 2020, 10, 753. [Google Scholar] [CrossRef]
  6. Mark, J.G.; Volk, C.H. The Zero Depth Concentrator Phenomenon; Jet Propulsion Laboratory: Pasadena, CA, USA, 1979; pp. 1–35. [Google Scholar]
  7. Saga, T. Advances in crystalline silicon solar cell technology for industrial mass production. NPG Asia Mater. 2010, 2, 96–102. [Google Scholar] [CrossRef] [Green Version]
  8. Jeong, J.; Park, N.; Hong, W.; Han, C. Analysis for the degradation mechanism of photovoltaic ribbon wire under thermal cycling. In Proceedings of the 2011 37th IEEE Photovoltaic Specialists Conference, Seattle, WA, USA, 19–24 June 2011; pp. 003159–003161. [Google Scholar] [CrossRef]
  9. Gress, P.J.; Widenborg, P.I.; Varlamov, S.; Aberle, A.G. Wire bonding as a cell interconnection technique for polycrystalline silicon thin-film solar cells on glass: Wire bonding as a cell interconnection technique. Prog. Photovolt. Res. Appl. 2010, 18, 221–228. [Google Scholar] [CrossRef]
  10. Klengel, R.; Petzold, M.; Schade, D.; Sykes, B. Improved Testing of Soldered Busbar Interconnects on Silicon Solar Cells. In Proceedings of the 18th European Microelectronics & Packaging Conference, Brighton, UK, 12–15 September 2011; p. 5. [Google Scholar]
  11. Battaglia, C.; Hsu, C.-M.; Söderström, K.; Escarré, J.; Haug, F.-J.; Charrière, M.; Boccard, M.; Despeisse, M.; Alexander, D.T.L.; Cantoni, M.; et al. Light Trapping in Solar Cells: Can Periodic Beat Random? ACS Nano 2012, 6, 2790–2797. [Google Scholar] [CrossRef] [PubMed] [Green Version]
  12. Zhu, J.; Hsu, C.-M.; Yu, Z.; Fan, S.; Cui, Y. Nanodome Solar Cells with Efficient Light Management and Self-Cleaning. Nano Lett. 2010, 10, 1979–1984. [Google Scholar] [CrossRef] [PubMed]
  13. Kim, J.; Hong, A.J.; Nah, J.-W.; Shin, B.; Ross, F.M.; Sadana, D.K. Three-Dimensional a-Si:H Solar Cells on Glass Nanocone Arrays Patterned by Self-Assembled Sn Nanospheres. ACS Nano 2011, 6, 265–271. [Google Scholar] [CrossRef] [PubMed]
  14. Kuang, Y.; Van Der Werf, K.H.M.; Houweling, Z.S.; Schropp, R.E.I. Nanorod solar cell with an ultrathin a-Si:H absorber layer. Appl. Phys. Lett. 2011, 98, 113111. [Google Scholar] [CrossRef] [Green Version]
  15. Garnett, E.; Yang, P. Light Trapping in Silicon Nanowire Solar Cells. Nano Lett. 2010, 10, 1082–1087. [Google Scholar] [CrossRef] [PubMed]
  16. Chang, H.-C.; Dai, Y.-A.; Wang, H.-H.; Lai, K.-Y.; Lin, C.-A.; He, J.-H. Nanowire arrays with controlled structure profiles for maximizing optical collection efficiency. Energy Environ. Sci. 2011, 4, 2863–2869. [Google Scholar] [CrossRef]
  17. McIntosh, K.R.; Swanson, R.M.; Cotter, J.E. A simple ray tracer to compute the optical concentration of photovoltaic modules. Prog. Photovolt. Res. Appl. 2006, 14, 167–177. [Google Scholar] [CrossRef]
  18. Grunow, P.; Krauter, S. Modelling of the Encapsulation Factors for Photovoltaic Modules. In Proceedings of the 2006 IEEE 4th World Conference on Photovoltaic Energy Conference, Waikoloa, HI, USA, 7–12 May 2006; pp. 2152–2155. [Google Scholar] [CrossRef]
  19. Wenham, S.; Campbell, P.; Bowden, S.; Green, M. Improved optical design for photovoltaic cells and modules. In Proceedings of the Conference Record of the Twenty-Second IEEE Photovoltaic Specialists Conference—1991, Las Vegas, NV, USA, 7–11 October 1991; pp. 105–110. [Google Scholar] [CrossRef]
  20. Amalathas, A.P.; Alkaisi, M.M. Nanostructures for Light Trapping in Thin Film Solar Cells. Micromachines 2019, 10, 619. [Google Scholar] [CrossRef] [PubMed] [Green Version]
  21. Feng, N.-N.; Michel, J.; Zeng, L.; Liu, J.; Hong, C.-Y.; Kimerling, L.C.; Duan, X. Design of Highly Efficient Light-Trapping Structures for Thin-Film Crystalline Silicon Solar Cells. IEEE Trans. Electron Devices 2007, 54, 1926–1933. [Google Scholar] [CrossRef]
  22. Witteck, R.; Schulte-Huxel, H.; Holst, H.; Hinken, D.; Vogt, M.; Blankemeyer, S.; Köntges, M.; Bothe, K.; Brendel, R. Optimizing the Solar Cell Front Side Metallization and the Cell Interconnection for High Module Power Output. Energy Procedia 2016, 92, 531–539. [Google Scholar] [CrossRef] [Green Version]
  23. Fischer, R.E.; Tadic-Galeb, B.; Yoder, P.R. Optical System Design, 2nd ed.; Thoroughly Updated; McGraw-Hill: New York, NY, USA, 2008. [Google Scholar]
  24. Lahiri, A. Foundations of Ray Optics. In Basic Optics; Elsevier BV: Amsterdam, The Netherlands, 2016; pp. 141–202. [Google Scholar]
  25. Sweeney, S.J.; Mukherjee, J. Optoelectronic Devices and Materials. In Springer Handbook of Electronic and Photonic Materials; Kasap, S., Capper, P., Eds.; Springer International Publishing: Cham, Switzerland, 2017; pp. 1–1. [Google Scholar]
  26. Choudhury, A.K.R. Characteristics of light sources. In Principles of Colour and Appearance Measurement; Elsevier: Amsterdam, The Netherlands, 2014; pp. 1–52. [Google Scholar]
  27. Ryer, A. Light Measurement Handbook; International Light: Newburyport, MA, USA, 1997; pp. 13–16. [Google Scholar]
  28. Vain, A.; Kaasalaine, S. Correcting Airborne Laser Scanning Intensity Data. In Laser Scanning, Theory and Applications; Wang, C.-C., Ed.; IntechOpen: London, UK, 2011. [Google Scholar]
  29. Schejbal, V.; Fiser, O.; Zavodny, V. Study of Refraction Effects for Propagation over Terrain. In Waveguide Technologies in Photonics and Microwave Engineering; IntechOpen: London, UK, 2019. [Google Scholar]
  30. Shrivastava, A. Plastic Properties and Testing. In Introduction to Plastics Engineering; Elsevier BV: Amsterdam, The Netherlands, 2018; pp. 49–110. [Google Scholar]
  31. Gong, J.; Krishnan, S. Mathematical Modeling of Dye-Sensitized Solar Cells. In Dye-Sensitized Solar Cells; Elsevier: Amsterdam, The Netherlands, 2019; pp. 51–81. [Google Scholar]
  32. Duran, E.; Andújar, J.M.; Enrique, J.M.; Pérez-Oria, J.M. Determination of PV GeneratorI-V/P-VCharacteristic Curves Using a DC-DC Converter Controlled by a Virtual Instrument. Int. J. Photoenergy 2012, 2012, 1–13. [Google Scholar] [CrossRef] [Green Version]
  33. Lindholm, F.; Fossum, J.; Burgess, E. Application of the superposition principle to solar-cell analysis. IEEE Trans. Electron Devices 1979, 26, 165–171. [Google Scholar] [CrossRef]
  34. Yu, J.; Fan, J.; Lv, K. Anatase TiO2 nanosheets with exposed (001) facets: Improved photoelectric conversion efficiency in dye-sensitized solar cells. Nanoscale 2010, 2, 2144–2149. [Google Scholar] [CrossRef] [PubMed]
  35. Cubas, J.; Pindado, S.; De Manuel, C. Explicit Expressions for Solar Panel Equivalent Circuit Parameters Based on Analytical Formulation and the Lambert W-Function. Energies 2014, 7, 4098–4115. [Google Scholar] [CrossRef] [Green Version]
  36. Tsai, H.-L.; Tu, C.-S.; Su, Y.-J. Development of Generalized Photovoltaic Model Using MATLAB/SIMULINK. In Proceedings of the world congress on Engineering and computer science, San Francisco, CA, USA, 22–24 October 2008; p. 7. [Google Scholar]
  37. Salmi, T.; Bouzguenda, M.; Gastli, A.; Masmoudi, A. MATLAB/Simulink Based Modelling of Solar Photovoltaic Cell; International Journal of Renewable Energy Research: Ankara, Turkey, 2012; p. 7. [Google Scholar]
  38. Wang, C.-N.; Dang, T.-T.; Tibo, H.; Duong, D.-H. Assessing Renewable Energy Production Capabilities Using DEA Window and Fuzzy TOPSIS Model. Symmetry 2021, 13, 334. [Google Scholar] [CrossRef]
Figure 1. Research paradigm.
Sustainability 13 06364 g001
Figure 2. Optical simulation flow chart.
Sustainability 13 06364 g002
Figure 3. Multicrystalline solar cell size: (a) frontside; (b) backside.
Sustainability 13 06364 g003
Figure 4. Full frame design solar photovoltaic (PV) module: (a) frontside; (b) backside.
Sustainability 13 06364 g004
Figure 5. Half-frame design solar PV module.
Sustainability 13 06364 g005
Figure 6. Solar PV cell design at different cell spacing: (a) 2 mm cell spacing, (b) 5 mm cell spacing, (c) 8 mm cell spacing.
Sustainability 13 06364 g006
Figure 7. Half and full-frame solar PV module.
Sustainability 13 06364 g007
Figure 8. Ray tracing at different cell spacing: (a) 2 mm cell spacing; (b) 5 mm cell spacing; (c) 8 mm cell spacing.
Sustainability 13 06364 g008
Figure 9. Total-irradiance map of solar cell microstructure with 2 mm cell spacing: (a) upper left, (b) upper right, (c) lower left, (d) lower right.
Sustainability 13 06364 g009aSustainability 13 06364 g009b
Figure 10. Total-irradiance map of solar cell microstructure with 5 mm cell spacing: (a) upper left, (b) upper right, (c) lower left, (d) lower right.
Sustainability 13 06364 g010aSustainability 13 06364 g010b
Figure 11. Total-irradiance map of solar cell microstructure with 8 mm cell spacing: (a) upper left, (b) upper right, (c) lower left, (d) lower right.
Sustainability 13 06364 g011aSustainability 13 06364 g011b
Figure 12. Comparison of accumulative power generation at various angles.
Sustainability 13 06364 g012
Table 1. Solar cell structure materials and parameters.
Structure MaterialThickness (mm)Refractive IndexPercent Transmittance (%)Heat Transfer Coefficient K Value (W-m−1-K−1)
Low iron glass3.175n/a91.71.09
Ethylene Vinyl Acetate0.461.49910.35
Tedlar0.335n/an/a0.35
Table 2. Comparison of temperature and power generation at 2 mm, 5 mm, and 8 mm.
Upper and Lower of the Half-Frame Design
Temperature (°C)2 mm (W)5 mm (W)8 mm (W)
25122.79123.97124.41
35115.6116.53117.02
45110.29111.33111.63
55105.24106.24106.54
65100.45101.45101.87
7595.48197.43597.916
Full-frame design
25250.837253.32253.68
Publisher’s Note: MDPI stays neutral with regard to jurisdictional claims in published maps and institutional affiliations.

