Article

Spatiotemporal Comparison of Drivers to CO2 Emissions in ASEAN: A Decomposition Study

by
Edwin Bernard F. Lisaba, Jr.
and
Neil Stephen A. Lopez
*
Mechanical Engineering Department, De La Salle University, Manila 0922, Philippines
*
Author to whom correspondence should be addressed.
Sustainability 2021, 13(11), 6183; https://doi.org/10.3390/su13116183
Submission received: 30 April 2021 / Revised: 24 May 2021 / Accepted: 28 May 2021 / Published: 31 May 2021
(This article belongs to the Special Issue Energy Development for Sustainability)

Abstract

:
The Southeast Asian region is one of the most vulnerable to climate change given its geographical location and economic situation. This study aims to conduct a combination of spatial and temporal analyses in order to understand differences between member nations in terms of driving factors to changing emissions. The logarithmic mean Divisia index (LMDI) method was used in order to estimate carbon dioxide emissions due to population, economic activity, economic structure, and energy intensity effects from the year 1990 to 2018. In conducting the study, spatial analysis showed that Singapore was the only country to effectively lessen carbon emissions, due to population and energy intensity, in comparison to the others. Additionally, temporal analysis showed that the ASEAN initially developed at the same rate, before countries such as Singapore, Malaysia, and Thailand, started becoming more economically active, as shown by their economic activity. Finally, results have shown that some countries, especially the Philippines and Indonesia, have undergone significant changes in economic structure, which significantly affected carbon emissions. The results also highlight the increasing per capita emissions as income levels rise. The paper concludes by presenting a summary of the findings and some policy recommendations.

1. Introduction

Recently, the world has been experiencing a rapid increase in temperature per year. More specifically, the National Oceanic and Atmospheric Administration (NOAA) released a Global Climate Report in the year 2020, stating that the combined temperature of both land and sea increased at an average of about 0.08 degrees Celsius (0.13 °F) per decade until 1880 [1]. However, starting 1881, the combined average temperature has been increasing by about 0.18 degrees Celsius (0.32 °F). This increase in temperature corresponds to climate change, which is a growing concern in more recent years. In the Fourth Assessment Report, published in 2007, the International Panel on Climate Change (IPCC) has related the increase in temperature to the rapid melting of polar ice caps and increase in the frequency of natural disasters [2]. This, in turn, leads to the global warming effect, which is accelerated by the discharge of greenhouse gases (GHG) such as methane (CH4), nitrous oxide (N2O), and carbon dioxide (CO2). In 2014, the IPCC published the Fifth Assessment Report, which determined that carbon dioxide was the most prominent driver for global warming [3]. Furthermore, the IPCC has warned that, if GHG emissions were not abated, sea levels would rise by about 18 to 59 cm, and the average temperature rise around the world would increase from 1.8 °C to 4 °C. Additionally, natural disasters would occur more frequently in later years.
Given the correlation between carbon dioxide emissions and global warming, it is therefore recommended to find solutions that involve mitigating the discharge of greenhouse gases into the atmosphere. The World Health Organization (WHO) states that global warming will have a significant impact on human and environmental health [4]. It is estimated that about 250,000 people will die between the years 2030 and 2050 due to climate change. Most alarming, however, is that the WHO predicts that areas with a weak infrastructure on health, which are especially found in developing countries, would be the least able to cope to climate change. This, therefore, highlights the necessity of finding alternative solutions in order to abate carbon dioxide emissions.
This therefore leads to the Southeast Asian countries, which are Cambodia, Myanmar, Lao PDR, Vietnam, Brunei Darussalam, Indonesia, Malaysia, Singapore, Thailand, and the Philippines. This collection of 10 countries accounts for the Association of Southeast Asian Nations (ASEAN), established in August 1967. The ASEAN is meant for member countries to collaboratively promote cultural development and accelerate economic growth within the region. Additionally, each member country is encouraged to actively support, and cooperate, in projects concerning culture, education, science, and economics [5].
According to Hill, the Southeast Asian region is exceptionally complex due to their diversity, both culturally and economically [6]. Countries like Singapore and Indonesia have exceptional economies compared to the poverty in Myanmar and Cambodia [7,8]. Despite massive economic and technological diversity, the aforementioned countries are still encouraged to support one another, as outlined in the Treaty of Amity and Cooperation in Southeast Asia (TAC). The TAC states that, although unity and support between member countries are encouraged, there still must be mutual respect for their individual territories, independence, and national identities [9].
As mentioned earlier, global warming correlates to the increase in frequency and intensity of natural disasters, such as typhoons, droughts, and floods. It must therefore be noted that the Southeast Asian region is located to the west of the Pacific Ocean, where about one-third of the world’s annual tropical cyclones form [10]. Given the fact that a majority of the member countries are archipelagic, the effects of climate change will be more evident and devastating, should precautionary measures not be implemented sooner. Furthermore, the Southeast Asian region has areas of extreme poverty, and a majority of the countries heavily rely on agriculture. Additionally, the region is dependent on forestry and natural resources.
The effects of climate change are already apparent and have already devastated some parts of the region. In terms of temperature, the Asian Development Bank stated that in the ASEAN, the average temperature between the years 1951 and 2000 increased by about 0.1 and 0.3 °C [11]. Moreover, it was stated that rainfall lessened from 1960 to 2000, and sea levels have risen by about one to three millimeters. Given this, Nunti et al. further stated that climate change has adverse effects on areas that rely on agriculture by using the copula-based stochastic frontier approach [12]. These unfavorable conditions therefore increase the risk imposed on numerous rural and impoverished areas in terms of survival and livelihood. For example, Vietnam was hit by typhoons Goni and Vamco on November 2020, thus causing more than 200 deaths and around 1.5 billion US dollars in damages [13]. Another example would be the extreme flooding in the Philippines caused by typhoon Vamco, which resulted in more than 200 deaths and around 400 million US dollars in damages.
Given that the Southeast Asian region is extremely vulnerable to various natural disasters, it must be known that the ASEAN nations have already started taking precautionary measures. They have not only cooperated on a number of programs, but also enacted policies in order to abate the effects of climate change. Such policies involved the mitigation of carbon dioxide emissions in order to lessen risks to life and property. According to the ASEAN, a number of member states have voluntarily pledged CO2 mitigation targets [14]. For example, Indonesia pledged to reduce carbon dioxide emissions by 26% from business-as-usual (BAU) by 2020. With the addition of international assistance, this could even be improved to 41%. Furthermore, 2020 was also set as the deadline for Malaysia, Philippines, and Singapore, who have all pledged greenhouse gas reduction by 40%, 20%, and 16%, respectively.
This present study determines drivers for greenhouse gas emissions in the ASEAN, specifically CO2. In doing so, historical data on past policies will also be discussed in order to assess their efficacy and feasibility for the upcoming years. The study will first highlight the most effective and impressive policies enacted by the most successful countries, and then derive or infer other possible policies based on each country’s performance.
A decomposition analysis approach will be used to estimate the drivers to CO2 emissions per sector per country. According to de Boer and Rodrigues, the decomposition analysis method makes it possible to determine main drivers that caused changes in energy, and the environment, as time passes by [15]. The same source states that decomposition analysis can be further subdivided into two: namely, index decomposition analysis and structural decomposition analysis. First, index decomposition analysis (IDA) explores the relationship between a particular impact and production due to demand [16]. In contrast, structural decomposition analysis (SDA) examines the correlation between impact and the consumption of a product [17]. The impact can vary, such as energy and environmental impacts, due to the production or consumption of a particular mix or item. Both decomposition analyses have been increasingly used in the more recent years, particularly in energy- and environment-related studies. An example would be a study, conducted by Sumabat et al., wherein the logarithmic mean Divisia index method was used to determine CO2 emissions stemming from the consumption of fuel for both power and electricity generation in the Philippines [18]. Another example would be a study by Nie and Kemp, where the researchers used a combination of index and structural decomposition analyses in order to examine energy fluctuations within a certain time period [19]. There was also a study conducted by Jurkėnaitė and Baležentis, where the index decomposition method was used to determine drivers for the average growth of farms in the European Union [20]. Additionally, other studies involving decomposition analysis exist for various ASEAN countries. Such countries include Malaysia [21], Thailand [22], and Singapore [23].
Other studies based on the Asian region have also used varying methodologies in combination with decomposition methods. For example, Li et al. have conducted decoupling elasticity and decoupling index methods on acquired LMDI results in order to examine the correlation between economic growth and CO2 emissions in Central Asia [24]. Another study based on Central Asia rather used the environmental Kuznets curve hypothesis in order to examine the same pattern [25]. Finally, a study was made on the context of China and the ASEAN using decomposition and decoupling analyses [26]. It can therefore be seen that a common methodology between these studies is that a temporal approach has been taken in the LMDI decomposition processes. Additionally, these studies have shown that carbon emissions are intrinsically linked with economic growth. However, it would be insightful to understand the general growth of each ASEAN member nation in relation to each other, as well as determine the actions these individual countries have taken in order to create such change in carbon emissions coming from a variety of stages in economic growth.
In addition to the traditional temporal analysis, the present study will integrate a spatial comparison of driving factors to CO2 emissions within the region. When investigating the aggregated effects of various countries, an integrated spatiotemporal approach can conveniently provide novel insights to policymakers. Therefore, the research gap, filled-in by this study, is the need for a comprehensive spatiotemporal comparison of indices and drivers to CO2 emissions in the ASEAN. The ASEAN countries will not only be analyzed by how their indices changed over the years, in response to climate change, but will also be compared with each other to reveal their development trajectory and investigate their policy efficacy, in response to the mitigation of CO2 emissions. Using this approach, the researchers will be able to benchmark effectively across the ASEAN nations. This study aims to provide a new perspective with regards to the cross-cutting evolution of emission drivers through space and time. Finally, in lieu of the ASEAN Economic Integration, the study aims to provide research and insight by benchmarking the environmental and sustainability practices for each region [27].
For this particular study, the spatial variant of the logarithmic mean Divisia index method (LMDI) will be implemented on seven (7) different time periods from 1990 to 2018. The paper proceeds as follows: Section 2 will provide the methodology, including equations and data; Section 3 will present the results and collated data; Section 4 will discuss the proposed policies and overall conclusions.

2. Materials and Methods

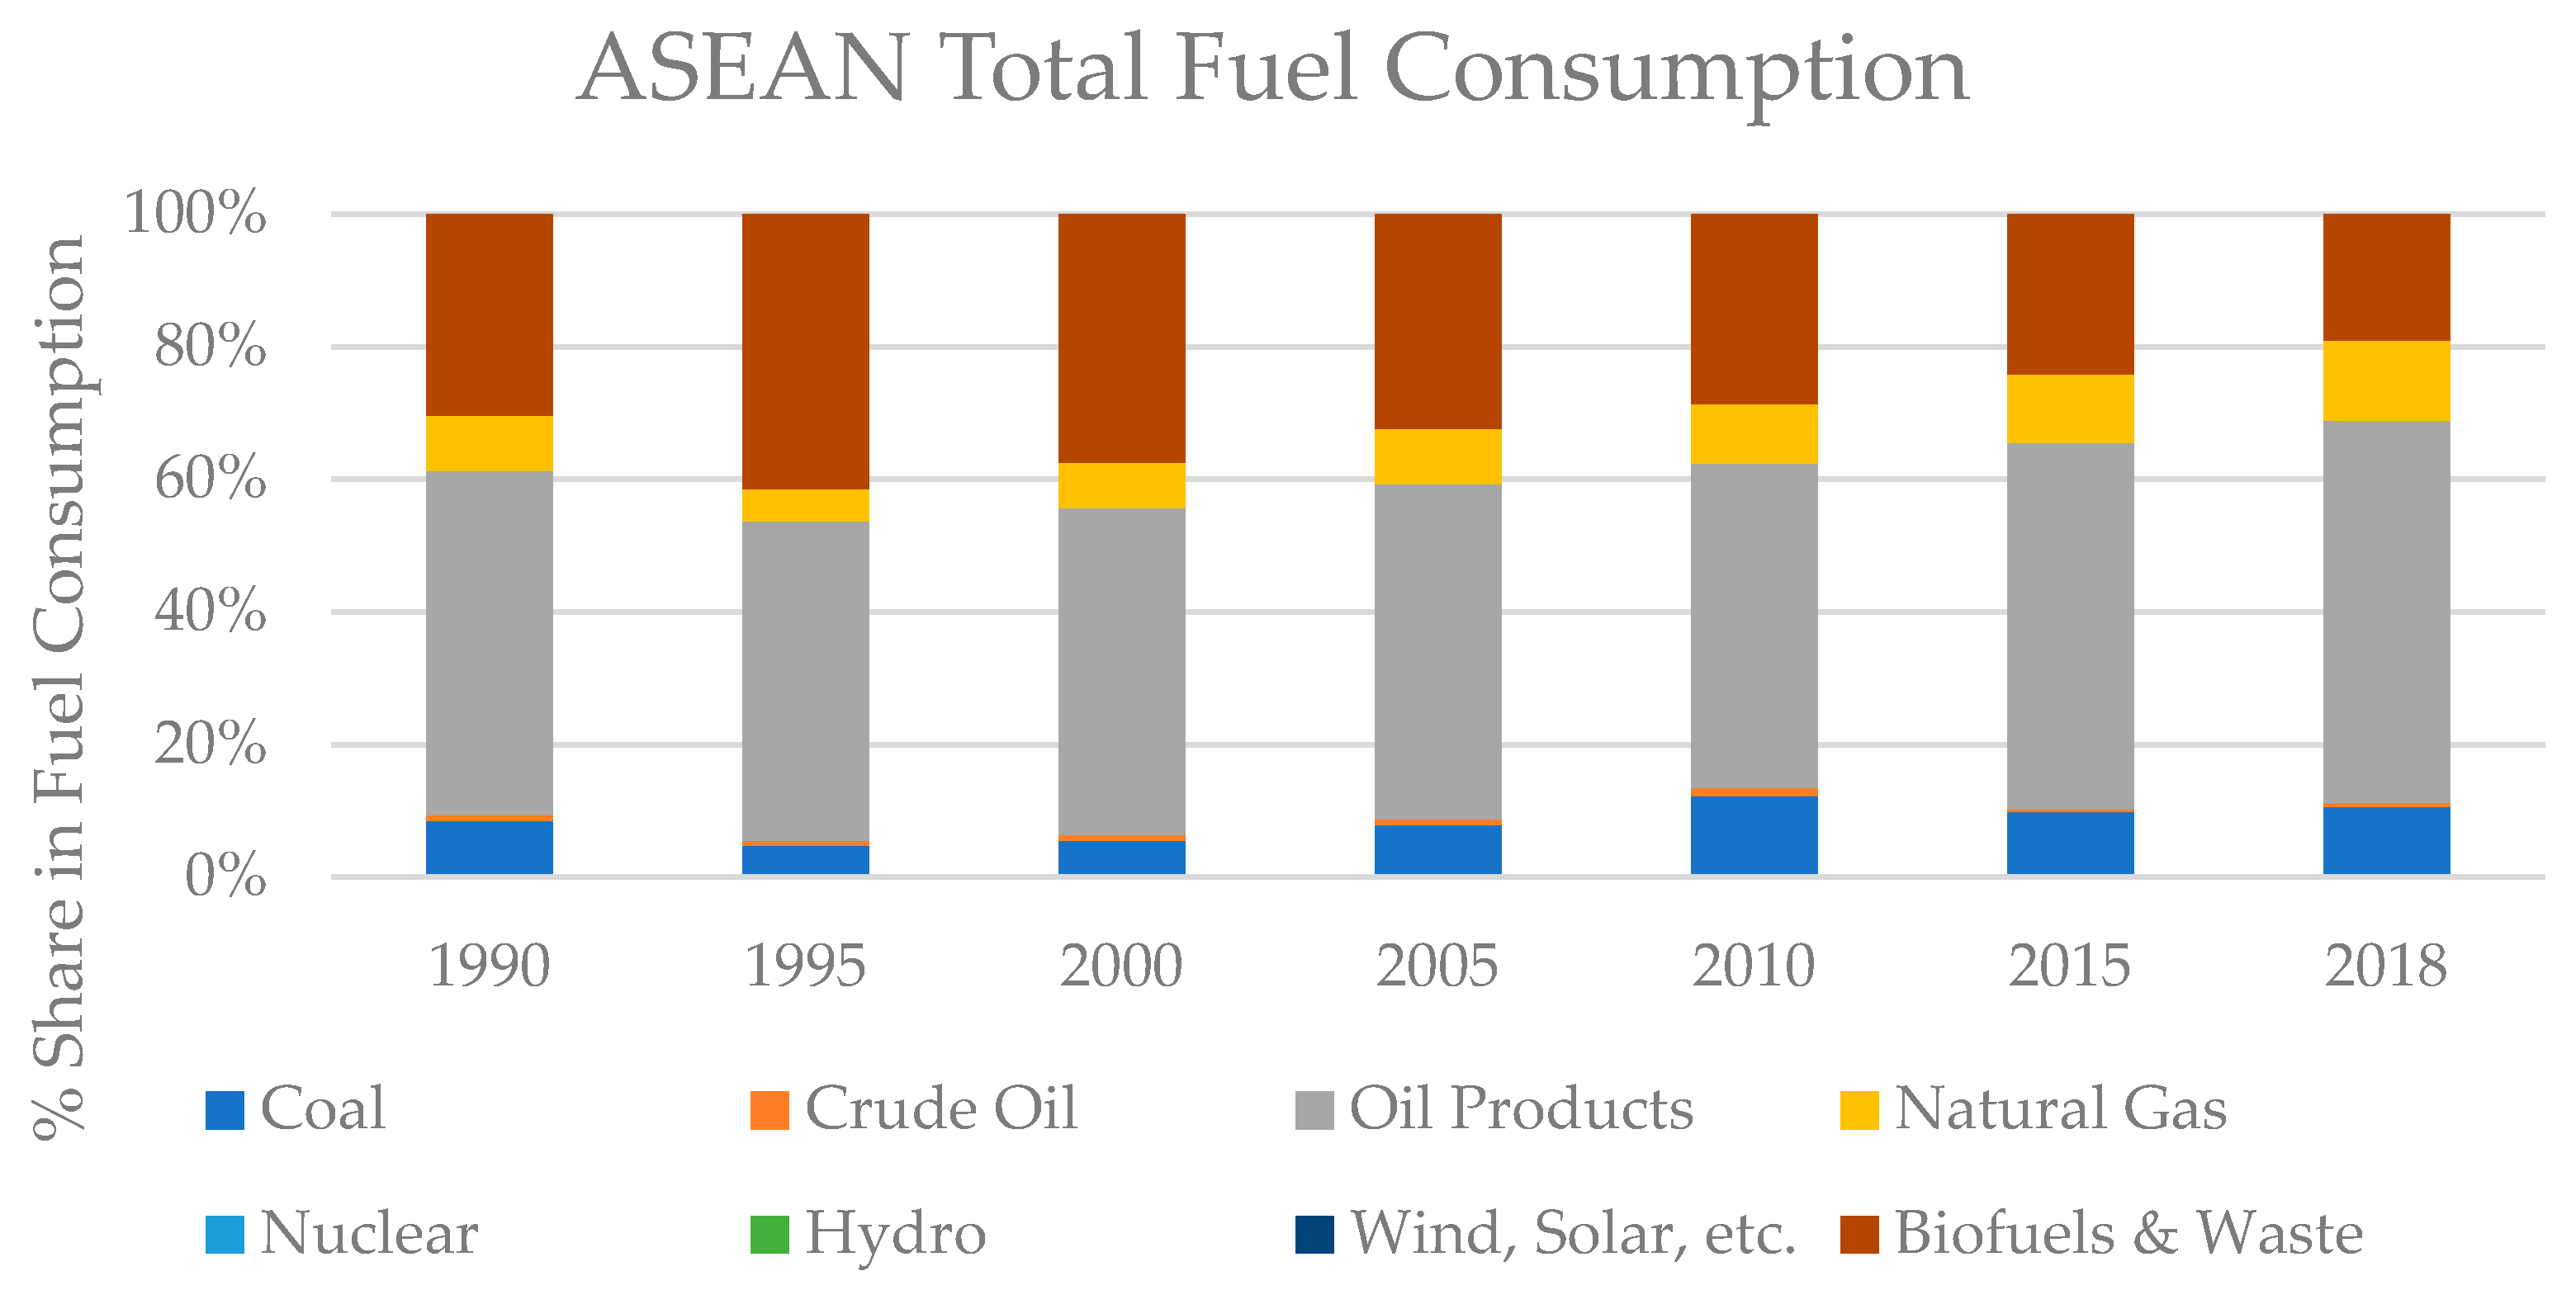
2.1. Fuel Consumption Data

The fuel consumption data per country was acquired from the International Energy Agency [28]. As stated earlier, the data gathered ranged between the years of 1990 and 2018 by intervals of five. The year 2018 was added to simply showcase the most recent performance and standing of each country. Furthermore, the total fuel consumption was further subdivided into eight fuel types; namely crude oil, oil products, coal, natural gas, biofuels and waste, nuclear, hydro, wind, and solar. Figure 1 below shows the total fuel consumption per fuel type in the ASEAN. Since it is a percentage share, the figure also depicts the average fuel consumption. The average is important since it gives an outline of the benchmark country which will be used for comparison and analysis later on. It must be noted that the fuel consumption is in terms of kilotons of oil equivalent (ktoe).

2.2. Carbon Dioxide Emissions Data

After obtaining the total fuel consumption per country, the carbon dioxide emissions from using each fuel type need to be calculated. This can be solved for by using Equation (1).
C i j = T i j F i ,
where C stands for the amount of carbon dioxide emitted from using a particular fuel type i in the year j. The variable C is in terms of kilotons of carbon dioxide, or ktCO2. Variable T, in terms of kilotons of oil equivalent (ktoe), is the amount of fuel type i consumed in a particular year j. Finally, F is the emission factor of a certain fuel type i. The values for F for each fuel type were taken from various literature, namely the Intergovernmental Panel for Climate Change [29], Environmental Protection Agency [30], and the U.S. Energy Information Association [31]. Please note that in using Equation (1), the emission factor needs to be in terms of ktCO2 per ktoe. Therefore, conversion of factors was necessary in order to have consistency across all fuel types.

2.3. Logarithmic Mean Divisia Index

For this study, the logarithmic mean Divisia index method was used in order to estimate drivers to carbon dioxide emissions in the ASEAN region. In order to have a better understanding of the process, a study by Ang provides a well-defined guide that helped streamline the process [32]. It shows the steps for formulating the identity function, as well as the general equations to be used for the method. Stated earlier, the study employed an index decomposition analysis, where the correlation between effects and the production of a certain aggregate was studied. In this case, the aggregate is carbon dioxide emissions.
After determining the aggregate, the identity function must then be formulated. In this study, the effects due to population, economic activity, economic structure, and energy intensity were considered. It was therefore necessary to obtain data regarding the population and gross domestic product (GDP) for each country. Additionally, the GDP per country must be further subdivided into three sectors; namely Agriculture, Industry, and Services for the economic structure effect. The data for the population, GNI per capita, overall GDP, and GDP per sector were taken from the World Bank [33]. Finally, in order to take inflation into account, the GDP was kept at a constant 2010 USD value for all countries. The GDP was also expressed in terms of million USD. After taking these factors into consideration, the identity function was then determined, which is shown in Equation (2).
C = i j k C i j k = P j × G j P j × i j k G j k G j × E i j k G j k × C i j k E i j k = P j × A j × i j k S j k × I i j k × F i   .
which also further expands the identity function into separate variables. It must be noted that the subscript i refers to the fuel type, j refers to the year, and k refers to the sector. The variables in the expanded notation represent the various effects to be analyzed. Therefore, P j refers to the population of a country in a particular year j, and G j represents the gross domestic product (GDP) in a year j. This fraction refers to the economic activity, and it can be simplified by the variable A j . Similarly, the variable G j k denotes the gross domestic product of a country in a particular year j and in a specific sector k. The ratio G j k / G j therefore refers to the economic structure effect S j k . Furthermore, E i j k refers to the total energy consumed when using a particular fuel type i during a year j within a specific sector k. Together with G j k , this forms the energy intensity I i j k . Finally, the last fraction is simply an altered form of Equation (1).
After outlining the effects to be studied as well as the identity function, it is then necessary to determine the actual change in carbon dioxide emissions due to the aforementioned effects. These can be solved for using Equations (3)–(6) as shown.
Δ C p o p R = j C i j k R C i j k μ l n C i j k R l n C i j k μ ( P j R P j μ )
Δ C a c t R = j C i j k R C i j k μ l n C i j k R l n C i j k μ ( A j R A j μ )
Δ C s t r u c R = j k C i j k R C i j k μ l n C i j k R l n C i j k μ ( S j k R S j k μ )
Δ C i n t R = j k C i j k R C i j k μ l n C i j k R l n C i j k μ ( I i j k R I i j k μ )
where the variables Δ C p o p , Δ C a c t , Δ C s t r u c , and Δ C i n t , refer to the change in CO2 emissions due to the population, economic activity, economic structure, and energy intensity effects, respectively.
The effects in the study were analyzed based on how they affect the amount of CO2 produced by a fuel type in a particular year and sector. First, the variable Δ C p o p connected the increase or decrease of the population to the amount of CO2 released to the atmosphere. It also relates carbon emissions to human activity. Next, Δ C a c t referred to the economic growth or decline of a country given the increase in population. Furthermore, the economic structure effect referred to the overall contribution of a particular sector to the country’s overall GDP. Denoted by Δ C s t r u c , this variable measured the increase in carbon emissions due to the growth of a particular sector. It could also mean that a particular sector has had a change in mix, where the country has conducted efforts to switch from one sector to another. Switching the base sector of a country results in lesser carbon emissions, and can even bring about negative values for the economic structure effect. Finally, Δ C i n t referred to the overall increase or decrease in energy used in order to produce the same amount of product. It must be noted that, should the energy intensity decrease, then it signifies that either the method in which these items are produced has changed, or the production process has gotten more efficient. As mentioned earlier, a benchmark country was necessary in order to properly compare the performance of a particular country with the rest. A hypothetical benchmark country was created for this study based on the average of the entire ASEAN in terms of population, overall GDP per year, GDP per year per sector, and fuel consumption per year per sector. With respect to Equations (3)–(6) above, the benchmark country is denoted by a μ in the superscript. Similarly, the particular country is denoted by the superscript R.
Additionally, given the gross national income (GNI) per capita, each ASEAN country was classified into different income levels; namely low, lower-middle, upper-middle, and high-income countries. These were then plotted with respect to each country’s overall carbon dioxide emissions. Given this, it must be noted that the GNI per capita was based off the most recent year with complete data, which is 2018. The researchers then analyzed the resulting scatter plot for possible trends that could help further support the collated data.

3. Results

Given that this study has taken a spatiotemporal approach to the LMDI method, it was one of the goals of the researchers to both analyze the performance and emissions evolution of a country and benchmark these nations with one another. In order to do so, the different effects were plotted against each other. However, for brevity of the paper, only the ones which show notable findings are presented in this paper. Figure 2a, Figure 3a, Figure 4a and Figure 5a show the progression of effects for each ASEAN member nation from 1990 to 2018. The benchmark country was used as a basis to see how each country faired in relation to each other. Finally, the pink dots show the plot point for each country in the year 1990, while the bright red dots show each country’s position at 2018. In order to make the charts legible, the country’s abbreviations, based off the ISO 3166 standard, were added only for these two dates so as to show the initial and most recent positions of each country. Therefore, these charts will be used to conduct the spatial analysis part of the study.
It must be noted that, in the year 1990, the International Energy Agency had no available data regarding the energy consumption of Cambodia and Lao PDR. Additionally, the World Bank did not have data for the total GDP and value-added percentage share of each sector to the GDP for Myanmar and Cambodia. Therefore, the researchers have simply plotted these three countries on the (0,0) coordinate on all four charts for the year 1990. The researchers have found that this does not actually affect the data much, since their respective data points in the year 1995 were not that far from the origin.
Finally, in order to more properly see how the ASEAN nation has evolved over time, trendlines were created on the spatial data for each year. This more properly illustrates the evolution of the region. These will be shown in Figure 2b, Figure 3b, Figure 4b and Figure 5b. In order to make the graphs more readable, the researchers have opted to remove the data points from the spatial analysis and, instead, only show the trendline for each year. These specific charts will be used to do the temporal analysis on the collated data.

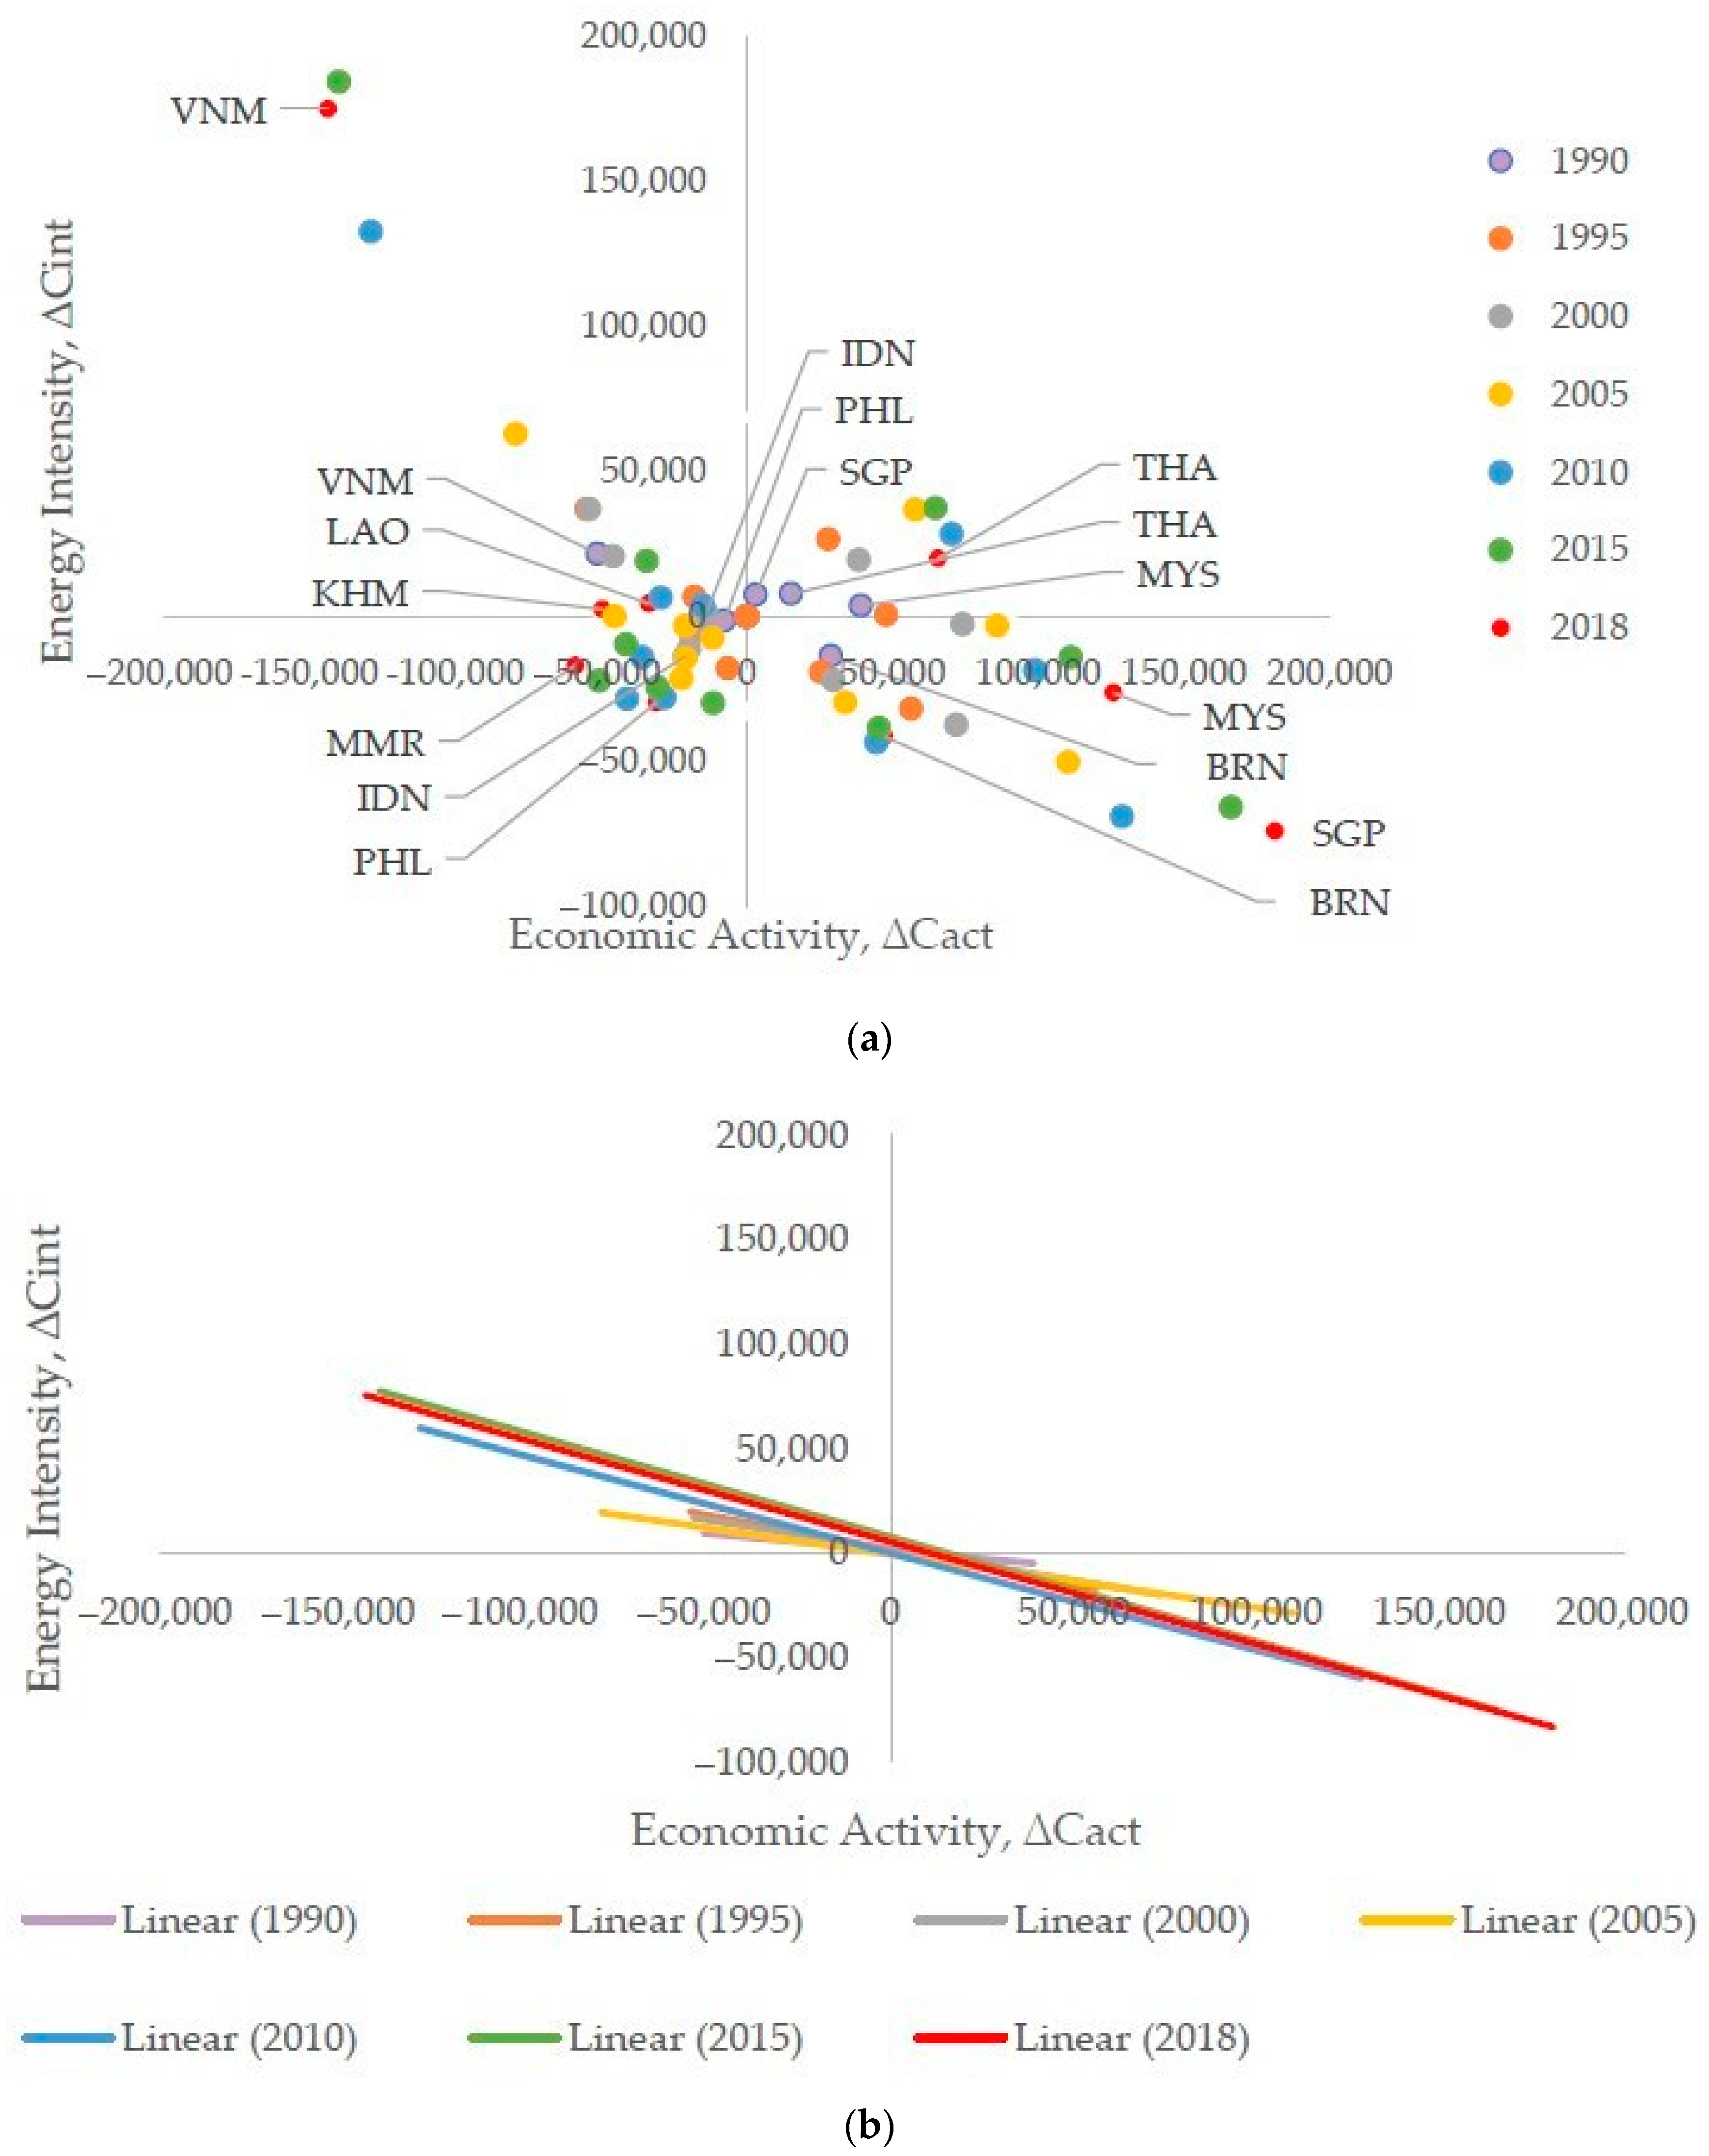
3.1. Economic Activity vs. Energy Intensity ( Δ C a c t vs. Δ C i n t )

3.1.1. Spatial Analysis

Figure 2a plots the economic activity effects against the energy intensity. It can be seen that, at the year 1990, a majority of the countries were located close to the origin, with Thailand, Malaysia, Vietnam, and Brunei Darussalam being the farthest. Besides Brunei Darussalam and Vietnam, the rest of the countries straddled and spread about the x-axis, meaning that these countries were not as energy intensive. It can also be said that countries to the right of the y-axis emitted more carbon dioxide, due to their economic activity, while those to the left emitted less. With this, Thailand and Malaysia emitted more carbon in relation to the rest. In contrast, the Philippines and Indonesia emitted slightly less. The most notable countries in the year 1990 were Vietnam and Brunei Darussalam. It can be seen that Vietnam was more energy intensive than the rest of the countries, however, it also emitted the least amount of carbon dioxide due to its economic activity. The exact opposite can be seen for Brunei Darussalam however. It is the least energy intensive, however, it is almost the same as Malaysia in carbon emissions due to economic activity.
The different colored dots show the progression of each country as they transition to 2018. Though each country was not specifically marked during the years in-between, they provide an accurate graph as to how a majority of these countries shifted over time. That being said, Singapore, Malaysia, and Vietnam show the greatest change towards the year 2018. To begin with, Singapore had actually lowered its carbon emissions already due to improved energy intensity by a significant amount. However, this has come with a notable increase in economic activity, making it emit the most carbon due to that effect. Similarly, Malaysia and Brunei Darussalam seemed to have also followed the same pattern but to a smaller degree. Thailand gradually became more energy intensive and economically active, while the Philippines did the exact opposite. Myanmar, Lao PDR, and Cambodia were still not as energy intensive, however, and they managed to lessen carbon emissions from their economic activity. The most notable find was Vietnam, where a majority of its carbon emissions came from its energy intensity, while managing to significantly lessen emissions from their economic activity. The country with the least change was found to be Indonesia, with a slight decrease in carbon emissions from both energy intensity and economic activity.

3.1.2. Temporal Analysis

The scatter plot used for the temporal analysis is shown in Figure 2b. For this section, only the general pattern of growth is studied, which will represent the general direction the ASEAN is heading to. Please note that the overall performance of the ASEAN region does not entirely reflect that of its individual countries.
It can be seen that the ASEAN nations usually follow a negative slope. This means that some parts of the region have more carbon emissions from their energy intensity compared to their economic activity, while other countries have a more impactful economic activity effect compared to their respective energy intensity. It is also interesting to note that the trendline slopes seemed to oscillate at a certain range before settling at a more constant value. The least steep slopes were found in the years of 1990, 2000, and 2005. The data makes sense given the fact that less energy was needed in the earlier years compared to what the region consumes now. Additionally, the economic activity during those years contributed more to the increase or decrease of carbon emissions, which can be seen in the graph. The carbon emissions came more from economic activity and less from energy intensity, thus resulting to a more horizontal slope. However, as the years progressed, it can be seen that the region has begun to show more pronounced changes in energy intensity, and some countries have either increased or decreased their carbon emissions for that particular effect. For the economic activity, a majority of the countries seem to just spread out more along the x-axis, given that their respective populations and gross domestic products have increased. From the years 2010 to 2018, the slopes tended to gradually reach a constant value.

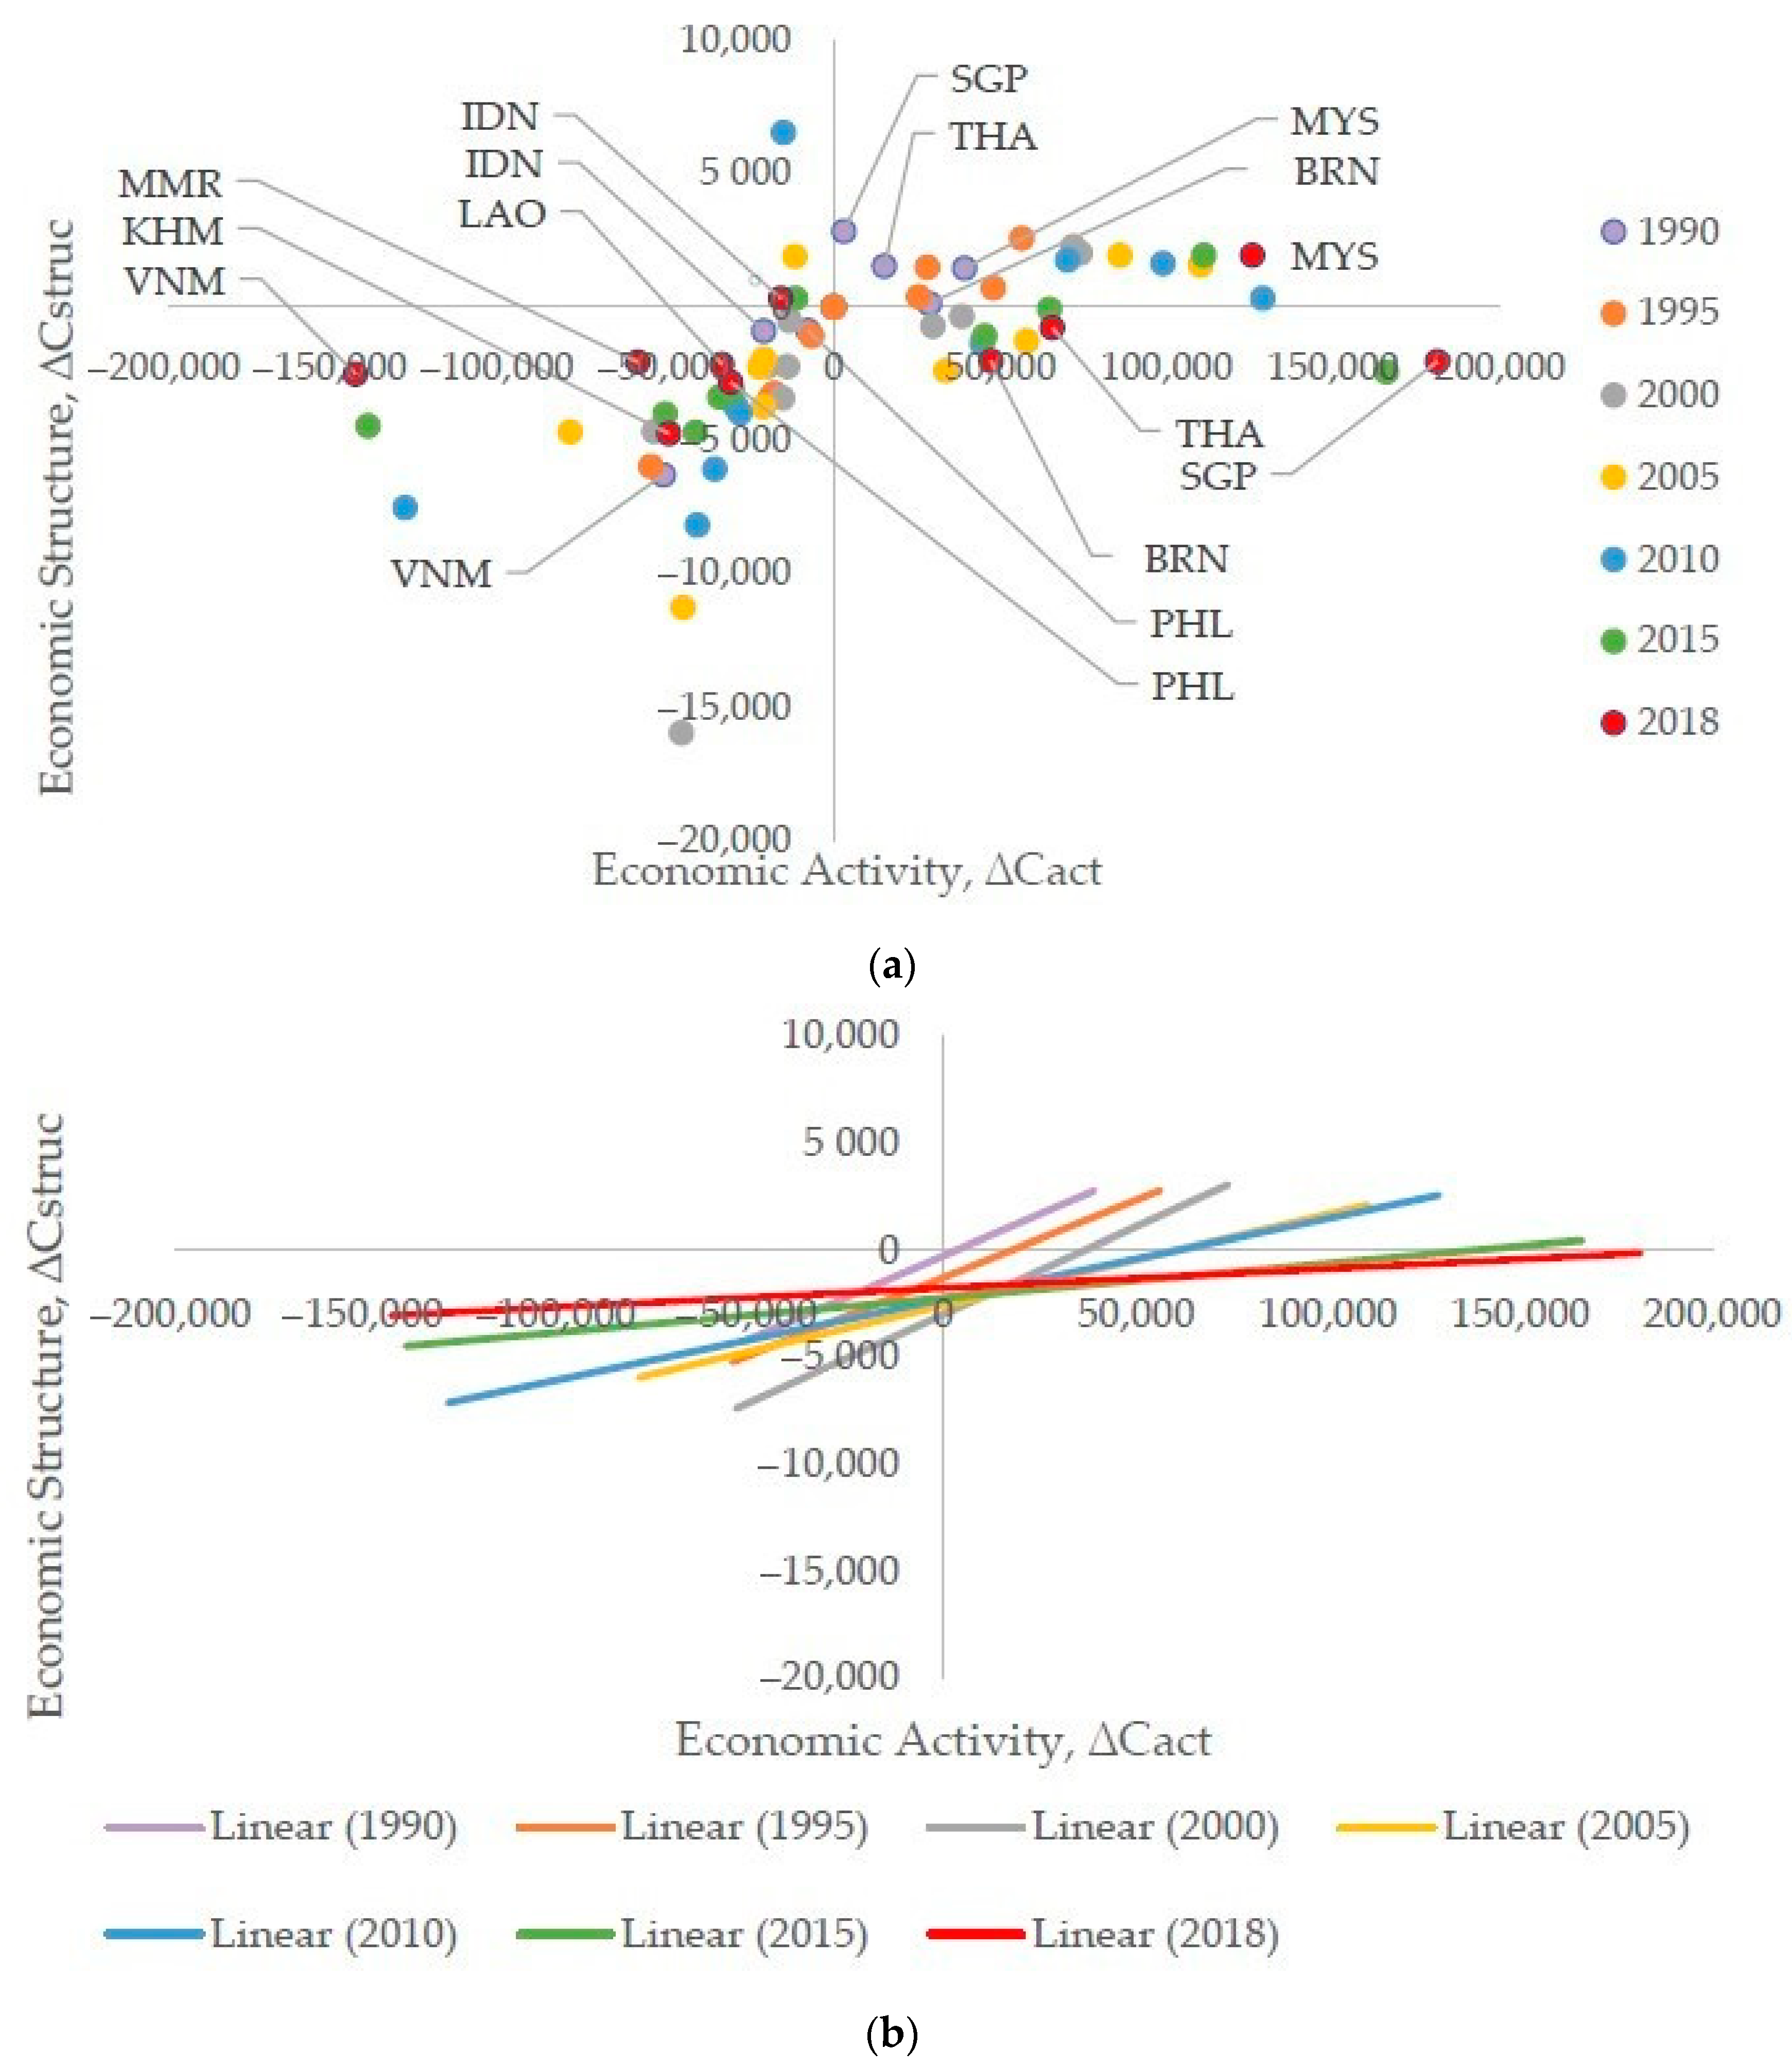
3.2. Economic Activity vs. Economic Structure ( Δ C a c t vs. Δ C s t r u c )

3.2.1. Spatial Analysis

Figure 3a plots the economic activity against the economic structure effect. At first glance, the dots seemed to create a natural curve from left to right. In the year 1990, it can be seen that Singapore, Thailand, Malaysia, and Brunei Darussalam were in the first quadrant, meaning that their carbon emissions due to both the economic structure and economic activity effects were significant. In contrast, the Philippines, Indonesia, and Vietnam, which were found in the third quadrant, displayed a significant decrease in carbon emissions due to both effects. Malaysia was the most economically active, while Singapore had the highest economic structure effect at the time. This goes in accordance with the fact that Singapore’s GDP per capita actually surpassed that of South Korea, Portugal, and Israel [34]. Meanwhile, Malaysia experienced labor shortages during the early 1990s, thus causing an influx of foreign workers in all sectors, as stated in a study by Lee [35]. The country managed to keep up with the labor demand, which enabled its economy to remain significantly active. In contrast, Vietnam managed to decrease carbon emissions from both effects by a significant amount. As written by Cima, Vietnam, in 1990, was considered to be one of the poorest countries in the world, with high rates of unemployment, wavering food supplies, and increasing inflation [36]. Relating to the study, it makes sense that the country did not emit as much carbon dioxide compared to the rest of the countries with respect to its economy at the time.
In the year 2018, however, it can be seen that there has been a huge change for all countries. First, the country with the greatest difference in economic activity was Singapore. The economic activity effect indicate that the country’s CO2 emissions have notably increased. However, it has managed its carbon emissions due to its economic structure by a significant amount. Similar to Singapore, Thailand, and Brunei Darussalam have followed the same pattern. Malaysia has displayed an almost constant economic structure effect, with a notable increase in carbon emissions due to its economic activity. For the other half of the x-axis, it can be seen that Indonesia has had a slight increase in carbon emissions due to its economic structure. On the other hand, the Philippines, Vietnam, Lao PDR, Cambodia, and Myanmar have shown an improvement in decreasing carbon emissions from both effects. Vietnam, most notably, has increased CO2 emissions due to its economic structure, but has significantly managed its carbon emissions due to its economic activity. According to the World Bank, Vietnam has actually shifted labor away from the agricultural sector, and has allocated it to their industry and service sectors [37]. This change in economic structure has mitigated carbon emissions, due to their economic activities, even further. Combined with its booming economy in 2018, it also addresses the slight increase in carbon emissions due to the economic structure effect.

3.2.2. Temporal Analysis
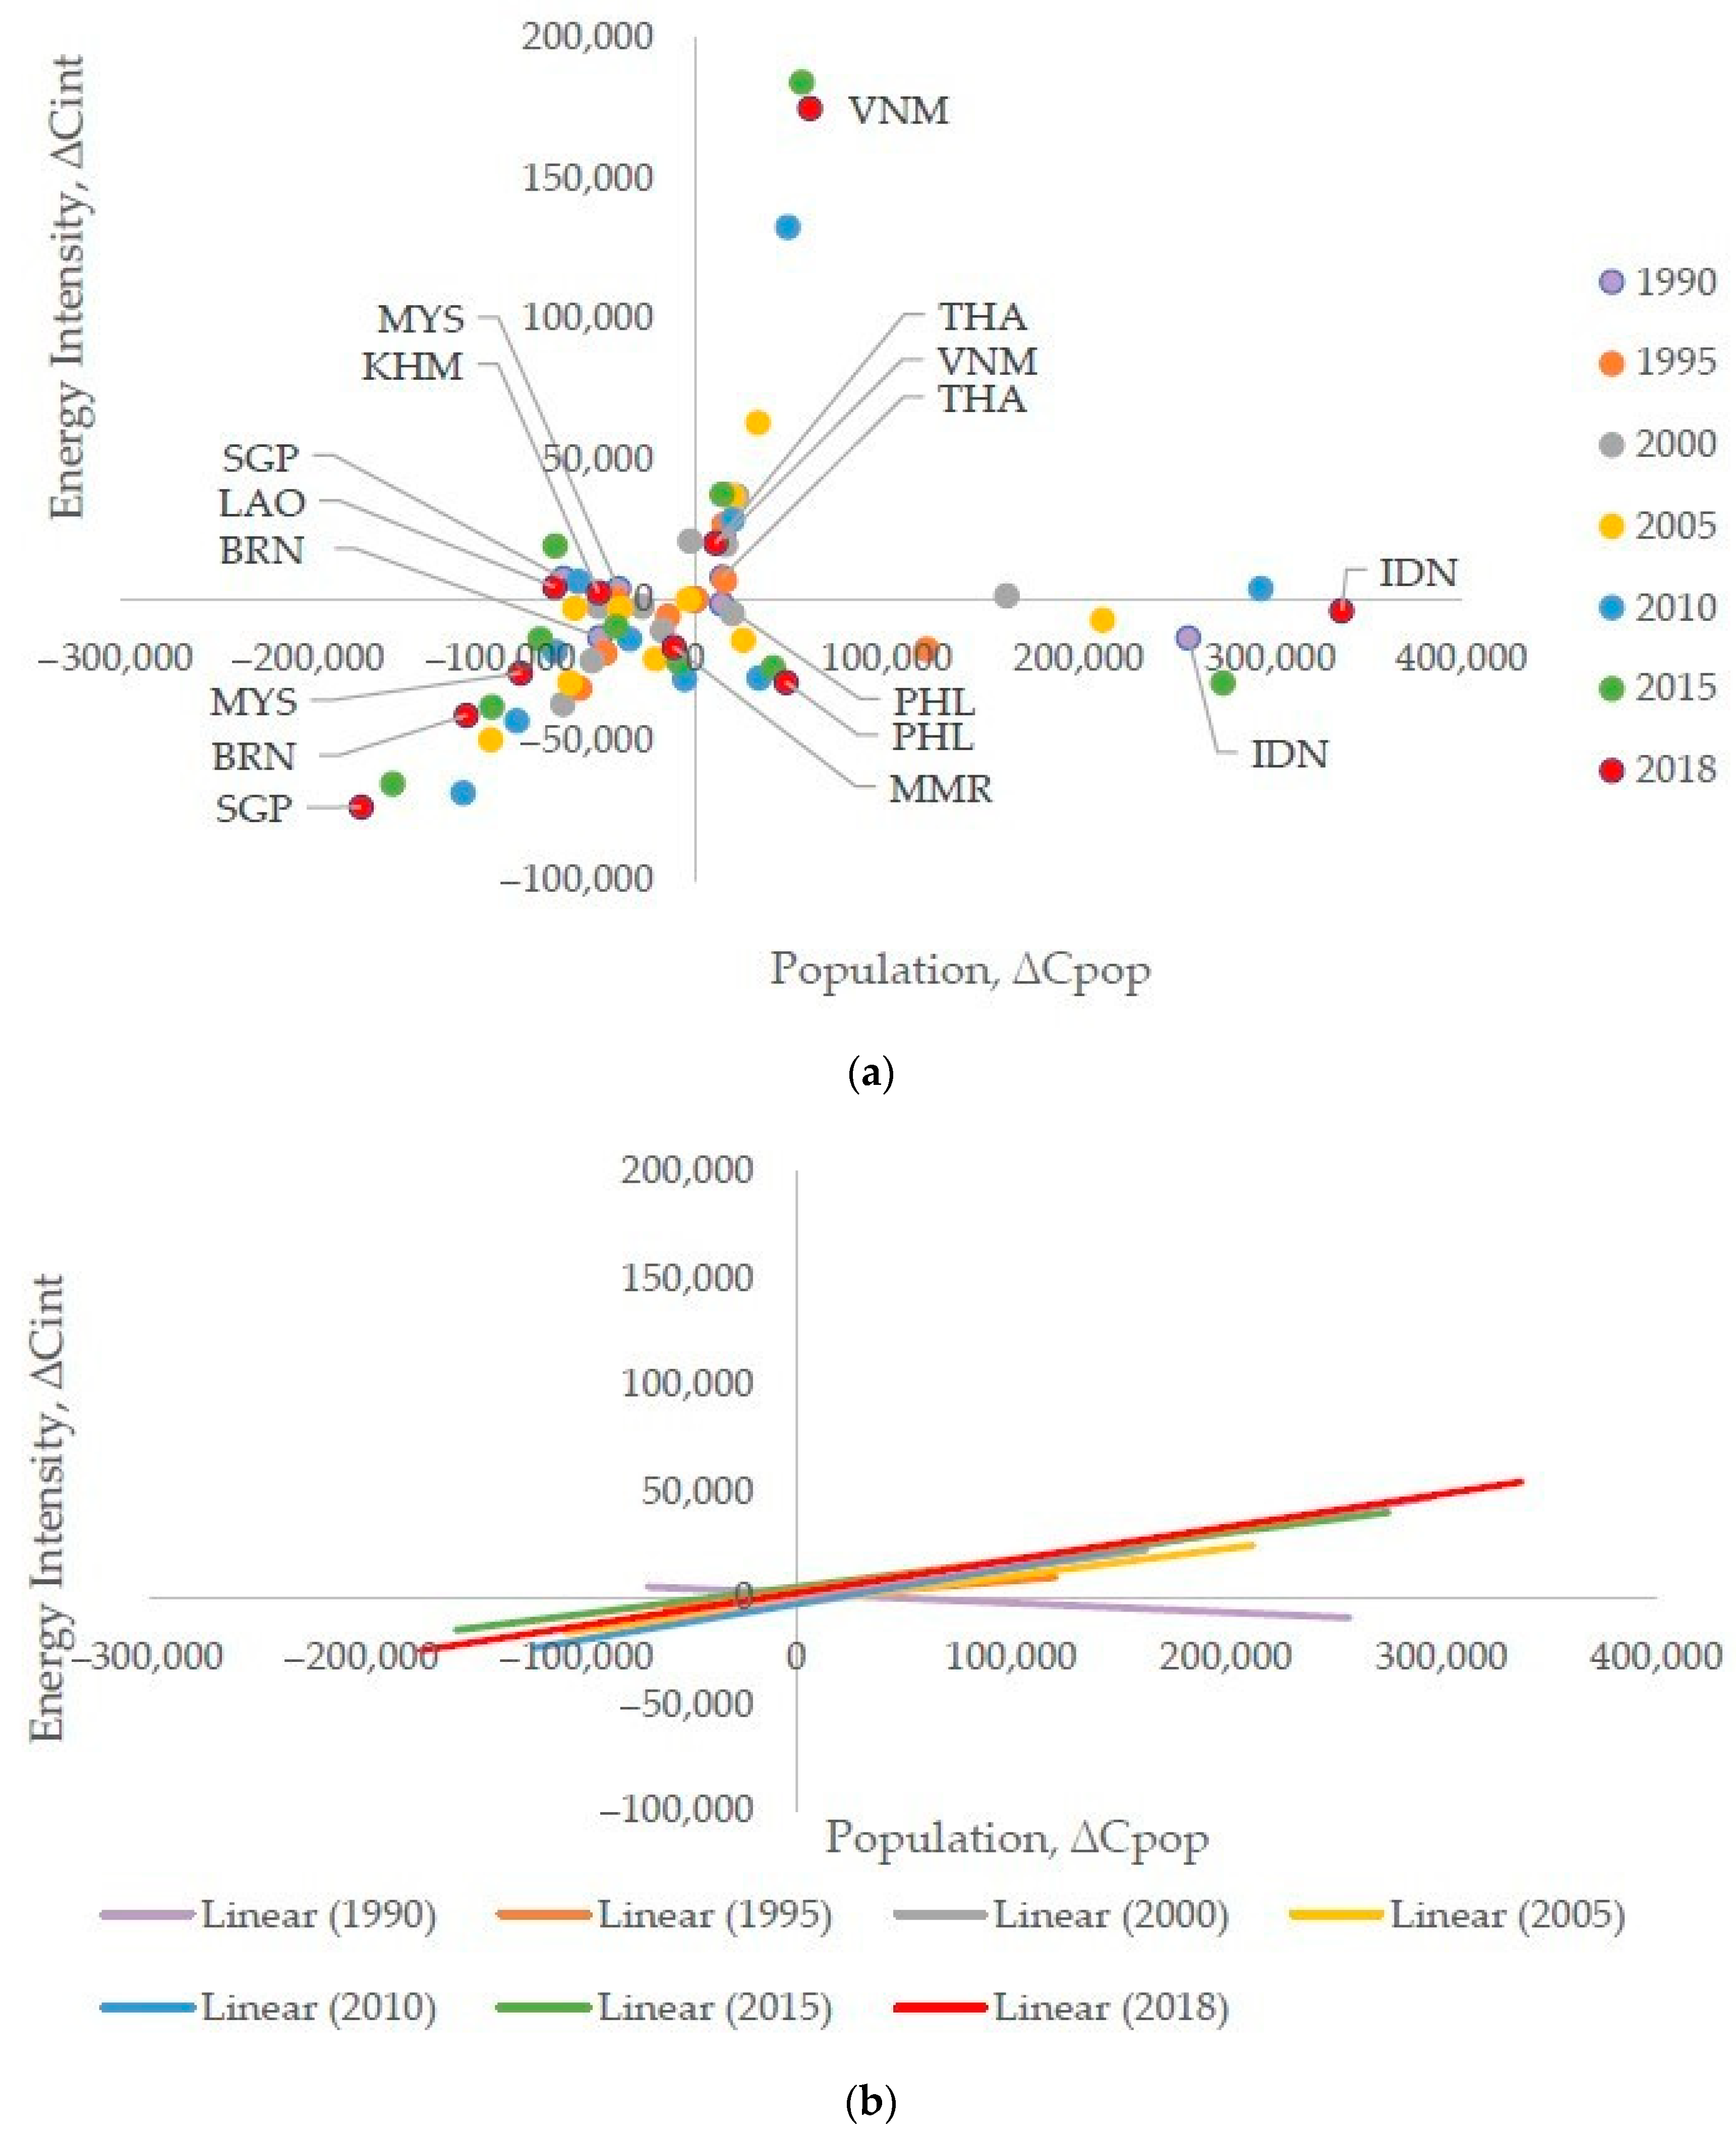
Figure 3b shows the temporal analysis of the same scatter plot. It is notable to see that as the years progressed, a pattern can be more clearly seen. From 1990 to 2000, the y-intercept decreased at an almost constant interval. The slope gradually decreased as well. It is only by the year 2005 that the slope changed drastically. Finally, starting from 2010 to 2018, the slope gradually became less steep, until it was almost horizontal. From this chart, it can be seen how the ASEAN countries have collectively lessened total carbon emissions with regards to each country’s economic structure. The increase or decrease of carbon emissions actually came from the economic activity effect. According to the Asian Development Bank (ADB), the ASEAN region has some of the world’s most rapidly improving economies [38]. However, it was stated that the region has various policies that actually permit and encourage the emissions of greenhouse gases, which will be discussed later on in this paper. This region’s collective GDP, and GDP per sector, have managed to mitigate carbon emissions. However, it is the technical inefficiencies and permitted emissions, present in the economic activity, that caused a massive increase in the overall carbon emissions as stated by the ADB.
From the temporal analysis, it can be observed that, in the years of 1990 to 2000, the ASEAN countries were developing together at the same pace. It should be noted that during this time, significant shifts in the economic structure were not as evident. However, in the years of 2010 to 2018, the trendline was observed to pivot. This therefore suggests that the countries were no longer developing at the same pace. It can be observed that some countries were developing faster than the others. This can be seen with countries like Singapore, Malaysia, and Thailand, who’s rapidly increasing carbon emissions, due to economic activity, suggested rapid economic growth. The plot also further illustrates that, even though some countries like Vietnam and Cambodia were lagging in terms of economic development, it can be said that they are putting in aggressive efforts to restructure their economy before moving forward.

3.3. Population vs. Energy Intensity ( Δ C p o p vs. Δ C i n t )

3.3.1. Spatial Analysis

Figure 4a shows the population effect plotted against the energy intensity effect. In the year 1990, it can be seen that the countries were not as energy intensive as they are now, since they straddled the x-axis. First, it can be observed that Indonesia had the greatest carbon emissions due to the population. The Philippines, Thailand, and Vietnam came second, with a slight increase in CO2 emissions due to population growth. Vietnam, however, emitted more due to increasing energy intensity effects. In contrast, the countries of Malaysia, Singapore, and Brunei Darussalam had a negative change in carbon emissions during that time. From the three, Brunei Darussalam was the least energy intensive. According to Sjahrir, Indonesia, during the 1990s, had a series of constant changes in economic structure for production and export [39]. This series of changes in production managed increases in carbon emissions due to energy intensity, as stated earlier. Therefore, a majority of its own emissions had come from the country’s population growth. Indonesia’s main driver for carbon emissions seemed to be human activity.
In the year 2018, however, it can be seen that Vietnam has skyrocketed in carbon emissions due to the energy intensity effect, which can also be seen in the previous figures. It can also be observed that there was a change for Indonesia’s carbon emissions, with respect to its population, despite being slightly more energy intensive. Furthermore, the Philippines had mitigated carbon emissions due to its energy intensity, with a slight increase in emissions due to population growth. Thailand has an almost constant population effect value, and has become slightly more energy intensive. Additionally, Singapore and Malaysia have significantly decreased carbon emissions for both effects, despite having started from a positive energy intensity value. Finally, Brunei Darussalam, Cambodia, Myanmar, and Lao PDR seemed to have simply decreased carbon emissions due to both energy intensity and population effects.

3.3.2. Temporal Analysis

It can be seen from Figure 4b that the ASEAN countries followed a more positive slope in the more recent years. It must be noted, however, that only the initial year of 1990 showed a negative slope. This is probably due to the lack of data from Myanmar, Lao PDR, and Cambodia during this year. Despite this, it can be seen that a majority of the ASEAN countries exhibited fluctuations in negative values for their respective energy intensity and population effects. This can be especially seen in the third quadrant of the figure. This shows that the majority have low carbon emissions due to population and energy intensity. From Figure 4a, the only countries which did not follow this trend were Vietnam, Thailand, the Philippines, and Indonesia. This actually coincides with a report by the Asian Development Bank, where these four countries, along with Malaysia, accounted for about 90% of greenhouse gas emissions in the ASEAN region [38]. Relating to this study, the aforementioned countries seem to have their emissions stem from both energy intensity and population effects.

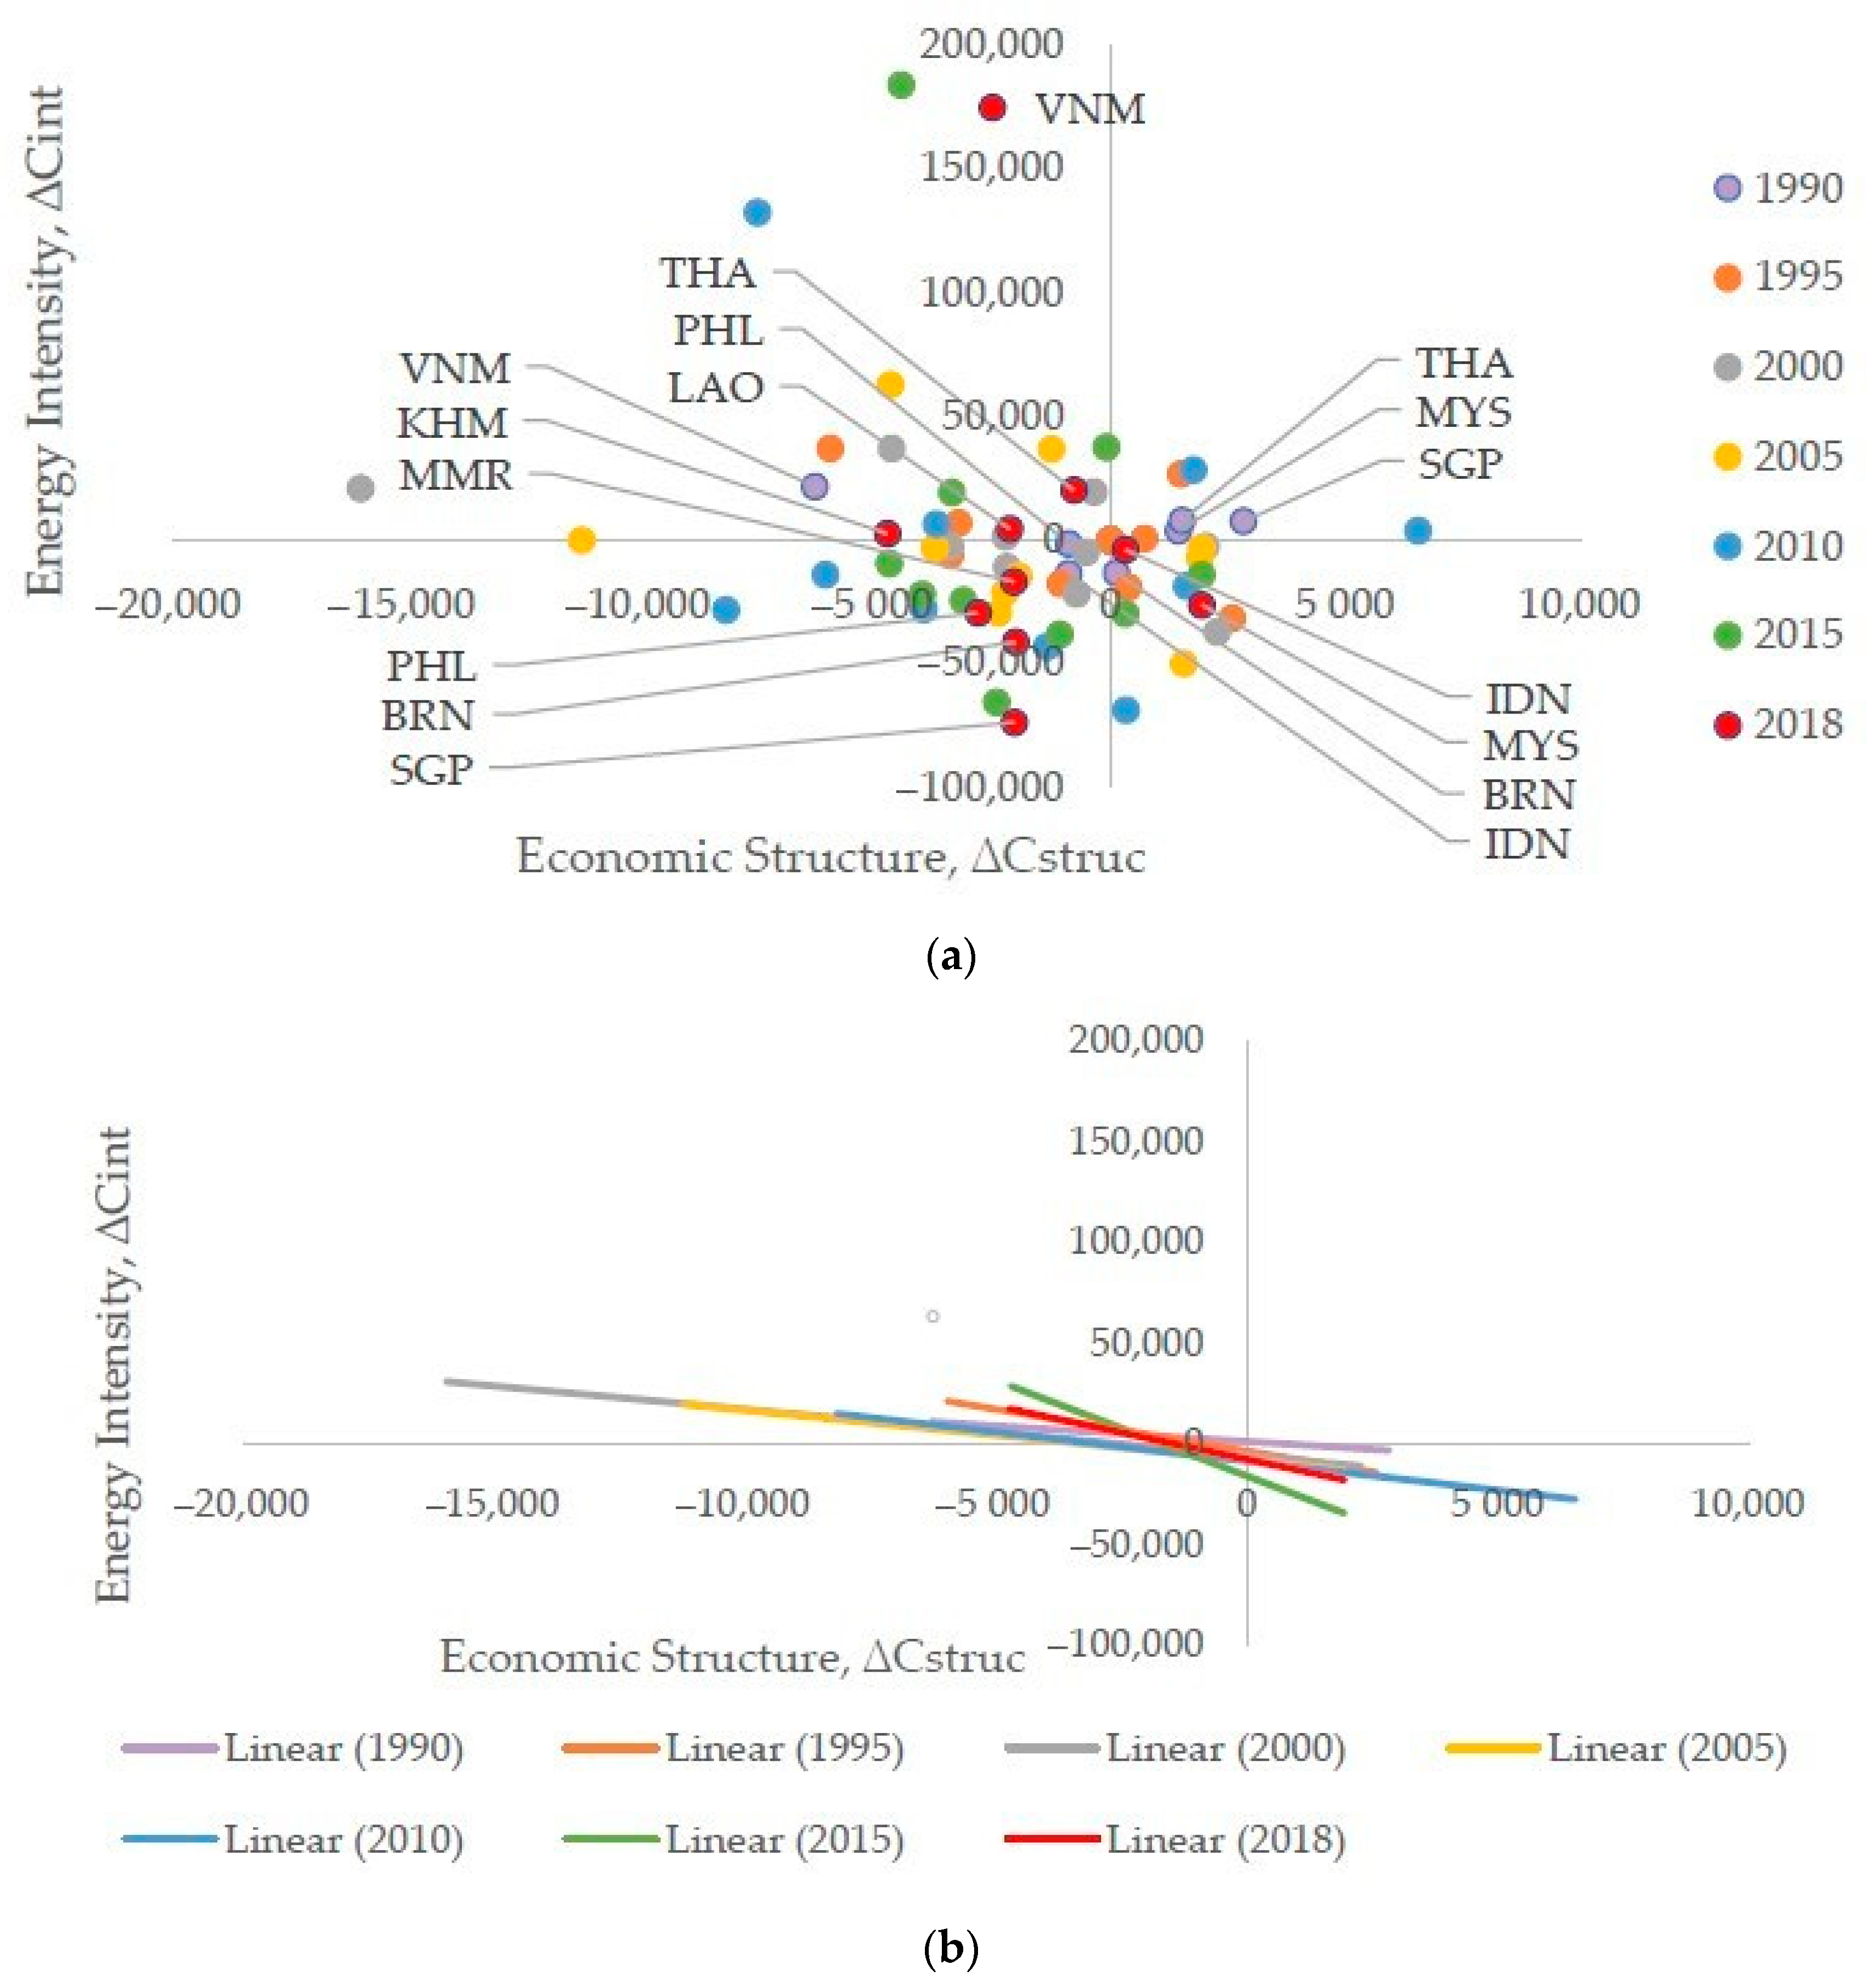
3.4. Economic Structure vs. Energy Intensity ( Δ C s t r u c vs. Δ C i n t )

3.4.1. Spatial Analysis

The last figure for spatial analysis is Figure 5a. In this scatter plot, it can be seen that most of the countries evenly surrounded the origin, and this pattern can be more easily seen in the earlier years. However, as time passed, it can be noted that the countries radiated outward in all directions. In the year 1990, the countries of Thailand, Singapore, and Malaysia had a slight increase in carbon emissions due to their energy intensity. Of the three, Malaysia had the highest increase in emissions due to changes in economic structure. Brunei Darussalam appeared to have almost no change in its carbon emissions for Δ C s t r u c , even though it had a negative change in its Δ C i n t value. Finally, Vietnam, Indonesia, and the Philippines appeared to have a negative change in economic structure. Of the three, Indonesia had a decrease in carbon emissions, due to its energy intensity, while the exact opposite can be said for Vietnam. As can be seen from previous figures, the countries were not as energy intensive back then, and thus they were relatively closer to the x-axis.
In the year 2018, however, the countries have stayed relatively closer to the origin compared to previous graphs involving the energy intensity. As usual, Vietnam had a dramatic increase in carbon emissions due to its energy intensity effect. In contrast, Malaysia managed to maintain a positive change in carbon emissions due to economic structure, while it decreased emissions from its energy intensity. Thailand slightly increased emissions because of its energy intensity, but had mitigated emissions through its economic structure. Cambodia, Lao PDR, Myanmar, and the Philippines all had decreased their emissions from both effects, with Cambodia having the greatest decrease in carbon emissions because of its economic structure and Myanmar having the greatest decrease in emissions because of its energy intensity. However, Indonesia had increased carbon emissions from both effects. Finally, the most notable and beneficial change can be seen for Singapore. It managed to reach a negative change in emissions for both effects by a significant amount, despite having almost the same Δ C s t r u c value as Malaysia in 1990. According to the pledge and document, released by the National Climate Change Secretariat in Singapore, the country had already pledged to reduce emission intensity by 36% starting from 2015 [40]. This pledge was supported by its results in the year 2012. During this time, its economy grew by 5.7% per annum, but the greenhouse gas emissions grew at a much lower rate of 2.1% compared to previous years.

3.4.2. Temporal Analysis

Figure 5b shows the trendlines exhibited by the ASEAN region from 1990 to 2018. From the graph, it can be seen that the trendline slope in the year 1990 was almost parallel to the x-axis, with a slight drop to the right of the plane. However, in the year 1995, the negative slope became more prominent. The slope almost stayed constant from 1995 to 2010, before notably dipping in 2015. Finally, in 2018, the region had returned back to the same slope it had in 2010. It can therefore be observed that the ASEAN region follows a negative slope, similar to Figure 2b. Combined with the distribution of countries and their position on the scatter plot, this simply means that a majority of the ASEAN nations have a more influential energy intensity effect than the economic structure effect. Additionally, they collectively had a decrease in carbon emissions because of changes in economic structure, compared to their energy intensity. It can be seen that the ASEAN eventually stabilized to a particular slope, where an increase in energy intensity correlated to a decrease in economic structure and vice versa.

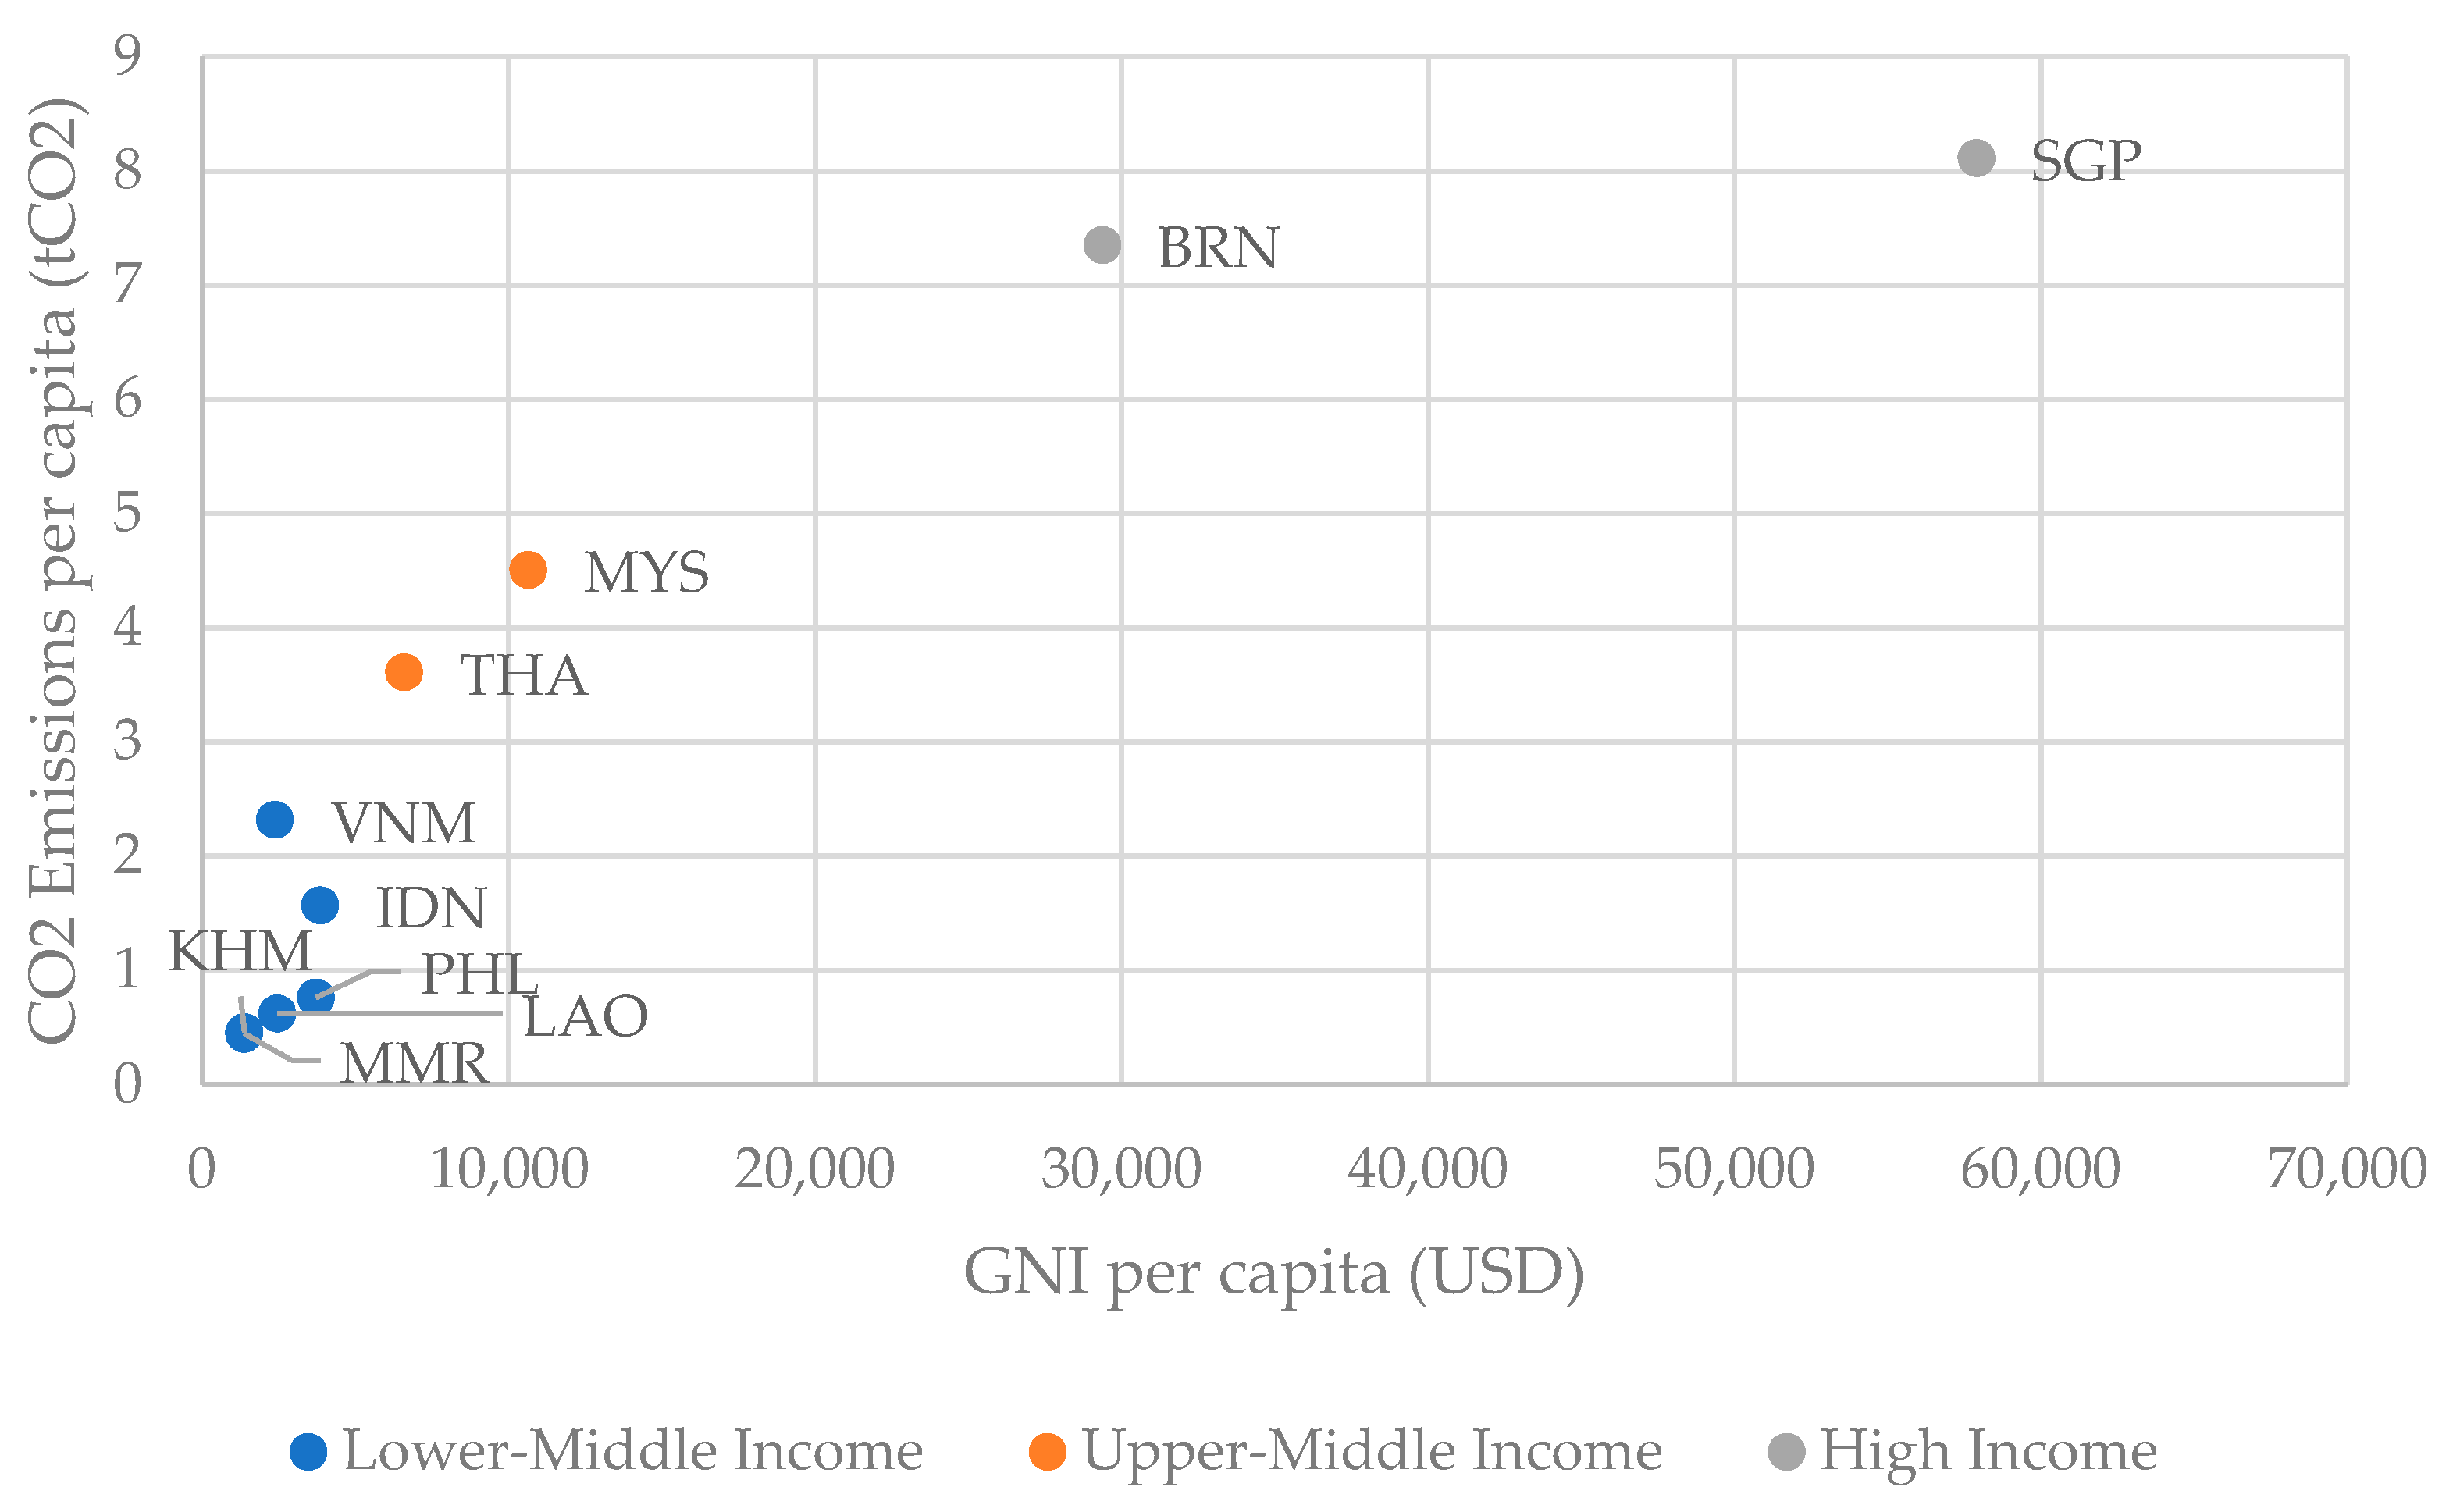
3.5. Income Level vs. CO2 Emissions (GNI per Capita vs. tCO2 per Capita)

Figure 6 shows each country’s GNI per capita plotted against their total CO2 emissions per capita for the year 2018. It can be seen that there are six ASEAN members that classify as lower-middle income countries; namely Indonesia, Vietnam, Philippines, Cambodia, and Lao PDR. Thailand and Malaysia have upper-middle income economies, while Singapore and Brunei Darussalam are considered high income countries. The scatter plot clearly shows a significant divide between countries of high and low income, as well as the carbon emissions per capita for each. The lower-middle income countries are shown to have a less per capita emissions, and this increases as the income level increases. This finding is very interesting considering the massive overpopulation in countries like the Philippines and Indonesia. This suggests that, in low-middle income countries, the driver for emissions is more of industrial and economic activity, while it shifts more to human activity in higher-income countries. This emphasizes the importance of behavioral solutions to mitigating emissions, in addition to measures focusing on industrial and economic activities. This also suggests that policies need to be revisited and evolved, as the country’s economy grows.
It must be noted that Indonesia has recently been reclassified to be an upper-middle income economy in the year 2019 [41]. However, given that there is no complete data regarding the energy consumption of all countries in the International Energy Agency as of writing this paper, analysis is only be limited to the year 2018.
Figure 6 above shows each country’s GNI per capita plotted against their total CO2 emissions per capita for the year 2018. It can be seen that there are six ASEAN members that classify as lower-middle income countries; namely Indonesia, Vietnam, Philippines, Cambodia, and Lao PDR. Thailand and Malaysia have upper-middle income economies, while Singapore and Brunei Darussalam are considered high income countries. The scatter plot clearly shows a significant divide between countries of high and low income, as well as the carbon emissions per capita for each. The lower-middle income countries are shown to have a less per capita emissions, and this increases as the income level increases. This finding is very interesting considering the massive overpopulation in countries like the Philippines and Indonesia. This suggests that, in low-middle income countries, the driver for emissions is more of industrial and economic activity, while it shifts more to human activity in higher-income countries. This emphasizes the importance of behavioral solutions to mitigating emissions, in addition to measures focusing on industrial and economic activities. This also suggests that policies need to be revisited and evolved, as the country’s economy grows.
It must be noted that Indonesia has recently been reclassified to be an upper-middle income economy in the year 2019 [41]. However, given that there is no complete data regarding the energy consumption of all countries in the International Energy Agency as of writing this paper, analysis is only limited to the year 2018.

4. Discussion

The drivers to changing carbon emissions in each ASEAN country are summarized in Table 1. The values obtained from the calculations are listed down. For brevity, only the years of 2000 and 2018 are shown. This is because of the lack of data from Cambodia, Lao PDR, and Myanmar in 1990 and 1995. In the table, the highest and lowest values for each index are highlighted in red and green, respectively.
Please note that these values were taken in comparison to the average of all countries, which was set as the hypothetical benchmark country. A high positive value simply means that a particular country is emitting more because of that index compared to the regional average. The same logic applies for a low, negative value in the change in carbon emissions. With this in mind, it can be seen that only Singapore in 2018 was able to reduce carbon emissions, due to population and energy intensity effects, compared to the rest of the ASEAN. The countries with the least carbon emissions were found to be Brunei Darussalam, Lao PDR, Myanmar, and Cambodia. These countries managed to have negative values for a majority of the effects as time progressed. Despite this, it was found that Indonesia, Malaysia, Vietnam, Thailand, and Philippines have the most notable contributions to greenhouse gas emissions as their indices range in the positive tens of thousands to even hundreds of thousands. Compared to the rest of the indices, the economic structure does not seem to contribute as much to the overall carbon emissions in the region. The most influential drivers in the ASEAN were found to be the energy intensity, economic activity, and population effects.
Based on the results found however, it can be seen that a majority of the DA5 countries such as Indonesia, Malaysia, Vietnam, the Philippines, and Thailand, have significantly decreased carbon emissions due to a few indices. Despite this progress, there was still a massive increase in carbon emissions as these countries have started shifting to one or two particular effects as can be seen in the temporal analysis. Given this, more focus should be done on Indonesia, Thailand, and Vietnam.
To begin with, Indonesia’s population has been steadily increasing, up to more than 270 million people in the year 2019. This increase in population can lead to an increase in the need for more space and land for cultivation, as well as the building of facilities and buildings to accommodate for the increase in demand of supplies [42]. This issue, combined with an attractive demand of timber from China and Japan, has led to rampant illegal deforestation within the country [43]. Additionally, the burning of forests is a common practice, which destroys carbon sinks and thus emits greenhouse gases into the air [44]. This practice has made Indonesia the eighth largest emitter of carbon dioxide in the world in 2020, according to the World Resources Institute [45]. It is therefore recommended, including the rest of the ASEAN countries, to actively make illegal logging and deforestation much less attractive in terms of concessions, ease, and income. It is further recommended to monitor existing regulations regarding deforestation, as well as implementing stricter tax and penalties to those who repeatedly offend the law. Additionally, it is best to remind the countries, especially those in the DA5, of their obligations and targets in order to reduce emissions from deforestation and forest degradation, or REDD+, as stated in the UN [46].
Thailand’s population, economic activity, and energy intensity have significant contributions to its carbon emissions. Though not as high as Indonesia’s, these values are more evenly distributed. Despite the country having successfully decreased its emissions in relation to later years and to the ASEAN, improvements can still be made. According to the UNFCC, Thailand’s efforts in mitigating carbon emissions involve increasing the areas of permanent trees by 72,000 hectares, and reducing land for open burning by 24,000 hectares [47]. The same source states that cooperation with the Kyoto Protocol’s Clean Development Mechanism led to the approval of more than 30 projects, which have the potential of reducing carbon emissions by about 2 million tons. Additionally, it was found that subsidizing the acquisition and use of fossil fuels is actually inefficient, as the cost is actually greater to the individual consumer compared to society [38] (p. 104). It is, therefore, recommended to increase mitigation targets and ambition levels in order to effectively hasten the reduction in GHG emissions since it does not only benefit the world as a whole, but it also costs less than current energy policies towards fossil fuels.
Vietnam has repetitively shown a massive increase in energy intensity in more recent years. This is backed by a study by Le, where it was stated that pre-existing government policies indirectly helped the energy sector by funding fossil energy costs through the use of government-owned businesses and facilities [48]. This has resulted in the inefficient use of energy in the production processes, thus increasing the amount of carbon emissions. The ADB even further stated that the largest overall source of mitigating carbon emissions is through efficient energy use [38]. It is therefore imperative to conduct research and studies in order to analyze ongoing energy use patterns and economic behavior in order to, not only formulate appropriate management practices that could effectively allocate end-use energy for each sector, but to also implement suitable environmental and energy policies for all countries.
Finally, the performance of Singapore must be emulated and acknowledged. The country has actually become a center of research and development for Southeast Asia [49]. As can be seen from the study, Singapore was able to drastically lessen carbon emissions from both population and energy intensity. According to the National Climate Change Secretariat in Singapore, the country’s manufacturing sector has cooperated with the National Environment Agency (NEA) and the Economic Development Board (EDB) in order to improve its energy efficiency by about 1% to 2% per year [40]. Additionally, efforts have been done with existing policies, such as the Energy Conservation Act (ECA). This policy keeps energy intensive facilities in check and reviewed regularly in order to monitor energy use patterns. This helps the government and various sectors not only predict future energy trends, but also actively adjust and make informed decisions about energy allocation and use. Additionally, research and development departments within each country should implement, and standardize, CO2 emission limits that are feasible with respect to the aforementioned pledges and obligations. It is recommended to study each sector and implement emission limits based on the nature of their activities. An example would be the EU implementing emissions standards for the transportation sector such as private cars and light vehicles [50]. Overall, further studies would help the country make their energy use much more efficient and release less carbon dioxide than they need to. It is therefore recommended for the rest of the ASEAN countries to work closely with their existing institutions and abide by their implemented policies strictly. Should these not work, it is then advised to revise policies and allocate government funding to the formation of agencies that monitor the country’s economic activity, structure, and energy consumption.
In terms of the effects studied, it can be seen that more successful countries, like Singapore, Brunei Darussalam, and Malaysia, all have low energy intensity effects with exception to Thailand. The high population effects of Indonesia and the Philippines, as well as the high energy intensity effects of Vietnam, are clearly reflected in the plot as well. The trend exhibits a behavior similar to the findings in a study by Tucker [51], where it was found that the rate of carbon emissions decreases as the income per capita increases. More interestingly, it was stated that higher income countries have a relatively easier process of implementing GHG mitigation projects. In contrast, other developing countries may have a more difficult implementation, given that they may have to concentrate on other projects that would, instead, accelerate economic growth. The results, therefore, further highlight the disparity between the ASEAN member nations in terms of development, as well as their individual trends and directions for economic growth.
In relation to previously conducted regional-level studies, the results corroborate the fact that changes in energy mix have a strong impact on carbon dioxide emissions, as can be seen in a study by Fernández-Gonzales et al. in the European Union [52]. More particularly, changes in energy mix led by switching to cleaner fuels was also proven to significantly lessen carbon emissions. A similar decomposition analysis on energy consumption and economy was also done on the Eastern, Western, Northern, and Southern parts of Europe [53]. Given that these studies were also conducted on a group of countries, albeit in different regions, they also came to the conclusion that it is necessary to formulate more specific policies for each country. This is because each country has their own strengths and weaknesses that dictate how well they could respond to climate changes and implement environmental policies. Given that some countries in the ASEAN region are still in the process of development, it is best to consider how well they would adapt to the required climate goals.
Additionally, the study conducted shows a more graphical representation of each country’s evolution, in relation to each other and with respect to time. Previous studies on the Latin America and Caribbean (LAC) region [54], South Africa [55], and Organization for Economic Cooperation and Development (OECD) member countries [56], all came to the conclusion that population and intensity effects were main drivers to carbon emissions through temporal analyses combined with Tapio decoupling methods. This present study was able to easily determine the significance of both effects, in addition to important insights on economic activity effects, through simple decomposition methods. The researchers, therefore, believe that the proposed spatiotemporal methodology could be a simpler, and quicker, alternative to studying drivers to carbon emissions on a regional and international level.

5. Conclusions

In this section, the policy recommendations that were discussed are summarized in bullet form below, followed by the conclusion that talks about the key findings in the study.
With the looming dangers of climate change, it is imperative to research energy patterns and build upon existing policies. In conducting the study, a spatiotemporal analysis was used based on the logarithmic mean Divisia index method in order to determine drivers to carbon emissions in the ASEAN region. With this, the performance and emissions of each country were compared with each other. Additionally, the overall evolution of carbon emissions in the entire region was analyzed in order to, not only, examine its general direction but also to prepare and be aware of the possible courses of action to either abate emissions or maintain low emission values.
The most influential drivers to carbon emissions in more recent years are the population, economic activity, and energy intensity effects. The ASEAN nations managed to decrease carbon emissions through changes in their respective economic structures. Singapore had the greatest decrease from both population and intensity effects, while the majority of its emissions come from its economic activity. Indonesia was found to have an alarming contribution due to its population growth, suggesting significant human activity. Additionally, it was found that Vietnam was the most energy intensive country in ASEAN up until 2018. The spatial and temporal analyses also show that Brunei Darussalam, Myanmar, Cambodia, and Lao PDR emit the least carbon due to all indices in relation to the rest of the ASEAN. Finally, the Philippines, Malaysia, and Thailand, which are members of the DA5, seem to be on a transition period to less carbon intensive economic sectors.
Both spatial and temporal analyses have provided much needed insight on the overall performance of each country as well as the general evolution of the region’s emissions. From these insights, the researchers were not only able to benchmark the best and worst performing countries, but also derive possible courses of action for the region.
  • Reiterating commitments and obligations in reducing emissions from deforestation and forest degradation (REDD+) and their Intended Nationally Determined Contributions (INDC) as submitted to the UN;
  • Implementing strict penalties and tougher measures [57] for various sectors and industries that continually emit more than the recommended emission limits with respect to past obligations and pledges;
  • Actively disincentivizing illegal logging and deforestation efforts in terms of ease, concessions, and income, given that these actions greatly contribute to GHG emissions in the ASEAN;
  • Increasing levels of ambition in mitigating carbon emissions, in order to hasten its reduction and make countries more economically efficient;
  • Conducting in-depth analyses and studies on each country’s energy use patterns and economic behavior in order to facilitate energy efficiency and formulate timely carbon reduction policies and procedures;
  • Encouraging research and development efforts which monitor consumption patterns and revise policies accordingly.
Alternatively speaking, it is recommended for countries to play to their strengths by studying their own energy consumption and economic performance. Through this, specific practices and policies can be made. The results obtained from the study support the previous sentiment from related literature that each country is unique, with their own strengths and weaknesses.
Additionally, aside from their differences, each country is in different stages of development. Singapore and Brunei are in the developed stage already, while countries like Vietnam and Thailand are still in the rapidly developing stage. Other countries were observed to follow different trajectories as well. In conclusion, the researchers therefore hope that the ASEAN would recognize that these different countries would need different kinds of support. Reiterating the Treaty of Amity and Cooperation in Southeast Asia, member nations are encouraged to actively cooperate with, and support, neighboring countries in order to guide the region in the transition to sustainable practices.

Author Contributions

Conceptualization, N.S.A.L. and E.B.F.L.J.; methodology, N.S.A.L. and E.B.F.L.J.; formal analysis, N.S.A.L. and E.B.F.L.J.; writing—original draft preparation, E.B.F.L.J.; writing—review and editing, N.S.A.L. All authors have read and agreed to the published version of the manuscript.

Funding

The APC was funded by the Office of the Vice Chancellor for Research and Innovation of De La Salle University, Manila, Philippines. At the time of writing, Edwin Bernard F. Lisaba was receiving scholarship funding from the Department of Science and Technology—Engineering Research and Development for Technology Program for his Master of Science in Mechanical Engineering degree.

Institutional Review Board Statement

Not applicable.

Informed Consent Statement

Not applicable.

Data Availability Statement

The data presented in this study are openly available from the World Bank and the International Energy Agency.

Conflicts of Interest

The authors declare no conflict of interest.

References

  1. NOAA National Centers for Environmental Information. State of the Climate: Global Climate Report for Annual 2020. Available online: https://www.ncdc.noaa.gov/sotc/global/202013 (accessed on 30 April 2021).
  2. Intergovernmental Panel on Climate Change. Fourth Assessment Report; Intergovernmental Panel on Climate Change: Geneva, Switzerland, 2007. [Google Scholar]
  3. Intergovernmental Panel on Climate Change. Fifth Assessment Report; Intergovernmental Panel on Climate Change: Geneva, Switzerland, 2014. [Google Scholar]
  4. World Health Organization. Climate Change and Health. Available online: https://www.who.int/news-room/fact-sheets/detail/climate-change-and-health (accessed on 30 April 2021).
  5. Overview, Association of Southeast Asian Nations. Available online: https://asean.org/asean/about-asean/overview/ (accessed on 30 April 2021).
  6. Hill, H. Southeast Asian studies: Economics. Int. Encycl. Soc. Behav. Sci. 2001, 14670–14676. [Google Scholar] [CrossRef]
  7. Bhaskaran, M. Getting Singapore in Shape: Economic Challenges and How to Meet Them; Lowy Institute for International Policy: Sydney, Australia, 2018. [Google Scholar]
  8. Findlay, R.; Park, C.Y.; Verbiest, J.P. Myanmar: Unlocking the potential—A strategy for high, sustained, and inclusive growth. ADB Econ. Work. Paper Ser. 2015, 437. [Google Scholar] [CrossRef] [Green Version]
  9. Treaty of Amity and Cooperation in Southeast Asia Indonesia, 24 February 1976, Association of Southeast Asian Nations. Available online: https://asean.org/treaty-amity-cooperation-southeast-asia-indonesia-24-february-1976/ (accessed on 30 April 2021).
  10. NOAA National Centers for Environmental Information. Frequently Asked Questions. Available online: https://www.aoml.noaa.gov/hrd-faq/#1569507388495-a5aa91bb-254c (accessed on 30 April 2021).
  11. Asian Development Bank. The Economics of Climate Change in Southeast Asia: A Regional Review; Asian Development Bank: Mandaluyong City, Philippines, 2008; p. 24. [Google Scholar]
  12. Nunti, C.; Somboon, K.; Intapan, C. The impact of climate change on agriculture sector in ASEAN. In Proceedings of the Conference Series, Guilin, China, 25 November 2020. [Google Scholar]
  13. National Disaster Risk Reduction and Management Council. NDRRMC Update: Sitrep No. 26 re Preparedness Measures and Effects for Typhoon “Ulysses” (I.N. Vamco). Available online: https://ndrrmc.gov.ph/attachments/article/4138/SitRep_no_26_re_TY_ULYSSES_as_of_06DEC2020.pdf (accessed on 30 April 2021).
  14. ASEAN Cooperation on Climate Change, Association of Southeast Asian Nations. Available online: https://environment.asean.org/asean-working-group-on-climate-change/ (accessed on 30 April 2021).
  15. De Boer, P.; Rodrigues. Decomposition analysis: When to use which method? Econ. Syst. Res. 2020, 32, 1–28. [Google Scholar] [CrossRef]
  16. Ang, B.W.; Zhang, F.Q. A survey of index decomposition analysis in energy and environmental studies. Energy 2000, 25, 1149–1176. [Google Scholar] [CrossRef]
  17. Hoekstra, R.; van den Bergh, J. Structural decomposition analysis of physical flows in the economy. Environ. Resour. Econ. 2002, 23, 357–378. [Google Scholar] [CrossRef]
  18. Sumabat, A.K.; Lopez, N.S.; Yu, K.D.; Hao, H.; Li, R.; Geng, Y.; Chiu, A.S.F. Decomposition analysis of Philippine CO2 emissions from fuel combustion and electricity generation. Appl. Energy 2016, 164, 795–804. [Google Scholar] [CrossRef]
  19. Nie, H.; Kemp, R. Why did energy intensity fluctuate during 2000–2009? A combination of index decomposition analysis and structural decomposition analysis. Energy Sustain. Dev. 2013, 17, 482–488. [Google Scholar] [CrossRef]
  20. Jurkėnaitė, N.; Baležentis, T. The ‘pure’ and structural contributions to the average farm size growth in the EU: The index decomposition approach. Ecol. Indic. 2020, 117, 117. [Google Scholar] [CrossRef]
  21. Chong, C.H.; Tan, W.X.; Ting, Z.J.; Liu, P.; Ma, L.; Li, Z.; Ni, W. The driving factors of energy-related CO2 emission growth in Malaysia: The LMDI decomposition method based on energy allocation analysis. Renew. Sustain. Energy Rev. 2019, 115, 115. [Google Scholar] [CrossRef]
  22. Chontanawat, J.; Wiboonchutikula, P.; Buddhivanich, A. An LMDI decomposition analysis of carbon emissions in the Thai manufacturing sector. Energy Rep. 2020, 6, 705–710. [Google Scholar] [CrossRef]
  23. Boey, A.; Su, B. Low-carbon Transport Sectoral Development and Policy in Hong Kong and Singapore. Energy Proc. 2014, 61, 313–317. [Google Scholar] [CrossRef] [Green Version]
  24. Li, J.; Chen, Y.; Li, Z.; Huang, X. Low-carbon economic development in Central Asia based on LMDI decomposition and comparative decoupling analyses. J. Arid Land 2019, 11, 513–524. [Google Scholar] [CrossRef] [Green Version]
  25. Wang, F.; Wang, C.; Chen, J.; Li, Z.; Li, L. Examining the determinants of energy-related carbon emissions in Central Asia: Country-level LMDI and EKC analysis during different phases. Environ. Dev. Sustain. 2020, 22, 7743–7769. [Google Scholar] [CrossRef]
  26. Zhang, J.; Fan, Z.; Chen, Y.; Gao, J.; Liu, W. Decomposition and decoupling analysis of carbon dioxide emissions from economic growth in the context of China and the ASEAN countries. Sci. Total Environ. 2020, 714. [Google Scholar] [CrossRef]
  27. Hill, H.; Menon, J. ASEAN Economic Integration: Features, Fulfillments, Failures and the Future; Asian Development Bank: Mandaluyong City, Philippines, 2010. [Google Scholar]
  28. Data and Statistics, International Energy Agency. Available online: https://www.iea.org/data-and-statistics?country=WORLD&fuel=Energy%20supply&indicator=TPESbySource (accessed on 30 April 2021).
  29. Intergovernmental Panel on Climate Change (IPCC). 1996 IPCC Guidelines for National Green House Gas Inventories; Intergovernmental Panel on Climate Change: Geneva, Switzerland, 1996. [Google Scholar]
  30. Environmental Protection Agency. Emission Factors for Greenhouse Gas Inventories; Environmental Protection Agency: Washington, DC, USA, 2014. [Google Scholar]
  31. U.S. Energy Information Administration (EIA). How Much Carbon Dioxide is Produced When Different Fuels are Burned? 2020. Available online: https://www.eia.gov/tools/faqs/faq.php?id=73&t=11 (accessed on 30 April 2021).
  32. Ang, B.W. The LMDI approach to decomposition analysis: A practical guide. Energy Policy 2005, 33, 867–871. [Google Scholar] [CrossRef]
  33. World Bank Open Data, The World Bank. Available online: https://data.worldbank.org/ (accessed on 30 April 2021).
  34. Vu, K. Sources of Singapore’s economic growth 1990-2009. Macroecon. Rev. 2010, 4, 66–81. [Google Scholar] [CrossRef]
  35. Lee, C. Globalization and economic development: Malaysia’s experience. ERIA Discuss. Paper Ser. 2019, 307, 2–6. [Google Scholar]
  36. Cima, R. Vietnam’s economic reform: Approaching the 1990s. Asian Surv. 1989, 29, 786–799. [Google Scholar] [CrossRef]
  37. The World Bank. Vietnam’s Economic Prospects Improve Further, with GDP Projected to Expand by 6.8 Percent in 2018. Available online: https://www.worldbank.org/en/news/press-release/2018/06/14/vietnams-economic-prospect-improves-further-with-gdp-projected-to-expand-by-68-percent-in-2018#:~:text=Hanoi%2C%20June%2014%2C%202018%20%2D,accompanied%20by%20broad%20macroeconomic%20stability.&text=Real%20GDP%20expanded%20nearly%207.4,at%203.1%20percent%20in%202018 (accessed on 30 April 2021).
  38. Raitzer, D.A.; Bosello, F.; Tavoni, M.; Orecchia, C.; Marangoni, G.; Samson, J.N.G. Southeast Asia and the Economics of Global Climate Stabilization; Asian Development Bank: Mandaluyong City, Philippines, 2015; pp. 21–24. [Google Scholar]
  39. Sjahrir. The Indonesian economy facing the 1990s: Structural transformation and economic deregulation. Southeast Asian Aff. 1990, 117–131. [Google Scholar] [CrossRef]
  40. National Climate Change Secretariat. Singapore’s Climate Action Plan: Take Action Today, for a Carbon-Efficient Singapore; Prime Minister’s Office: Singapore, 2016; pp. 6–7. [Google Scholar]
  41. Data Help Desk, The World Bank. Available online: https://datahelpdesk.worldbank.org/knowledgebase/articles/906519-world-bank-country-and-lending-groups (accessed on 23 May 2021).
  42. Eldeeb, O.; Prochazka, P.; Maitah, M. Causes for deforestation in Indonesia: Corruption and palm tree plantation. Asian Soc. Sci. 2015, 11, 120. [Google Scholar] [CrossRef] [Green Version]
  43. Makkarennu, M.; Nakayasu, A.; Osozawa, K.; Ichikawa, M. An analysis of the demand market of Indonesia plywood in Japan. Int. J. Sustain. Future Hum. Secur. 2015, 2, 2–7. [Google Scholar] [CrossRef] [PubMed]
  44. Jaenicke, J.; Rieley, J.; Mott, C.; Kimman, P. Determination of the amount of carbon stored in Indonesian peatlands. Geoderma 2008, 147, 151–158. [Google Scholar] [CrossRef]
  45. World Resources Institute. Available online: https://www.wri.org/insights/interactive-chart-shows-changes-worlds-top-10-emitters (accessed on 30 April 2021).
  46. UN-REDD Programme. Available online: https://www.un-redd.org/ (accessed on 30 April 2021).
  47. Office of Natural Resources and Environmental Policy and Planning. Thailand’s Second National Communication under the United Nations Framework Convention on Climate Change; Ministry of Natural Resources and Environment: Bangkok, Thailand, 2011; pp. 15–16. [Google Scholar]
  48. Le, P.V. Energy demand and factor substitution in Vietnam: Evidence from two recent enterprise surveys. J. Econ. Struct. 2019, 8, 35. [Google Scholar] [CrossRef]
  49. Singapore: A Global Hub for Innovation, Forbes. Available online: https://www.forbes.com/custom/2018/08/13/singapore-a-global-hub-for-innovation/ (accessed on 30 April 2021).
  50. International Council on Clean Transportation. EU CO2 Emission Standards for Passenger Cars and Light-Commercial Vehicles. Available online: https://theicct.org/sites/default/files/publications/ICCTupdate_EU-95gram_jan2014.pdf (accessed on 30 April 2021).
  51. Tucker, M. Carbon dioxide emissions and global GDP. Ecol. Econ. 1995, 15, 215–223. [Google Scholar] [CrossRef]
  52. Fernández González, P.; Landajo, M.; Presno, M.J. Tracking European CO2 emissions through LMDI (logarithmic-mean Divisia index) decomposition. The activity revaluation approach. Energy 2014, 73, 741–750. [Google Scholar] [CrossRef]
  53. Moutinho, V.; Moreira, A.; Silva, P. The driving forces of change in energy-related CO2 emissions in Eastern, Western, Northern and Southern Europe: The LMDI approach to decomposition analysis. Renew. Sustain. Energy Rev. 2015, 50, 1485–1499. [Google Scholar] [CrossRef]
  54. De Oliveira-De Jesus, P. Effect of generation capacity factors on carbon emission intensity of electricity of Latin America & the Caribbean, a temporal IDA-LMDI analysis. Renew. Sustain. Energy Rev. 2019, 101, 516–526. [Google Scholar] [CrossRef]
  55. Lin, S.; Beidari, M. Energy Consumption Trends and Decoupling Effects between Carbon Dioxide and Gross Domestic Product in South Africa. Aerosol Air Qual. Res. 2015, 15. [Google Scholar] [CrossRef] [Green Version]
  56. Chen, J.; Wang, P.; Cui, L.; Huang, S.; Song, M. Decomposition and decoupling analysis of CO2 emissions in OECD. Appl. Energy 2018, 231, 937–950. [Google Scholar] [CrossRef]
  57. Vallés-Giménez, J.; Zárate-Marco, A. A Dynamic Spatial Panel of Subnational GHG Emissions: Environmental Effectiveness of Emissions Taxes in Spanish Regions. Sustainability 2020, 12, 2872. [Google Scholar] [CrossRef] [Green Version]
Figure 1. ASEAN total fuel consumption.
Sustainability 13 06183 g001
Figure 2. (a) Δ C a c t vs. Δ C i n t (Spatial Analysis). Legend: Brunei Darussalam (BRN), Cambodia (KHM), Indonesia (IDN), Lao PDR (LAO), Malaysia (MYS), Myanmar (MMR), Philippines (PHL), Singapore (SGP), Thailand (THA), Vietnam (VNM). (b) Δ C a c t vs. Δ C i n t (Temporal Analysis).
Sustainability 13 06183 g002
Figure 3. (a) Δ C a c t vs. Δ C s t r u c (Spatial Analysis). (b) Δ C a c t vs. Δ C s t r u c (Temporal Analysis).
Sustainability 13 06183 g003
Figure 4. (a) Δ C p o p vs. Δ C i n t (Spatial Analysis). (b) Δ C p o p vs. Δ C i n t (Temporal Analysis).
Sustainability 13 06183 g004
Figure 5. (a) Δ C s t r u c vs. Δ C i n t (Spatial Analysis). (b) Δ C s t r u c vs. Δ C i n t . (Temporal Analysis).
Sustainability 13 06183 g005
Figure 6. GNI per Capita vs. CO2 emissions.
Sustainability 13 06183 g006
Table 1. Findings in the Study.
Country20002018
Δ C p o p Δ C a c t Δ C s t r u c Δ C i n t Δ C p o p Δ C a c t Δ C s t r u c Δ C i n t
Brunei Darussalam−53,90029,766−725−21,878−119,68947,230−2023−41,287
Cambodia−17,088−19,738−2210−10,981−50,666−49,485−47522534
Indonesia162,458−13,949−22301403337,352−15,896323−3990
Lao PDR−28,034−15,496−3423−2608−73,450−33,618−21464455
Malaysia−50,66273,9782036−2551−91,378125,6911950−26,252
Myanmar−2832−45,832−15,98020,816−11,282−58,886−2061−16,935
Philippines19,228−13,358−517−493147,315−30,947−2820−29,502
Singapore−69,15971,7902281−37,326−174,585181,263−2046−73,805
Thailand15,56138,437−35519,44010,59665,663−77920,045
Vietnam21,556−53,960−466736,92359,867−143,680−2514174,717
Publisher’s Note: MDPI stays neutral with regard to jurisdictional claims in published maps and institutional affiliations.

