Article

Sustainable Second-Generation Bioethanol Production from Enzymatically Hydrolyzed Domestic Food Waste Using Pichia anomala as Biocatalyst

by
Ioanna Ntaikou
1,*,
Georgia Antonopoulou
1 and
Gerasimos Lyberatos
1,2
1
Institute of Chemical Engineering Sciences, Foundation for Research and Technology, 26504 Patra, Greece
2
School of Chemical Engineering, National Technical University of Athens, 15780 Athens, Greece
*
Author to whom correspondence should be addressed.
Sustainability 2021, 13(1), 259; https://doi.org/10.3390/su13010259
Submission received: 1 December 2020 / Revised: 23 December 2020 / Accepted: 24 December 2020 / Published: 30 December 2020

Abstract

:
In the current study, a domestic food waste containing more than 50% of carbohydrates was assessed as feedstock to produce second-generation bioethanol. Aiming to the maximum exploitation of the carbohydrate fraction of the waste, its hydrolysis via cellulolytic and amylolytic enzymatic blends was investigated and the saccharification efficiency was assessed in each case. Fermentation experiments were performed using the non-conventional yeast Pichia anomala (Wickerhamomyces anomalus) under both separate hydrolysis and fermentation (SHF) and simultaneous saccharification and fermentation (SSF) modes to evaluate the conversion efficiencies and ethanol yields for different enzymatic loadings. It was shown that the fermentation efficiency of the yeast was not affected by the fermentation mode and was high for all handlings, reaching 83%, whereas the enzymatic blend containing the highest amount of both cellulolytic and amylolytic enzymes led to almost complete liquefaction of the waste, resulting also in ethanol yields reaching 141.06 ± 6.81 g ethanol/kg waste (0.40 ± 0.03 g ethanol/g consumed carbohydrates). In the sequel, a scale-up fermentation experiment was performed with the highest loading of enzymes in SHF mode, from which the maximum specific growth rate, μmax, and the biomass yield, Yx/s, of the yeast from the hydrolyzed waste were estimated. The ethanol yields that were achieved were similar to those of the respective small scale experiments reaching 138.67 ± 5.69 g ethanol/kg waste (0.40 ± 0.01 g ethanol/g consumed carbohydrates).

1. Introduction

Biofuels, i.e., fuels that are produced from biomass via biological, thermal, or chemical processes, are regarded among the key renewable energy carriers that can contribute to the sustainable development of economies. Among them, bioethanol and its blends have been widely used as alternative liquid fuel for transportation, solely or blended with conventional fossil fuels or biodiesel—in the latter case resulting in a fuel with improved combustion characteristics [1]. Bioethanol is generated by different yeasts and bacteria as the end metabolic product of sugar fermentation. In recent decades, numerous research studies have been devoted to the optimization of the alcoholic fermentation of different wastes and residues to produce fuel ethanol, focusing on enhancing bioconversion efficiency, ethanol yields, and the achievement of higher titers [2]. Sustainable large-scale bioethanol production, however, can only be assured if based on the bioconversion of biomass types that are abundant, renewable, and low or even zero cost, and preferably biomasses that require minimal pretreatment in order to become exploitable.
Domestic food wastes (DFWs) do gather all those characteristics: zero cost and rich in carbohydrates and nutrients that can efficiently support microbial growth and efficient fermentation. They are also a universal resource since they are generated throughout the year in huge quantities in both developed and developing countries. The exploitation of DFW as feedstock for bioethanol production is not only feasible, but also desirable since its conventional management methodology in most countries is the disposal to landfills, where it decomposes slowly releasing greenhouse gases and affecting ecological balances [3]. Indeed, the attempt of valorizing DFW for bioethanol generation as a management strategy may contribute greatly to the Sustainable Development Goal (SDG) 12.3 of the European Union, according to which the global Food waste (FW) per capita at the retail and consumer level should be halved by 2030 [4].
Bioethanol production from various carbohydrate-based substrates and wastes such as DFW has been explored by many researchers that have proposed different fermentation strategies via monocultures of bacteria or yeasts [5,6,7,8,9,10] but also co-cultures of yeasts, fungi, and bacteria [11,12,13,14,15]. Unlike other types of biomass, such as agricultural and forestry residues, prunings, olive mill wastes, etc. that have been used for bioethanol production [16,17,18,19,20] and other biofuels [21,22,23,24,25], DFW does not require any extensive thermal, chemical, or thermochemical pretreatment step to facilitate its subsequent bioconversion from microorganisms. This is due to its high content in readily bioconvertible compounds and nutrients that make DFW an easily fermentable substrate by various microorganisms, especially when fermentation is facilitated by enzymatic hydrolysis. Indeed, regardless of its origin, FW has, in general, a high carbohydrate content but the ratio of soluble, i.e., readily fermentable, to complex, i.e., requiring hydrolysis, carbohydrates may vary significantly [26,27,28]. As such, depending on the dietary habits of each country, DFW may contain large amounts of starch and cellulose, both of which need to be saccharified to be efficiently fermented. Such saccharification can be achieved chemically [29,30], thermochemically [31,32], or enzymatically by the addition, in the latter case, of amylolytic and/or cellulolytic enzymes under adequate conditions [18,33].
In this context, the current study investigated the effect of enzymatic hydrolysis via different combinations of enzymatic mixtures, on the saccharification of DFW and the subsequent alcoholic fermentation of the waste using the non-conventional yeast Pichia anomala. P. anomala was selected as the biocatalyst since it has been shown to be quite promising for bioethanol production from other types of food wastes and residues [34,35,36,37], reaching ethanol yields up to 90% of the theoretical maximum. Moreover, P. anomala is a physiologically versatile species that can uptake and ferment a wide range of carbon sources and is quite tolerant of environments with low pH and high osmotic pressure. Apart from ethanol, different P. anomala strains generate oils and biosulfactants as end products of their metabolism, thus, making the species an attractive biocatalyst for different biotechnological applications [36]. To our knowledge, it is the first time that P. anomala is utilized to produce ethanol from DFW.

2. Materials and Methods

2.1. Food Waste

The DFW that was used in the current study was kitchen biowastes from which non-biodegradable wastes (such as plastic wrap, foil, etc.) and meat bones were excluded and which was collected weekly from the Municipality of Halandri, Athens, Greece during the period 2016–2019. Upon collection, DFW was heat-dried at 92 °C for 2 h and milled, resulting in a homogeneous product containing 91.28 ± 0.75 total solids (TSs), 21.4 ± 2.25% sugars/TSs, 16.1 ± 1.54% starch/TSs, and 14.8 ± 1.76% holocellulose/TS. The complete characterization of the waste is available in Table S1). The final product, called food residue biomass (FORBI), could be stored at ambient temperature in a low humidity environment, remaining stable for a long period without any degradation observed [38].

2.2. Enzymatic Saccharification

Enzymatic hydrolysis of FORBI was performed in duplicates at pH 4.8 and 50 °C and with a solid loading of 10% TS FORBI/v. For the pH adjustment, 0.1 M sodium acetate buffer was used. To avoid bacterial contamination, 2‰ sodium azide was added to the suspension. The saccharification of FORBI was assessed by its supplementation with three different commercial enzymes, i.e., a cellulase blend, CE (Cellic CTec2-CEL, Sigma-Aldrich); a fungal α-amylase, FA (α-amylase from Aspergillus oryzae, Sigma-Aldrich); and an amyloglucosidase, A, (amyloglucosidase from Aspergillus niger, Sigma-Aldrich). The CE was used initially solely in enzymatic loadings 2–30 FPU/g TS (CE1-CE5), targeting the hydrolysis of holocellulose of the waste. Subsequently, different enzymatic mixtures (EM1-EM5) of CE, FA, and A at different enzymatic loadings were tested, targeting simultaneous hydrolysis of starch and holocellulose. The range of enzymatic loadings in each case was based on the content of cellulose and starch of the waste and on previous studies with similar wastes [18,39]. The composition of the different enzymatic mixtures is shown in Table 1.

2.3. Bioethanol Production

2.3.1. Preparation of Inoculum

A liquid preculture was prepared from a stock culture of P. anomala in yeast peptone dextrose (YPD) agar, which was stored at 4 °C. Specifically, one or more loopfuls of single colonies of P. anomala were transferred from the solid culture into 50 mL/loopful of YPD medium and the new culture was incubated at 30 °C and 150 rpm overnight (OD550 ∼ 2.000). Then, an aliquot of the culture corresponding to 5% of the working volume of each fermentation experiment was removed and centrifuged under aseptic conditions and the pellet was suspended under aseptic conditions in sterilized 1% KH2PO4 and was used for the inoculation of the new cultures.

2.3.2. Fermentation Experiments

The non-conventional yeast P. anomala, strain X19, MH237950.1 [18,36], was used in all fermentation experiments, with FORBI being the sole carbon source at a solids loading of 10% (w TS/v). Ethanol production from FORBI was initially assessed in batch mode using 160 mL serum vials with a working volume of 25 mL. All cultures were performed in duplicate, at 30 °C, constant agitation at 150 rpm, and under anaerobic, non-pressurized conditions as described by Ben Atitallah et al. [18]. The fermentation media were supplemented with KH2PO4, MgCl2.6H2O, and (NH4)2SO4 1 g/L each. No pH control was required as previously proposed by Ntaikou et al. for the same waste [39]. The starting pH value in all fermentation experiments was 4.6 ± 0.0; during the fermentation process, the pH was self-regulated at 4.8 ± 0.1. The bioconversion of the waste to ethanol was assessed via both separate hydrolysis and fermentation (SHF) and simultaneous saccharification and fermentation (SSF) experiments. In SSF experiments, the fermentation media were supplemented with either CE (10 FPU/g TS, 30 FPU/g) or the enzymatic mixtures EM3 and EM5 (Table 1). For SHF experiments, the same enzymatic blend/mixtures were added to the medium prior to inoculation and the hydrolysis step was performed at 50 °C and 150 rpm for 24 h. The enzymes were then inactivated by thermal treatment at 100 °C for 10 min. Subsequently, a scale-up experiment was carried out in duplicate in fermenters with 1 L working volume with the best performing enzymatic blend, EM5. Fermentation was conducted at 30 °C, constant agitation at 150 rpm, and pH 4.7 ± 0.2; under anaerobic, non-pressurized conditions using 10% TS FORBI (w/v) as the sole carbon source; and with KH2PO4, MgCl2·6H2O, and (NH4)2SO4 1 g/L each. As in the case of the serum bottle experiment, FORBI was subjected to enzymatic hydrolysis for 24 h at 50 °C. The enzymes were inactivated thermally and the solubilized waste was then inoculated with P. anomala. The uptake of carbohydrates, ethanol production, and pH were followed versus time and the data were used for the assessment of the kinetics of the fermentation.

2.4. Analytical Methods

The determinations of total solids (TSs), volatile solids (VSs), and Total Kjeldahl Nitrogen (TKN) were performed according to standard methods [40]. Crude protein content was estimated by multiplying TKN by a factor of 6.25 [41]. Lipids and oils were quantified via a Soxhlet apparatus [42]. For the quantification of soluble carbohydrates and reducing sugars, the DuBois method [43] and the Miller [44] protocols were used, respectively. Starch content was quantified via a total starch assay kit (Megazyme Ltd.). Lignin, cellulose, and hemicellulose were quantified according to Sluiter et al. [45]. Ethanol content was measured via HPLC-RI, at 60 °C, via an isocratic method with H2SO4 0.006 N as eluent and flow rate of 0.7 mL/min and an Aminex HPX–87H column (Biorad Laboratories, CA, USA).

2.5. Calculations

The efficiency of the enzymatic hydrolysis due to supplementation with different enzymes was assessed by estimating the saccharification efficiency, SE, using Equation (1). The efficiency of alcoholic fermentation was assessed by estimating bioethanol yields in terms of carbohydrate uptake, YE/S, and initial feedstock bioconversion, YE/FORBI, using Equations (2) and (3) respectively, as well as via the estimation of fermentation efficiency, FE, according to Equation (4):
S E % = Final   concentration   of   sugars initial   concentration   of   sugars   g / L Initial   concentration   of   insoluble   carbohydrates   g / L
Y E / S   g / g =   Bioethanol   concentration   g / L Total   utilized   sugar   g / L
Y E / F O R B I g / kg   = Bioethanol   concentration   g / L FORBI   concentration   kg / L
F E   % = Obtained   yield   g Theoretical   yield   g   · 100
where the theoretical ethanol yield was assumed to be 0.51 g/g sugars according to the Guy Lussac chemical equation for the alcoholic fermentation of glucose
C 6 H 12 O 6   2 C 2 H 5 OH   + 2 CO 2
1 mol = 180 g       2 mol = 92 g

2.6. Statistical Analysis of Data

After checking for homogeneity of the variance (Levene’s test of equality of error variances), the significant differences among the data of each set of experiments were assessed non-parametrically, using the Mann Whitney u-test (p < 0.05, ANOVA) via the SPSS Inc.17 software package (IMB, New York, USA).

2.7. Kinetics Expressions and Simulation of Data

The assessment of the fermentation kinetics of P. anomala during consumption of the carbohydrate content of FORBI was based on the Monod-type expressions that were previously proposed by Ben Atitallah et al. [36] and are described by Equations (6)–(11), accounting for the substrate consumption rate, (Equation (6)), microbial growth rate (Equation (7)), microbial decay rate (Equation (8)), substrate inhibition of growth (Equation (9)), product inhibition (Equation (10)), and ethanol production rate (Equation (11)). The experimental data of ethanol production and consumption of sugars from the kinetic experiment were simulated in order to estimate the maximum specific growth rate, μmax, and the microbial biomass yield, YX/S, of the yeast during fermentation of the hydrolyzed carbohydrate content of FORBI. For the decay constant, kd, and the estimation of inhibition factors, IS (substrate inhibition) and IP (product inhibition), the values that were proposed by Ben Atitallah et al. [36] were used (kd, = 0.06 ± 0.01 h−1, KIS, 102.52 ± 1.91 g/L, and KIP, 42.18 ± 2.43 g/L) assuming that they are not affected by the type of carbohydrates serving as carbon source. The value of ethanol yield, YP/S, was estimated by the experimental data of the kinetic experiment. Fitting of the data and parameter estimation was performed using the AQUASIM 2.0 computer software [46].
d S d t = μ max S K S + S 1 Y X / S X I S I P
d X d t = μ max S K S + S X I S I P
d X d t = k d X
I S = K I S K I S + S
I P = K I P K I P + P
d P d t = Y P S μ max S K S + S 1 Y X / S X I S I P

3. Results and Discussion

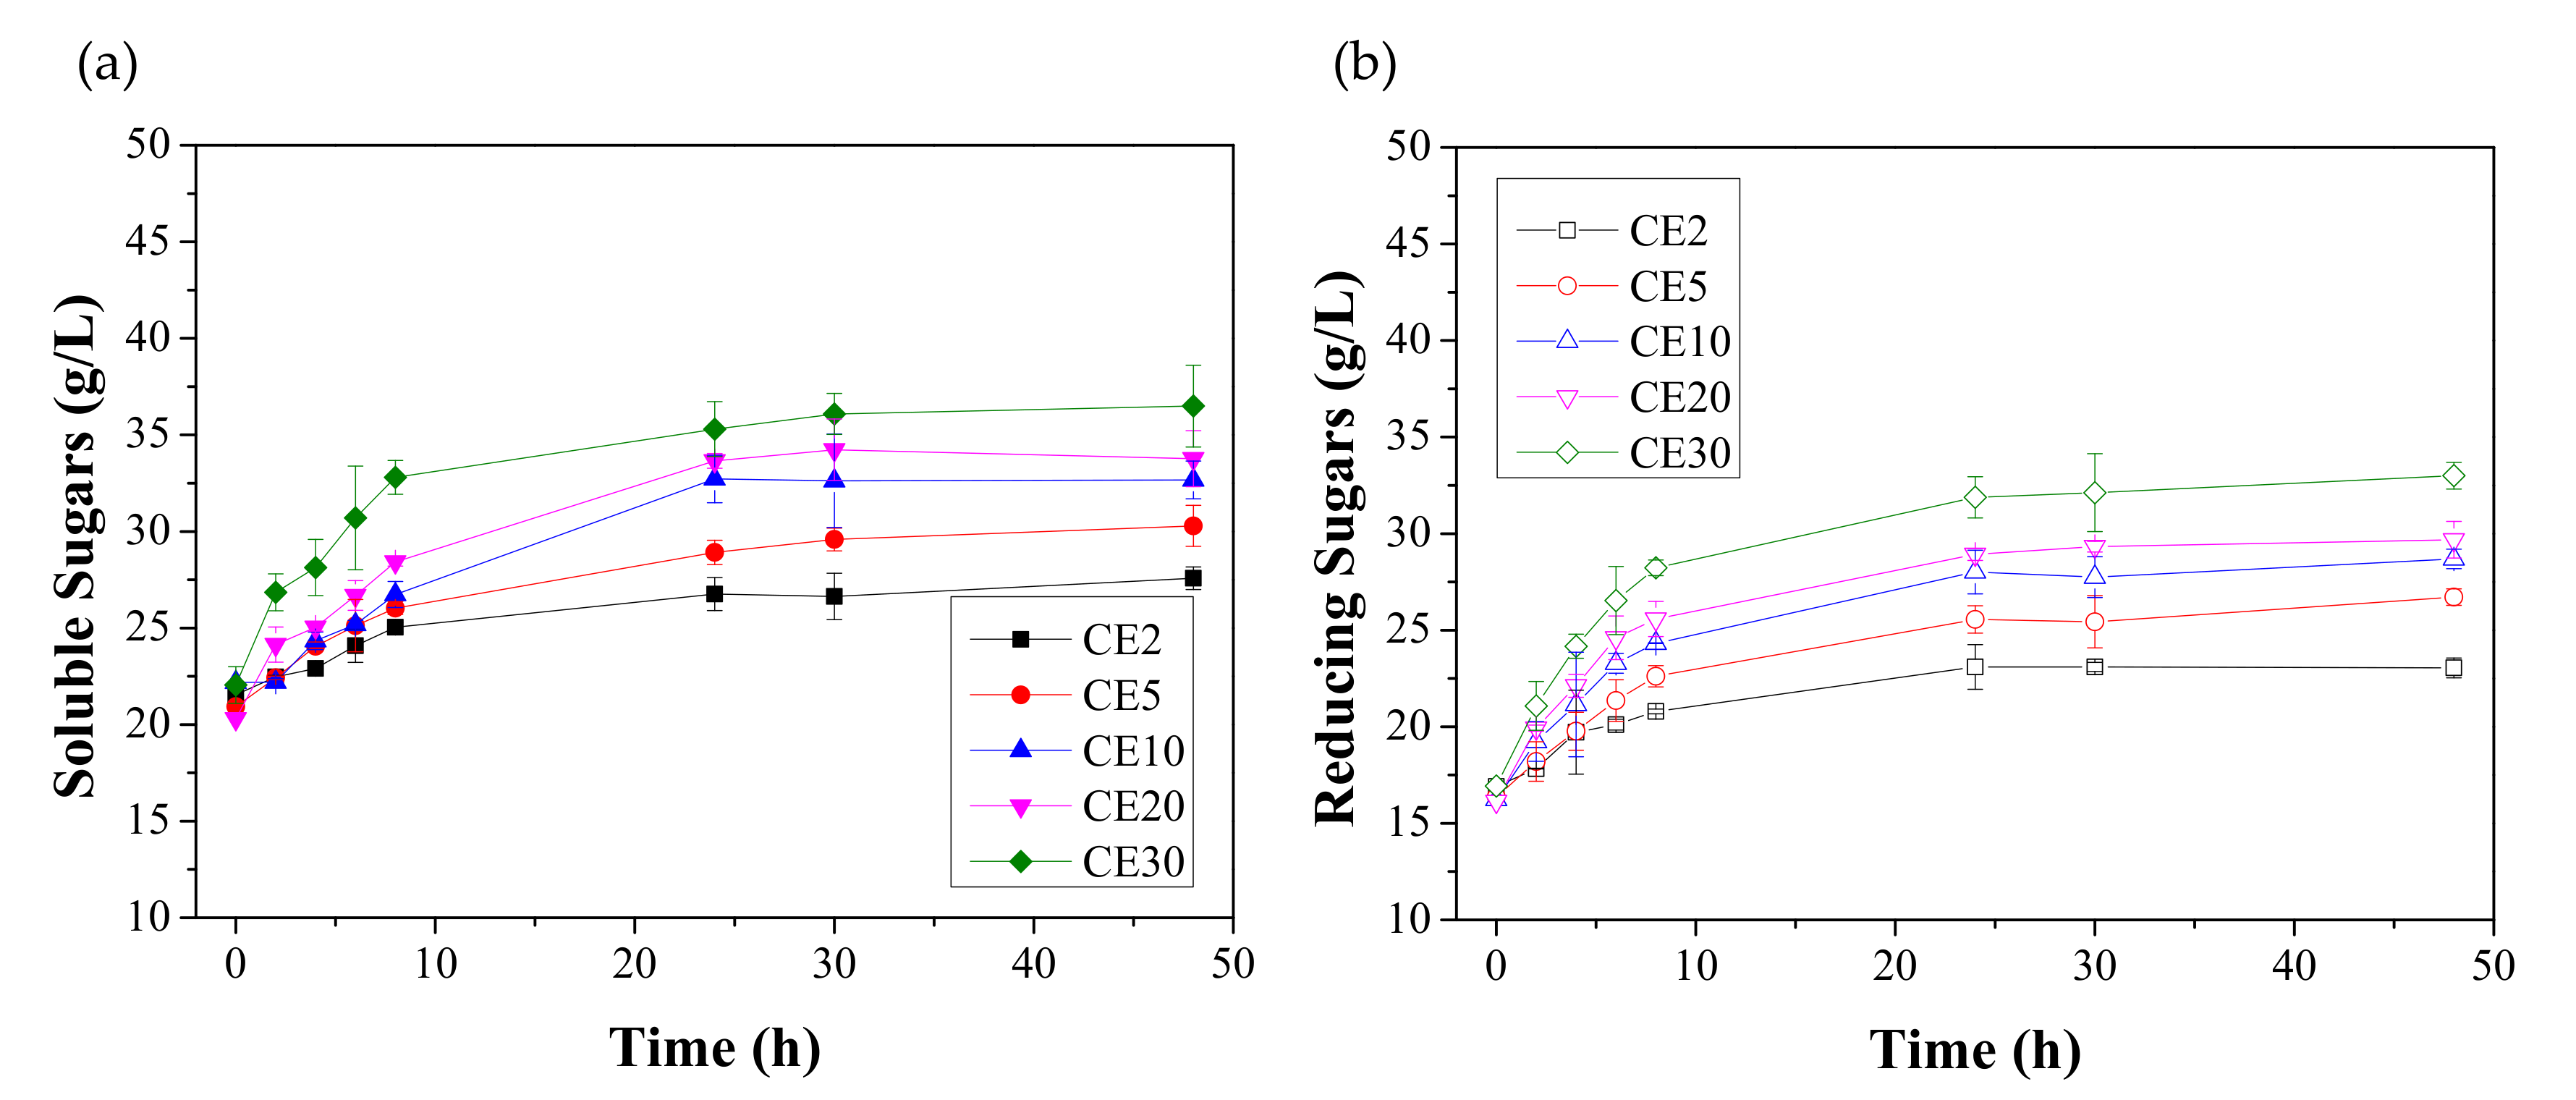
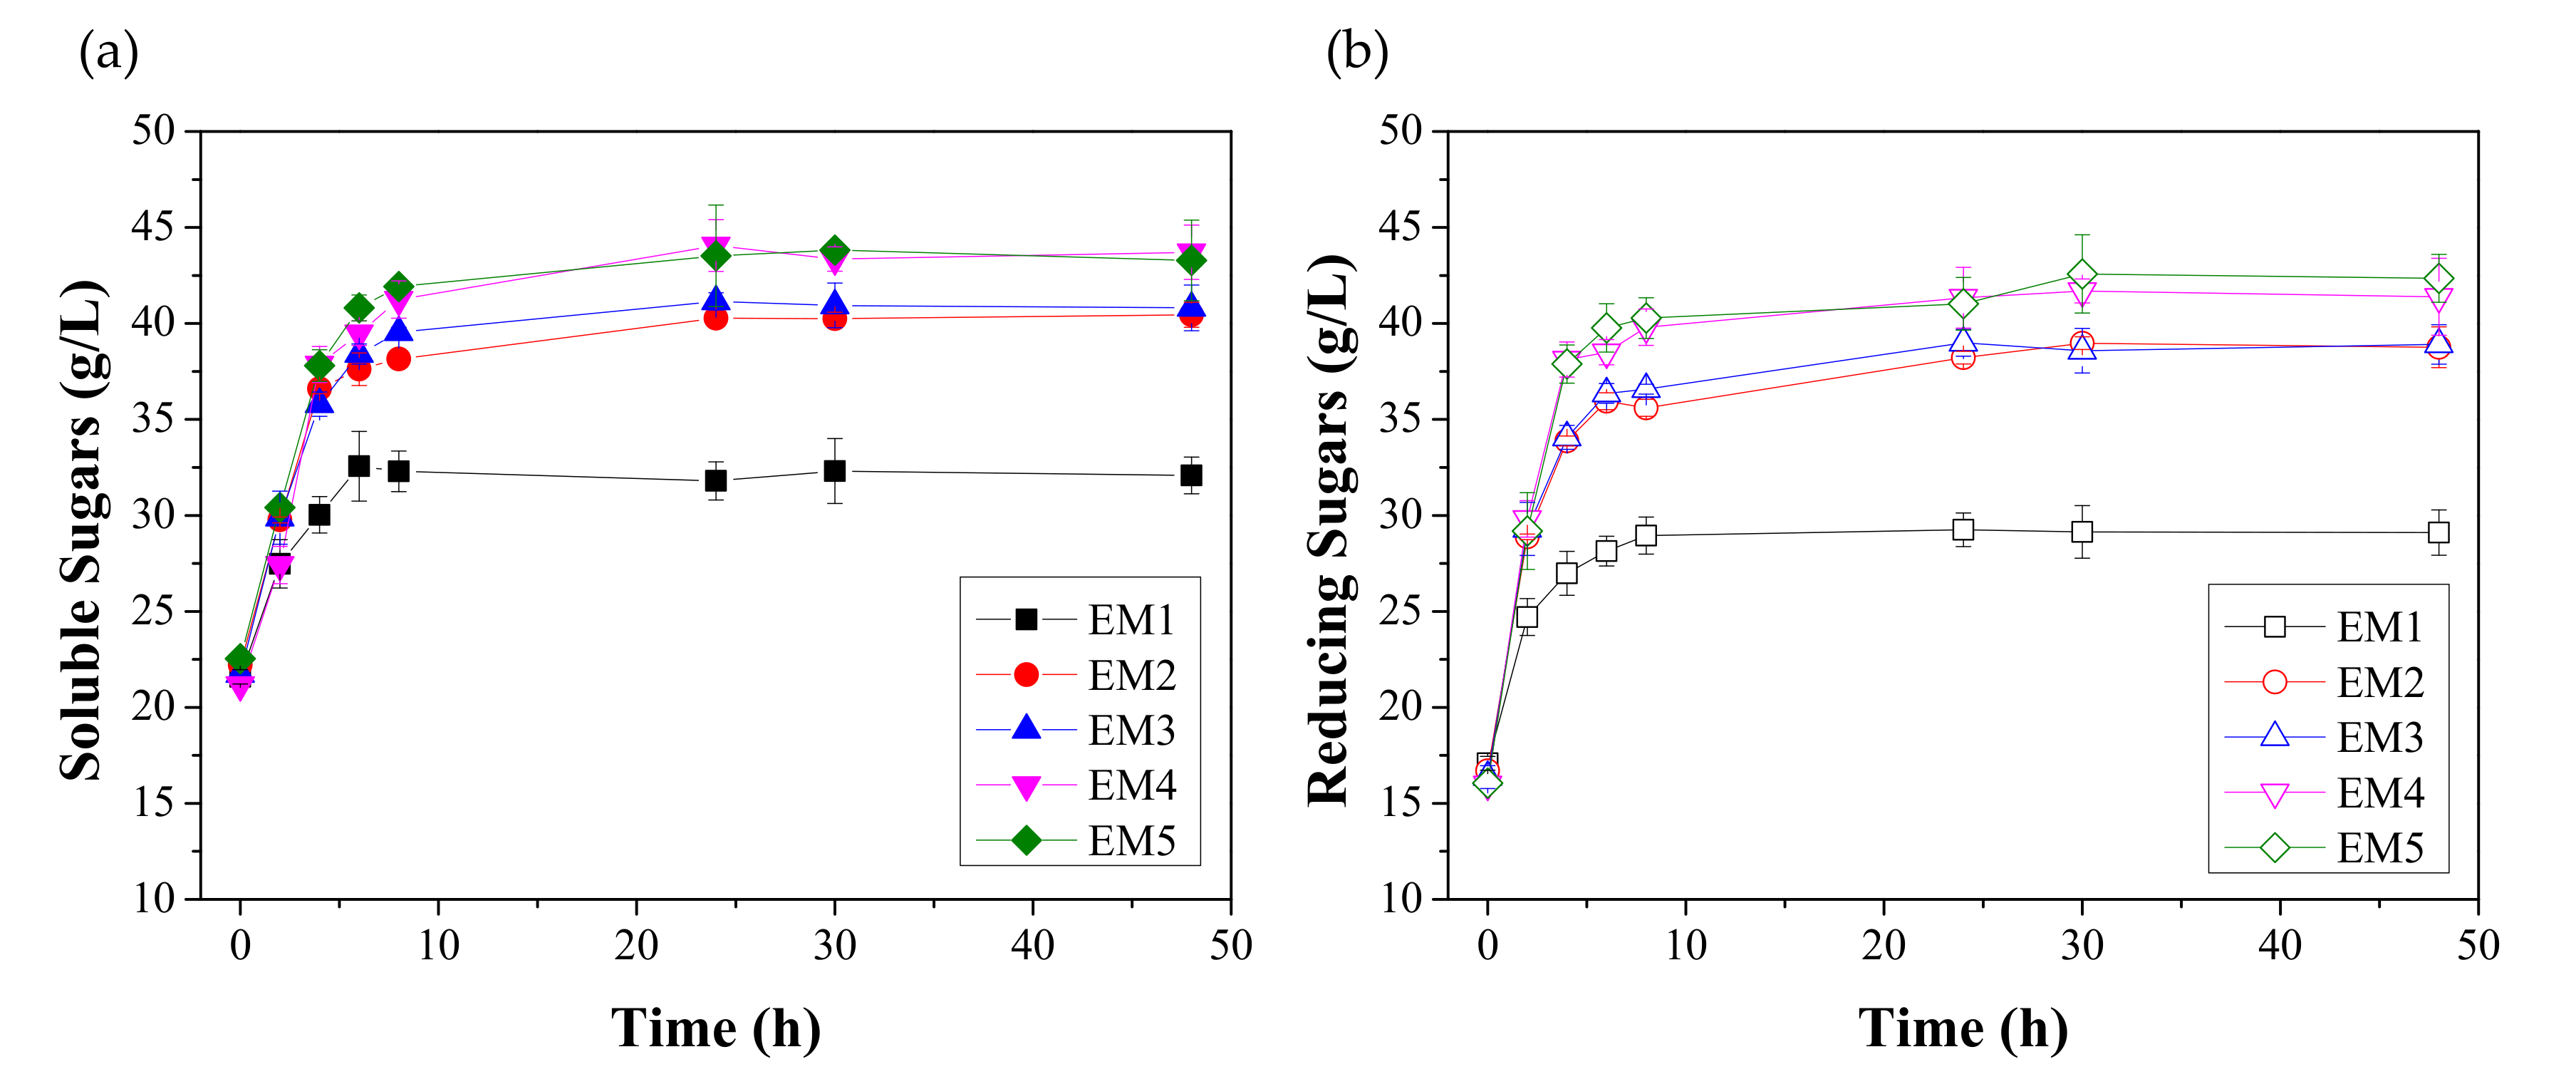
3.1. Effect of Enzymatic Hydrolysis on the Saccharification of FORBI

The effect of enzymatic loading on the saccharification of FORBI during supplementation with the cellulolytic blend, CE, is presented in Figure 1, in which the liberated amount of total soluble (free) sugars and reducing sugars versus time are illustrated. As shown, for all loadings, the saccharification rate, in terms of both free sugars and reducing sugars release, is higher during the first 8 h of the hydrolysis, following first-order type kinetics, as previously reported for cellulose [47] whereas it significantly slows down from 8 h to 24 h. The saccharification seems to cease after 24 h to 30 h, in all cases. The decreasing rate of hydrolysis can be attributed to the structural inhomogeneity of the cellulosic content of the waste, i.e., the co-existence of both amorphous and crystalline parts of the containing cellulose. It is well established in the literature that the regions with low crystallinity and the amorphous regions are more vulnerable to hydrolysis and are depolymerized quickly, whereas the regions with increased crystallinity resist hydrolysis [48]. The cellulosic content of FORBI derives from fruit and vegetable residues (peels, stones, etc.), as well as from used paper tissue included in the kitchen biowaste that was collected, i.e., wastes containing different types of cellulose with different crystallinity indices [49,50]. As such, the decrease in hydrolysis ratio with time is indeed expected. It should also be mentioned that the rate of enzymatic hydrolysis of cellulosic substrates is also highly affected by the porosity and the particle size of the waste, as well as by the types and origin of the cellulolytic enzymes used [51]. Differences in hydrolysis rates and degree can be noticed for different wastes and different enzymes used. As it regards the final concentration of sugars at the end of the process, it is apparent that it is increased for higher enzymatic loading of CE. For the quantification of the hydrolytic effect of the enzymes on FORBI, the parameter saccharification efficiency, SE, was estimated and the values for each handling are presented in Table 2.
In Figure 2, the increase of soluble and reducing sugars versus time, during the hydrolysis of FORBI with the enzymatic mixtures EM1-EM5 (composition analyzed in Table 1), is presented. The comparison among Figure 1 and Figure 2 reveals that the hydrolysis rate increases significantly when amylolytic enzymes are used. As shown for EM1, which contains solely amylolytic enzymes, the hydrolysis of starch ceased after 6 h of incubation when approximately 12 g of carbohydrates are hydrolyzed, i.e., almost 75% of starch is hydrolysis, corresponding to approximately 45% saccharification of FORBI (Table 2). The significantly higher hydrolysis rates for blends EM2-EM5, which all contain 30 FPU of the cellulolytic blend CE30, compared to the rate of hydrolysis via CE30 solely, is due to the simultaneous and cumulative release of free sugars from the hydrolysis of starch and holocellulose. The hydrolysis of starch is much easier than the hydrolysis of cellulose due to the differences in their structure (e.g., branched vs. linear formation, less stable a-glycosidic bonds vs. b-glycosidic bonds), thus, making starch much more vulnerable to enzymatic attack [52].
The ratio of released free sugars to reducing sugars as well as the estimated SEs for the different enzymatic blends and mixtures are presented in Table 2. As shown in the case of hydrolysis via CE solely, the percentage ratio of reducing to free sugars seems to highly increase for higher enzymatic loadings. Indeed, the ratio that was estimated for CE2 was statistically lower than the ratios of CE10, CE20, and CE30. This can be attributed to the increased liberation of reducing monosaccharides, mainly glucose, during the complete hydrolysis of the holocellulosic fraction of FORBI, whereas the amount of non-reducing sugars remains the same in all cases. Indeed, the estimated amount of non-reducing sugars at the end of the hydrolysis showed an insignificant difference for the different enzymatic loadings, having a mean value of 4.49 ± 0.64 g/L. With regard to SE, the values obtained show that there is a statistically significant difference for all enzymatic loadings detested, exhibiting increasing tendency, but in the cases of CE10 and CE20, the SEs are not statistically differentiated. It seems, thus, that the saccharification of FORBI is highly affected by the increase of the enzymatic loading of CE and is actually doubled for 30 FPU/TS waste compared to 2 FPU/TS waste. Such an effect has also been reported in previous studies. Matsakas et al. [53], using Celluclast® 1.5 L with Novozyme 188 at a ratio of 5:1 v/v for the hydrolysis of source-separated household FW containing 18.30 ± 0.19% w/w cellulose, have achieved hydrolysis of the latter by 50.27% after 8 h for an enzymatic loading 10 U/g FW. Moon et al. [54] have reported that during the hydrolysis of restaurant FW, containing 14.9% crude fibers on a dry basis, the saccharification increased significantly for enzymatic loadings 2.5–20 β-glucanase U/g dry FW, whereas no statistically different saccharification was noted for enzymatic loadings 20–60 b-glucanase units/g dry FW. Salami et al. [55] have studied the hydrolysis of a domestic FW, with 9.45% cellulose on dry basis, using an enzyme formulation developed for the specific substrate, and have noticed that the solubilization of cellulose increased from 35% to 50% for enzymatic loadings 20.43 FPU/g cellulose and 254.24 FPU cellulose, respectively.
For the hydrolysis of FORBI via EM1, which contained amylolytic enzymes solely, and not CE, the SE was statistically significantly lower compared to the SE of the hydrolysis with the enzymatic mixtures containing the same amount of amylolytic enzymes and also CE at an enzymatic loading of 30 FPU/g FORBI. As mentioned above, this is due to the simultaneous hydrolysis of starch and holocellulose, which leads to the cumulative evolution of free sugars coming from the depolymerization of all three polymers. The pairs of enzymatic mixtures EM2–EM3 and EM4–EM5 contain the same amount of CE and FA, but only EM3 and EM5 contain also A. The estimated SE values for EM2 (12 U FA/g starch) and EM3 (12 U FA/g starch and 6 U A/g starch) did not have a statistically significant difference and so was also the case for EM4 and EM5 (61 U FA/g starch) and EM3 (61 U FA/g starch and 31 U A/g starch). This can be attributed to the hypothesis that the same amount of starch is hydrolyzed towards maltose for the same enzymatic loadings of FA. The further hydrolysis of maltose to glucose does not differentiate the SE values since maltose and glucose are both soluble sugars. Since both maltose and glucose are also reducing sugars, the ratio of released free sugars to reducing sugars for those pairs are also comparable (no statistically significant difference is observed among values). As in the case of hydrolysis via CE solely, the estimated non-reducing sugars remaining at the end of the hydrolysis showed insignificant differences for the different EMs, with mean value 3.88 ± 0.57 g/L. As also shown in Figure 2, comparing the liberation of sugars for EM3 and EM5, and in Table 3, the SE increases for higher enzymatic loadings of FA. This is in agreement with other studies in which different amylolytic enzymes were used for the solubilization of FW and other starchy wastes. In the study of Salimi et al. [55], the hydrolysis of FW with an amylolytic enzyme developed for the specific substrate at loadings 36.4–145.5 U/g starch is reported to lead to increasing saccharification yields for increasing dosages of the enzyme, ranging from 43.9% to 79.0%. Pereira et al. [56] investigated the hydrolysis of sweet potato granular starch via an a-amylase produced in situ by Aspergilus niger at enzymatic loadings 5–40 U/g waste. It was shown that the saccharification yields were significantly enhanced by an increase of the enzymatic loading up to 31.25 U/g waste, after 37 h of incubation at pH 4 and 50 °C.

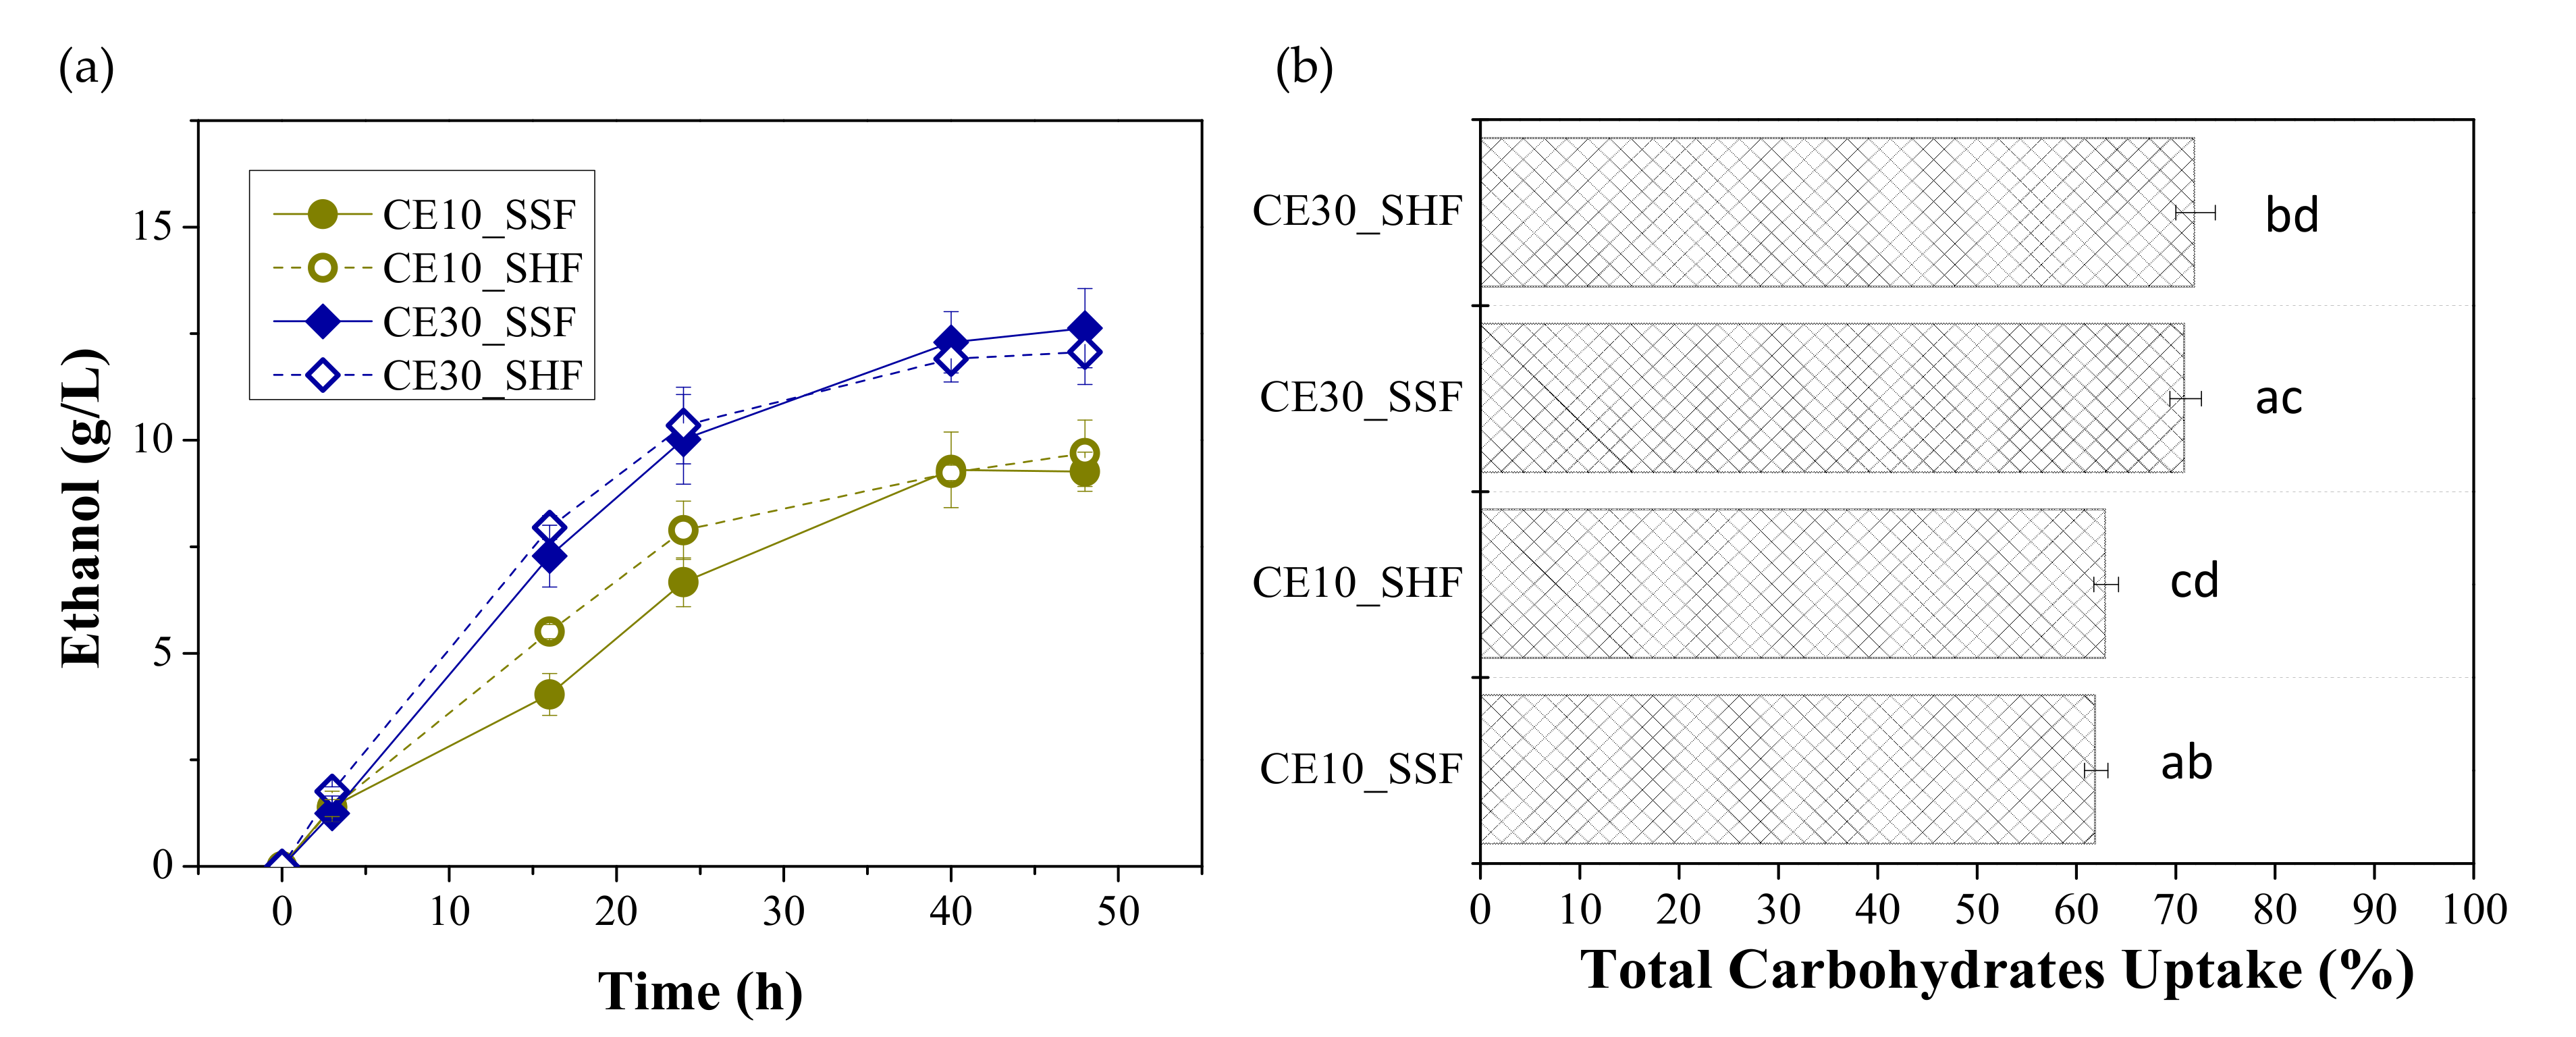
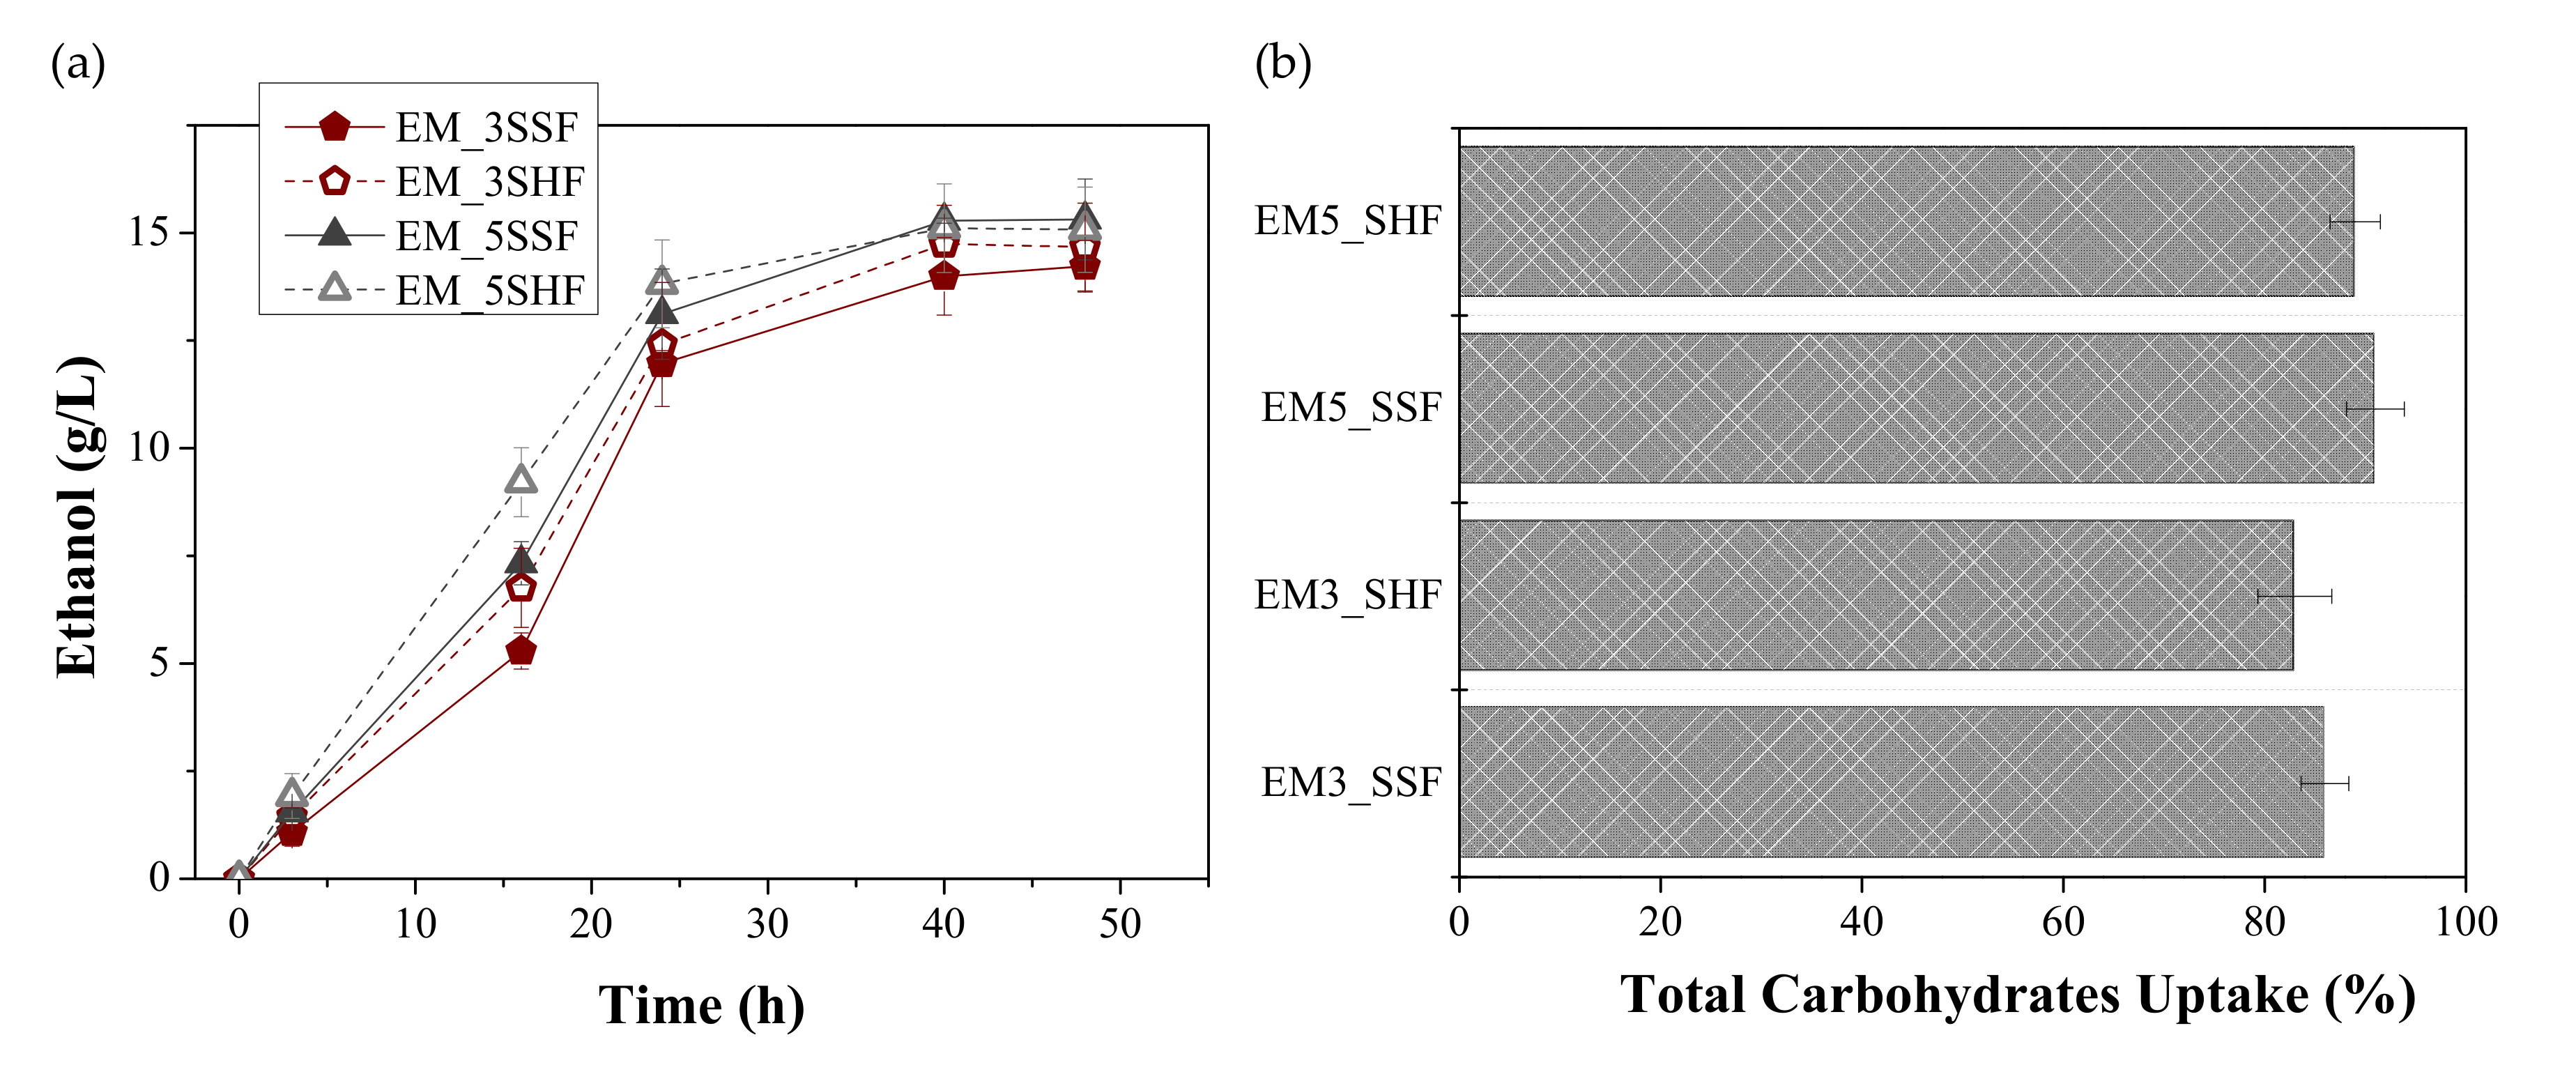
3.2. Effect of Enzymatic Loading and Fermentation Mode on Ethanol Production

As analyzed above, the saccharification of FORBI seems to be enhanced by the increase of enzymatic loadings for both cellulolytic blends and mixtures of cellulolytic with amylolytic enzymes. However, the degree to which the liberated free sugars are exploitable for bioconversion towards ethanol can also be highly affected by the fermentation mode and biocatalyst.
In this context, the bioconversion of hydrolyzed FORBI was further assessed via the yeast P. anomala, strain X19, which has been previously proven to lead to high bioethanol yields from food wastes and residues [18,36].
The effect of the fermentation mode on ethanol production from P. anomala was investigated using initially only the cellulosic blend for the hydrolysis of FORBI in two enzymatic loadings, i.e., 10 FPU/g TS FORBI, CE10 and 30 FPU/g TS FORBI, CE30. CE30 was selected as the most effective loading for the saccharification of the holocellulosic content of the waste. Since the cost of enzymes is an important factor affecting the economics of a fermentation process, the effect of a lower enzymatic loading on the fermentation efficiency of the processes was also assessed. Into this context, the selection of CE10 was preferred over CE20, since the estimated SEs for those loadings were insignificant statistically. The production of ethanol versus time for two different loadings of the cellulolytic blend, CE10 and CE30, are presented in Figure 3a.
As shown, a higher enzymatic loading of CE leads to higher ethanol production. On the contrary, the fermentation mode does not affect either the fermentation rate or the amount of ethanol produced. The maximum ethanol titer achieved was 9.18 ± 0.78 g/L and 9.61 ± 0.60 g/L for CE10 at SSF and SHF modes, respectively, and 12.6 ± 0.74 g/L and 11.97 ± 0.98 g/L for CE30 at SSF and SHF modes, respectively, as measured after 48 h of fermentation. It is obvious that ethanol accumulation actually ceases after 40 h of fermentation. The final consumption of total carbohydrates expressed as a percentage of the initial available carbohydrate amount in each culture is illustrated in Figure 3b. Carbohydrate uptake reached 62.12 ± 1.25% and 63.31 ± 1.47% for CE10 at SSF and SHF modes, respectively, and 71.03 ± 1.58% and 72.29 ± 2.77% for CE30 at SSF and SHF modes, respectively. The values are quite similar for the same enzymatic loading, regardless of the fermentation mode, whereas the carbohydrate uptake is higher for the higher enzymatic loading, since a greater amount of carbohydrates is solubilized and is, thus, available for bioconversion and assimilation by the yeast.
In Figure 4a, ethanol production from FORBI using enzymatic mixtures to facilitate ethanol production is illustrated. The comparison of Figure 3a, Figure 4b, reveals thatthe supplementation with amylolytic enzymes together with the cellulolytic ones enhances ethanol production significantly.This can be attributed to the increase of the overall saccharification of the carbohydrates content of the waste (since both starch and hollocellulose are hydrolyzed), resulting thus, to higher carbohydrate uptake (Figure 4b). The maximum ethanol titer that was measured after 48 h of fermentation reached 14.02 ± 1.01 g/L and 14.34 ± 0.68 g/L for EM3 (265 FPU CE/g cellulose, 12 U FA/g starch, and 6 U/g starch) at SSF and SHF modes, respectively, and 15.32 ± 0.94 g/L and 15.28 ± 0.78 g/L, for EM5 (265 FPU CE/g cellulose, 61 U FA/g starch and 31 U/g starch) at SSF and SHF modes, respectively. Similar to the experiments with CE, the ethanol titers did not differ significantly when altering the fermentation mode. These observations are not in line with the results obtained from the study of Ben Atitallah et al. [18], according to which a 30% increase of the achieved ethanol titer was noted when P. anomala was used for the fermentation of potato peels at SHF mode compared to SSF mode. The difference with the results of the current study could probably be attributed to the differences in the composition of the wastes (potato peels contained 34.30 ± 0.60% cellulose and 44.80 ± 0.70% starch), which is expected to affect the saccharification efficiency of the enzymatic mixtures used. The addition of glucoamylase in the enzymatic mixtures could also be partly responsible for the efficient performance of the yeast during SSF, since the saccharification of dextrins to glucose could enhance the process efficiency even at the lower temperature applied during such a process [57], i.e., 30 °C in the case of the current study vs. 50 °C that was applied for the hydrolysis at SHF experiments. The comparison of SSF and SHF modes carried out in previous studies with other types of food waste as substrate supports the assumption that the performance of each process can vary highly according to the composition of the substrate used. In the study of Zhu et al. [58], it is reported that the SSF process exhibited notable advantages over the SHF method when using Saccharomyces cerevisiae for ethanol production from cassava pulp hydrolyzed by an enzymatic cocktail of fungal cellulose, bacterial a-amylase, and fungal glucosidase. On the contrary, Dahnum et al. [59] concluded that SHF was advantageous over SSF in terms of achieved ethanol concentration, but not in terms of productivities, during fermentation of empty fruit bunch using S. cerevisiae and Cellic® HTec2 for the solubilization of the waste.
In Table 3, the ethanol yields and the fermentation efficiency, FE, of the ethanol production process as estimated by Equations (1)–(5) are presented. It can be observed that the different enzymatic loadings of cellulolytic or amylolytic enzymes did not affect YE/S, and consequently the further estimated FEs, the values of which had insignificant statistically differences for all experiments, reached almost 83%. The FE during alcoholic fermentation can vary significantly for different biocatalysts. Even for the same biocatalyst, the FE may show considerable variations depending on many factors, such as pH, type of fermentation substrate, substrate concentration, fermentation conditions, product inhibition, etc. [60]. In all fermentation tests performed in the current study, the biocatalyst and the fermentation conditions (pH, agitation, temperature, nutrients, carbon source, etc.) were the same and the only variable parameter was the initial substrate concentration, which was controlled by the availability of sugars during hydrolysis. In the SHF experiments, the initial substrate concentration was almost twice as much as in the SSF experiments, not exceeding 50 g/L in any case. The effect of initial substrate concentration during alcoholic fermentation of sugars by P. anomala X19 was studied by Ben Atitallah et al. [36] in which sucrose concentrations 30 g/L–120 g/L were tested, leading to ethanol production up to 41 g/L, without the YE/S being affected. The FE of P. anomala in that study reached 88 ± 2% and the bioconversion of sucrose was complete when efficient nitrogen for assimilation was available. More diverse values were noted in the FE during the exploitation of chemically pretreated (thermal, acid, or alkali) and/or enzymatically hydrolyzed potato peels via P. anomala X19 [18]. In that study, the FE of the process ranges from 51% to 91%, a variation that could be attributed to the differences in the pH during fermentation, as well as to the formation of different inhibitory compounds during pretreatment that remain in the fermentation broth and affect the performance of the yeast.
The values of YE/FORBI that were estimated for the different handlings, as well as their statistical differences, are presented in Table 3. It can be observed that YE/FORBI from the experiments with CE30 is statistically higher than those with CE10 and statistically lower than those with either EM3 or EM5. This can be attributed to the higher amount of holocellulose that is hydrolyzed for higher enzymatic loadings of cellulolytic enzymes, and the additional liberation of sugars during hydrolysis in the presence of amylolytic enzymes as well, leading, thus, to a higher bioconversion ratio of the waste. The maximum YE/FORBI achieved was 141.06 ± 6.81 g ethanol/g FORBI (raw), which was noted for FORBI processed with EM5 and was 20% higher than the maximum yield achieved when CE30 solely was used for the hydrolysis of the waste. It can be assumed, however, that the extra amount of sugars that are generated during supplementation with the highest loading of amylolytic enzymes (EM5) is not enough to reflect a notable increase in the YE/FORBI, as shown by the statistically insignificant differences between the yields of the handlings with EM3 and EM5. These might seem like a contradiction with the results of the hydrolytic experiments with EM3 and EM5, from which it was shown that the SEs were differentiated, with EM5 exhibiting statistically higher SEs than EM3. This can be attributed to the high initial soluble sugars that FORBI contains (amounting to 50% of its total carbohydrate content) which do not contribute to the relative increase of SE during saccharification (Equation (1)), whereas they contribute significantly, and to the same extent for all handlings, to the increase of YE/FORBI, thus, making the relative differences among values of different handlings lower. With regard to the effect of fermentation mode on YE/FORBI, insignificant differences were noted for SSF and SSF processes for all different enzymatic loadings. This observation might also be due to the high amount of readily fermentative sugars of FORBI, and also due to the relatively high rate of hydrolysis of the complex carbohydrate content of FORBI compared to the fermentation kinetics. It seems that due to those parameters, there is always availability of sugars for bioconversion resulting in similarly efficient fermentation of the waste in either SSF or SHF mode.
The comparison of the current ethanol yields with those achieved from the fermentation of FORBI via a co-culture of Saccharomyces sereviceae and Pichia stipitis [39] indicates that P. anomala is superior in terms of its fermentation efficiency. The maximum YE/FORBI, which was obtained from the study by Ntaikou et al. [39] during supplementation of FORBI with cellic, a-amylase, and amyloglucosidase and the SSF process was comparable, i.e., 150 ± 10 g ethanol/g FORBI. The YE/S reported in the study by Ntaikou et al. was lower, i.e., 0.35 ± 0.01, but with higher consumption of carbohydrates which reached 95%.

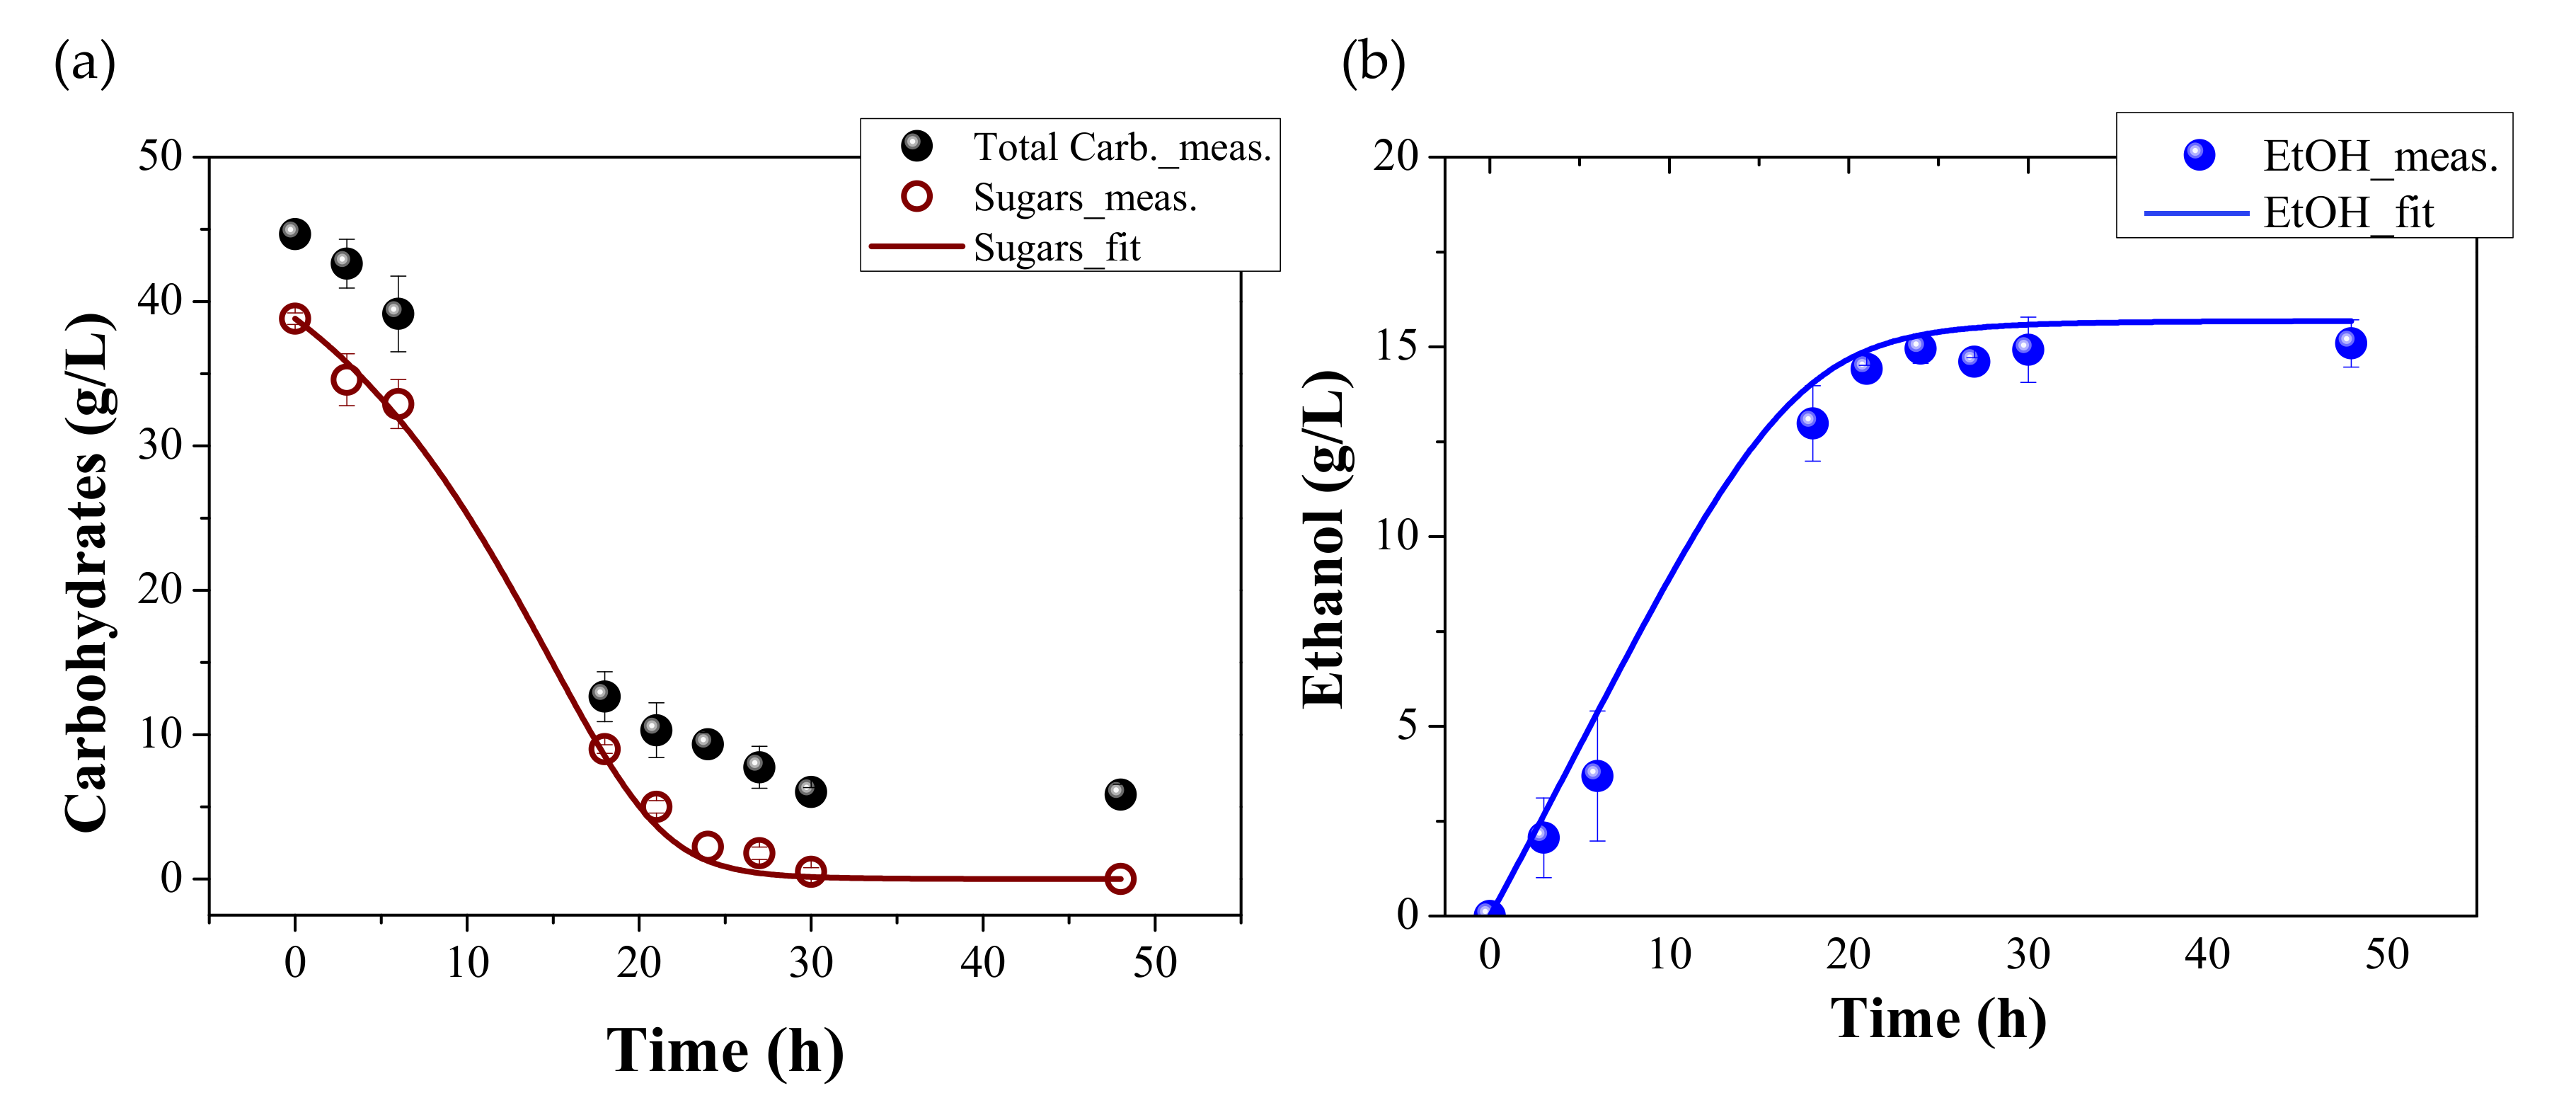
3.3. Verification of Ethanol Production Kinetics of P. anomala during Fermentation of Hydrolysed FORBI

In the sequel, a fermentation experiment was performed in a fermenter of 1 L working volume with the highest loading of enzymes in SHF mode, in order to validate the results of the fermentation of FORBI at a larger scale and also to study the kinetics of the yeast. As shown by the above-presented fermentation tests, the fermentation mode hardly affected the ethanol yields that were achieved from FORBI. In this context, the selection of an SSF process would be recommended for scaling up since it is less time consuming and it is performed at a lower temperature. However, an SSF experiment, during which hydrolysis of the complex carbohydrates and consumption of sugars by the yeast occurs simultaneously, would not allow for the direct monitoring of sugar bioconversion. As such, the SHF process was selected to be scaled up and the performance of the yeast during fermentation of FORBI was compared with that of the small scale (25 mL working volume) experiments.
The results from the scale-up experiment are summarized in Table 4. As shown, the obtained values of all estimated parameters from the scale-up experiment, i.e., the maximum concentration of ethanol, CE, the yields YE/FORBI and YE/S and FE, did not have statistically significant differences with those from the respective small scale experiment, validating the efficiency of the process at different scales.
Moreover, the data from the scale-up experiment were assessed in order to investigate the kinetics of the fermentation process, since the increase of working volume would allow for more frequent sampling compared to the small-scale experiments. The kinetics of the yeast during the alcoholic fermentation of sucrose and date palm sap (a sucrose base natural product of date palm trees) have been previously investigated by Ben Atitallah et al. [36]. The Monod-type expressions that were proposed by Ben Atitallah et al. [36] were used to describe the overall fermentation of the hydrolyzed FORBI. The individual processes included are the consumption of the carbon source estimated as free sugars (described by Equation (6)), the microbial growth (described by Equation (7)), the microbial death (described by Equation (8)), and the production of ethanol (described by Equation (11)). A substrate inhibition (Equation (9)) and a product inhibition factor (Equation (11)) were taken into account for which the inhibition constants, KIS (substrate inhibition) and KIP (product inhibition), that were estimated by the same study [36] were used. Similar for the decay constant, kd, the value that was estimated by the same study was also used. Based on the above, the maximum specific growth rate, μmax, and the biomass yield, Yx/s of the yeast from the hydrolyzed waste, i.e., a mixture of different sugars, were estimated by the model.
During the experiment, the concentration of total carbohydrates and soluble sugars, measured as glucose equivalents via the Du Bois protocol [43], were followed versus time, as well as the variation of pH and the generation of ethanol. The experimental data were then fitted via AQUASIM 2.0 [46] and parameter estimation was carried out for determining the values of the specific growth rate, μmax, and the microbial biomass yield, YX/S, of the yeast during fermentation of the hydrolyzed carbohydrate content of FORBI. It has to be noted that for the better simulation of data, the remaining amount of soluble non-consumed sugars at the end of fermentation, accounting for 0.96 ± 0.12 g/L glucose equivalents, were subtracted from all measured values of soluble sugars. The non-consumed soluble sugars are expected to account for sugars that cannot be metabolized by the yeast. The results of measured total carbohydrates and sugars consumption and ethanol production, as well as the fitting curves for sugars and ethanol, are presented in Figure 5. Based on those, the estimated values for μmax and YX/S were 0.26 ± 0.02 h−1 and 0.05 ± 0.00 g X/g S, respectively. The comparison of the obtained values with the previously estimated for ethanol production from date palm sap (DPS, a sucrose based substrate) [36], i.e., 0.39 ± 0.02 h−1 and 0.04 ± 0.01 g X/g S for μmax and YX/S, respectively, reveals that the growth of P. anomala is faster during consumption of hydrolyzed FORBI compared to the consumption of sucrose (μmax FORBI < μmax DPS). On the contrary, more carbon is assimilated to microbial biomass during fermentation of FORBI (YX/S FORBI > YX/S DPS) and, thus, less carbon is metabolized to ethanol as also shown by the lower FE of the yeast during the fermentation of hydrolyzed FORBI (83% for FORBI and 88% for DPS).

4. Conclusions

Based on the results of the current study, it can be assumed that FORBI is an attractive substrate for second-generation bioethanol production using the yeast P. anomala, when the appropriate enzymatic cocktail is used for its hydrolysis. The performance of the yeast in terms of all the studied parameters, i.e., ethanol concentration, yields, and fermentation efficiency, does not seem to be affected by the type of fermentation process, i.e., SSF or SHF, and remains high compared to the literature, reaching 83%. As assumed by the estimation of the kinetics of the fermentation process, maximum ethanol production from the yeast can be achieved faster from hydrolyzed FORBI than from sucrose-based substrates. Moreover, the ethanol yields that were obtained for the higher enzymatic loadings were comparable with those obtained by co-cultures of S. sereviceae and P. stipitis using the same waste.

Supplementary Materials

The following are available online at https://www.mdpi.com/2071-1050/13/1/259/s1, Figure S1: Variation of pH versus time during alcoholic fermentation of FORBI with P. anomala at separate hydrolysis and fermentation, SHF, (a) and simultaneous saccharification ad fermentation, SSF, (b) via the cellulolytic blend (CE) at enzymatic loadings 10FPU/g TS FORBI and 30FPU/g TS FORBI, Figure S2: Variation of pH versus time during alcoholic fermentation of FORBI with P. anomala at separate hydrolysis and fermentation, SHF, (a) and simultaneous saccharification ad fermentation, SSF, (b) via the enzymatic mixtures EM3 and EM5 containing cellulolytic and amylolytic enzymes, Table S1: Chemical composition FORBI.

Author Contributions

Conceptualization, I.N. and G.A.; methodology, supervision, data analysis, investigation, writing, I.N.; review and editing, I.N. and G.L. All authors have read and agreed to the published version of the manuscript.

Funding

The study was financially supported by the project “Research Infrastructure for Waste Valorization and Sustainable Management of Resources, INVALOR” (MIS 5002495), implemented under the “Action for the Strategic Development on the Research and Technological Sector”, funded by the Operational Programme “Competitiveness, Entrepreneurship and Innovation” (NSRF 2014–2020) and co-financed by Greece and the European Union (ERDF).

Institutional Review Board Statement

Not applicable.

Informed Consent Statement

Not applicable.

Data Availability Statement

Not applicable.

Acknowledgments

The authors would like to thank Tahar Mechchi and Imen Ben Attilalah for kindly providing the yeast strain that was used in the current study.

Conflicts of Interest

The authors declare no conflict of interest.

References

  1. Teoh, Y.H.; Yu, K.H.; How, H.G.; Nguyen, H.-T. Experimental investigation of performance, emission and combustion characteristics of a common-rail diesel engine fuelled with bioethanol as a fuel additive in coconut oil biodiesel blends. Energies 2019, 12, 1954. [Google Scholar] [CrossRef] [Green Version]
  2. Sarris, D.; Papanikolaou, S. Biotechnological production of ethanol: Biochemistry, processes and technologies. Eng. Life Sci. 2016, 16, 307–329. [Google Scholar] [CrossRef] [Green Version]
  3. FAO. 2011 Global Food Losses and Food Waste—Extent, Causes and Prevention. Rome. Available online: http://www.fao.org/3/mb060e/mb060e00.htm (accessed on 15 November 2020).
  4. United Nations, Sustainable Development Goals. Available online: https://sustainabledevelopment.un.org/sdg12 (accessed on 15 November 2020).
  5. Uckun Kiran, E.; Liu, Y. Bioethanol production from mixed food waste by an effective enzymatic pretreatment. Fuel 2015, 159, 463–469. [Google Scholar] [CrossRef]
  6. Aruna, A.; Nagavalli, M.; Girijashankar, V.; Ponamgi, S.P.D.; Swathisree, V.; Venkateswar Rao, L. Direct bioethanol production by amylolytic yeast Candida albicans. Lett. Appl. Microbiol. 2015, 60, 229–236. [Google Scholar] [CrossRef] [PubMed]
  7. Nguyen, D.T.T.; Praveen, P.; Loh, K.-C. Zymomonas mobilis immobilization in polymeric membranes for improved resistance to lignocellulose-derived inhibitors in bioethanol fermentation. Biochem. Eng. J. 2018, 140, 29–37. [Google Scholar] [CrossRef]
  8. Sowatad, A.; Todhanakasem, T. Bioethanol production by repeated batch using immobilized yeast cells on sugarcane bagasse. Waste Biomass Valor. 2020, 11, 2009–2016. [Google Scholar] [CrossRef]
  9. Selim, K.A.; Easa, S.M.; El-Diwany, A.I. The xylose metabolizing yeast Spathaspora passalidarum is a promising genetic treasure for improving bioethanol production. Fermentation 2020, 6, 33. [Google Scholar] [CrossRef] [Green Version]
  10. Menon, V.; Divate, R.; Rao, M. Bioethanol production from renewable polymer lichenan using lichenase from an alkalothermophilic Thermomonospora sp. and thermotolerant yeast. Fuel Process Technol. 2011, 92, 401–406. [Google Scholar] [CrossRef]
  11. Kumari, R.; Pramanik, K. Improved bioethanol production using fusants of Saccharomyces cerevisiae and xylose-fermenting yeasts. Appl. Biochem. Biotech. 2012, 167, 873–884. [Google Scholar] [CrossRef]
  12. Swain, M.R.; Mishra, J.; Thatoi, H. Bioethanol production from Sweet Potato (Ipomoea batatas L.) Flour using Co-Culture of Trichoderma sp. and Saccharomyces cerevisiae in solid-state fermentation. Braz. Arch. Biol. Techn. 2013, 56, 171–179. [Google Scholar] [CrossRef] [Green Version]
  13. Izmirlioglu, G.; Demirci, A. Improved simultaneous saccharification and fermentation of bioethanol from industrial potato waste with co-cultures of Aspergillus niger and Saccharomyces cerevisiae by medium optimization. Fuel 2016, 185, 684–691. [Google Scholar] [CrossRef]
  14. Zhang, Y.; Wang, C.; Wang, L.; Yang, R.; Hou, P.; Liu, J. Direct bioethanol production from wheat straw using xylose/glucose co-fermentation by co-culture of two recombinant yeasts. J. Ind. Microbiol. Biot. 2017, 44, 453–464. [Google Scholar] [CrossRef] [PubMed]
  15. Farias, D.; Maugeri Filho, F. Co-culture strategy for improved 2G bioethanol production using a mixture of sugarcane molasses and bagasse hydrolysate as substrate. Biochem. Eng. J. 2019, 147, 29–38. [Google Scholar] [CrossRef]
  16. Senkevich, S.; Ntaikou, I.; Lyberatos, G. Bioethanol production from thermochemically pre-treated olive mill solid residues using the yeast Pachysolen tannophylus. Glob. Nest. J. 2012, 14, 118–124. [Google Scholar]
  17. Martinez-Patino, J.C.; Romero-Garcia, J.M.; Ruiz, E.; Oliva, J.M.; Alvarez, C.; Romero, I.; Negro, M.J.; Castro, E. High solids loading pretreatment of olive tree pruning with dilute phosphoric acid for bioethanol production by Escherichia coli. Energy Fuels 2015, 29, 1735–1742. [Google Scholar] [CrossRef]
  18. Ben Atitallah, I.; Antonopoulou, G.; Ntaikou, I.; Alexandropoulou, M.; Nasri, M.; Mechichi, T.; Lyberatos, G. On the evaluation of different saccharification schemes for enhanced bioethanol production from potato peels waste via a newly isolated yeast strain of Wickerhamomyces anomalus. Biores. Technol. 2019, 289, 121614. [Google Scholar] [CrossRef]
  19. Lee, I.; Yu, J.-H. The production of fermentable sugar and bioethanol from acacia wood by optimizing dilute sulfuric acid pretreatment and post treatment. Fuel 2020, 275, 117943. [Google Scholar] [CrossRef]
  20. Ntaikou, I.; Siankiavich, S.; Lyberatos, G. Effect of thermo-chemical pretreatment on the saccharification and enzymatic digestibility of olive mill stones and their bioconversion towards alcohols. Environ. Sci. Pollut. Res. 2020, in press. [Google Scholar] [CrossRef]
  21. Alexandropoulou, M.; Antonopoulou, G.; Ntaikou, I.; Lyberatos, G. Fungal pretreatment of willow sawdust with Abortiporus biennis for anaerobic digestion: Impact of an external nitrogen source. Sustainability 2017, 9, 130. [Google Scholar] [CrossRef] [Green Version]
  22. Antonopoulou, G.; Kampranis, A.; Ntaikou, I.; Lyberatos, G. Enhancement of liquid and gaseous biofuels production from agro-industrial residues after thermochemical and enzymatic pretreatment. Front. Sustain. Food Syst. 2019, 3, 92. [Google Scholar] [CrossRef]
  23. Ntaikou, I.; Antonopoulou, G.; Vayenas, D.; Lyberatos, G. Assessment of electro.coagulation as a pretreatment method of olive mill wastewater towards alternative processes for biofuels production. Renew. Energy 2020, 154, 1252–1262. [Google Scholar] [CrossRef]
  24. Dimitrellos, G.; Lyberatos, G.; Antonopoulou, G. Does acid addition improve liquid hot water pretreatment of lignocellulosic biomass towards biohydrogen and biogas production? Sustainability 2020, 12, 8935. [Google Scholar] [CrossRef]
  25. Antonopoulou, G. Designing efficient processes for sustainable bioethanol and bio-hydrogen production from grass lawn waste. Molecules 2020, 25, 2889. [Google Scholar] [CrossRef] [PubMed]
  26. Silvennoinen, K.; Katajajuuri, J.-M.; Hartikainen, H.; Heikkila, L.; Reinikainen, A. Food waste volume and composition in Finnish households. Br. Food J. 2014, 116, 1058–1068. [Google Scholar] [CrossRef]
  27. Angelo, A.C.M.; Saraiva, A.B.; Climaco, J.C.N.; Infante, C.E.; Valle, R. Life cycle assessment and multi-criteria decision analysis: Selection of a strategy for domestic food waste management in Rio de Janeiro. J. Clean. Prod. 2017, 143, 744–756. [Google Scholar] [CrossRef]
  28. Di Bitonto, L.; Antonopoulou, G.; Braguglia, C.; Campanale, C.; Gallipoli, A.; Lyberatos, G.; Ntaikou, I.; Pastore, C. Lewis-BrØnsted acid catalysed ethanolysis of the organic fraction of municipal solid waste for efficient production of biofuels. Biores. Technol. 2018, 266, 297–305. [Google Scholar] [CrossRef]
  29. Ahmad, M.; Gani, A.; Hassan, I.; Huang, Q.; Shabbir, H. Production and characterization of starch nanoparticles by mild alkali hydrolysis and ultra-sonication process. Sci. Rep. 2020, 10, 3533. [Google Scholar] [CrossRef]
  30. Ulbrich, M.; Bai, Y.; Floter, E. The supporting effect of ultrasound on the acid hydrolysis of granular potato starch. Carbohydr. Polym. 2020, 230, 115633. [Google Scholar] [CrossRef]
  31. Zulnazri; Roesyadi, A.; Sumarno. Effects of hydrolysis conditions on the crystallinity, chemical structure, morphology, and thermal stability of cellulose nanocrystals extracted from oil palm biomass residue. Int. J. Chem. Tech. Res. 2016, 9, 456–464. [Google Scholar]
  32. Hashem, M.; Asseri, T.Y.A.; Alamri, S.A.; Alrumman, S.A. Feasibility and sustainability of bioethanol production from starchy restaurants’ bio-wastes by new yeast strains. Waste Biomass Valor. 2019, 10, 1617–1626. [Google Scholar] [CrossRef]
  33. Matsakas, L.; Christakopoulos, P. Ethanol production from enzymatically treated dried food waste using enzymes produced on-site. Sustainability 2015, 7, 1446–1458. [Google Scholar] [CrossRef] [Green Version]
  34. Tao, N.; Gao, Y.; Liu, Y. Isolation and characterization of a Pichia anomala strain: A promising candidate for bioethanol production. Braz. J. Microbiol. 2011, 42, 668–675. [Google Scholar] [CrossRef] [PubMed] [Green Version]
  35. Zha, Y.; Hossain, A.H.; Tobola, F.; Sedee, N.; Havekes, M.; Punt, P.J. Pichia anomala 29X: A resistant strain for lignocellulosic biomass hydrolysate fermentation. FEMS Yeast Res. 2013, 13, 609–617. [Google Scholar] [CrossRef] [PubMed] [Green Version]
  36. Ben Atitallah, I.; Ntaikou, I.; Antonopoulou, G.; Alexandropoulou, M.; Brysch-Herzberg, M.; Nasri, M.; Lyberatos, G.; Mechichi, T. Evaluation of the non-conventional yeast strain Wickerhamomyces anomalus (Pichia anomala) X19 for enhanced bioethanol production using date palm sap as renewable feedstock. Renew. Energ. 2020, 154, 71–81. [Google Scholar] [CrossRef]
  37. Elhalis, H.; Cox, J.; Frank, D.; Zhao, J. Microbiological and biochemical performances of six yeast species as potential starter cultures for wet fermentation of coffee beans. LWT—Food Sci. Technol. 2020, 110430, in press. [Google Scholar] [CrossRef]
  38. Papanikola, K.; Papadopoulou, K.; Tsiliyannis, C.; Fotinopoulou, I.; Katsiampoulas, A.; Chalarakis, E.; Georgiopoulou, M.; Rontogianni, V.; Michalopoulos, I.; Mathioudakis, D.; et al. Food residue biomass product as an alternative fuel for the cement industry. Environ. Sci. Pollut. Res. 2019, 26, 35555–35564. [Google Scholar] [CrossRef]
  39. Ntaikou, I.; Menis, N.; Alexandropoulou, M.; Antonopoulou, G.; Lyberatos, G. Valorization of kitchen biowaste for ethanol production via simultaneous saccharification and fermentation using co-cultures of the yeasts Saccharomyces cerevisiae and Pichia stipitis. Biores. Technol. 2018, 263, 75–83. [Google Scholar] [CrossRef]
  40. APHA; AWWA; WPCF. Standard Methods for the Examination of Water and Wastewater; Franson, M.A., Ed.; American Public Health Association: Washington, DC, USA, 1995. [Google Scholar]
  41. Monlau, F.; Barakat, A.; Steyer, J.P.; Carrere, H. Comparison of seven types of thermo-chemical pretreatments on the structural features and anaerobic digestion of sunflower stalks. Bioresour. Technol. 2012, 120, 241–247. [Google Scholar] [CrossRef]
  42. VELP SCIENTIFICA. SER 148 Extraction Apparatus for the Quantitative Separation of a Substance from a Mixture by the Use of an Organic Solvent; Operation Manual. VELP Solvent Extraction Operation Manual; Velp Scientifica: Usmate, Italy, 2017; Volume 10001364/A11, p. 45. [Google Scholar]
  43. DuBois, M.; Gilles, K.; Hamilton, J.; Rebers, P.; Smith, F. Colorimetric method for determination of sugars and related substances. Anal. Chem. 1956, 28, 350–356. [Google Scholar] [CrossRef]
  44. Miller, G.L. Use of dinitrosalicylique acid reagent for determination of reducing sugar. Anal. Chem. 1959, 31, 426–428. [Google Scholar] [CrossRef]
  45. Sluiter, A.; Hames, B.; Ruiz, R.; Scarlata, C.; Sluiter, J.; Templeton, D.; Crocker, D. Determination of Structural Carbohydrates and Lignin in Biomass; Laboratory Analytical Procedure, NREL/TP-510-42618; National Renewable Energy Laboratory: Denver, CO, USA, 2008. [Google Scholar]
  46. Reichert, P. AQUASIM 2.0, Computer Program for the Identification and Simulation of Aquatic Systems; EAWAG: Dubendorf, Switzerland, 1998. [Google Scholar]
  47. Ye, Z.; Berson, R.E. Kinetic modeling of cellulose hydrolysis with first order inactivation of adsorbed cellulase. Biores. Technol. 2011, 102, 11194–11199. [Google Scholar] [CrossRef] [PubMed]
  48. Fan, L.T.; Lee, Y.-H.; Beardmore, D.R. The influence of major structural features of cellulose on rate of enzymatic hydrolysis. Biotechnol. Bioeng. 1981, 23, 419–424. [Google Scholar] [CrossRef]
  49. Szymanska-Chargot, M.; Chylinska, M.; Gdula, K.; Koziol, A.; Zdunek, A. Isolation and characterization of cellulose from different fruit and vegetable pomaces. Polymers 2017, 9, 495. [Google Scholar] [CrossRef] [PubMed]
  50. Agarwal, U.P.; Reiner, R.R.; Ralph, S.A. Estimation of cellulose crystallinity of lignocelluloses using near-IR FT-Raman spectroscopy and comparison of the Raman and Segal-WAXS methods. J. Agric. Food Chem. 2013, 61, 103–113. [Google Scholar] [CrossRef]
  51. Al-Zuhair, S. The effect of crystallinity of cellulose on the rate of reducing sugars production by heterogeneous enzymatic hydrolysis. Biores. Technol. 2008, 99, 4078–4085. [Google Scholar] [CrossRef]
  52. Dekker, R.F. Enzymatic hydrolysis of plant polysaccharides: Substrates for fermentation. Braz. J. Med. Biol. Res. 1989, 22, 1441–1456. [Google Scholar]
  53. Matsakas, L.; Kekos, D.; Loizidou, M.; Christakopoulos, P. Utilization of household food waste for the production of ethanol at high dry material content. Biotechnol. Biofuels 2014, 7, 4. [Google Scholar] [CrossRef] [Green Version]
  54. Moon, H.C.; Song, I.S.; Kim, J.C.; Shirai, Y.; Lee, D.H.; Kim, J.K.; Chung, S.O.; Kim, D.H.; Oh, K.K.; Cho, Y.S. Enzymatic hydrolysis of food waste and ethanol fermentation. Int. J. Energy Res. 2009, 3, 164–172. [Google Scholar] [CrossRef]
  55. Salimi, E.; Saragas, K.; Taheri, M.E.; Novakovic, J.; Barampouti, E.M.; Mai, S.; Moustakas, K.; Malamis, D.; Loizidou, M. The Role of Enzyme Loading on Starch and Cellulose Hydrolysis of Food Waste. Waste Biomass Valor. 2019, 10, 3753–3762. [Google Scholar] [CrossRef]
  56. Pereira, C.R.; Resende, J.T.V.; Guerra, E.P.; Lima, V.A.; Martins, M.D.; Knob, A. Enzymatic conversion of sweet potato granular starch into fermentable sugars: Feasibility of sweet potato peel as alternative substrate for α-amylase production. Biocat. Agric. Biotech. 2017, 11, 231–238. [Google Scholar] [CrossRef]
  57. Bothast, R.J.; Schlicher, M.A. Biotechnological processes for conversion of corn into ethanol. Appl. Microbiol. Biotech. 2005, 67, 19–25. [Google Scholar] [CrossRef] [PubMed]
  58. Zhu, M.; Li, P.; Gong, X.; Wang, J. A comparison of the production of ethanol between simultaneous saccharification and fermentation and separate hydrolysis and fermentation using unpretreated cassava pulp and enzyme cocktail. Biosci. Biotechnol. Biochem. 2012, 76, 671–678. [Google Scholar] [CrossRef] [PubMed] [Green Version]
  59. Dahnum, D.; Tasum, S.O.; Triwahyuni, E.; Nurdin, M.; Abimanyu, H. Comparison of SHF and SSF processes using enzyme and dry yeast for optimization of bioethanol production from empty fruit bunch. Energy Procedia 2015, 68, 107–116. [Google Scholar] [CrossRef] [Green Version]
  60. Beck, M.J. Factors affecting efficiency of biomass fermentation to ethanol. Biotechnol. Bioeng. Symp. 1986, 17, 617–627. [Google Scholar]
Figure 1. Concentration of soluble (free) sugars (a) and reducing sugars (b) that are produced during enzymatic hydrolysis of FORBI via the cellulolytic blend (CE) at different enzymatic loadings (2–30 FPU/g TS FORBI). The results are mean ± SD from six different measurements (N = 6).
Sustainability 13 00259 g001
Figure 2. Concentration of soluble (free) sugars (a) and reducing sugars (b) that are produced during enzymatic hydrolysis of FORBI via different enzymatic mixtures (EMs) of cellulolytic and amylolytic enzymes (composition and loadings are presented in Table 1). The results are mean ± SD from six different measurements (N = 6).
Sustainability 13 00259 g002
Figure 3. Concentration of ethanol versus time (a) and final uptake of carbohydrates (b) during alcoholic fermentation of FORBI with P. anomala at simultaneous saccharification and fermentation (SSF) and separate hydrolysis and fermentation (SHF) via the cellulolytic blend (CE) at enzymatic loadings 10 FPU/g TS FORBI and 30 FPU/g TS FORBI. The results are mean ± SD from six different measurements (N = 6). The statistical difference among values for the uptake of carbohydrates is indicated by different letters next to each bar (Mann Whitney u-test).
Sustainability 13 00259 g003
Figure 4. Concentration of ethanol versus time (a) and final uptake of carbohydrates (b) during alcoholic fermentation of FORBI with P. anomala at simultaneous saccharification and fermentation (SSF) and separate hydrolysis and fermentation (SHF) modes via the enzymatic mixtures EM3 (265 FPU CE/g cellulose, 12 U FA/g starch, and 6 U/g starch) and EM5 (265 FPU CE/g cellulose, 61 U FA/g starch, and 31 U/g starch). The results are mean ± SD from six different measurements (N = 6). No statistical difference among values of CE2-CE30 and EM1-EM5 handlings was observed for the uptake of carbohydrates (Mann Whitney u-test).
Sustainability 13 00259 g004
Figure 5. Experimental data of total carbohydrates and sugars and fitting of sugars (a) and experimental data and fitting of ethanol (b) versus time during alcoholic fermentation of FORBI with P. anomala at separate hydrolysis and fermentation (SHF) via the enzymatic mixture EM5 containing cellulolytic and amylolytic enzymes (composition and loadings are presented in Table 1).
Sustainability 13 00259 g005
Table 1. Composition and enzymatic loadings of enzymatic mixtures used for the hydrolysis of food residue biomass (FORBI).
EnzymesCodeCellulase Blend Fungal AmylaseAmyloglucosidase
FPU/g TSFPU/g CelluloseU/g TSU/g StarchU/g TSU/g Starch
CellulolyticCE22180000
CE55440000
CE1010880000
CE20201760000
CE30302650000
Cellulolytic and AmylolyticEM1001061531
EM23026521200
EM33026521216
EM430265106100
EM5302651061531
Table 2. Ratios of reducing to soluble (free) sugars that are produced during enzymatic hydrolysis of FORBI via a cellulolytic blend (CE) at different enzymatic loadings (2–30 FPU/g TS FORBI) and different enzymatic mixtures (EMs) of cellulolytic and amylolytic enzymes (composition and loadings are presented in Table 1), and estimated saccharification efficiencies, SE. The results are mean ± SD from six different measurements (N = 6). The statistical difference among values of the groups CE2-CE30 and EM1-EM5 handlings is indicated by different superscript letters. The statistical difference among CE and the values of group EM1-EM5 is indicated by an asterisk (Mann Whitney u-test).
EnzymesReducing/Soluble Sugars (%)SE (%)
CE283.55 ± 0.78 abc24.70 ± 1.64 abcd
CE585.18 ± 1.36 d29.81 ± 2.82 aefg
CE1087.08 ± 2.01 a37.55 ± 1.44 abeh
CE2088.12 ± 1.49 b39.35 ± 2.16 afc
CE3090.03 ± 1.46 cd*49.51 ± 3.04 adgh*
EM189.86 ± 1.67 AB45.35 ± 1.66 ABCD
EM291.95 ± 1.5574.40 ± 1.48 EF*
EM392.66 ± 1.3475.81 ± 1.99 GH*
EM494.22 ± 2.16 A87.04 ± 2.22 EG*
EM594.68 ± 1.09 B*86.89 ± 2.06 FH*
Table 3. Ethanol titers, yields, YE/FORBI, YE/S, and fermentation efficiencies, Fes, as estimated from the alcoholic fermentation of FORBI with P. anomala at simultaneous saccharification and fermentation (SSF) and separate hydrolysis and fermentation (SHF) via a cellulolytic blend (CE) at different enzymatic loadings (10 FPU/g TS FORBI, 30 FPU/g TS FORBI) and different enzymatic mixtures (EMs) of cellulolytic and amylolytic enzymes (composition and loadings are presented in Table 1). The results are mean ± SD from six different measurements (N = 6). The statistical difference among values of CE10 -CE30, and EM3 - EM5 handlings is indicated by different superscript letters. The statistical difference of CE30 with EM3 and EM5 handlings is indicated by an asterisk or cross (Mann Whitney u-test).
EnzymesProcessCE
(g/L)
YE/FORBI
(g Ethanolkg FORBI)
YE/S
(g Ethanol/g util.carb.)
FE
(%)
CE10SSF9.26 ± 0.80 ab84.55 ± 7.28 AB0.39 ± 0.0377.29 ± 5.88
SHF9.70 ± 0.62 cd88.50 ± 5.62 CD0.41 ± 0.0281.01 ± 4.31
CE30SSF12.73 ± 0.76 ac*116.21 ± 6.91 AC*0.40 ± 0.0278.86 ± 4.71
SHF12.07 ± 1.00 bd+110.21 ± 9.12 BD+0.40 ± 0.0179.24 ± 2.75
EM3SSF14.15 ± 1.02 +129.12 ± 9.30 +0.40 ± 0.0279.20 ± 4.51
SHF14.47 ± 0.69 *+132.04 ± 6.26 *+0.39 ± 0.0277.30 ± 3.92
EM5SSF15.45 ± 0.75 *+141.06 ± 6.81 *+0.40 ± 0.0379.25 ± 4.92
SHF15.41 ± 0.64 *+140.69 ± 5.80 *+0.42 ± 0.0282.59 ± 4.71
Table 4. Ethanol titer, yields, YE/FORBI, YE/S and fermentation efficiency, FE from the alcoholic fermentation of FORBI with P. anomala during separate hydrolysis and fermentation (SHF) at a fermenter with 1 L working volume, with the enzymatic mixture EM5 (265 FPU CE/g cellulose, 61 U FA/g starch, 31 U A/g starch). The results are mean ± SD from six different measurements (N = 6).
CE
(g/L)
Carbohydrates Uptake (%)YE/FORBI
(g Ethanol/kg FORBI)
YE/S
(g Ethanol/g util.carb.)
FE
(%)
15.09 ± 0.6288.08 ± 2.68138.67 ± 5.690.40 ± 0.0177.98 ± 2.21
Publisher’s Note: MDPI stays neutral with regard to jurisdictional claims in published maps and institutional affiliations.

