Article

Risk Reasoning from Factor Correlation of Maritime Traffic under Arctic Sea Ice Status Association with a Bayesian Belief Network

1
College of Ocean Science and Engineering, Shanghai Maritime University, Shanghai 201306, China
2
Merchant Marine College, Shanghai Maritime University, Shanghai 201306, China
3
College of Marine Ecology and Environment, Shanghai Ocean University, Shanghai 201306, China
4
College of Transportation and Communication, Shanghai Maritime University, Shanghai 201306, China
*
Author to whom correspondence should be addressed.
Sustainability 2021, 13(1), 147; https://doi.org/10.3390/su13010147
Submission received: 16 November 2020 / Revised: 23 December 2020 / Accepted: 23 December 2020 / Published: 25 December 2020

Abstract

:
Sustainable growth should not only be beneficial to the shipping industry in the future, but is also an urgent need to respond to resource and environmental crises and strengthen shipping governance. Maritime traffic in Arctic waters is prone to encounter dangerous ice conditions, and it is essential to study the mechanism of ice collision risk formation in relation to ice conditions. Taking the ship-ice collision risk in Arctic waters as the research object, we propose a dynamic assessment model of ship-ice collision risk under sea ice status dynamic association (SDA) effect. By constructing the standard paradigm of risk factor dynamic association (DA) effect, taking SDA as the key association factor. Combing with other risk factors that affect ship-ice collision accidents, the coupling relationship between risk factors were analyzed. Then, using the Bayesian network method to build a ship-ice collision accident dynamic risk assessment model and combing with the ice monitoring data in summer Arctic waters, we screen five ships’ position information on the trans-Arctic route in August. The risk behavior of ship-ice collision accidents on the selected route under SDA is analyzed by model simulation. The research reveal that the degree of SDA is a key related factor for the serious ice condition and the possibility of human error during ship’s navigation, which significantly affects the ship-ice collision risk. The traffic in Arctic waters requires extra vigilance of the SDA effect from no ice threat to ice threat, and continuous ice threat. According to the ship-ice collision risk analysis under the SDA effect and without SDA effect, the difference in risk reasoning results on the five stations of the selected route are 32.69%, −32.33%, −27.64%, −10.26%, and −30.13% respectively. The DA effect can optimize ship-ice collision risk inference problem in Arctic waters.

1. Introduction

In the past few years, the shipping industry has been introducing necessary measures to improve safety and environmental performance. For example, 30 years ago, oil leakage and personal injuries were a very serious problem [1,2]. About 300,000 tons of oil leaked every year while thousands of human-beings were injured, but today, the number of leakage incidents per year is only about 5000 tons and 900 people died in ship accidents worldwide [3]. Affected by the increasingly extreme climate, for example, the storms that occur in China’s coastal areas have caused great disasters [4], which will inevitably affect the safety of maritime traffic activities. The number of ship damages, casualties and direct economic losses have increased year by year, and the cost of supporting safe operations in the shipping industry has suddenly increased. The more than 50,000 ships sailing on global routes consume nearly 500 million tons of fuel per year, and the amount of greenhouse gases such as carbon dioxide emitted by them is astronomical, causing environmental pollution to surrounding oceans, ports and cities [5].
However, there are still many major challenges ahead. First, in the face of the current resource and environmental crisis, neither the traditional passages nor the minor adjustments should be made. Traditions should be overturned and a sustainable future growth model will be constructed [6]. Second, technology is always the key to the transformation of human society, and also the main means for the sustainable development of shipping [7,8]. A thorough and long-term solution nowadays requires the use of technological innovation to achieve transformation and upgrading more than ever. In view of the opening of Arctic routes, the shipping industry will make full use of Arctic routes for ship transportation to become an inevitable demand and an essential choice [9]. Not only is it conducive to the energy-saving and efficient development of shipping, but it also increases the options for global shipping routes. At the same time, the restrictions on sea ice also have a certain impact on the safety of ship Arctic navigation. Floating ice at sea has a very prominent impact on the safety of ship navigation, and easily causes ship-ice collision accidents [10]. In the vast high-latitude waters, the state of floating ice is interrelated, and this association will form a coupling effect on the navigation risks of Arctic ships during long-distance voyages [11].
The Arctic route has become a new-period waterway connecting eastern Asia/west America to Europe, the normalization of the route selection has received more and more attention, and the maritime traffic in the Arctic waters is becoming more and more common [12]. For commercial ships, navigation in the Arctic northeast route is close to the continental shelf, and has a low probability of the ship encountering sea ice during the voyage, but has a long voyage time relative to the trans-Arctic route. With the melting of Arctic sea ice [13], it is the future trend to sail near the edge of the ice shelf in the center Arctic [14,15]. Ships moving towards the central area of the Arctic waters will encounter continuous changing sea ice condition. Ship-ice collisions will be a serious threaten to the safety of maritime traffic [16,17]. The dynamic risk of maritime traffic in the Arctic under ice conditions is currently a more urgent issue.
When conducting risk reasoning of maritime traffic accidents under the influence of sea ice. Huang simulated the impact of ship-wave-ice interaction on ship-ice collision accident, and predicted the ice impact that ship may encounter when sailing in Arctic waters [18]. By proposing a new method of numerical simulation, the damage of sea ice to propagation was analyzed in [19]. Chai provided a reference for ship structure design through statistics of the characteristics of on year ice in Arctic waters [20,21]. Such studies focus on the impact of the interaction between sea ice and ship’s structure, leading to ship-ice accidents.
In addition, some scholars have analyzed the ship-ice accident risk mechanism to find the main reason for accidents. When analyzing the risk of maritime traffic in the Gulf of Finland in winter, Valdez Banda analyzed the causes of sea ice formation and found the most common ice conditions that affect maritime traffic safety [22]. In view of the risk of ship ice besetting accident, Montewka believes that sea ice affects the speed of ship on the one hand, and on the other hand becomes an obstacle on the channel, leading to ice besetting accidents [23]. Afenyo held the opinion that the failure of sea ice detection technology and the obstruction of sea ice on the channel will lead to ship-ice collision accidents, and analyzed the main reasons leading to ship-ice collision accidents in Arctic waters [24]. When analyzing the collision accident of maritime traffic in the Arctic ice region, Zhang believes that sea ice would mainly damage the structure of ships [25]. Fu thought that whether a ship ice besetting accident occurs depends on the effectiveness of a series of technical operations under sea ice conditions, by establishing a ship ice besetting accident event tree model, the severity of the consequences of ice besetting accident in multiple scenarios is analyzed [26]. Goerlandt [27] used the ship maneuvering data and environmental data, analyzed the safe distance and safe speed between ships and escort ships in Finnish sea under ice condition. In addition, some scholars analyze the main causes of collision accident through analyze accident reports [28,29]. It can be seen that ice conditions have a major impact on ship operation safety, and studies on maritime traffic safety under the influence of ice condition have been carried out in depth from multiple perspectives.
In the current analysis of ship-ice accident risk reasoning, relevant scholars pay a lot of attention to finding key risk factors and their relationship, but, a key issue is overlooked, maritime traffic in the Arctic waters is a typical dynamic process, the association effects of risk factor proposed in research [30] should also exist in the study of maritime traffic risk assessment. Thus, we propose the dynamic association (DA) effect of risk factor. Focusing on the impact of sea ice on ship Arctic navigation risk, we analyze the ship-ice collision accident risk under sea ice status dynamic association (SDA), which is of positive significance for advancing maritime traffic risk research in Arctic waters.
In the field of maritime traffic risk research, the commonly used analysis methods include fault tree [31,32], event tree [33,34], analytical hierarchy process method [35,36], and Bayesian analysis methods [37,38]. Among them, Bayesian analysis methods can effectively combine subjective and objective information and are widely used in ship Arctic navigation risk analysis. Fu established a Bayesian prediction model to predict and analyze the risk of ship ice besetting accidents in Arctic waters [39]. BAKSH established a Bayesian risk assessment model for three types of maritime traffic accidents: collisions, grounding and founding in Arctic waters [40]. Khan constructed an object-oriented Bayesian network risk assessment model to analyze the ship-ice collision risk in Arctic waters, and determined the root cause of the collision accident to support ship operation decision-making [41]. Khan used the dynamic Bayesian analysis method to analyze the main risk factors of the Arctic ship-ice collision accidents [42]. These studies have proved the advantages of Bayesian networks in the analysis of evidence information. The risk assessment of ship navigation under the SDA effect contains a lot of uncertainty analysis. Therefore, it is suitable to use the mature method of Bayesian analysis to carry out this research.
In the following parts of this study, we plan to establish a ship-ice collision risk analysis model under the SDA effect. The Bayesian network is used to analyze the dynamic change of maritime traffic risk in the Arctic waters. Besides, sea ice monitoring data in the Arctic waters are used to explore the influence of ice conditions on the risk of ship-ice collisions. In Section 2, we introduce how to perform Bayesian network risk reasoning under SDA. The obtain of relevant data and the calculate of prior probability distribution (PPD) and conditional probability distribution (CPD) in Bayesian risk assessment network are discussed in Section 3. Section 4 discusses the changes that SDA effect brings to ship Arctic navigation risk analysis. Section 5 provides the conclusions of this research effort.

2. Materials and Methods

2.1. Risk Definition of Maritime Traffic under Status Association

The dynamic association effect of one risk factor refers to that the risk factor’s impact on maritime traffic risk is not only related to the risk factor’s current state, but also related to the risk factor’s state in the past time. The DA effect of one risk factor can be expressed by Equation (1). Under the DA effect, a cumulative effect will occur in the risk factor, thereby forming a dynamically associated risk factor T. Among them, Sn refers to the n-th risk factor, Sin refers to the i-th state of the n-th risk factor, t refers to the occurrences of DA effects of risk factor Sn, and the number of states of T is it.
T = t = 1 m ( S n i ) t
Risk refers to the occurrence probability of accident [43]. The ship-ice collision in Arctic waters is caused by a series of risk factors. Under the DA effect of one risk factor, the maritime traffic risk in Arctic waters can be expressed by Equation (2):
R = P ( f ( S 1 , S 2 ,   , S n 1 , T ) )
Among them, R is the risk value of a risk factor in a ship-ice collision accident, and its value is equal to the probability of occurrence of the risk factor S is the sub-factor that affects the risk factor, T represents the DA effect of one risk factor, and f is the coupling relationship between the risk factor to be assessed and its sub-factors.

2.2. Risk Factors Network Structure on Ship-Ice Collision

The accident causation theory can explain why and how accidents happen [44], and risk analysis is often based on this. In the causation analysis of ship collision accidents, part of the research is based on the large number of ship traffic accidents reports that have occurred [45,46]. In the causation analysis of accidents, ship traffic accident reports are often a small proportion. It is an effective way to infer the logical relationship of risk factors through the subjective judgment of experts [47]. And it is often encouraged by the International Maritime Organization [48].
Combining the analysis of the main causes of maritime traffic accidents in Arctic waters from 1993 to 2001 in [17], and the risk reasoning of ship-ice collision accidents in Arctic waters in [24]. We analyzed the risk factors that influence ship-ice collision accidents based on expert knowledge. Detail information about risk factors is refereed as Table 1. The risk factors that influence the occurrence of ship-ice collision accidents are divided into three types: initial events (X), intermediate events (M) and target event (N).
Refer to the risk factors and relationships of ship-ice collision accident risk assessment in [22,23,24], the relationship between the risk factors is logically analyzed. Regarding the influence of ice condition, it is believed that SDA determines the degree of threat by sea ice, and the cumulative effect it produces may affect human. Based on this, the logical relationship of the risk factors cause ship-ice collision accident in the Arctic waters is analyzed, and the Bayesian network of ship-ice collision risk assessment for ship Arctic navigation is constructed, as shown in Figure 1.
In the ship-ice collision accident risk assessment Bayesian network, N represents the ship-ice collision accident, according to whether the accident occurs, its status is divided into yes or no. M represents the intermediate process in which N is triggered by X, and divides its state into increase, constant, or decrease, which means that the probability of occurrence of M increases, constant, or decreases after X occurs.

2.3. Status Dynamic Association on Ship-Ice Collision

According to the influence of ice condition on the safety of maritime traffic, the influence of ice condition is expressed by No Adverse Impact (NAI) and Have Adverse Impact (HAI), respectively. NAI means that the influence of ice condition on the navigation safety of ship can be ignored, and HAI means the ice encountered by ship will have an impact on the safety of maritime traffic. With reference to the International Code for Ships Operating in Polar Waters (polar code) for maritime traffic in the Arctic waters [49], it is assumed that when the sea ice concentration (SIC) is below 48%, the impact of SIC is NAI, and the SIC is above 48%, the impact of SIC is HAI. This study assumes that the human’s response to ice condition during ship’s voyage is only affected by ice conditions for two consecutive days (the current day and the previous day). Therefore, I = 2, t = 2, the state of SDA can be expressed by Equation (3). In the set of X, the state of initial events except X1 are divided into “yes” or “no”, according to whether the event occurs:
X 1 i t = { N A I N A I , N A I H A I , H A I N A I , H A I H A I }

2.4. Reasoning Method of Node Parameter in Factors Correlation Network

2.4.1. Bayesian Inference Method of Ship-Ice Collision Risk

According to Equation (2), we can know that in ship-ice collision accident, the risk of a factor is caused by other risk factors. The Bayesian inference process of risk can be expressed by Equation (4):
P ( S n , p a r e n t s ( S n ) ) = P ( S n | p a r e n t s ( S n ) ) p ( p a r e n t s ( S n ) )
Among them, P(parents(Sn)) called PPD, P(Sn|parents(Sn)) refers to the probability of Sn obtained under certain evidence information parents(Sn), called CPD, which is used to describe the process of generating data Sn.
From Figure 1, we can know that the occurrence of the ship-ice collision accident (N1) is directly caused by the risk event M1, M4, and M9. According to Equation (4), the Bayesian inference process of N1can be represented by Equation (5):
R ( N 1 ) = P ( N 1 , p a r e n t s ( N 1 ) ) = P ( N 1 , M ) = M P ( N 1 | M ) P ( M ) = P ( N 1 | M 1 ) P ( M 1 ) + P ( N 1 | M 4 ) P ( M 4 ) + P ( N 1 | M 9 ) P ( M 9 )
In the process of solving Equation (5), since the event M is an intermediate event, its PPD cannot be directly obtained. It is necessary to find all the parent nodes that affect the occurrence of M, in turn until the initial event X appears, and then use Equation (4) to perform joint inference. In order to simplify this calculation process, the chain rule of CPD is introduced to solve it. The solution to the joint probability of risk events { S 1 , S 2 , , S n } can be calculated by Equation (6):
P ( S 1 , S 2 , , S n ) = P ( S n | S n 1 , , S 1 ) P ( S n 1 , , S 1 ) = P ( S n | S n 1 , , S 1 ) P ( S n 1 | S n 2 , , S 1 ) P ( S n 2 , , S 1 ) = P ( S n | S n 1 , , S 1 ) P ( S n 1 | S n 2 , , S 1 ) P ( S 2 | S 1 ) P ( S 1 ) = P ( S 1 ) j = 2 n P ( S j | p a r e n t s ( S j ) )
According to Equations (4)–(6), the Bayesian risk inference process of N1 can be expressed by Equation (7):
R ( N 1 ) = P ( N 1 , M , X ) = P ( N 1 | M , X ) P ( M , X ) = P ( N 1 | M , X ) P ( M | X ) P ( X ) = k = 1 14 P ( X k ) P ( N 1 | p a r e n t s ( N 1 ) )

2.4.2. Bayesian Method of Risk Inference under Evidence Information

In risk analysis, it is often necessary to perform reverse reasoning, that is, according to the evidence information of the child node, reverse the probability change of the parent node. The Bayesian reasoning method of this process is expressed by Equation (8):
P ( p a r e n t s ( S n ) | S n ) = P ( S n | p a r e n t s ( S n ) ) p ( S n ) P ( p a r e n t s ( S n ) )
Among them, P(parents(Sn)|Sn) is called posterior probability distribution (PoD), which represents the probability of occurrence of risk event parents(Sn) after the evidence update, which is the required event probability. P(Sn) represents the probability of event Sn under any hypothesis, which called standardized constant.
In the Bayesian network structure of Figure 1, the occurrence of X1 will directly affect M1, and then indirectly lead to the occurrence of N1. Take the Bayesian inference of this process as an example. The main purpose of this reasoning process is to analyze the degree of change in each state of X1 when N1i=yes, so as to find the state that has a greater impact on the collision accident. Since N1 and X1 are indirect relationships in the Bayesian network structure and cannot be solved directly, they need to be solved jointly with the Equation (6) on the basis of Equation (8). The calculation process is shown in Equation (9), where the solution of P(N1) is referred to Equation (7):
P ( X 1 | N 1 i = y e s ) = P ( X 1 ) P ( N 1 i = y e s | X 1 ) p ( N 1 i = y e s ) = P ( N 1 i = y e s | X 1 , M 1 ) P ( M 1 | X 1 ) P ( X 1 ) k = 1 14 P ( X k ) P ( N 1 i = y e s | p a r e n t s ( N 1 ) )

2.4.3. The Calculation Approach of Factors Network Parameters

The necessary parameters for Bayesian network inference include PPD P(Sn) and likelihood P(Sn−1|Sn). Other parameters can be calculated after these two parameters are known. In addition to the method of mathematical statistics, the solution of Sn needs to be solved by subjective judgment in most cases. Among them, the calculation of mathematical statistics method is shown in Equation (10):
P ( S n i = h ) = A ( S n i = h ) A ( S n i )
Among them, A ( S n i ) represents the frequency of occurrence of all states in risk factor Sn, and i = h represents the h-th state among all i states of the risk factor S.
P(Sn−1|Sn) is the CPD calculation under certain information. In Bayesian analysis, it is usually judged based on experience. Since experts often come from different fields, they are different in age, experience, and knowledge reserves, and judgments on the results are also different. The Dempster-Shafer (D-S) theory has great advantages in dealing with the joint solution of multi-source information fusion, so, a CPD calculation method based on the D-S theory is proposed. First, define the universe of discourse in the form of a combination of CPD between the states of two directly related nodes in the Bayesian network, as shown in Equation (11), α represents the CPD function between two states of two nodes:
Θ = { α 1 , α 2 , α n }
On this basis, define the mass function on the universe, and each mass function represents an expert’s scoring of CPD. In a mass function, m ( ϕ ) = 0 , α Θ m ( α ) = 1 needs to be satisfied. For the scoring opinions of multiple experts, that means multiple mass functions, represented by m1, m2, , mn and their synthesis rules are denoted by Equation (12). By combining the opinions of multiple experts, a CPD between two nodes with mutual dependence is obtained:
m 1 m 2 m n ( α ) = K α 1 α 2 α n = α m 1 ( α 1 ) m 2 ( α 2 ) m n ( α n )
K 1 = α 1 α 2 α n ϕ m 1 ( α 1 ) m 2 ( α 2 ) m n ( α n ) = 1 α 1 α 2 α n = ϕ m 1 ( α 1 ) m 2 ( α 2 ) m n ( α n )

2.5. Data Collection

Maritime traffic in Arctic waters will tend to the central area [14,50], so we select a hypothetical trans-Arctic route and take maritime traffic risk on this route as the assessment object, which is provided by [51], as shown in Figure 2. Based on the maritime traffic information for five consecutive days on this route, the ship-ice collision risk on this route is analyzed.

2.5.1. Prior Probability Distribution of Factors Network Parameters

The database of the National Snow & Ice Data Center (NSIDC) contains a variety of physical data information in the Arctic waters. According to the needs of this research, satellite platforms DMSP 5D-3/F17 and DMSP 5D-3/F18 are selected and the “Near-Real-Time DMSP SSMIS Daily Polar Gridded Sea Ice Concentrations, Version 1” data product is obtained, and the relevant information is shown in Table 2. The data set divides the Arctic sea ice data into a grid of 448 rows × 304 columns, and the value is the daily average change of SIC within a 25 km × 25 km spatial coverage area. During data processing, the ship’s position information is the point coordinates, and the SIC data is the regional average. The average SIC data of the grid to which the ship’s position coordinates belong is used as the SIC data of the ship’s location.
According to the position coordinate information of the five points and starting point on the selected route, a total of 186 pieces of data on the daily change of SIC in August 2018 for these six positions in the database are extracted, as shown in Figure 3. By analyzing the influence of SIC on the maritime traffic risk, with the SIC value of 48% as the limit, the original data of SIC is changed into two state discrete data (NAI or HAI). On the basis of the four states of X1 given in Equation (3), the discrete data of two states is changed to the distribution of four states, and then the PPD of the four states of X1 is calculated in combination with Equation (10), as shown in Table 3.
The PPDs of other root nodes in the model are obtained by combining other literature (OL) and expert judgment (EJ), as shown in Table 4. EJ relies on five professionals who have rick experience in the shipping industry and are familiar with polar navigation practice. Among them, two experts are captains from the China Polar Research Center, with more than 15 years of ship driving experience, and have long been engaged in the driving operations of the Chinese polar scientific research mission. One expert is a professor from Shanghai Maritime University, he has been engaged in maritime traffic risk research for more than 20 years, and has devoted himself to ship navigation risk research in Arctic waters for the past five years. Another two experts are captains from COSCO Special Transport Group, which is actively engaged in the commercial operation of Arctic routes. The two captains have many experience in Arctic routes. Use the five experts to judge the probability of risk factors, and take the average value of their judgments as actual probability.

2.5.2. Conditional Probability Distribution of Factors Network Parameters

In Bayesian network reasoning, the calculation of CPD mainly relies on expert experience. In Section 2.4.3, the CPD calculation method based on D-S theory is introduced. Since ice condition will directly affect human error, take the calculation of the CPD of SDA’s state NAI-HAI on human error as an example. Table 5 shows the scores of the five experts on the human error status of increase, constant, and decrease under the influence of state NAI-HAI.
In the calculation of CPD in the above situation, according to Equation (9), the universe of discourse is Θ = { i n c r e a s e , c o n s t a n t , i n c r e a s e } . According to Equation (13), the consistency coefficient K of five expert opinions is calculated, and on this basis, by utilizing Equation (12), the CPD of the influence of NAI-HAI on human error after the combined opinions of five experts is obtained. In other cases, the calculation methods of CPD are in the same pattern, and finally the CPD of human error under SDA is obtained, as shown in Table 6.
K 1 = α 1 α 2 α n ϕ m 1 ( α 1 ) m 2 ( α 2 ) m n ( α n ) = m 1 ( i n c r e a s e ) m 2 ( i n c r e a s e ) m 3 ( i n c r e a s e ) m 4 ( i n c r e a s e ) m 5 ( i n c r e a s e ) + m 1 ( c o n s t a n t ) m 2 ( c o n s t a n t ) m 3 ( c o n s t a n t ) m 4 ( c o n s t a n t ) m 5 ( c o n s t a n t ) + m 1 ( d e c r e a s e ) m 2 ( d e c r e a s e ) m 3 ( d e c r e a s e ) m 4 ( d e c r e a s e ) m 5 ( d e c r e a s e ) = 0.69 0.64 0.72 0.85 0.91 + 0.28 0.33 0.28 0.13 0.08 + 0.03 0.03 0.04 0.02 0.01 = 0.246

3. Result

3.1. Comparative Analysis of Maritime Traffic Risk

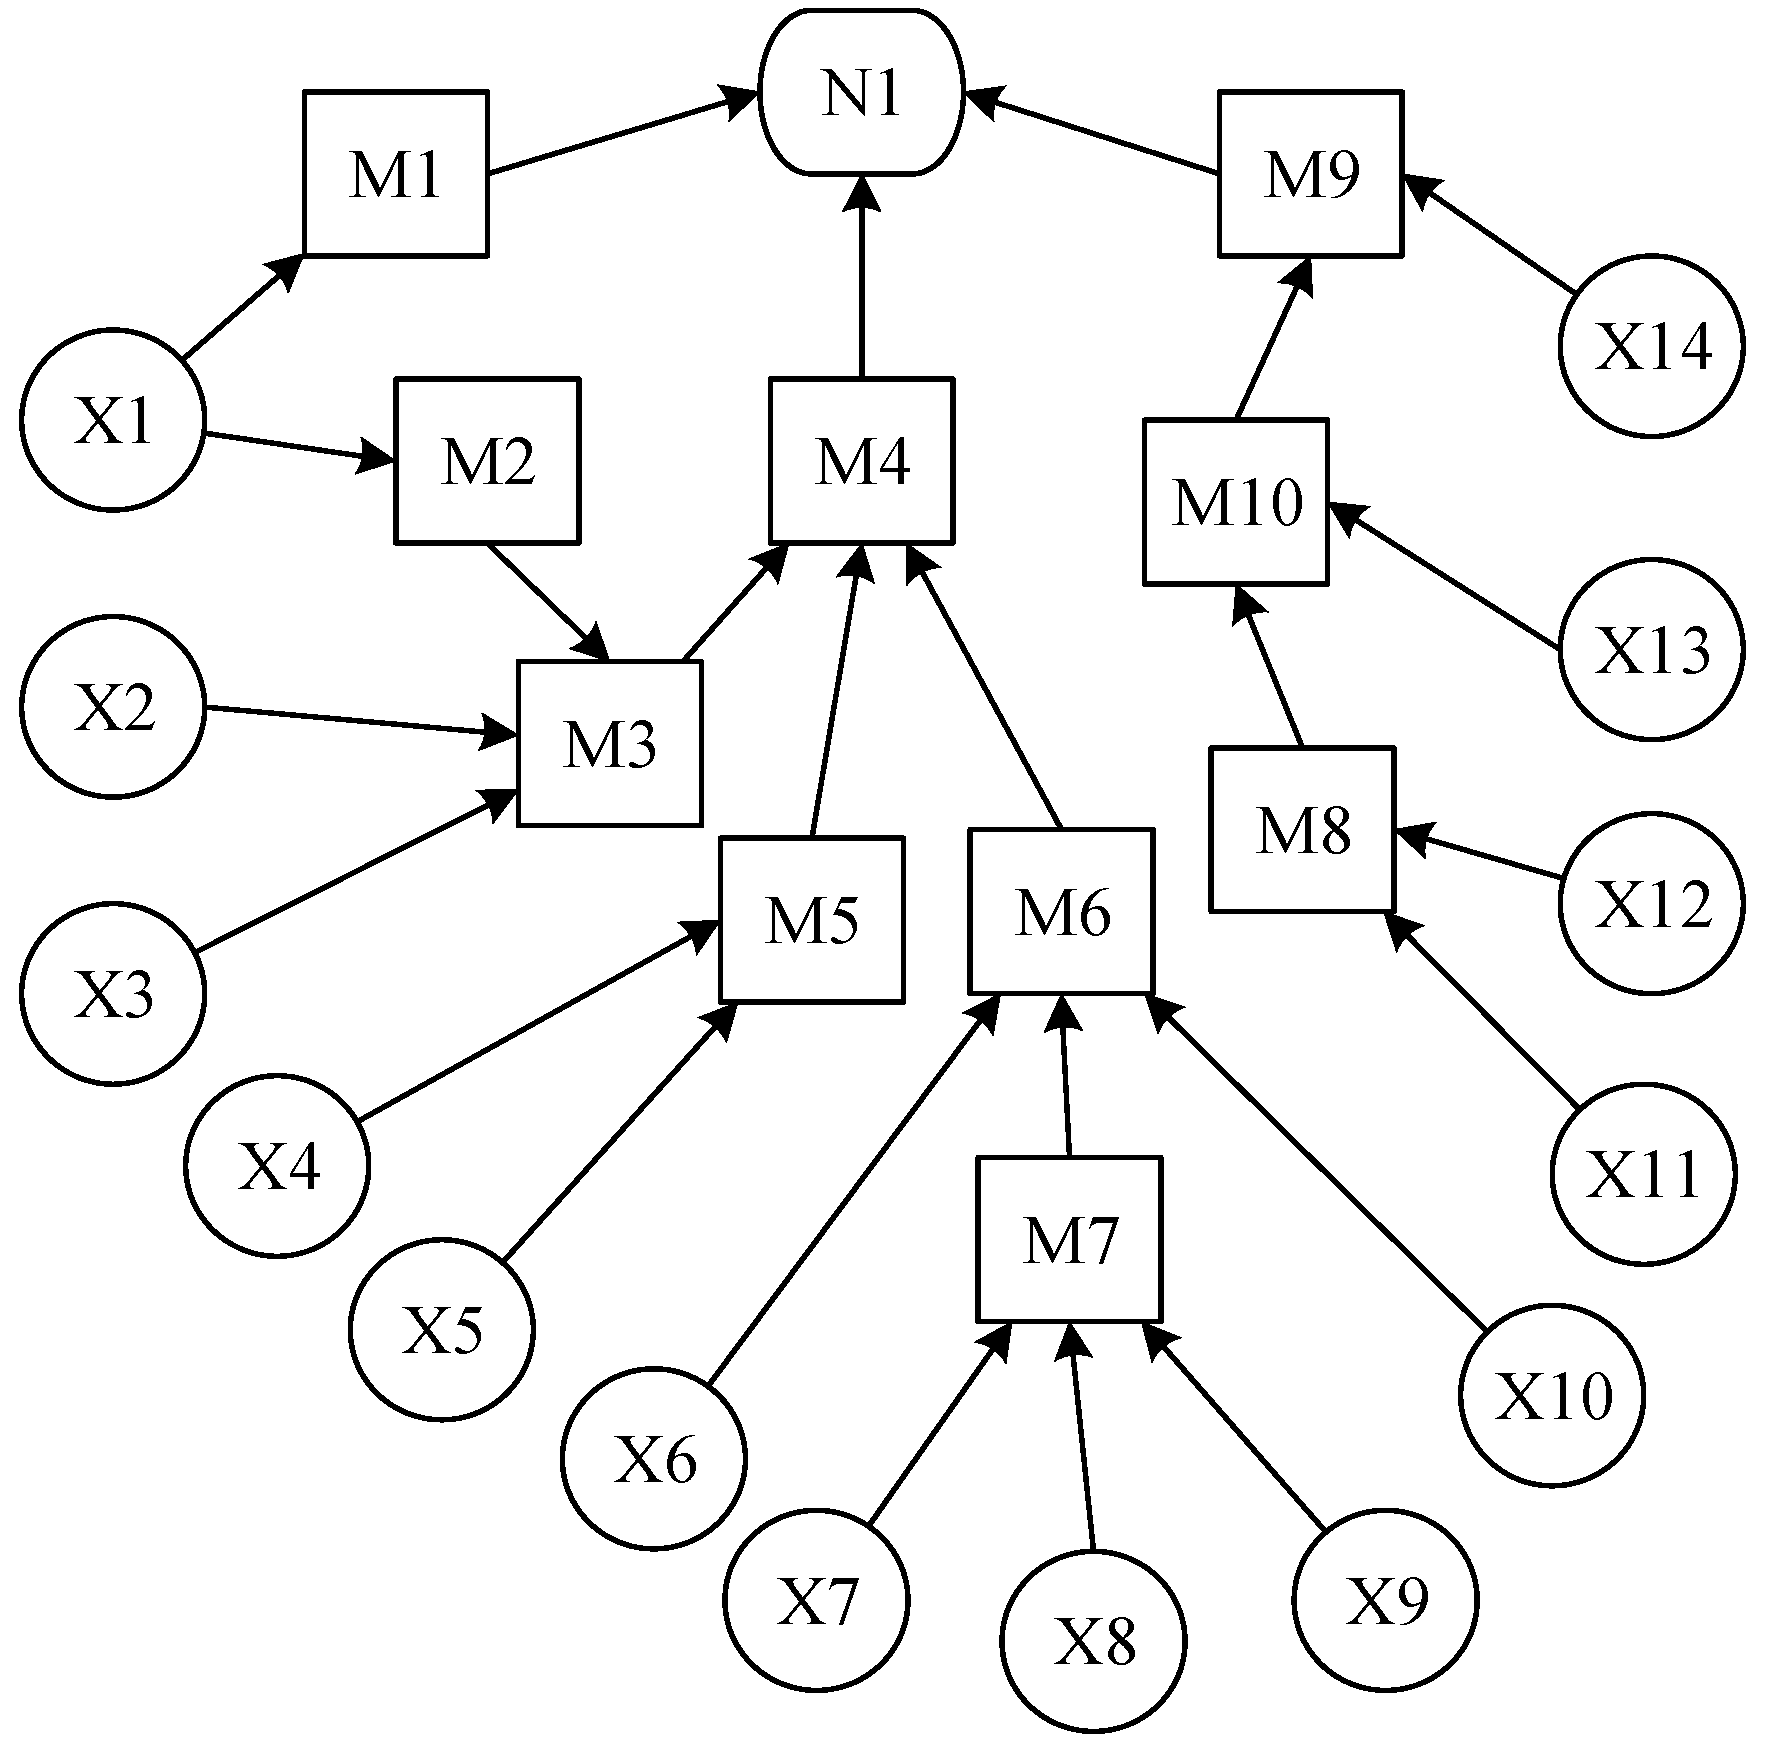
The ship-ice collision accident risk Bayesian network assessment model (AM) in Figure 1 is used to analyze the impact of SDA on ship-ice collision risk. Besides, the node X1 in AM is deleted, and the node M1 and M2 will change to root node. By giving the PPD of node M1 and M2 to establish a sea ice non-associated control model (CM). 
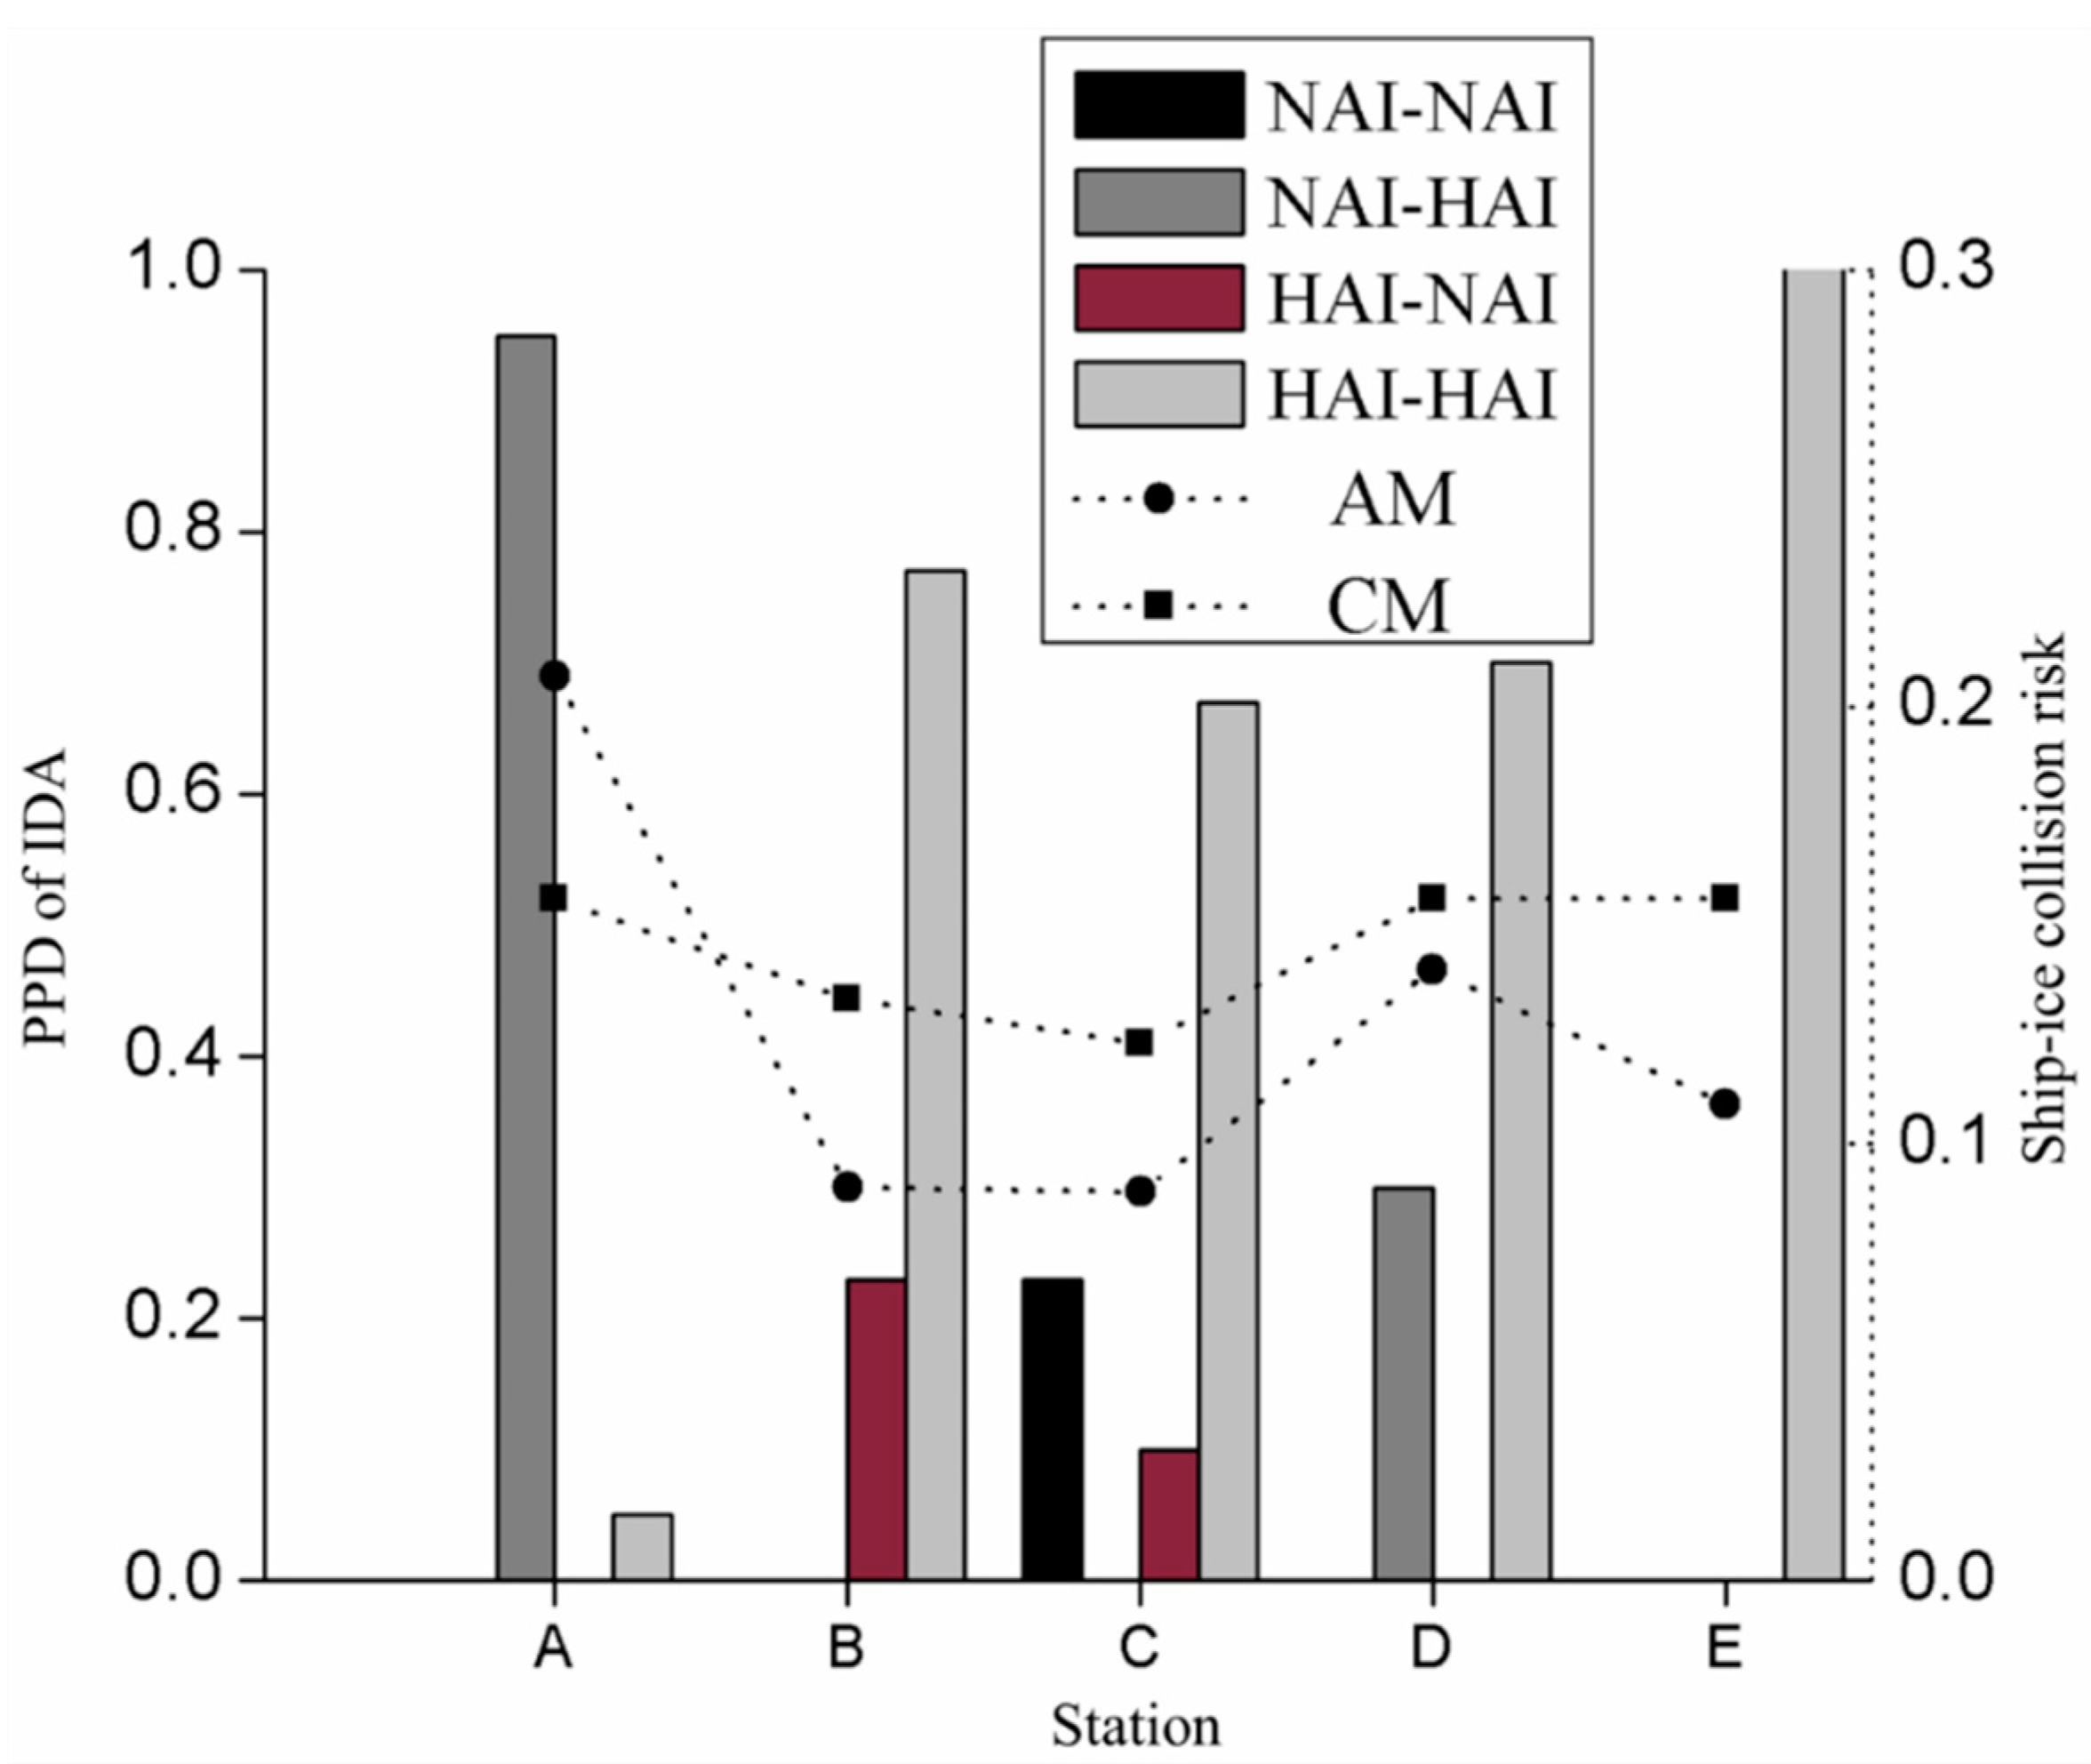
Figure 4 shows the SDA information at the five positions, and the Bayesian network reasoning result of the ship-ice collision risk through running the AM and the CM, respectively.
The probability of ship-ice collision on the selected route is around 0.15. Through the CM, the risk of ship-ice collision accident along the route are 0.16, 0.13, 0.12, 0.16, and 0.16. By using the AM, the risk of ship-ice collision accident are 0.2, 0.09, 0.09, 0.14, and 0.11. The risk change trends calculated by the two models are basically the same, but at the same location, the model analysis results under the SDA are more sensitive to ice condition. At station A, the risk assessment result of the AM is 32.69% higher than that of the CM. At station B, C, D, and E, the risk assessment results of the CM are higher than that of the AM, which are 32.33%, 27.64%, 10.26%, and 30.13%, respectively.

3.2. The Impact of Ice Condition on Maritime Traffic Risk

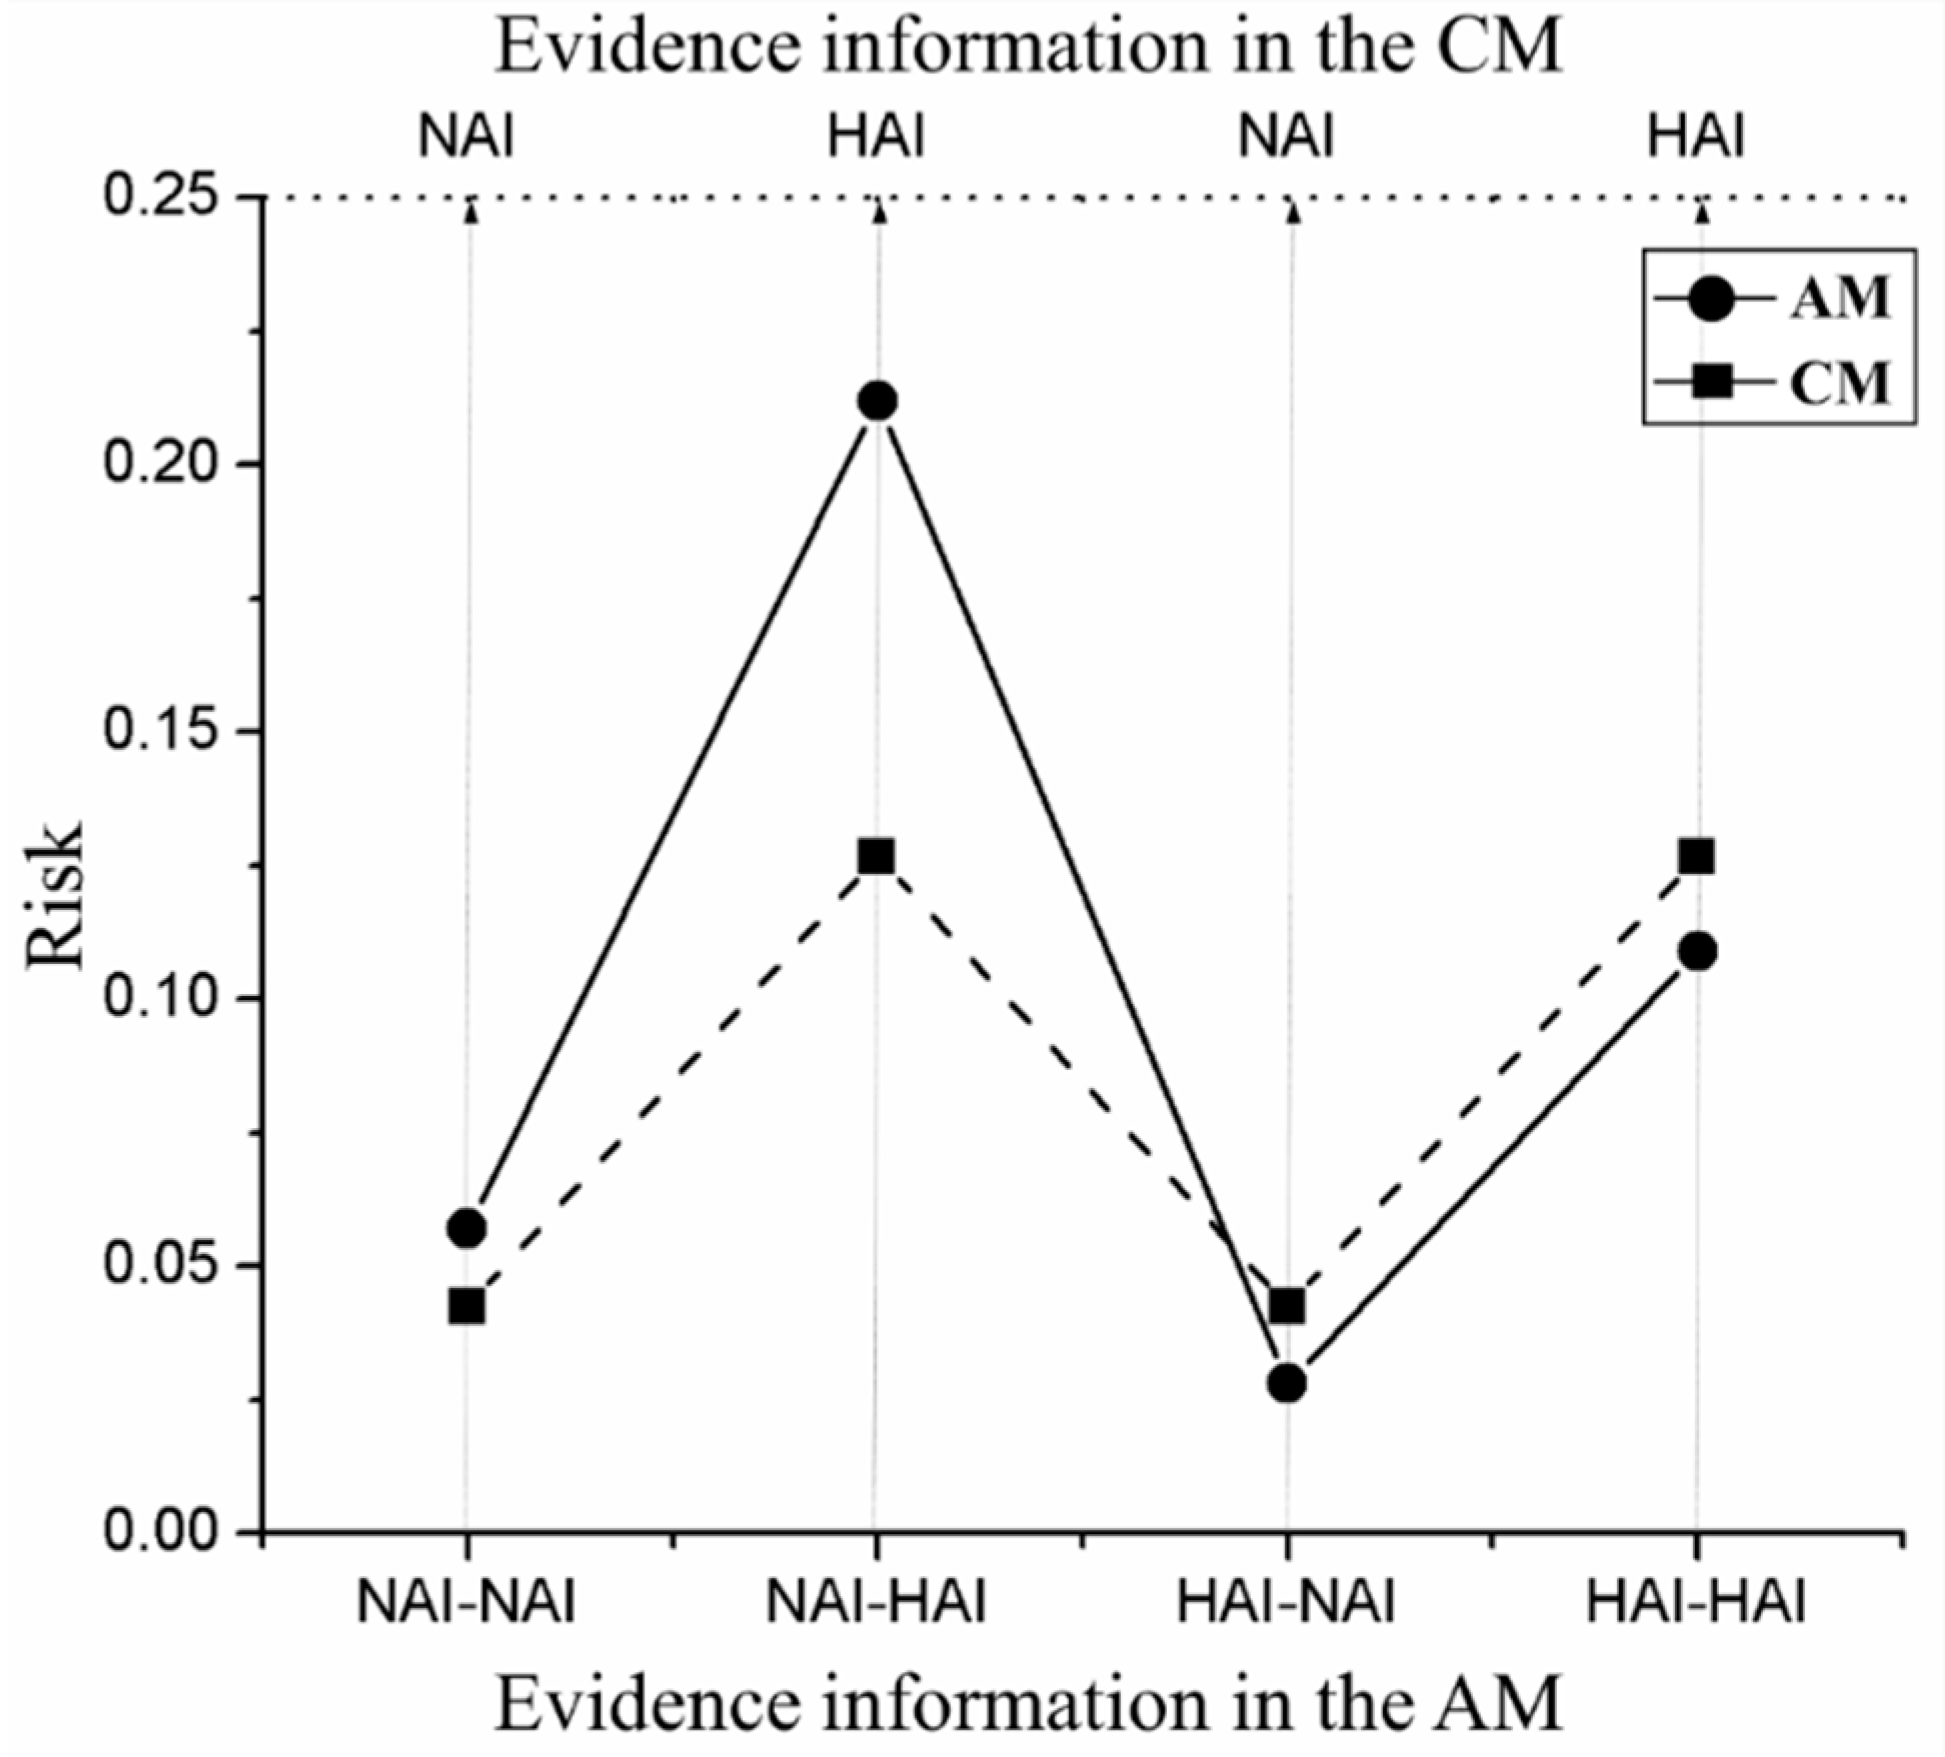
To further explore the difference of risk assessment results between the AM and the CM, the evidence information of SDA in the AM are set as P(NAI-NAI) = 1, P(NAI-HAI) = 1, P(HAI-NAI) = 1, and P(HAI-HAI) = 1, the evidence information in the corresponding CM are P(NAI) = 1, P(HAI) = 1, P(NAI) = 1, and P(HAI) = 1, respectively. Figure 5 shows the ship-ice collision risk assessment result by updating the model information.
According to the risk assessment results of the AM and CM under the evidence information of SDA’s each state, with or without SDA effect, maritime traffic risk show obvious differences:
(a)
When the evidence information in AM and CM are P(NAI-NAI) = 1 and P(NAI) = 1, the risk assessment results are basically the same, and the risk assessment result in the AM is slightly higher than those in the CM.
(b)
When the evidence information in AM and CM are P(NAI-HAI) = 1 and P(HAI) = 1, the risk assessment result in the AM is significantly higher than that in the CM.
(c)
When the evidence information in AM and CM are P(HAI-NAI) = 1 and P(NAI) = 1, P(HAI-HAI) = 1 and P(HAI) = 1 respectively, the risk assessment results in the AM are lower than those in the CM.
Recalling the ship-ice collision risk assessment results in Figure 4:
  • When the ship at station A, the state with a higher probability of SDA is NAI-HAI, which is close to the state of scenario b), so the risk assessment result of the AM is significantly higher than that of the CM.
  • When the ship is at station B, C, D, and E respectively, the state with a higher probability of SDA is HAI-HAI, which is close to the state of scenario c), so the risk assessment result in the CM is higher than AM.

3.3. Model Validation

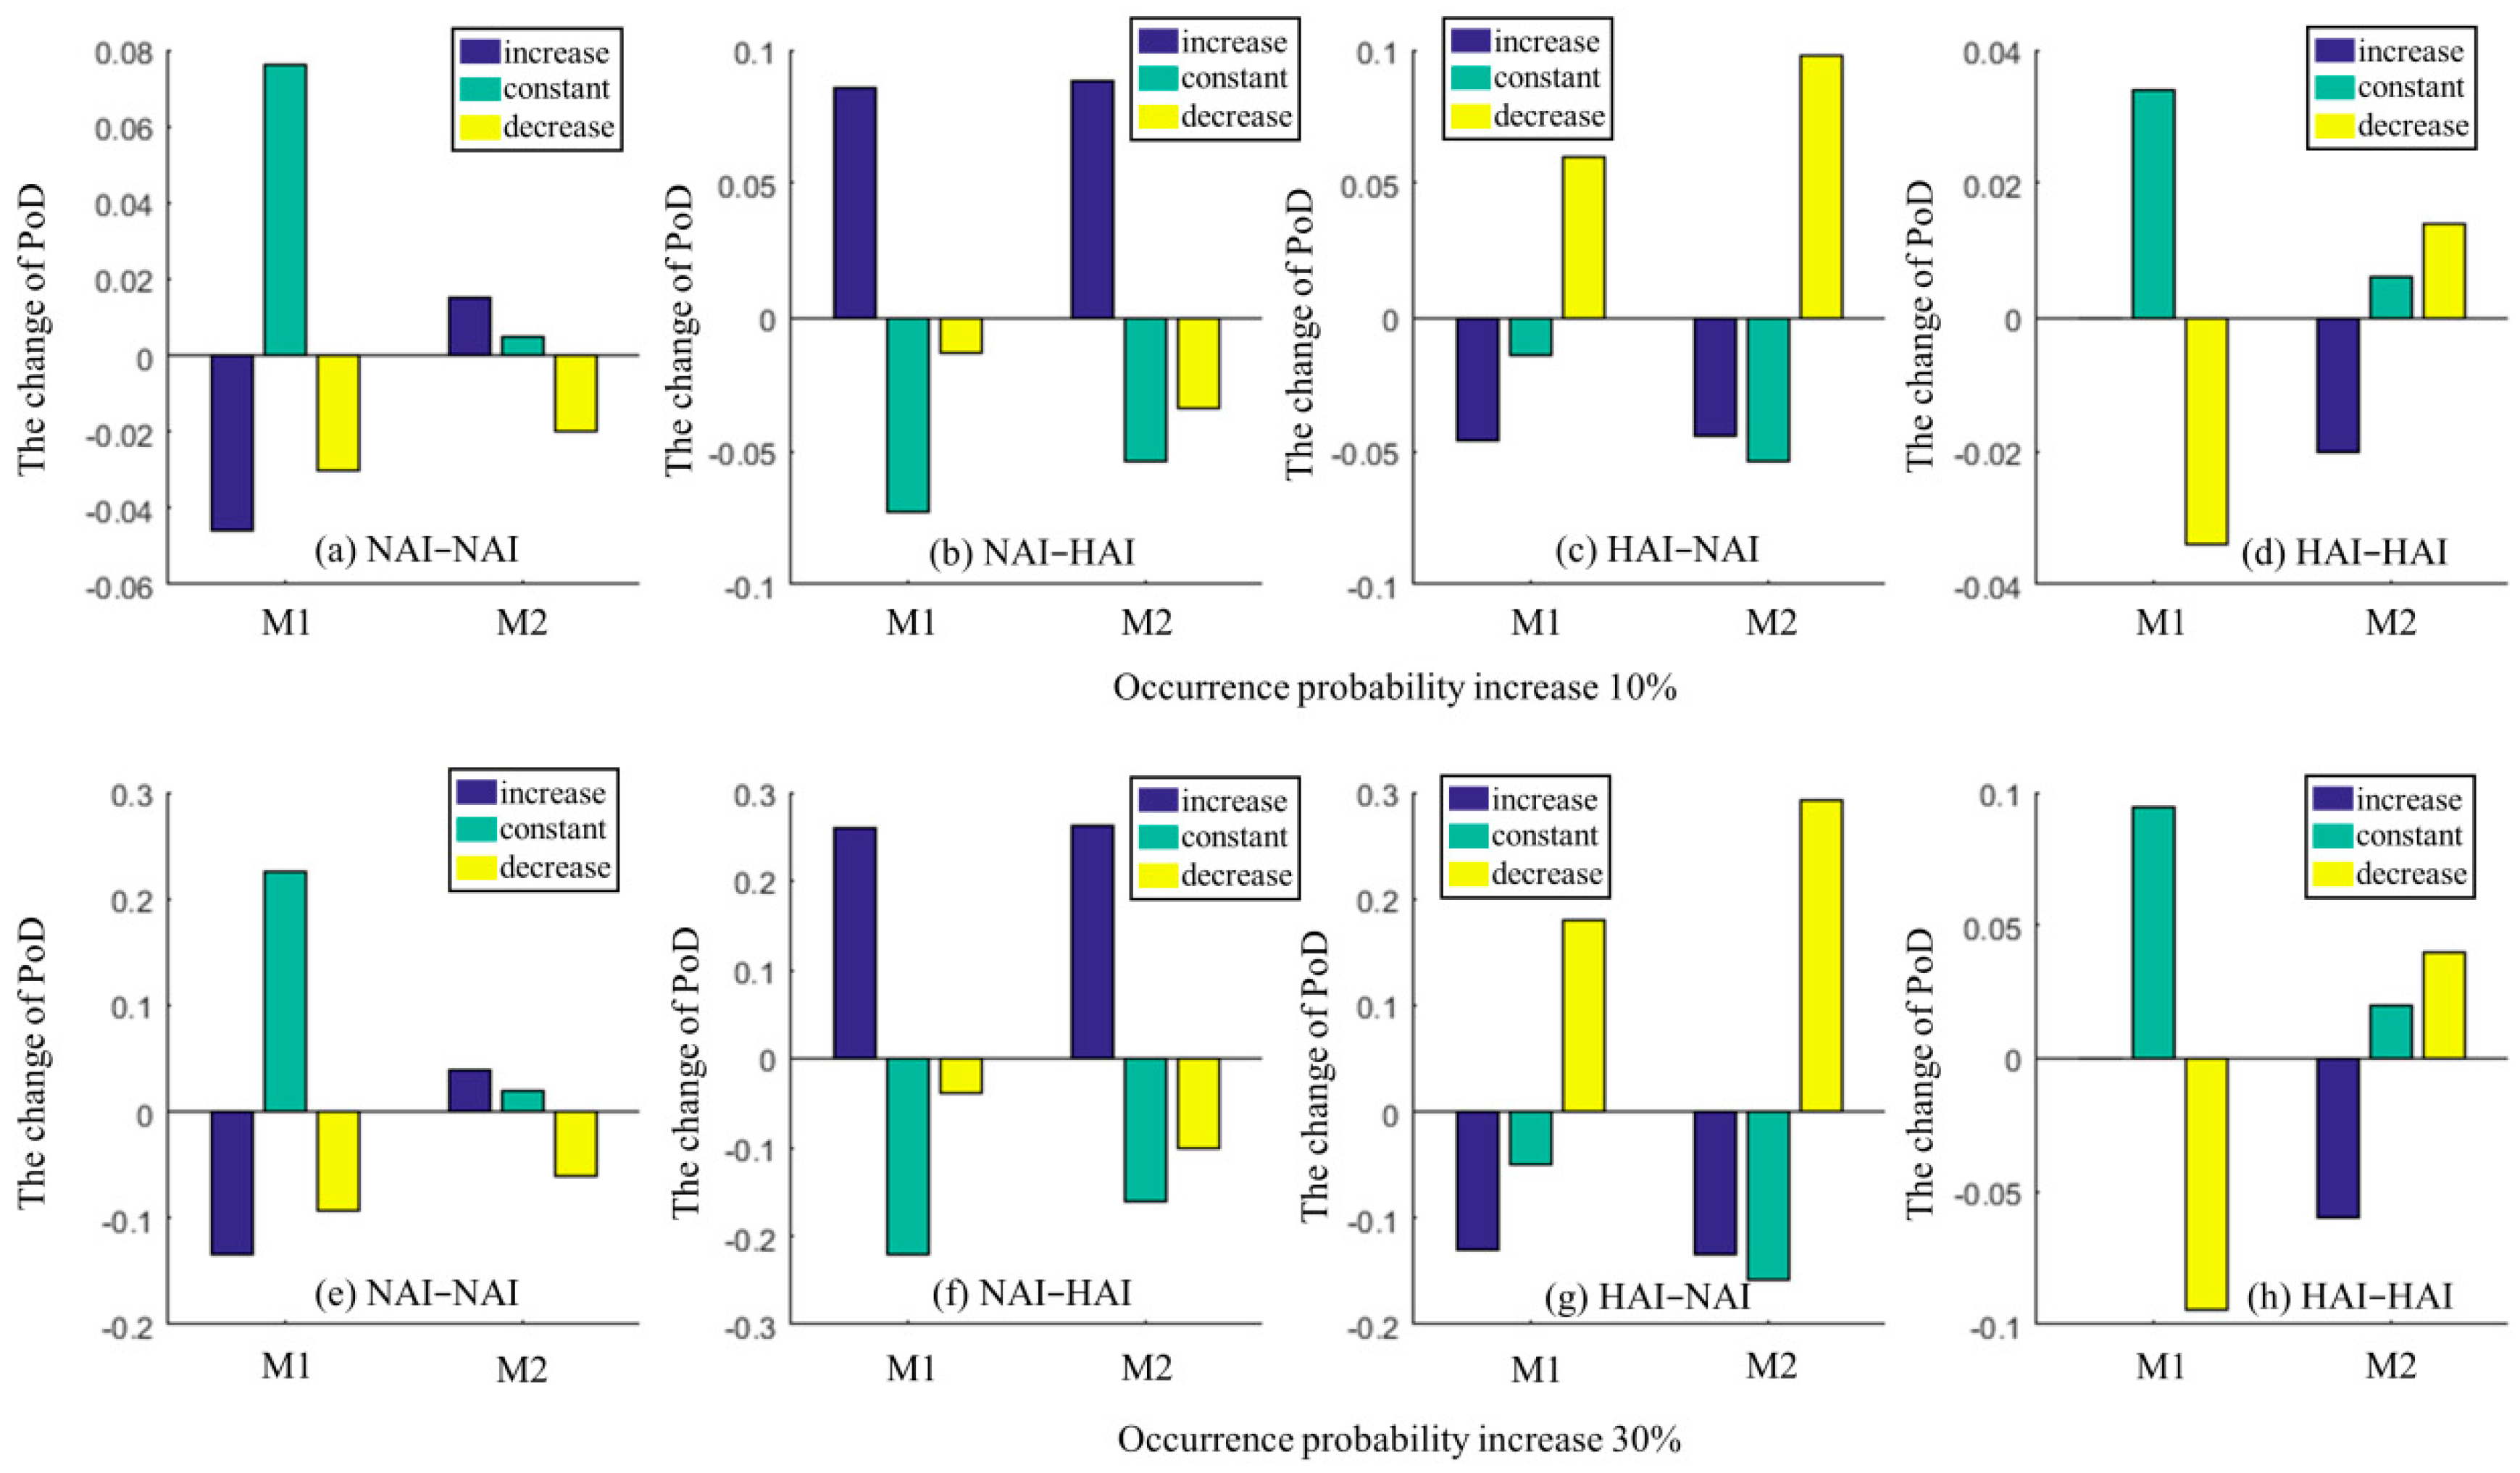
Through increasing the state occurrence probability of SDA’s every state in the AM by 10% and 30% respectively, observe the changes of PoD for each state in M1 and M2 to analyze the impact of SDA on the ship-ice collision risk, the results of PoDs are shown in Figure 6a–d and Figure 6e–h respectively.
With the increase in the occurrence probability of NAI-NAI, the occurrence probability of M2 is likely to increase, while the occurrence probability of M1 remains stable, indicating that the vigilance of ship operators will decrease under the continuous state of no ice threat, resulting in a slightly higher navigation risk, but the navigation risk is still far lower than in other states. The increase in the occurrence probability of NAI-HAI will cause the occurrence probability of M1 and M2 to increase at the same time, indicating that the sudden sea ice threat affects navigation safety at the same time on M1 and M2, and ship operators are insufficiently prepared to respond to sudden sea ice threats. When the occurrence probability of state HAI-NAI increases, the occurrence probability of M1 and M2 will decrease instead, indicating that the sudden disappearance of sea ice threat will have a negative effect on M1 and M2, and ship operators are still on sea ice threat alert status. Under the increase in the occurrence probability of HAI-HAI, the occurrence probability of M1 remains unchanged, but the occurrence probability of M2 is likely to decrease, indicating that when the sea ice threat continues to exist, ship operators will maintain the sea ice threat alert state, which will reduce the maritime traffic risk. However, the overall navigation risk under HAI-HAI of is still high.
The ship-ice collision risk analysis under the SDA can reflect the influence of the status change of human on the navigation risk under the change of SIC. During the navigation, it needs to be extra vigilant of the SDA status of NAI-HAI and HAI-HAI.

4. Discussion

In relevant studies, researchers often pay attention to risk factors’ relationships and analyze risk factors’ comprehensive effects through different methods and models to assess maritime traffic risk [52,53], but maritime traffic is a dynamic process, and humans on board continuously adapt to various maritime traffic environments during the navigation process, so, their adaptability to the state of risk factors will also change accordingly. This means that even the same risk factor status, under different association modes, will have different effects on maritime traffic risks. Therefore, we propose a DA effect of risk factor’s state, in which we pay attention to the impact of risk factor’s state changes with time on maritime traffic risk. To assess the maritime traffic risk in Arctic waters under DA effect, based on the ship-ice collision risk behavior under the influence of dynamic sea ice, we establish a Bayesian network model of ship-ice collision risk with multi-factor coupling to explore the Impact of SDA to ship-ice collision accident risk. Combined with the SIC sample data of the trans-Arctic route in Arctic waters, the proposed model reveals the general regulation of the dynamic risk for ship Arctic navigation under SIC. Under the DA effect of risk factor’s state, the perception of maritime traffic risk has also changed. Results show that the AM’s response to different SDA effects is robust, and the SDA effect has a positive impact on the manifestations of human error and serious ice condition. The ship-ice collision risk under SIC is formed through SDA.
The impact of association effects on driving is more in road traffic safety research. Because in-vehicle information systems (IVIS) are widely used in vehicles, drivers continuous use the IVIS during driving will form behavioral adaptation effects [54]. Some drivers perform risky driving because of excessive participation in IVIS during driving, but, some drivers respond positively to the safety assistance in IVIS to improve driving safety. Relevant research found that under an advanced driver assistance system (ADAS), drivers would stop at intersections less frequently, and the speed would increase, which is not conducive to driving safety [55]. These studies all show that drivers will display behavioral adaptation for consecutive events, which will have a positive or negative impact on driving safety. According to the phenomenon that the drivers appear in the driving process, we propose the influence of the risk factor’s DA effect on the maritime traffic risk, which means that the navigation risk is not only affected by the risk factors of its current state, but also formed by the cumulative effect of the risk factors in the time series.
Based on this, we analyzed the impact of SDA effect on ship-ice collision accidents in Arctic waters through the Bayesian risk assessment model. In related research, the conclusion generally believes that SIC is the main factor affecting navigation risk [35,56]. In the maritime traffic risk assessment results of CM in Figure 5 also verify the rationality of this statement. However, through the further in-depth study of this research, we found that the impact of SIC on maritime traffic risk is not as simple as the presence of sea ice threat cause the high navigation risk, and the absence of sea ice threat lead the low navigation risk. Through the influence of SDA status on the ship-ice collision accident risk in Figure 5, and the influence of SDA status on human error in Figure 6, we can find that the SDA effect of NAI-NAI and HAI-NAI both indicate that the current state of the ship is no sea ice threat, but the risk assessment result of the ship-ice collision accident under the association state NAI-NAI is higher than the association state HAI-NAI. This is mainly due to the fact that in the NAI-NAI state, ship operators have adapted to the navigation environment without sea ice threats, thereby increasing the probability of human error and leading to the increase of navigation risk. The SDA effect NAI-HAI and HAI-HAI both indicate that the current state of the ship is threatened by sea ice, but the risk assessment result of ship-ice collision accident in the association state NAI-HAI is significantly higher than that in the association state HAI-HAI. The main reason is that in the state of NAI-HAI, ship operators have adapted to the navigation environment without sea ice threats, and are insufficiently prepared for sudden sea ice threats, which leads to a high growth in navigation risk.
In this study, we calculated the occurrence probability of risk nodes X1 and M1 in the ship-ice collision accident risk Bayesian network assessment model based on the sea ice concentration data monitored by satellites. Limited by the availability of data related to maritime traffic in Arctic waters, the conditional probability of node M2 is obtained through expert knowledge, and the prior probability of other nodes is obtained through reference to other researches and expert knowledge judgments, which may have a certain impact on the objectivity of the model assessment results. However, through model testing, we found that the constructed ship-ice collision accident assessment model for maritime traffic in Arctic waters is highly sensitive. With the addition of more monitoring data, the constructed model can be well applied to guide ships navigate in Arctic waters under ice conditions.
Through this research, we apply the proposed DA effect of risk factors to maritime traffic risk assessment in Arctic waters. With the risk analysis of ship-ice collision accidents in Arctic waters under the influence of DA effect, we recognize that in a ship-ice collision accident, the threat of SIC will affect the ship, and the DA effect produced by SIC will affect the adaptation of ship operators. Therefore, maritime traffic risks in Arctic waters are complex and volatile. The SDA effect has a positive effect on our further understanding of the causes of ship-ice collisions in Arctic waters. In order to effectively reduce the risk of ships navigate in Arctic waters, the ship management department can focus on training crews to maintain a good mental state in conducting crew training for Arctic navigation, so as to overcome the adaptability that occurs during maritime traffic practice.

5. Conclusions

This paper has argued that maritime traffic risk is caused by the dynamic association (DA) effect of the risk factor’s state in the time series. Bayesian networks can obtain the inference model of risk forming factors through parameter learning and structure learning, and the risk decision-making can be optimized through the new state design of risk factor nodes. Based on the Bayesian network analysis method, the logical relationship between factors can be reflected, and the impact of DA effect can be expressed. The establishment of the Bayesian network model for the risk assessment of ship-ice collision accidents in Arctic waters is under the influence of sea ice status dynamic association (SDA) effect. Through Bayesian network reasoning, different forms of SDA have different threats to the occurrence possibility of human error and serious ice condition. The SDA is more obvious in the form of “No Adverse Impact (NAI)-Have Adverse Impact (HAI)” and “Have Adverse Impact (HAI)-Have Adverse Impact (HAI)”.
Objectively understanding risks and analyzing their causes are an important part of realizing risk prevention. This study has shown that on the basis of analyzing the logical relationship between risk factors of the ship-ice collision accident, and introducing the DA effect into the maritime traffic risk assessment model, we have a deeper understanding of the cause of the ship-ice collision accident risk, which will promote the discovery of the objective regulations of maritime traffic risk changes in Arctic waters. Through the new understanding of maritime traffic risks in Arctic waters, when carrying out relevant crew safety operation training, the crew can be targeted to realize that they will have adaptability during Arctic navigation operations, and then they can actively overcome them psychologically to achieve the improve of maritime traffic safety.
A limitation of this study is that the SDA effect of sea ice concentration (SIC) considered in this study are only two consecutive days in the discrete state (SIC state of the previous day on the current day) and only the impact of SDA on maritime traffic risk was considered. maritime traffic is a continuous process and there will be multiple risk factors that have DA effects, so the DA effect in maritime traffic risk assessment model should also be continuous repeated in multiple times and risk factors. In the next study, it is necessary to consider the impact of the cumulative association effect produced by the continuous changes of multiple risk factors in the time series on the maritime traffic risk.

Author Contributions

Conceptualization, G.G. and S.H.; methodology, S.H. and Z.L.; software, Z.L.; original draft preparation, Z.L.; validation, S.H., Z.L. and C.Y.; data curation, G.G. and C.Y. and Z.L.; review and editing, Y.X., S.F., G.G., and S.H.; funding acquisition, S.F. All authors have read and agreed to the published version of the manuscript.

Funding

This research was funded by National Science Foundation of China (NSFC), grant number 51709168.

Institutional Review Board Statement

“Not applicable” for studies not involving humans or animals.

Informed Consent Statement

“Not applicable” for studies not involving humans.

Data Availability Statement

The data presented in this study are available on request from the corresponding author.

Acknowledgments

The authors express thanks to the NSIDC for their sea ice data. We would also like to acknowledge the insight contributions from anonymous reviewers whose thoughtful comments have helped to improve an earlier version of this paper.

Conflicts of Interest

The authors declare no conflict of interest.

References

  1. Burgherr, P. In-depth analysis of accidental oil spills from tankers in the context of global spill trends from all sources. J. Hazard. Mater. 2007, 140, 245–256. [Google Scholar] [CrossRef] [PubMed]
  2. Hansen, H.L.; Jepsen, J.R.; Hermansen, K. Factors influencing survival in case of shipwreck and other maritime disasters in the Danish merchant fleet since 1970. Saf. Sci. 2012, 50, 1589–1593. [Google Scholar] [CrossRef]
  3. Annual Overview of Marine Casualties and Incidents 2019. Available online: http://www.emsa.europa.eu/ (accessed on 11 July 2019).
  4. Chen, Y.M.; Huang, W.R.; Xu, S.D. Frequency Analysis of Extreme Water Levels Affected by Sea-Level Rise in East and Southeast Coasts of China. J. Coast. Res. 2014, 68, 105–112. [Google Scholar] [CrossRef]
  5. Eyring, V.; Isaksen, I.S.A.; Berntsen, T. Transport impacts on atmosphere and climate: Shipping. Atmos. Environ. 2010, 44, 4735–4771. [Google Scholar] [CrossRef]
  6. Borja, N.A. Growth in the docks: Ports, metabolic flows and socio-environmental impacts. Sustain. Sci. 2020, 15, 11–30. [Google Scholar]
  7. Chen, X.Q.; Wang, S.Z.; Shi, C.J.; Wu, H.; Zhao, J.; Fu, J. Robust Ship Tracking via Multi-view Learning and Sparse Representation. J. Navig. 2019, 72, 176–192. [Google Scholar] [CrossRef]
  8. Chen, X.Q.; XU, X.Q.; Yang, Y.S.; Wu, H.; Tang, J.; Zhao, J. Augmented Ship Tracking Under Occlusion Conditions from Maritime Surveillance Videos. IEEE Access 2020, 8, 42884–42897. [Google Scholar] [CrossRef]
  9. Smith, L.C.; Stephenson, S.R. New Trans-Arctic shipping routes navigable by midcentury. Proc. Natl. Acad. Sci. USA 2013, 110, 1191–1195. [Google Scholar] [CrossRef] [Green Version]
  10. De Silva, L.W.A.; Yamaguchi, H.; Ono, J. Ice-ocean coupled computations for sea-ice prediction to support ice navigation in Arctic sea routes. Polar Res. 2015, 34, 25008. [Google Scholar] [CrossRef] [Green Version]
  11. Eddy, B.; Francois, J.F.; Hugo, R.R. Melting Ice Caps and the Economic Impact of Opening the Northern Sea Route. Econ. J. 2018, 1307, 1–45. [Google Scholar]
  12. Silber, G.K.; Adams, J.D. Vessel Operations in the Arctic, 2015–2017. Front. Mar. Sci. 2019, 6, 573. [Google Scholar] [CrossRef]
  13. Wei, T.; Yan, Q.; Qi, W.; Ding, M.; Wang, C. Projections of Arctic sea ice conditions and shipping routes in the twenty-first century using CMIP6 forcing scenarios. Environ. Res. Lett. 2020, 15, 10. [Google Scholar] [CrossRef]
  14. Melia, N.; Haines, K.; Hawkins, E. Sea ice decline and 21st century trans-Arctic shipping routes. Geophys. Res. Lett. 2016, 43, 9720–9728. [Google Scholar] [CrossRef]
  15. Zhang, Z.; Huisingh, D.; Song, M. Exploitation of trans-Arctic maritime transportation. J. Clean. Prod. 2019, 212, 960–973. [Google Scholar] [CrossRef]
  16. Marchenko, N.; Andreassen, N.; Borch, O.J.; Kuznetsova, S.; Jakobsen, U. Arctic Shipping and Risks: Emergency Categories and Response Capacities. TransNav Int. J. Mar. Navig. Saf. Sea Transp. 2018, 12, 107–114. [Google Scholar] [CrossRef] [Green Version]
  17. Kum, S.; Sahin, B. A root cause analysis for Arctic Marine accidents from 1993 to 2011. Saf. Sci. 2015, 74, 206–220. [Google Scholar] [CrossRef]
  18. Huang, L.; Tuhkuri, J.; Igrec, B.; Li, M.; Thomas, G. Ship resistance when operating in floating ice floes: A combined CFD&DEM approach. Mar. Struct. 2020, 74, 102817. [Google Scholar]
  19. Li, F.; Kõrgesaar, M.; Kujala, P.; Goerlandt, F. Finite element based meta-modeling of ship-ice interaction at shoulder and midship areas for ship performance simulation. Mar. Struct. 2020, 71, 102736. [Google Scholar] [CrossRef]
  20. Chai, W.; Leira, B.J.; Naess, A.; Høyland, K.; Ehlers, S. Development of environmental contours for first-year ice ridge statistics. Struct. Saf. 2020, 87, 101996. [Google Scholar] [CrossRef]
  21. Chai, W.; Leira, B.J.; Høyland, K.V.; Sinsabvarodom, C.; Yu, Z. Statistics of thickness and strength of first-year ice along the Northern Sea Route. J. Mar. Sci. Technol. 2020. [Google Scholar] [CrossRef]
  22. Valdez Banda, O.A.; Goerlandt, F.; Montewka, J.; Kujala, P. A risk analysis of winter navigation in Finnish sea areas. Accid. Anal. Prev. 2015, 79, 100–116. [Google Scholar] [CrossRef] [PubMed]
  23. Montewka, J.; Goerlandt, F.; Kujala, P.; Lensu, M. Towards probabilistic models for the prediction of a ship performance in dynamic ice. Cold Reg. Sci. Technol. 2015, 112, 14–28. [Google Scholar] [CrossRef]
  24. Afenyo, M.; Khan, F.; Veitch, B.; Yang, M. Arctic shipping accident scenario analysis using Bayesian Network approach. Ocean Eng. 2017, 133, 224–230. [Google Scholar] [CrossRef]
  25. Zhang, M.; Zhang, D.; Fu, S.; Yan, X.; Goncharov, V. Safety distance modeling for ship escort operations in Arctic ice-covered waters. Ocean Eng. 2017, 146, 202–216. [Google Scholar] [CrossRef]
  26. Fu, S.; Zhang, D.; Montewka, J.; Zio, E.; Yan, X. A quantitative approach for risk assessment of a ship stuck in ice in Arctic waters. Saf. Sci. 2018, 107, 145–154. [Google Scholar] [CrossRef]
  27. Goerlandt, F.; Montewka, J.; Zhang, W.; Kujala, P. An analysis of ship escort and convoy operations in ice conditions. Saf. Sci. 2017, 95, 198–209. [Google Scholar] [CrossRef]
  28. Eguíluz, V.M.; Fernández-Gracia, J.; Irigoien, X.; Duarte, C.M. A quantitative assessment of arctic shipping in 2010–2014. Sci. Rep. 2016, 6, 30682. [Google Scholar]
  29. Fedi, L.; Faury, O.; Etienne, L. Mapping and analysis of maritime accidents in the Russian Arctic through the lens of the Polar Code and POLARIS system. Mar. Policy 2020, 118, 103984. [Google Scholar] [CrossRef]
  30. Sarhadi, A.; Burn, D.H.; Concepción, A.M.; Wiper, M.P. Time-varying nonstationary multivariate risk analysis using a dynamic bayesian copula. Water Resour. Res. 2016, 52, 2327–2349. [Google Scholar] [CrossRef]
  31. Aziz, A.; Ahmed, S.; Khan, F.; Stack, C.; Lind, A. Operational risk assessment model for marine vessels. Reliab. Eng. Syst. Saf. 2019, 185, 348–361. [Google Scholar] [CrossRef]
  32. Ung, S.T. Evaluation of human error contribution to oil tanker collision using fault tree analysis and modified fuzzy Bayesian Network based CREAM. Ocean Eng. 2019, 179, 159–172. [Google Scholar] [CrossRef]
  33. Chai, T.; Weng, J.X.; Xiong, D.Q. Development of a quantitative risk assessment model for ship collisions in fairways. Saf. Sci. 2017, 91, 71–83. [Google Scholar] [CrossRef]
  34. Endrina, N.; Rasero, J.C.; Konovessis, D. Risk analysis for RoPax vessels: A case of study for the Strait of Gibraltar. Ocean Eng. 2018, 151, 141–151. [Google Scholar] [CrossRef]
  35. Sahin, B. Risk Assessment of Arctic Navigation by Using Improved Fuzzy-AHP. Int. J. Marit. Eng. 2015, 157, 241–250. [Google Scholar]
  36. Karahalios, H. A Risk Assessment of Ships Groundings in Rivers: The Case of Parana River. J. Navig. 2019, 73, 833–845. [Google Scholar] [CrossRef]
  37. Zhang, J.; Teixeira, N.P.; Guedes, S.C.; Yan, X.P. Quantitative assessment of collision risk influence factors in the Tianjin port. Saf. Sci. 2018, 110, 363–371. [Google Scholar] [CrossRef]
  38. Mazaheri, A.; Montewka, J.; Kujala, P. Towards an evidence-based probabilistic risk model for ship-grounding accidents. Saf. Sci. 2016, 86, 195–210. [Google Scholar] [CrossRef]
  39. Fu, S.; Zhang, D.; Montewka, J.; Yan, X.P.; Zio, E. Towards a probabilistic model for predicting ship besetting in ice in Arctic waters. Reliab. Eng. Syst. Saf. 2016, 155, 124–136. [Google Scholar] [CrossRef] [Green Version]
  40. Baksh, A.A.; Abbassi, R.; Garaniya, V.; Khan, F. Marine transportation risk assessment using Bayesian Network: Application to Arctic waters. Ocean Eng. 2018, 159, 422–436. [Google Scholar] [CrossRef]
  41. Khan, B.; Khan, F.; Veitch, B.; Yang, M. An operational risk analysis tool to analyze marine transportation in arctic waters. Reliab. Eng. Syst. Saf. 2018, 169, 485–502. [Google Scholar] [CrossRef]
  42. Khan, B.; Khan, F.; Veitch, B. A Dynamic Bayesian Network model for ship-ice collision risk in the Arctic waters. Saf. Sci. 2020, 130, 104858. [Google Scholar] [CrossRef]
  43. Aven, T. The risk concept—historical and recent development trends. Reliab. Eng. Syst. Saf. 2012, 99, 33–44. [Google Scholar] [CrossRef]
  44. Hu, S.P.; Li, Z.; Xi, Y.T.; Gu, X.Y.; Zhang, X.X. Path Analysis of Causal Factors Influencing Marine Traffic Accident via Structural Equation Numerical Modeling. J. Mar. Sci. Eng. 2019, 7, 96. [Google Scholar] [CrossRef] [Green Version]
  45. Kujala, P.; Hänninen, M.; Arola, T.; Ylitalo, J. Analysis of the marine traffic safety in the Gulf of Finland. Reliab. Eng. Syst. Saf. 2009, 94, 1349–1357. [Google Scholar] [CrossRef]
  46. Eliopoulou, E.; Papanikolaou, A.; Voulgarellis, M. Statistical analysis of ship accidents and review of safety level. Saf. Sci. 2016, 85, 282–292. [Google Scholar] [CrossRef]
  47. Sotiralis, P.; Ventikos, N.P.; Hamann, R.; Golyshev, P.; Teixeira, A.P. Incorporation of human factors into ship collision risk models focusing on human centred design aspects. Reliab. Eng. Syst. Saf. 2016, 156, 210–227. [Google Scholar] [CrossRef]
  48. Kontovas, C.A.; Psaraftis, H.N. Formal safety assessment: A critical review. Mar. Technol. 2009, 46, 45–59. [Google Scholar]
  49. International Code for Ships Operating in Polar Waters. Available online: http://www.imo.org/ (accessed on 2 February 2016).
  50. Wang, Z.J.; Silberman, J.A.; Corbett, J.J. Container vessels diversion pattern to trans-Arctic shipping routes and GHG emission abatement potential. Marit. Policy Manag. 2020. [Google Scholar] [CrossRef]
  51. Stevenson, T.C.; Davies, J.; Huntington, H.P.; Sheard, W. An examination of trans-Arctic vessel routing in the Central Arctic Ocean. Mar. Policy 2019, 100, 83–89. [Google Scholar] [CrossRef]
  52. Zhang, X.; Zhang, Q.; Yang, J.; Cong, Z.; Chen, H. Safety risk analysis of unmanned ships in inland rivers based on a fuzzy Bayesian network. J. Adv. Transp. 2019. [Google Scholar] [CrossRef]
  53. Wang, T.; Wu, Q.; Diaconeasa, M.A.; Yan, X.; Mosleh, A. On the use of the hybrid causal logic methodology in ship collision risk assessment. J. Mar. Sci. Eng. 2020, 8, 485. [Google Scholar] [CrossRef]
  54. Peng, Y.; Boyle, L.N. Driver’s adaptive glance behavior to in-vehicle information systems. Accid. Anal. Prev. 2015, 85, 93–101. [Google Scholar] [CrossRef] [PubMed]
  55. Dotzauer, M.; Waard, D.D.; Caljouw, S.R.; Gloria, P.; Brouwer, W.H. Behavioral adaptation of young and older drivers to an intersection crossing advisory system. Accid. Anal. Prev. 2015, 74, 24–32. [Google Scholar] [CrossRef] [PubMed]
  56. Ding, J.F.; Shyu, W.H. Key Factors Influencing the Building of Arctic Shipping Routes. J. Navig. 2016, 69, 1261–1277. [Google Scholar]
Figure 1. Bayesian network structure of maritime traffic risk in Arctic waters.
Sustainability 13 00147 g001
Figure 2. The selected route and ship’s position change information.
Sustainability 13 00147 g002
Figure 3. The daily change of ship’s position and dynamic ice condition.
Sustainability 13 00147 g003
Figure 4. Risk with or without SDA.
Sustainability 13 00147 g004
Figure 5. Risk assessment results under evidence information of the AM and CM.
Sustainability 13 00147 g005
Figure 6. The change of PoD in M1 and M2 under the variation of SDA. Among them, (ad) means that the SDA states of NAI-NAI, NAI-HAI, HAI-NAI, and HAI-HAI increase by 10% respectively, (eh) means that the SDA states of NAI-NAI, NAI-HAI, HAI-NAI, and HAI-HAI increase by 30% respectively.
Sustainability 13 00147 g006
Table 1. Basic factors nodes in risk reasoning network.
NoSymbolDescription
1X1ice condition
2X2radar failure
3X3environmental obstruction
4X4wind speed effect
5X5wave height effect
6X6process failure
7X7navigation function failure
8X8electronic chart error
9X9the insufficient chart not been updated
10X11the inappropriate route selection
11X12the fuel measurement system failure
12X13engine failure
13X14propeller failure
14M1serious ice condition
15M2human error
16M3Restricted visibility
17M4operation failure
18M5wind and wave effects
19M6navigation failure
20M7navigation system failure
21M8the engine’s fuel supply is contaminated
22M9power failure
23M10engine shutdown
24N1ship-ice collision accident
Table 2. Basic information of sea ice data.
Data SourceContentUsabilityFormatValue RangeData Processing Tool
https://nsidc.org/dataDaily SIC change dataOpen accessbin[0, 1]Python (NumPy, pyproj)
Table 3. Prior probability distribution of ice condition(X1).
State PPD
ABCDE
NAI-NAI000.23200
NAI-HAI0.931000.2990
HAI-NAI00.2320.07900
HAI-HAI0.0690.7680.6890.7011
Table 4. Prior probability distribution of other root nodes.
Nodes
X2X3X4X5X6X7X8X9X10X11X12X13X14
yes0.0360.030.0530.0560.0290.0040.0380.0250.0240.0320.0220.0040.029
no0.9640.970.9470.9440.9710.9960.9620.9750.9760.9680.9880.9960.971
Data sourceOLOLEJEJOLOLOLOLOLEJEJOLEJ
Table 5. Five experts’ scoring opinions on human error under the influence of state NAI-HAI.
Stateexpert1expert2expert3expert4expert5
increase0.690.640.720.850.91
constant0.280.330.280.130.08
decrease0.030.030.040.020.01
Table 6. Conditional probability distribution of serious ice condition (M1).
StateNAI-NAINAI-HAIHAI-NAIHAI-HAI
increase00.99900.348
constant0.9820.0010.0170.652
decrease0.01800.9830
Publisher’s Note: MDPI stays neutral with regard to jurisdictional claims in published maps and institutional affiliations.

