Measuring Accessibility Based on Improved Impedance and Attractive Functions Using Taxi Trajectory Data

Abstract
:1. Introduction
- We propose an improved impedance function consisting of passenger waiting time and piecewise distance decay function. Passenger waiting time represents taxi availability, which is calculated by the queuing theoretic approach. Taxi fare rule, taking an example in China, comprised of minimum fare and fare per kilometer, which influence traditional distance decay function. The piecewise distance decay function is proposed to reflect these effects.
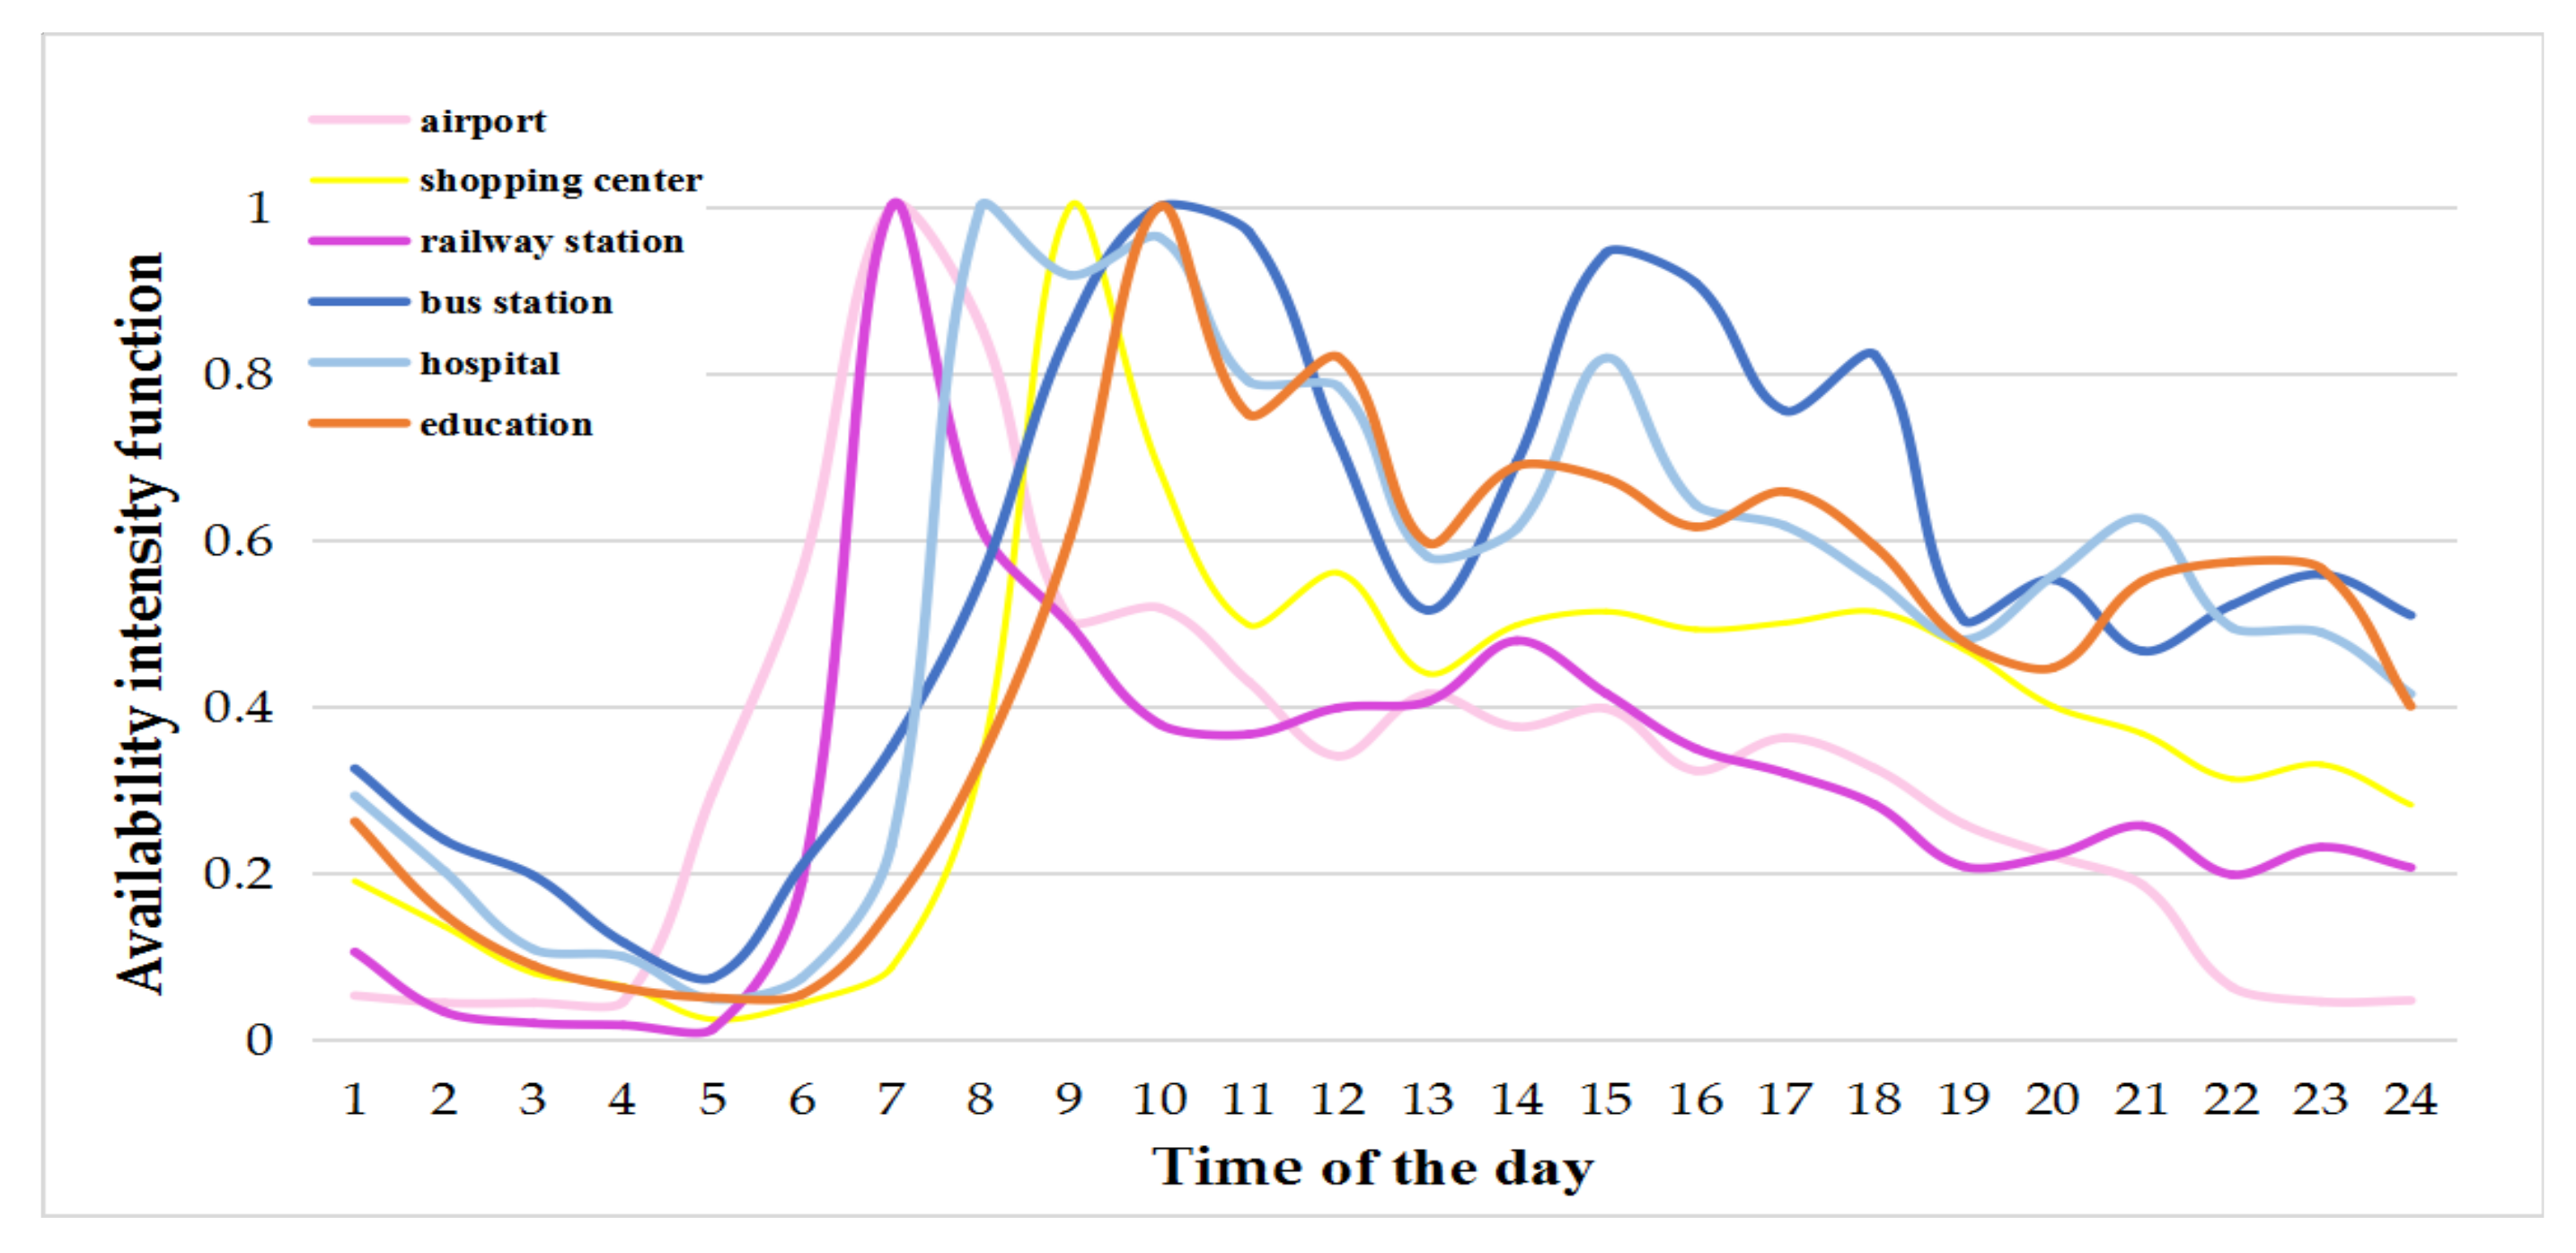
- We construct a new attractive function by considering the indicator named dynamic availability intensity. Since choosing a taxi mode to perform activities at a location is constrained by time period (e.g., urban rail transit would be a better choice during the peak hours), space (e.g., destination’s location), and individual’s preference (e.g., individual’s value of travel time or services quality).
2. Literature Review
3. Methodology
- Restructuring a new impedance function by combining passenger waiting time and travel times influenced by taxi fare rules.
- Considering the influence of variation in destination attractiveness on potential opportunities achieved, forming an attractive function from static and dynamic perspectives.
3.1. Conventional Potential Accessibility Measures
3.2. Dynamic Taxi-Based Potential Accessibility Measure
4. Case Study
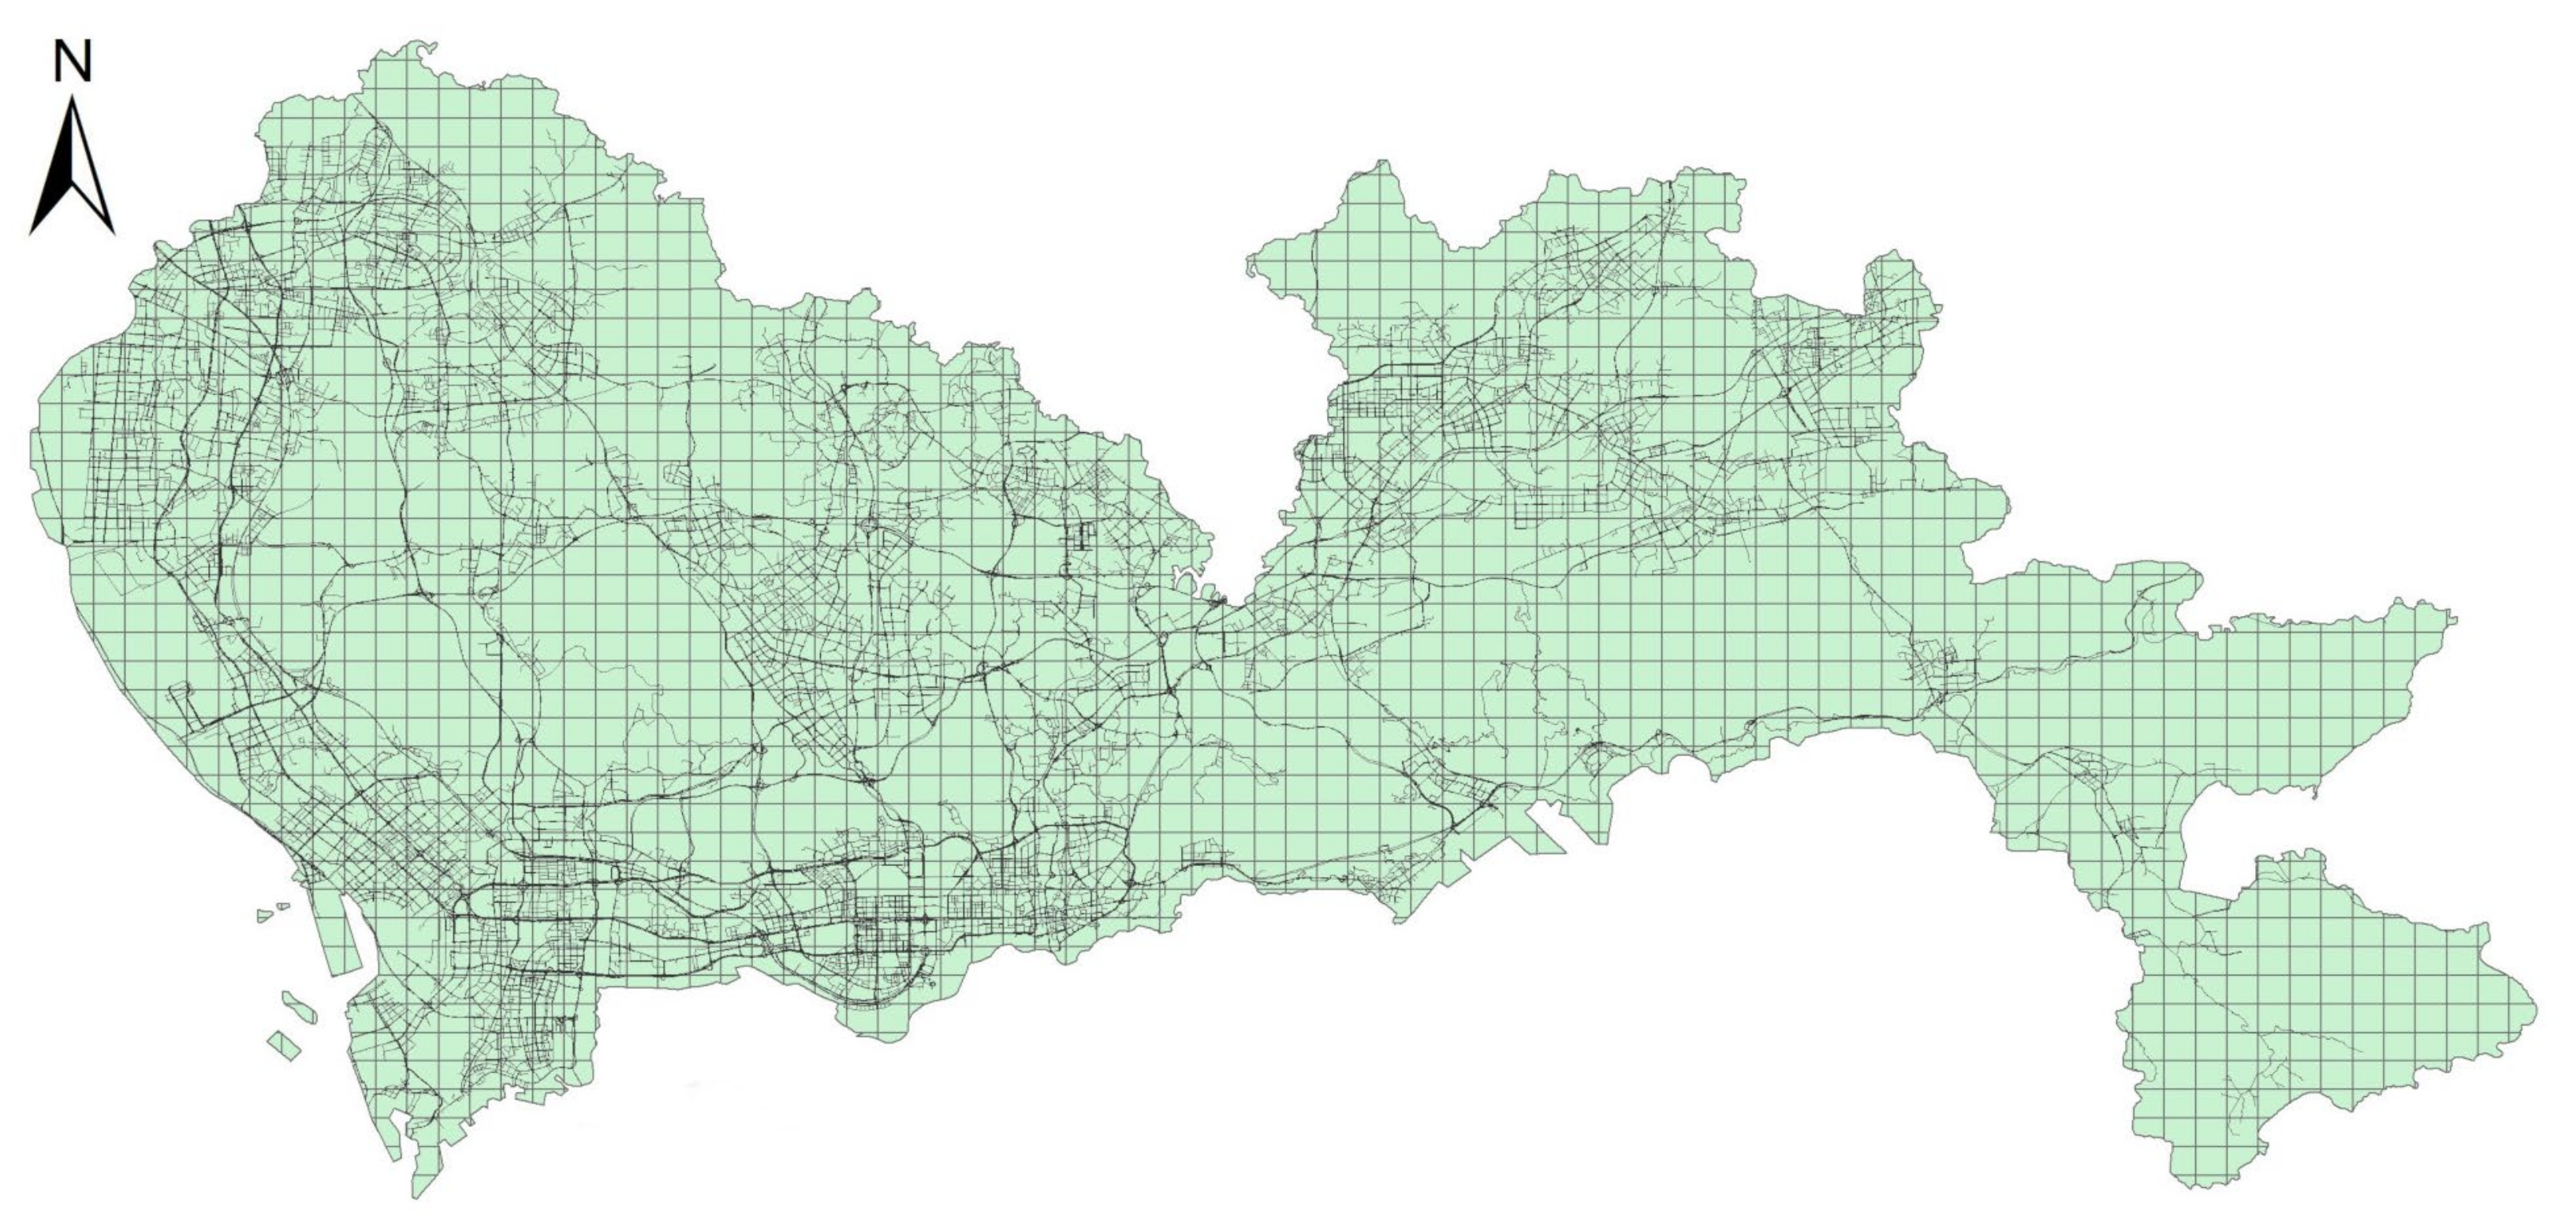
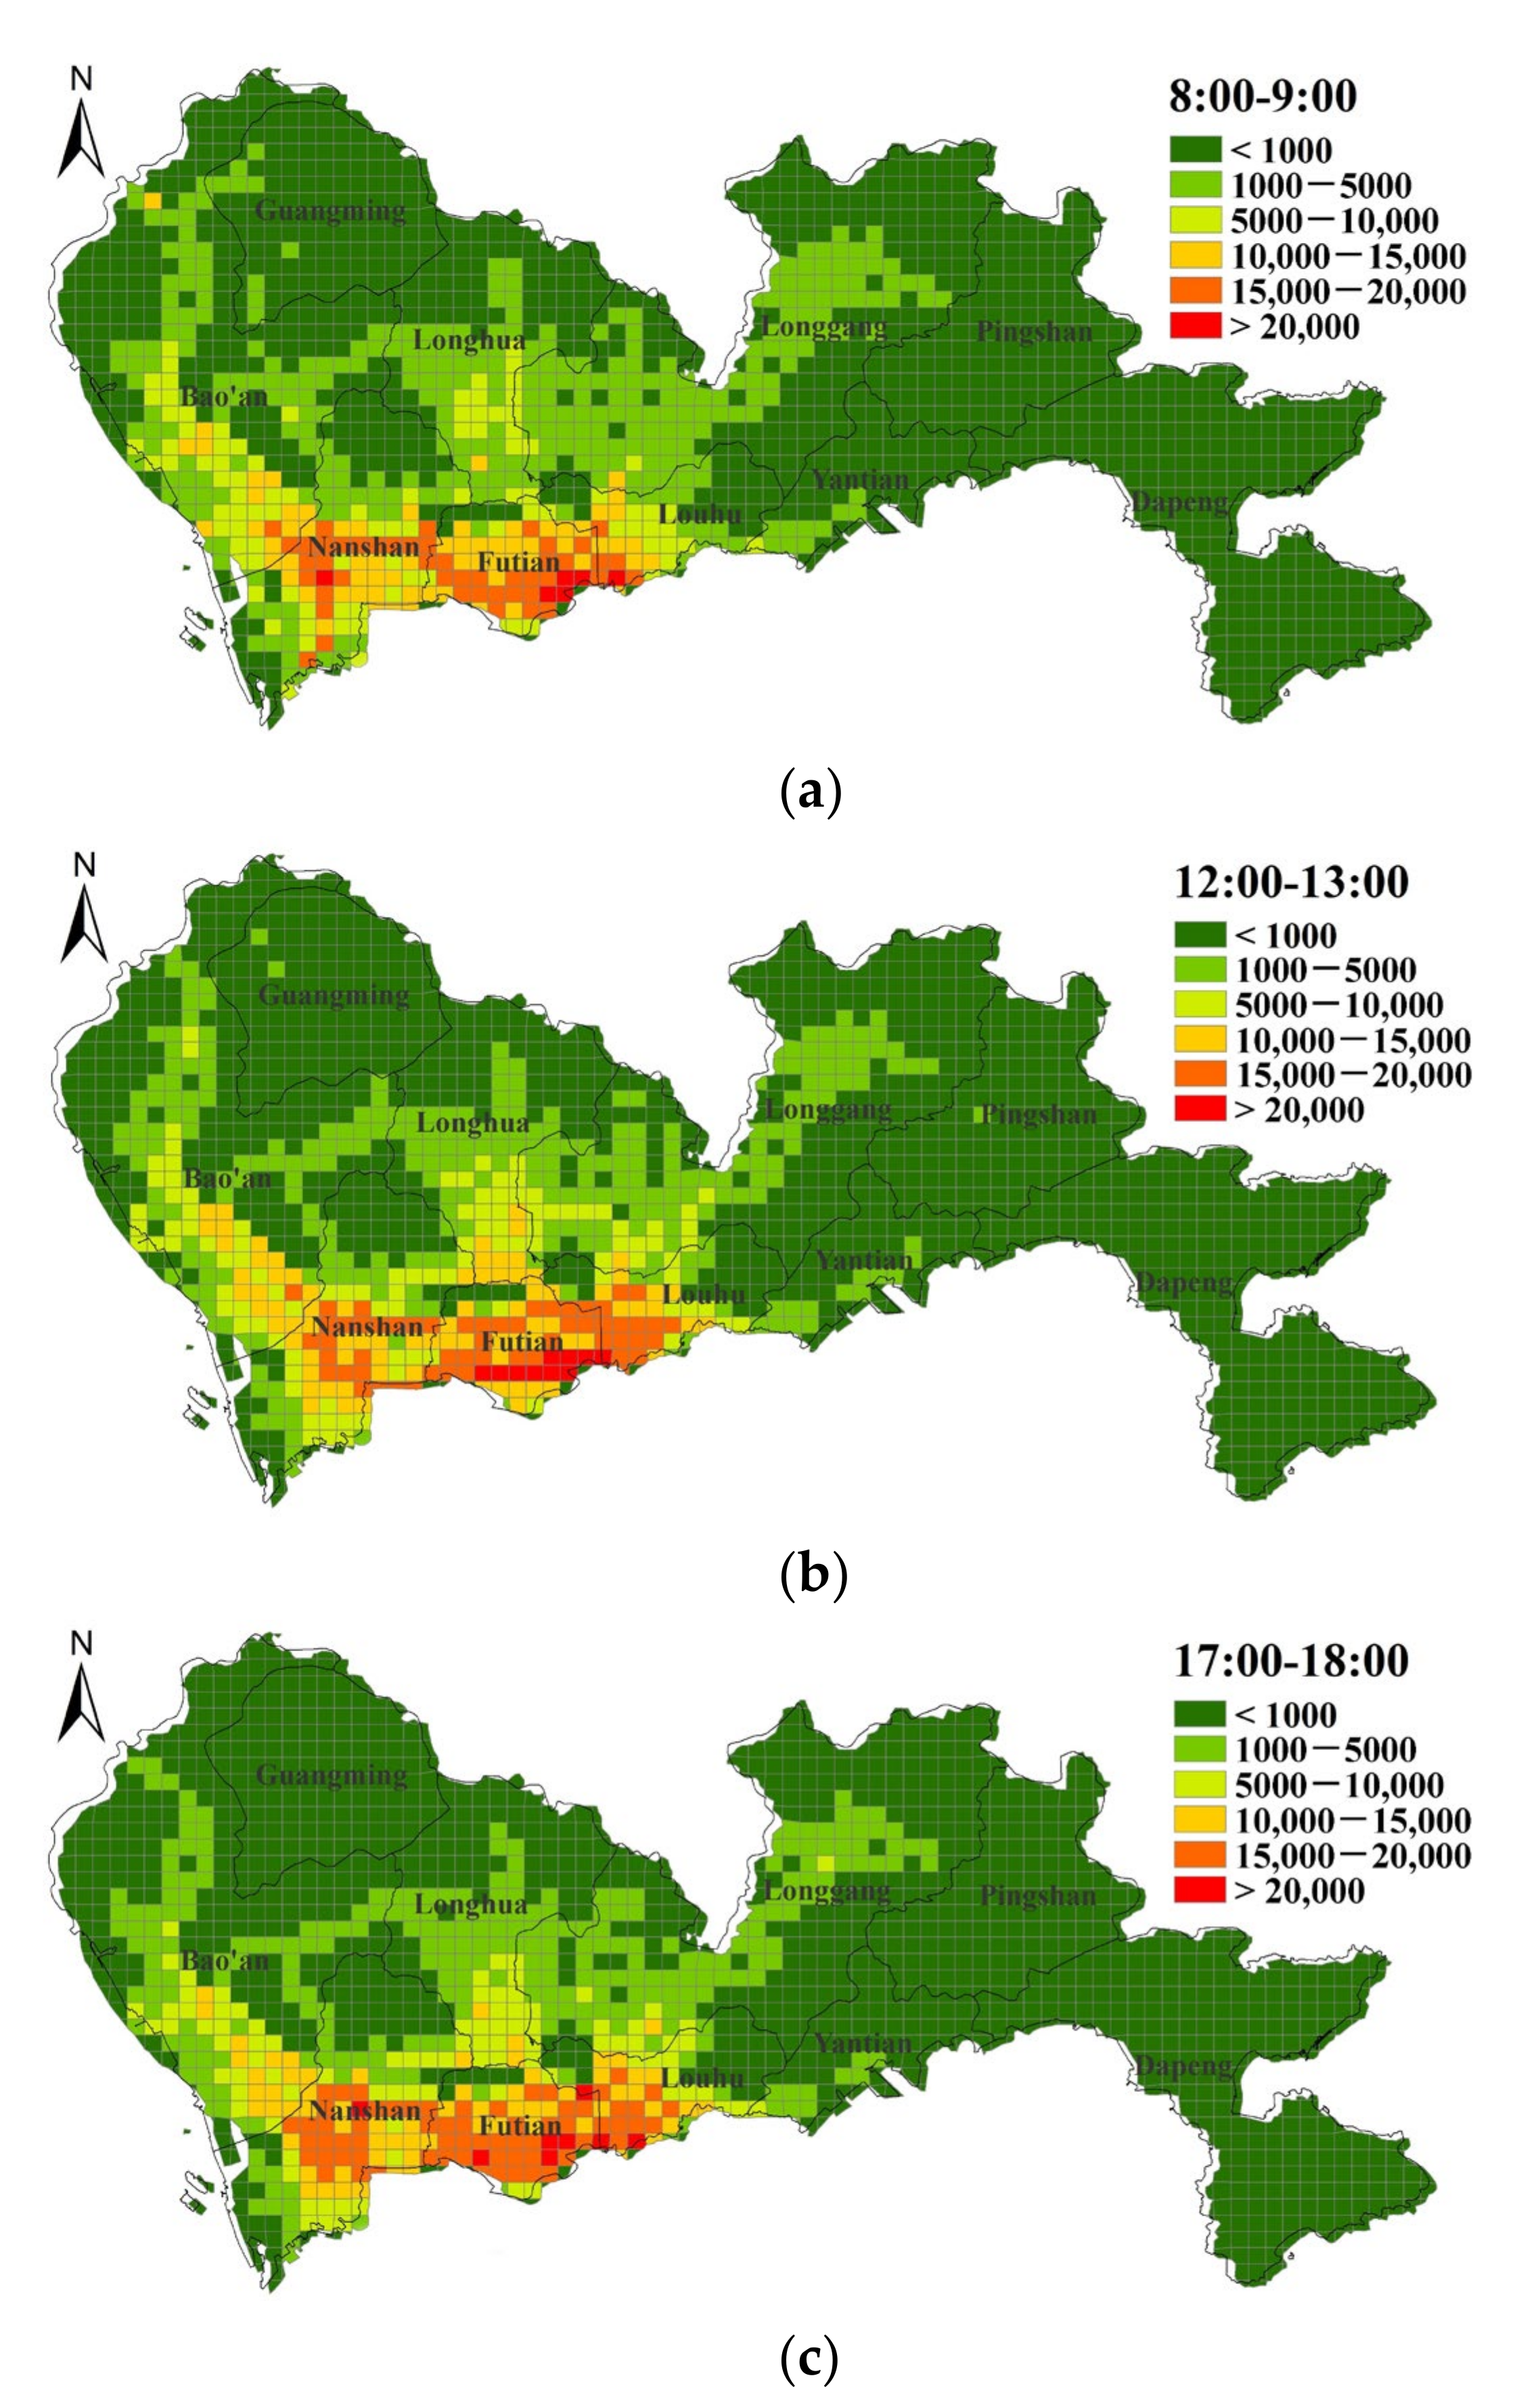
4.1. Study Area
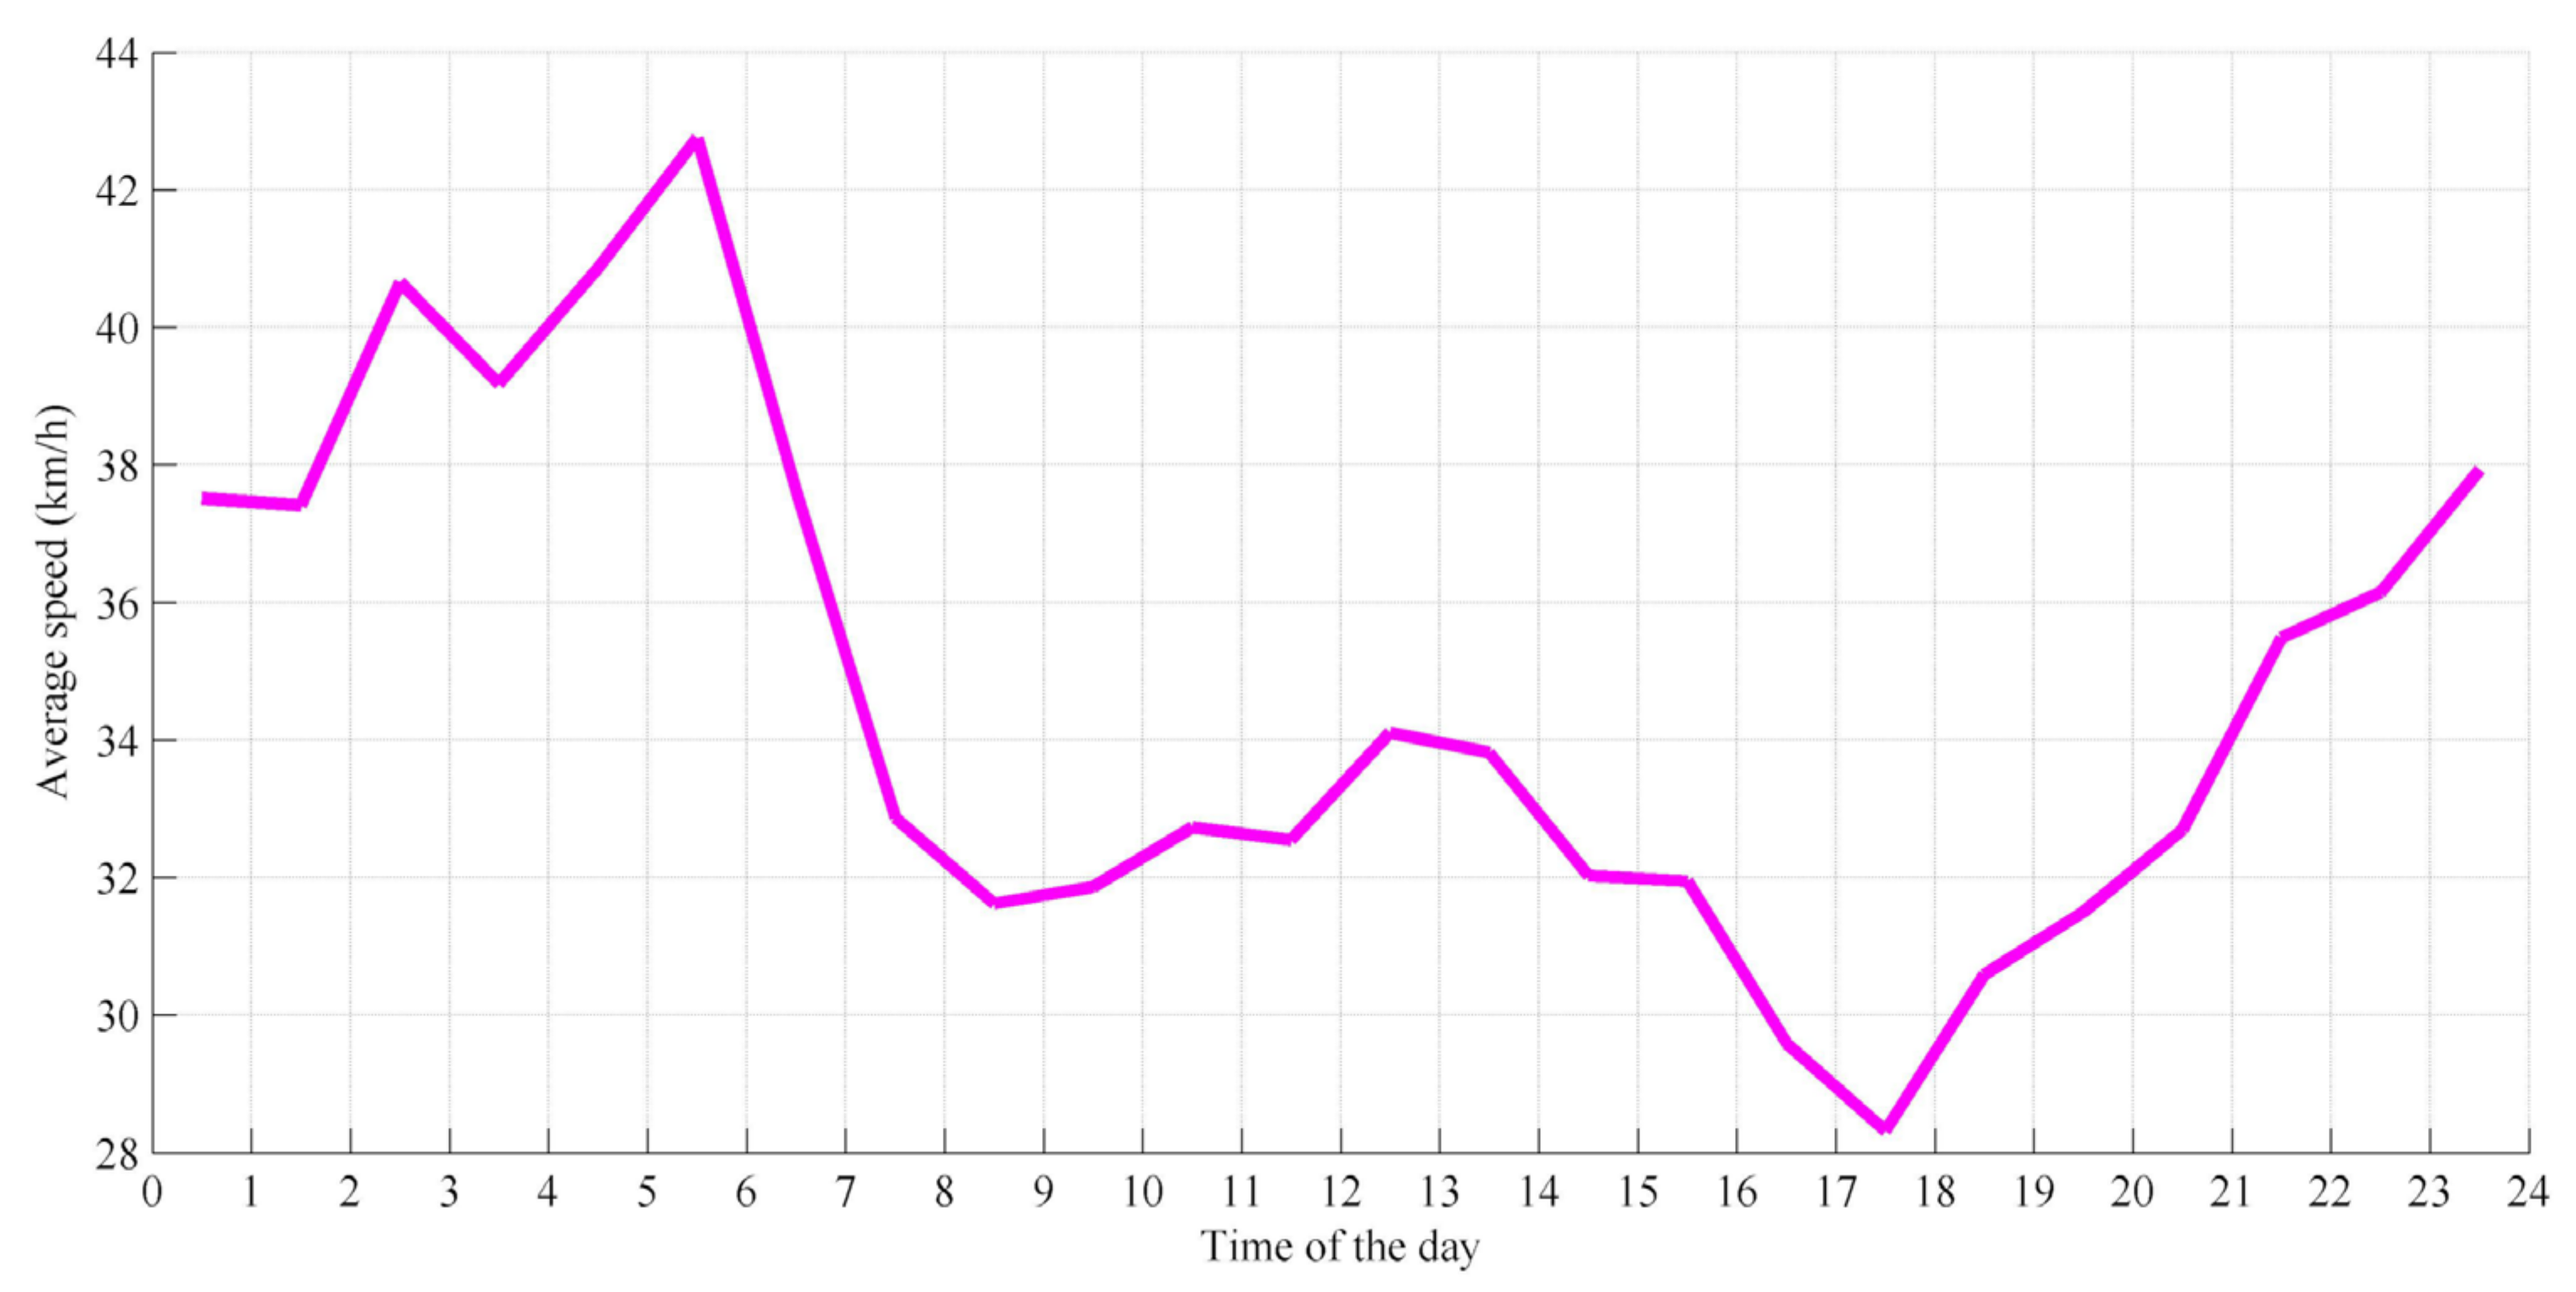
4.2. Data Collection
4.3. Scenarios Setup
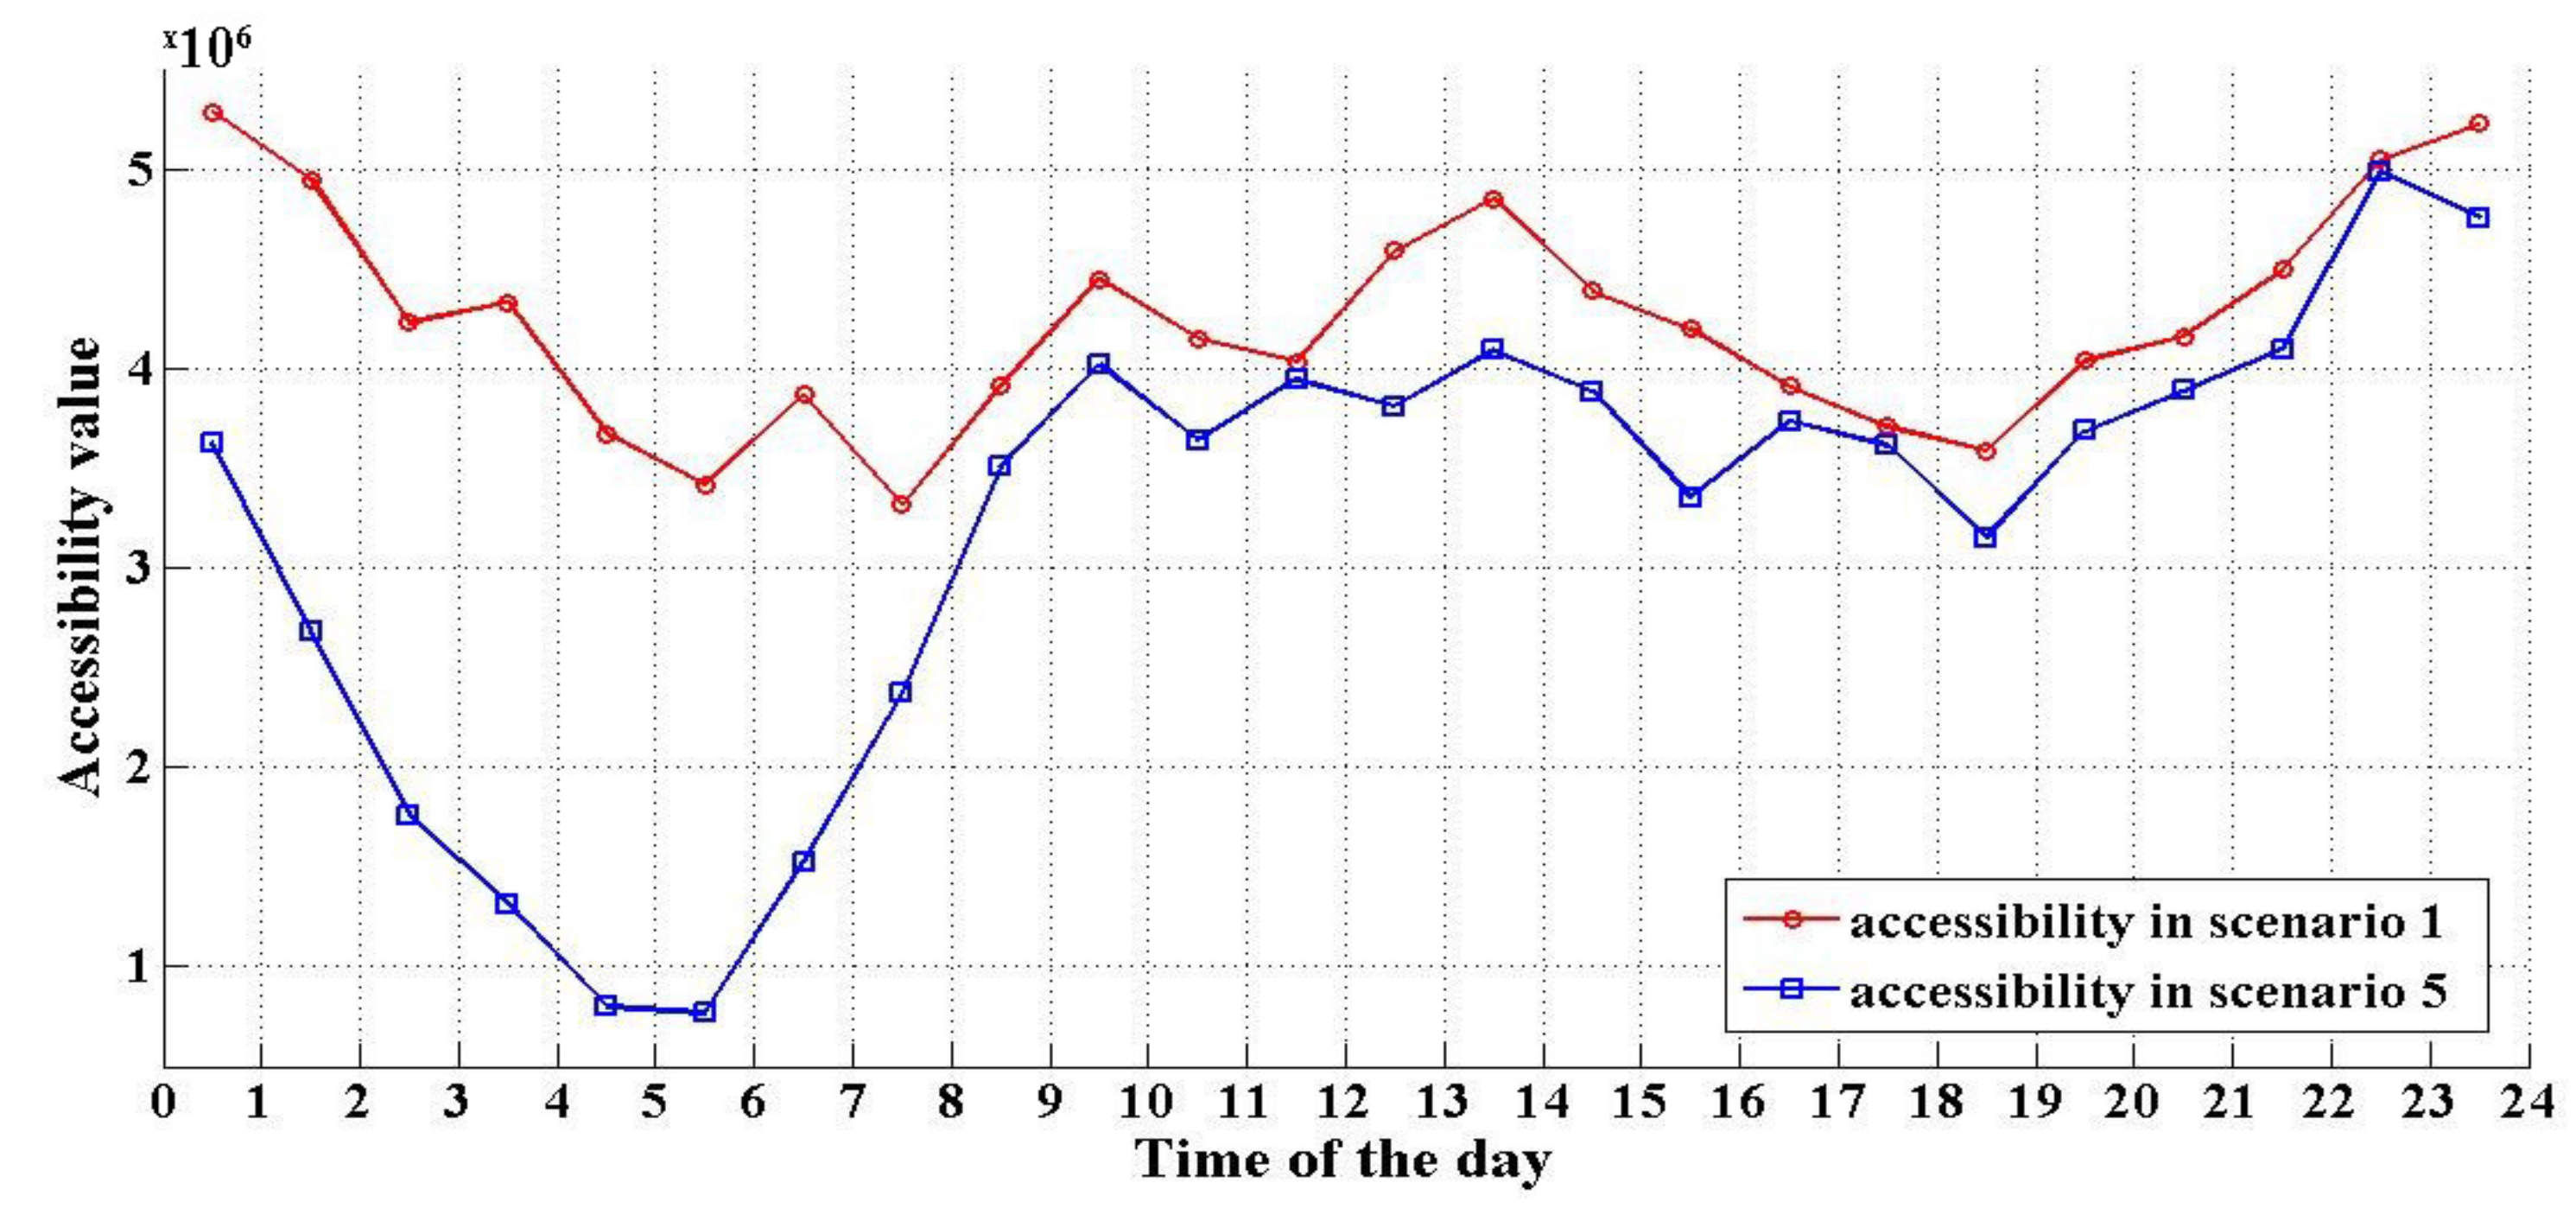
- Scenario 1 is the reference scenario. Accessibility was calculated based on Equation (2) considered with static destination attractiveness (i.e., ) and conventional impedance function (i.e., only considering travel time). We will take the scenario as a reference to compare differences in accessibility with other scenarios with different indicators.
- Scenario 2 is the dynamic attractiveness scenario. Accessibility was calculated considering time-varying attractiveness based on the reference scenario, while taxi characteristics were not considered.
- Scenario 3 is the scenario considering passenger waiting time. This scenario combined passenger waiting time with conventional impedance function based on the reference scenario. The destination attractiveness remained static, and the taxi fare rule was not considered.
- Scenario 4 is the scenario considering taxi fare rules. The new piecewise distance decay function was calculated with travel times influenced by taxi fare rule. Destination attractiveness remained static, and passenger waiting time was not considered.
- Scenario 5 is the taxi-based dynamic accessibility scenario. Accessibility was calculated with dynamic destination attractiveness and improved impedance function.
5. Results and Discussions
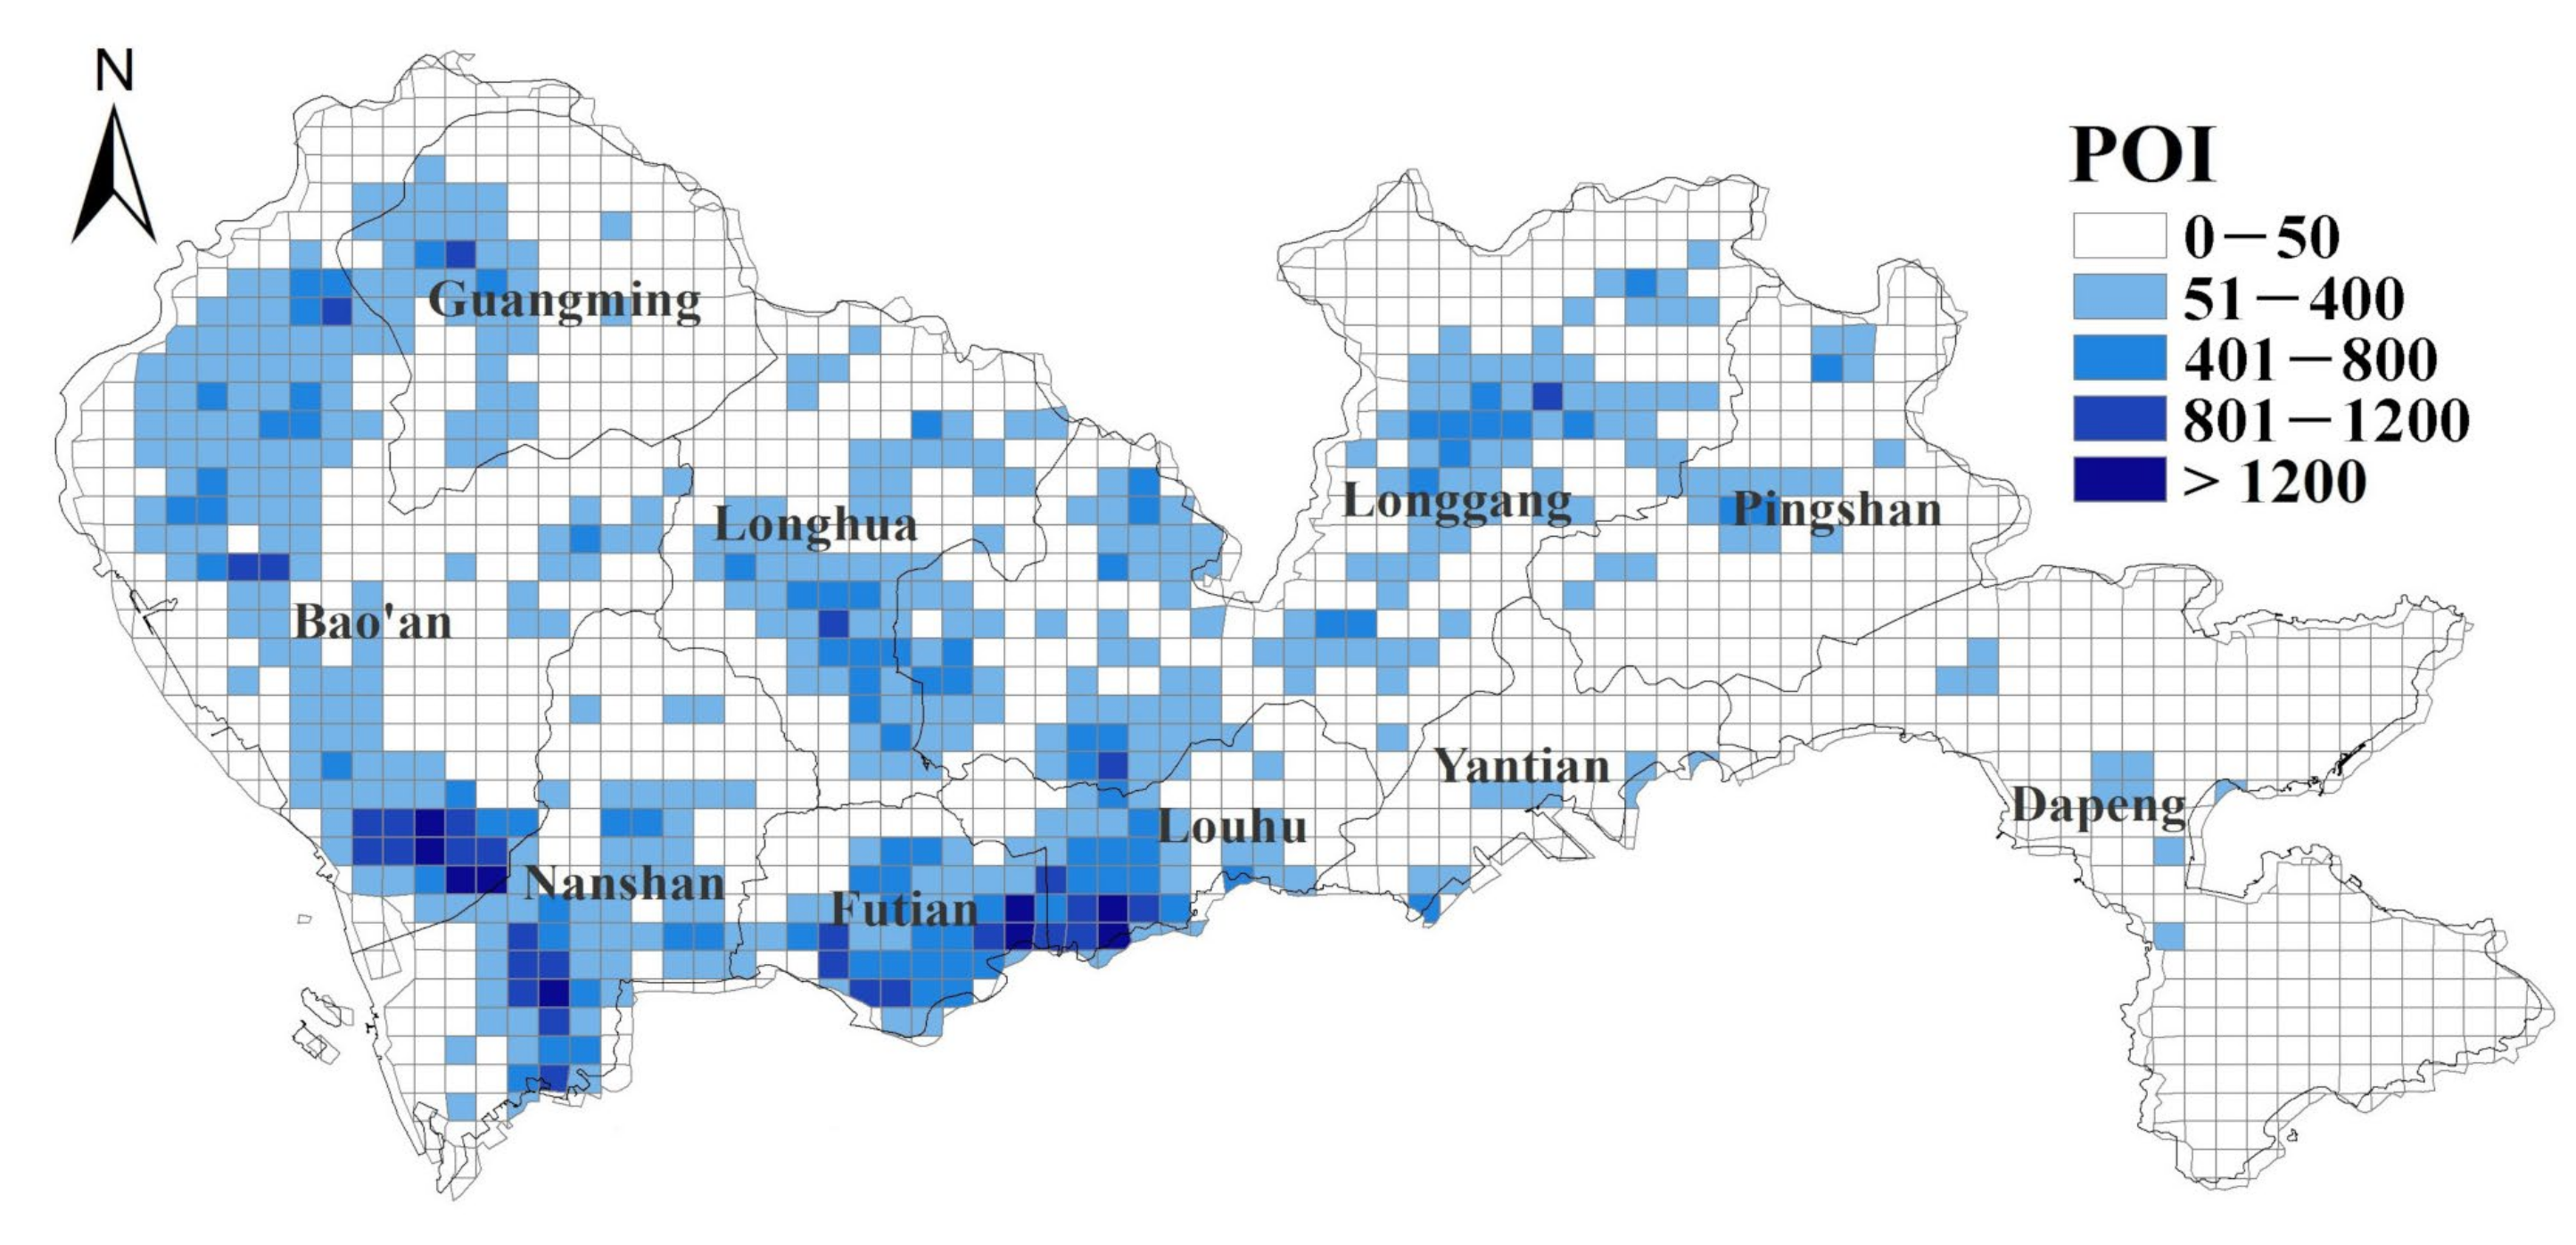
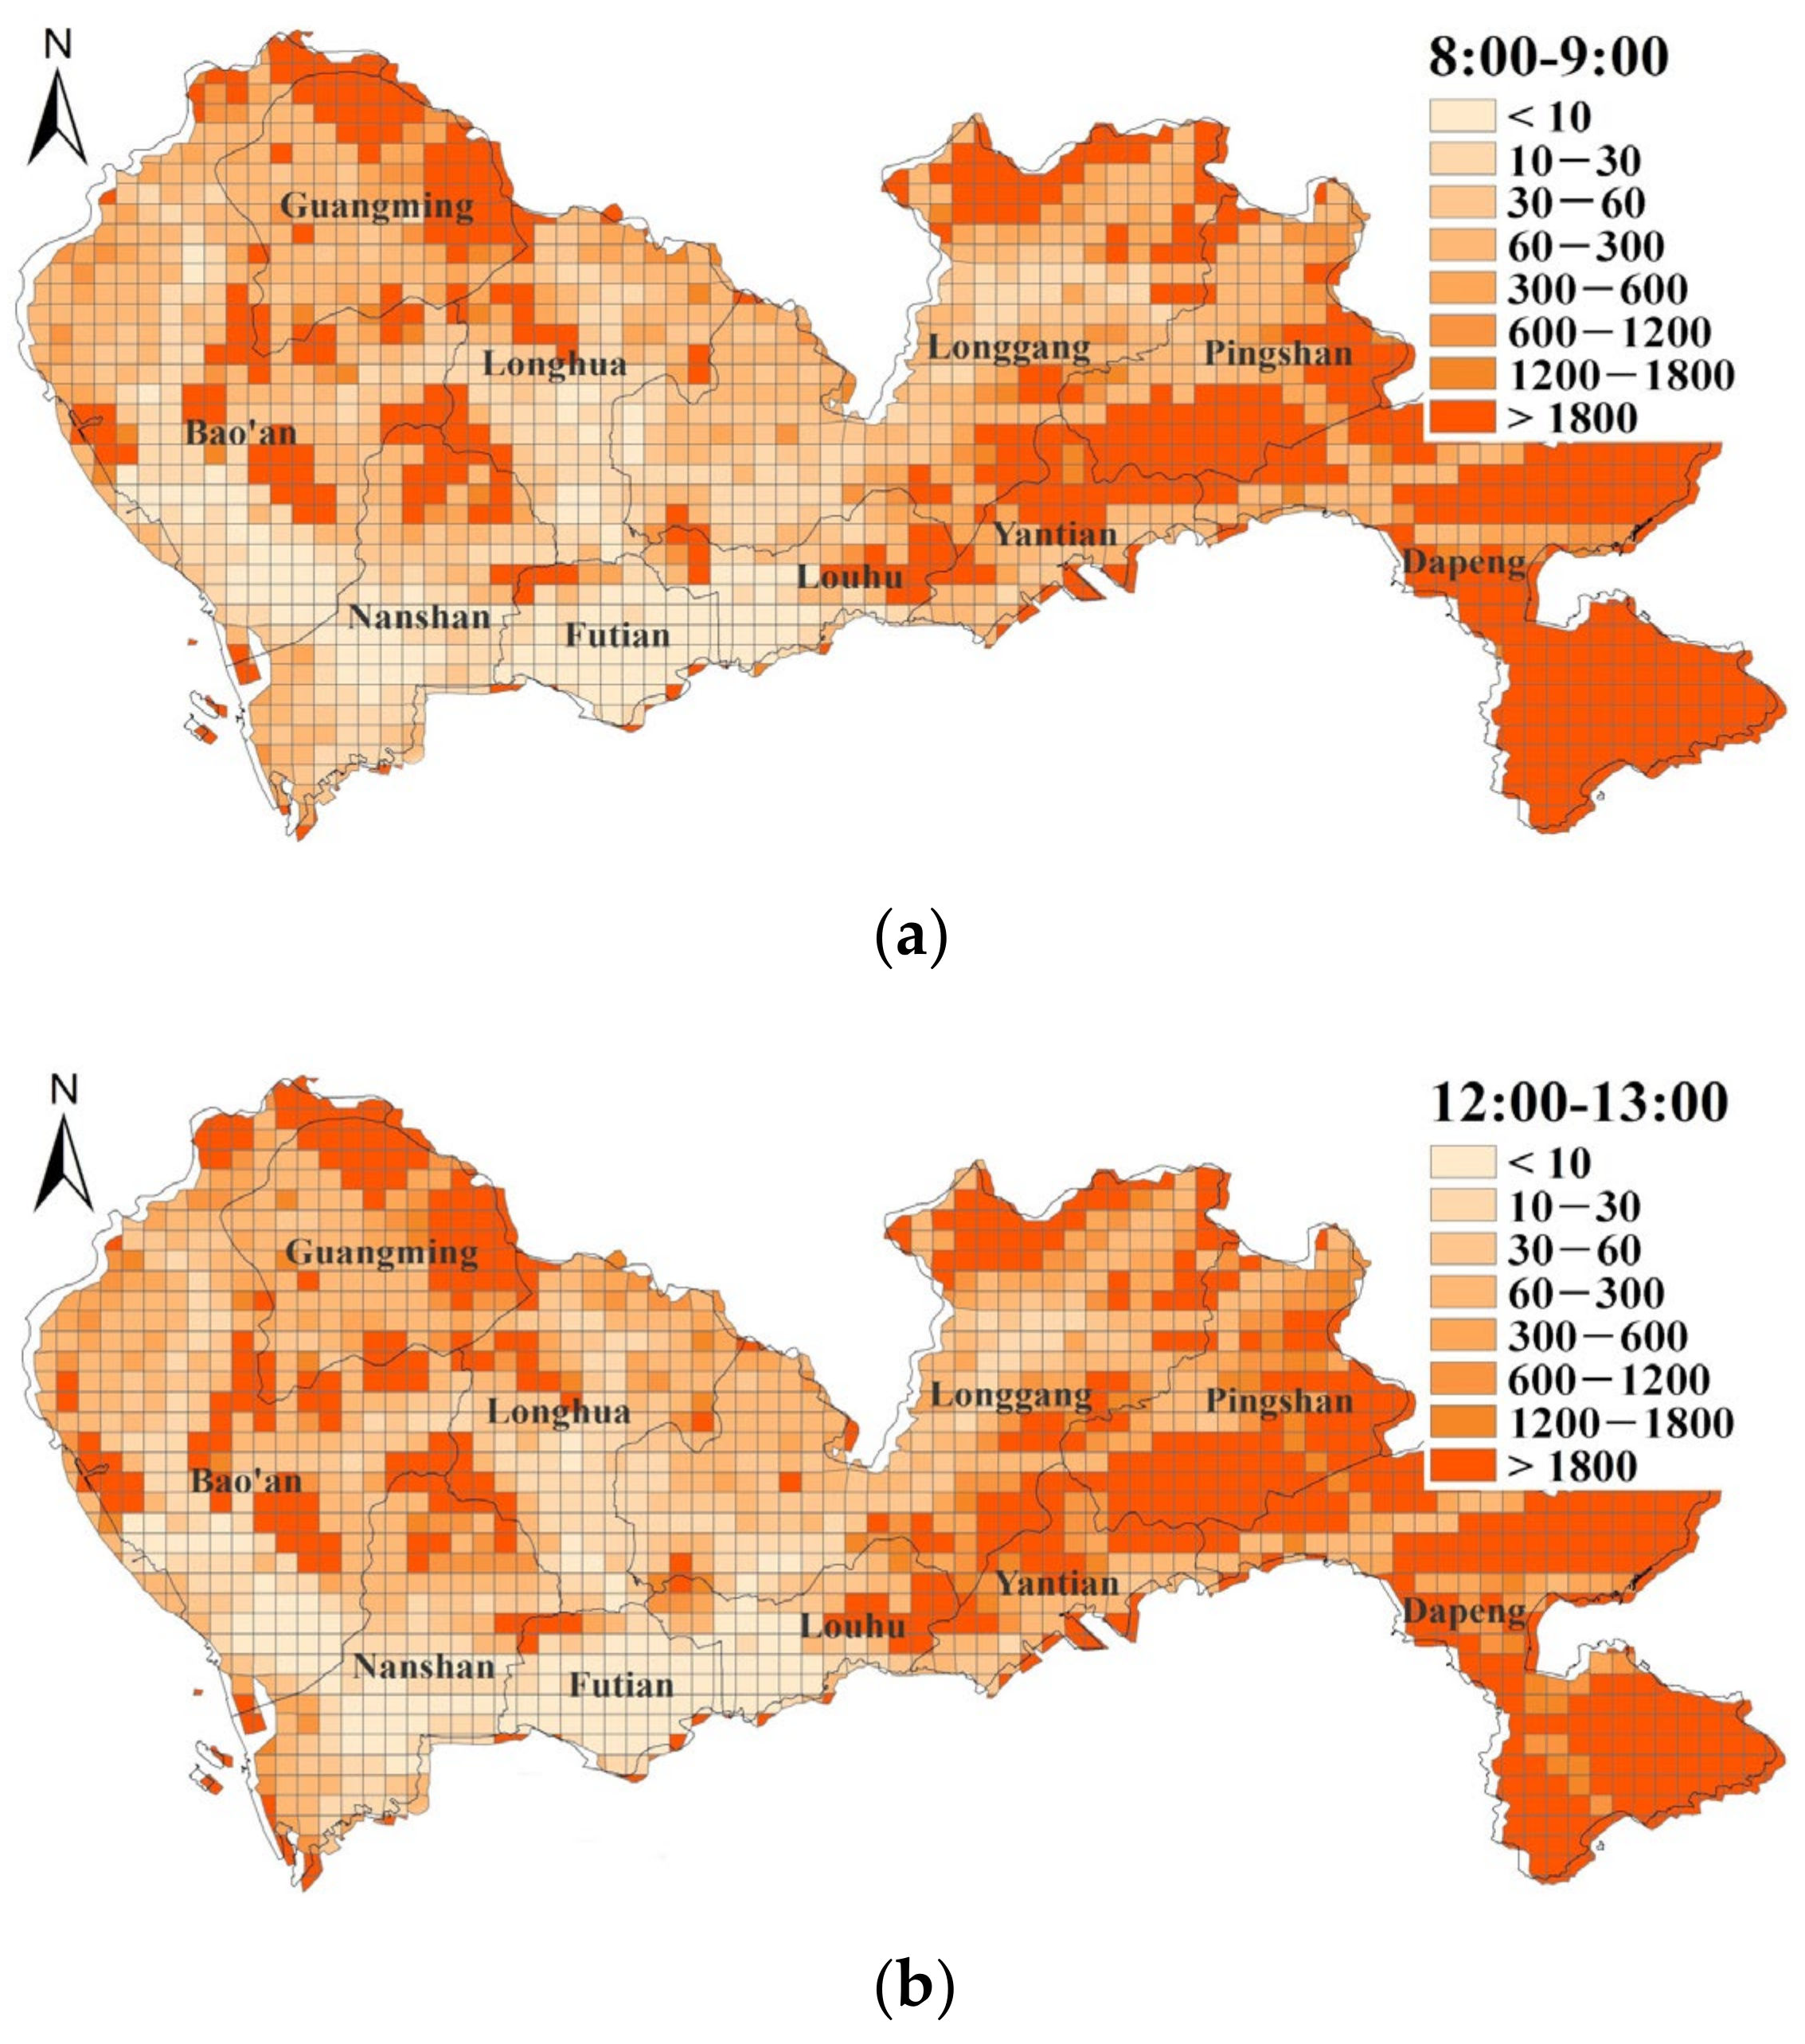
5.1. Descriptive Analysis of the Combined Data Sources
5.2. Comparison between Scenarios
5.3. Discussions
6. Conclusions
Author Contributions
Funding
Data Availability Statement
Conflicts of Interest
Appendix A

| Terms | Description |
|---|---|
| A(i) | The accessibility in unit i |
| Dj | The size of attraction in unit j to individuals in unit i |
| f(.) | The impedance function of conventional location-based measures |
| cij | The trip costs between unit i and unit j |
| β | The cost sensitivity parameter |
| wti | Passenger waiting time |
| μi | The service rate defined as the average number of vacant taxis per unit time in spatial unit i |
| λi | The arrival rate defined as the average number of pick-ups per unit time in spatial unit i |
| k (cij) | Piecewise distance decay function depending on travel time cij |
| THT | The travel time threshold |
| a | The time-sensitivity parameter |
| Dj(t) | The time-dependent attractive function at unit j |
| pj | The number of POIs representing ideally maximum number of opportunities passengers can obtain at unit j |
| gj(t) | The time-dependent availability intensity function representing the intensity of individuals’ access to opportunities at unit j at a certain time t |
| AiT | Taxi-based accessibility in unit i |
References
- Basso, F.; Frez, J.; Martínez, L.; Pezoa, R.; Varas, M. Accessibility to opportunities based on public transport gps-monitored data: The case of Santiago, Chile. Travel Behav. Soc. 2020, 21, 140–153. [Google Scholar] [CrossRef]
- Blumenberg, E.; Shiki, K. How Welfare Recipients Travel on Public Transit, and Their Accessibility to Employment Outside Large Urban Centers. Transp. Q. 2003, 57, 25–37. [Google Scholar]
- Chen, B.; Wang, Y.; Wang, D.; Li, Q.; Lam, W.H.K.; Shaw, S. Understanding the Impacts of Human Mobility on Accessibility Using Massive Mobile Phone Tracking Data. Ann. Am. Assoc. Geogr. 2018, 108, 1115–1133. [Google Scholar] [CrossRef]
- Martin, D.; Jordan, H.; Roderick, P. Taking the bus: Incorporating public transport timetable data into health care accessibility modeling. Environ. Plan. A 2008, 40, 2510–2525. [Google Scholar] [CrossRef]
- Chang, Z.; Chen, J.; Li, W.; Li, X. Public transportation and the spatial inequality of urban park accessibility: New evidence from Hong Kong. Transp. Res. Part D Transp. Environ. 2019, 76, 111–122. [Google Scholar] [CrossRef]
- Papa, E.; Silva, C.; Brömmelstroet, M.T.; Hull, A. Accessibility instruments for planning practice: A review of European experiences. J. Transp. Land Use 2015, 9, 1–20. [Google Scholar] [CrossRef] [Green Version]
- Boisjoly, G.; El-Geneidy, A.M. How to get there? A critical assessment of accessibility objectives and indicators in metropolitan transportation plans. Transp. Policy 2017, 55, 38–50. [Google Scholar] [CrossRef]
- Juan, P.B.S.; Daniel, R.O.H. Transport accessibility and social inequities: A tool for identification of mobility needs and evaluation of transport investments. J. Transp. Geogr. 2012, 24, 142–154. [Google Scholar]
- Carteni, A.; Francesco, L.D.; Martino, M. The role of transport accessibility within the spread of the Coronavirus pandemic in Italy. Saf. Sci. 2020. [Google Scholar] [CrossRef]
- Carteni, A.; Francesco, L.D.; Martino, M. How mobility habits influenced the spread of the COVID-19 pandemic: Results from the Italian case study. Sci. Total Environ. 2020. [Google Scholar] [CrossRef]
- Jiang, S.; Guan, W.; He, Z.; Yang, L. Measuring Taxi Accessibility Using Grid-Based Method with Trajectory Data. Sustainability 2018, 10, 3187. [Google Scholar] [CrossRef] [Green Version]
- Wong, K.I.; Wong, S.C.; Yang, H. Modeling urban taxi services in congested road networks with elastic demand. Transp. Res. Part B Methodol. 2001, 35, 819–842. [Google Scholar] [CrossRef]
- Tang, J.; Liang, J.; Zhang, S.; Huang, H.; Liu, F. Inferring driving trajectories based on probabilistic model from large scale taxi GPS data. Phys. A Stat. Mech. Appl. 2018, 506, 566–577. [Google Scholar] [CrossRef]
- Zong, F.; Tian, Y.; He, Y.; Tang, J.; Lv, J. Trip destination prediction based on multi-day GPS data. Phys. A 2019, 515, 258–269. [Google Scholar] [CrossRef]
- Shaaban, K.; Kim, I. Assessment of the taxi service in Doha. Transp. Res. Part A Policy Pract. 2016, 88, 223–235. [Google Scholar] [CrossRef]
- Cui, J.X.; Liu, F.; Janssens, D.; An, S. Detecting urban road network accessibility problems using taxi GPS data. J. Transp. Geogr. 2016, 51, 147–157. [Google Scholar] [CrossRef]
- Hansen, W.G. How accessibility shapes land use. J. Am. Inst. Plan. 1959, 25, 73–76. [Google Scholar] [CrossRef]
- Geurs, K.T.; Wee, B.V. Accessibility evaluation of land-use and transport strategies: Review and research directions. J. Transp. Geogr. 2004, 12, 127–140. [Google Scholar] [CrossRef]
- Cascetta, E. Transportation Systems Analysis: Models and Applications; Springer: Berlin, Germany, 2009. [Google Scholar]
- Páez, A.; Scott, D.M.; Morency, C. Measuring accessibility: Positive and normative implementations of various accessibility indicators. J. Transp. Geogr. 2012, 25, 141–153. [Google Scholar] [CrossRef]
- Wee, B.V. Accessible accessibility research challenges. J. Transp. Geogr. 2016, 51, 9–16. [Google Scholar]
- Wang, Y.; Chen, B.Y.; Yuan, H.; Wang, D. Measuring temporal variation of location-based accessibility using space-time utility perspective. J. Transp. Geogr. 2018, 73, 13–24. [Google Scholar] [CrossRef]
- Neutens, T.; Schwanen, T.; Witlox, F.; De Maeyer, P. Equity of urban service delivery: A comparison of different accessibility measures. Environ. Plan. A 2010, 42, 1613–1635. [Google Scholar] [CrossRef]
- Gutierrez, J.; Gomez, G. The impact of orbital motorways on intra-metropolitan accessibility: The case of Madrid’s M-40. J. Transp. Geogr. 1999, 7, 1–15. [Google Scholar] [CrossRef]
- Martín, J.C.; García-Palomares, J.C.; Gutiérrez, J.; Román, C. Impacts of orbital motorways in metropolitan areas on accessibility: Efficiency and equity. A case study in Madrid. Transp. Land Use 2010, 3, 67–84. [Google Scholar]
- Chiarazzo, V.; dell’Olio, L.; Ibeas, Á.; Ottomanelli, M. Modeling the Effects of Environmental Impacts and Accessibility on Real Estate Prices in Industrial Cities. Proc. Soc. Behav. Sci. 2014, 111, 460–469. [Google Scholar] [CrossRef] [Green Version]
- Pedro, G.A.; Picornell, M.; Salas-Olmedo, M.H.; Gutiérrez, J. Exploring the potential of mobile phone records and online route planners for dynamic accessibility analysis. Transp. Res. Part A 2019, 125, 294–307. [Google Scholar]
- Liu, Y.; Liu, X.; Gao, S.; Gong, L.; Kang, C.; Zhi, Y.; Chi, G.; Shi, L. Social Sensing: A New Approach to Understanding Our Socioeconomic Environments. Ann. Assoc. Am. Geogr. 2015, 105, 512–530. [Google Scholar] [CrossRef]
- Miller, H.J.; Goodchild, M.F. Data-driven geography. GeoJournal 2015, 80, 449–461. [Google Scholar] [CrossRef]
- Yuan, H.; Chen, B.Y.; Li, Q.Q.; Shaw, S.-L.; Lam, W.H.K. Toward space-time buffering for spatio-temporal proximity analysis of movement data. Int. J. Geogr. Inf. Sci 2018, 32, 1211–1246. [Google Scholar] [CrossRef]
- Järv, O.; Tenkanen, H.; Salonen, M.; Ahas, R.; Toivonen, T. Dynamic cities: Location-based accessibility modelling as a function of time. Appl. Geogr. 2018, 95, 101–110. [Google Scholar] [CrossRef]
- Tang, J.; Wang, Y.; Hao, W.; Liu, F.; Huang, H.; Wang, Y. A mixed path size logit based taxi customer-search model considering spatio-temporal factors in route choice. IEEE Trans. Intell. Transp. Syst. 2020, 21, 1347–1358. [Google Scholar] [CrossRef]
- Zhang, S.; Tang, J.; Wang, H.; Wang, Y.; An, S. Revealing intra-urban travel patterns and service ranges from taxi trajectories. J. Transp. Geogr. 2017, 61, 72–86. [Google Scholar] [CrossRef]
- Farber, S.; Morang, M.Z.; Widener, M.J. Temporal variability in transit-based accessibility to supermarkets. Appl. Geogr. 2014, 53, 149–159. [Google Scholar] [CrossRef]
- Fransen, K.; Neutens, T.; Farber, S.; de Maeyer, P.; Deruyter, G.; Witlox, F. Identifying public transport gaps using time-dependent accessibility levels. J. Transp. Geogr. 2015, 48, 176–187. [Google Scholar] [CrossRef] [Green Version]
- Farber, S.; Fu, L. Dynamic public transit accessibility using travel time cubes: Comparing the effects of infrastructure (dis) investments over time. Comput. Environ. Urban Syst. 2017, 62, 30–40. [Google Scholar] [CrossRef] [Green Version]
- Li, Q.; Zhang, T.; Wang, H.; Zeng, Z. Dynamic accessibility mapping using floating car data: A network-constrained density estimation approach. J. Transp. Geogr. 2011, 19, 379–393. [Google Scholar] [CrossRef]
- Owen, A.; Levinson, D.M. Modeling the commute mode share of transit using continuous accessibility to jobs. Transp. Res. Part A 2015, 74, 110–122. [Google Scholar] [CrossRef] [Green Version]
- Dingil, A.E.; Schweizer, J.; Rupi, F.; Stasiskiene, Z. Transport indicator analysis and comparison of 151 urban areas, based on open source data. Eur. Transp. Res. Rev. 2018, 10, 58. [Google Scholar] [CrossRef] [Green Version]
- Zhang, S.; Liu, X.; Tang, J.; Cheng, S.; Qi, Y.; Wang, Y. Spatio-temporal modeling of destination choice behavior through the Bayesian hierarchical approach. Phys. A Stat. Mech. Appl. 2018, 512, 537–551. [Google Scholar] [CrossRef]
- Tang, J.; Bi, W.; Liu, F.; Zhang, W. Exploring urban travel patterns using density-based clustering with multi-attributes from large-scaled vehicle trajectories. Phys. A Stat. Mech. Appl. 2020. [Google Scholar] [CrossRef]
- Tang, J.; Zhang, S.; Chen, X.; Liu, F.; Zou, Y. Taxi Trips Distribution Modeling Based on Entropy-maximizing Theory: A Case Study in Harbin City-China. Phys. A Stat. Mech. Appl. 2018, 493, 430–443. [Google Scholar] [CrossRef]
- Chen, J.; Ni, J.; Xi, C.; Li, S.; Wang, J. Determining intra-urban spatial accessibility disparities in multimodal public transport networks. J. Transp. Geogr. 2017, 65, 123–133. [Google Scholar] [CrossRef]
- Stpniak, M.; Goliszek, S. Spatio-Temporal Variation of Accessibility by Public Transport—The Equity Perspective. Rise Big Spat. Data 2017. [Google Scholar] [CrossRef]
- Alonso, B.; Barreda, R.; Dell’Olio, L.; Ibeas, A. Modelling user perception of taxi service quality. Transp. Policy 2018, 63, 157–164. [Google Scholar] [CrossRef]
- Zhang, D.Z.; Sun, D.; Peng, Z.R. A Comprehensive Taxi Assessment Index Using Floating Car Data. J. Harbin Inst. Technol. 2014, 21, 7–16. [Google Scholar]
- Zhang, W.; Honnappa, H.; Ukkusuri, S.V. Modeling urban taxi services with e-hailings: A queueing network approach. Transp. Res. Part C 2020, 113, 332–349. [Google Scholar] [CrossRef] [Green Version]
- Kwan, M.P. Space-time and integral measures of individual accessibility: A comparative analysis using a point-based framework. Geogr. Anal. 1998, 30, 191–216. [Google Scholar] [CrossRef]
- Handy, S.L.; Niemeier, D.A. Measuring accessibility: An exploration of issues and alternatives. Environ. Plan. A 1997, 29, 1175–1194. [Google Scholar] [CrossRef]
- Delafontaine, M.; Neutens, T.; Schwanen, T.; Weghe, N.V.D. The impact of opening hours on the equity of individual space-time accessibility. Comput. Environ. Urban Syst. 2011, 35, 276–288. [Google Scholar] [CrossRef] [Green Version]
- Tenkanen, H.; Saarsalmi, P.; Järv, O.; Salonen, M.; Toivonen, T. Health research needs more comprehensive accessibility measures: Integrating time and transport modes from open data. Int. J. Health Geogr. 2016, 15, 23. [Google Scholar] [CrossRef] [Green Version]
- Widener, M.J.; Minaker, L.; Farber, S.; Allen, J.; Vitali, B.; Coleman, P.C.; Cook, B. How do changes in the daily food and transportation environments affect grocery store accessibility? Appl. Geogr. 2017, 83, 46–62. [Google Scholar] [CrossRef]


| Constant POIs | Conventional Impedance Function 1 | Dynamic Availability Intensity | Passenger Waiting Time | Piecewise Distance Decay Function | |
|---|---|---|---|---|---|
| Scenario 1 | √ | √ | |||
| Scenario 2 | √ | √ | √ | ||
| Scenario 3 | √ | √ | √ | ||
| Scenario 4 | √ | √ | |||
| Scenario 5 | √ | √ | √ | √ |
| Scenario 1 | Count | Minimum | Maximum | Sum | Mean | Standard Deviation |
| 8:00–9:00 | 1705 | 0 | 21,147.53 | 3,887,898.71 | 2280.29 | 3964.16 |
| 12:00–13:00 | 1705 | 0 | 21,820.24 | 4,566,265.52 | 2678.16 | 4631.75 |
| 17:00–18:00 | 1705 | 0 | 19,482.96 | 3,693,045.85 | 2166.01 | 3875.31 |
| Scenario 2 | Count | Minimum | Maximum | Sum | Mean | Standard deviation |
| 8:00–9:00 | 1705 | 0 | 15,680.50 | 2,431,589.68 | 1426.15 | 2670.50 |
| 12:00–13:00 | 1705 | 0 | 14,365.55 | 2,732,044.73 | 1602.37 | 2929.05 |
| 17:00–18:00 | 1705 | 0 | 13,533.87 | 2,363,108.56 | 1385.99 | 2739.05 |
| Differences between scenario 1 and 2 | Minimum | Maximum | Sum | Mean | Standard deviation | |
| 8:00–9:00 | 0 | −5467.03 | −1,456,309.03 | −854.14 | −1293.66 | |
| 12:00–13:00 | 0 | −7454.69 | −1,834,220.80 | −1075.79 | −1702.70 | |
| 17:00–18:00 | 0 | −5949.09 | −1,329,937.29 | −780.02 | −1136.26 | |
| Differences (%) between scenario 1 and 2 | Minimum | Maximum | Sum | Mean | Standard deviation | |
| 8:00–9:00 | 0 | −25.85 | −37.46 | −37.46 | −32.63 | |
| 12:00–13:00 | 0 | −34.16 | −40.17 | −40.17 | −36.76 | |
| 17:00–18:00 | 0 | −30.53 | −36.01 | −36.01 | −29.32 | |
| Scenario 3 | Count | Minimum | Maximum | Sum | Mean | Standard deviation |
| 8:00–9:00 | 1705 | 0 | 20,845.47 | 3,556,847.34 | 2086.13 | 3869.22 |
| 12:00–13:00 | 1705 | 0 | 21,691.07 | 4,119,342.58 | 2416.04 | 4532.01 |
| 17:00–18:00 | 1705 | 0 | 19,166.07 | 3,396,523.29 | 1992.10 | 3800.40 |
| Differences between scenario 1 and 3 | Minimum | Maximum | Sum | Mean | Standard deviation | |
| 8:00–9:00 | 0 | −302.06 | −331,051.37 | −194.17 | −94.93 | |
| 12:00–13:00 | 0 | −129.17 | −446,922.95 | −262.12 | −99.74 | |
| 17:00–18:00 | 0 | −316.89 | −296,522.56 | −173.91 | −74.91 | |
| Differences (%) between scenario 1 and 3 | Minimum | Maximum | Sum | Mean | Standard deviation | |
| 8:00–9:00 | 0 | −1.43 | −8.51 | −8.51 | −2.39 | |
| 12:00–13:00 | 0 | −0.59 | −9.79 | −9.79 | −2.15 | |
| 17:00–18:00 | 0 | −1.63 | −8.03 | −8.03 | −1.93 | |
| Scenario 4 | Count | Minimum | Maximum | Sum | Mean | Standard deviation |
| 8:00–9:00 | 1705 | 0 | 32,621.86 | 6,018,893.09 | 3530.14 | 6199.37 |
| 12:00–13:00 | 1705 | 0 | 33,255.76 | 6,934,102.02 | 4066.92 | 7096.81 |
| 17:00–18:00 | 1705 | 0 | 32,711.16 | 5,998,152.25 | 3517.98 | 6379.09 |
| Differences between scenario 1 and 4 | Minimum | Maximum | Sum | Mean | Standard deviation | |
| 8:00–9:00 | 0 | 11,474.33 | 2,130,994.38 | 1249.85 | 2235.21 | |
| 12:00–13:00 | 0 | 11,435.52 | 2,367,836.50 | 1388.76 | 2465.06 | |
| 17:00–18:00 | 0 | 13,228.19 | 2,305,106.41 | 1351.97 | 2503.78 | |
| Differences (%) between scenario 1 and 4 | Minimum | Maximum | Sum | Mean | Standard deviation | |
| 8:00–9:00 | 0 | 54.26 | 54.81 | 54.81 | 56.39 | |
| 12:00–13:00 | 0 | 52.41 | 51.85 | 51.85 | 53.22 | |
| 17:00–18:00 | 0 | 67.90 | 62.42 | 62.42 | 64.61 | |
| Scenario 5 | Count | Minimum | Maximum | Sum | Mean | Standard deviation |
| 8:00–9:00 | 1705 | 0 | 23,354.53 | 3,496,023.99 | 2050.45 | 4078.43 |
| 12:00–13:00 | 1705 | 0 | 21,689.77 | 3,798,243.71 | 2227.71 | 4384.05 |
| 17:00–18:00 | 1705 | 0 | 22,312.11 | 3,604,799.85 | 2114.25 | 4413.78 |
| Differences between scenario 1 and 5 | Minimum | Maximum | Sum | Mean | Standard deviation | |
| 8:00–9:00 | 0 | 2207.00 | −391,874.72 | −229.84 | 114.27 | |
| 12:00–13:00 | 0 | −130.46 | −768,021.81 | −450.45 | −247.69 | |
| 17:00–18:00 | 0 | 2829.15 | −88,245.99 | −51.76 | 538.48 | |
| Differences (%) between scenario 1 and 5 | Minimum | Maximum | Sum | Mean | Standard deviation | |
| 8:00–9:00 | 0 | 10.44 | −10.08 | −10.08 | 2.88 | |
| 12:00–13:00 | 0 | −0.60 | −16.82 | −16.82 | −5.35 | |
| 17:00–18:00 | 0 | 14.52 | −2.39 | −2.39 | 13.90 | |
Publisher’s Note: MDPI stays neutral with regard to jurisdictional claims in published maps and institutional affiliations. |
© 2020 by the authors. Licensee MDPI, Basel, Switzerland. This article is an open access article distributed under the terms and conditions of the Creative Commons Attribution (CC BY) license (http://creativecommons.org/licenses/by/4.0/).
Share and Cite
Huang, H.; Wu, J.; Liu, F.; Wang, Y. Measuring Accessibility Based on Improved Impedance and Attractive Functions Using Taxi Trajectory Data. Sustainability 2021, 13, 112. https://doi.org/10.3390/su13010112
Huang H, Wu J, Liu F, Wang Y. Measuring Accessibility Based on Improved Impedance and Attractive Functions Using Taxi Trajectory Data. Sustainability. 2021; 13(1):112. https://doi.org/10.3390/su13010112
Chicago/Turabian StyleHuang, Helai, Jialing Wu, Fang Liu, and Yiwei Wang. 2021. "Measuring Accessibility Based on Improved Impedance and Attractive Functions Using Taxi Trajectory Data" Sustainability 13, no. 1: 112. https://doi.org/10.3390/su13010112