Digital Facility Layout Planning


Abstract
:1. Introduction
- What digital technologies can support facility layout planning?
- How can each technology be used and implemented in facility layout planning?
- What is the impact of emerging technologies on the three pillars of sustainability in facility layout planning?
2. Theoretical Background
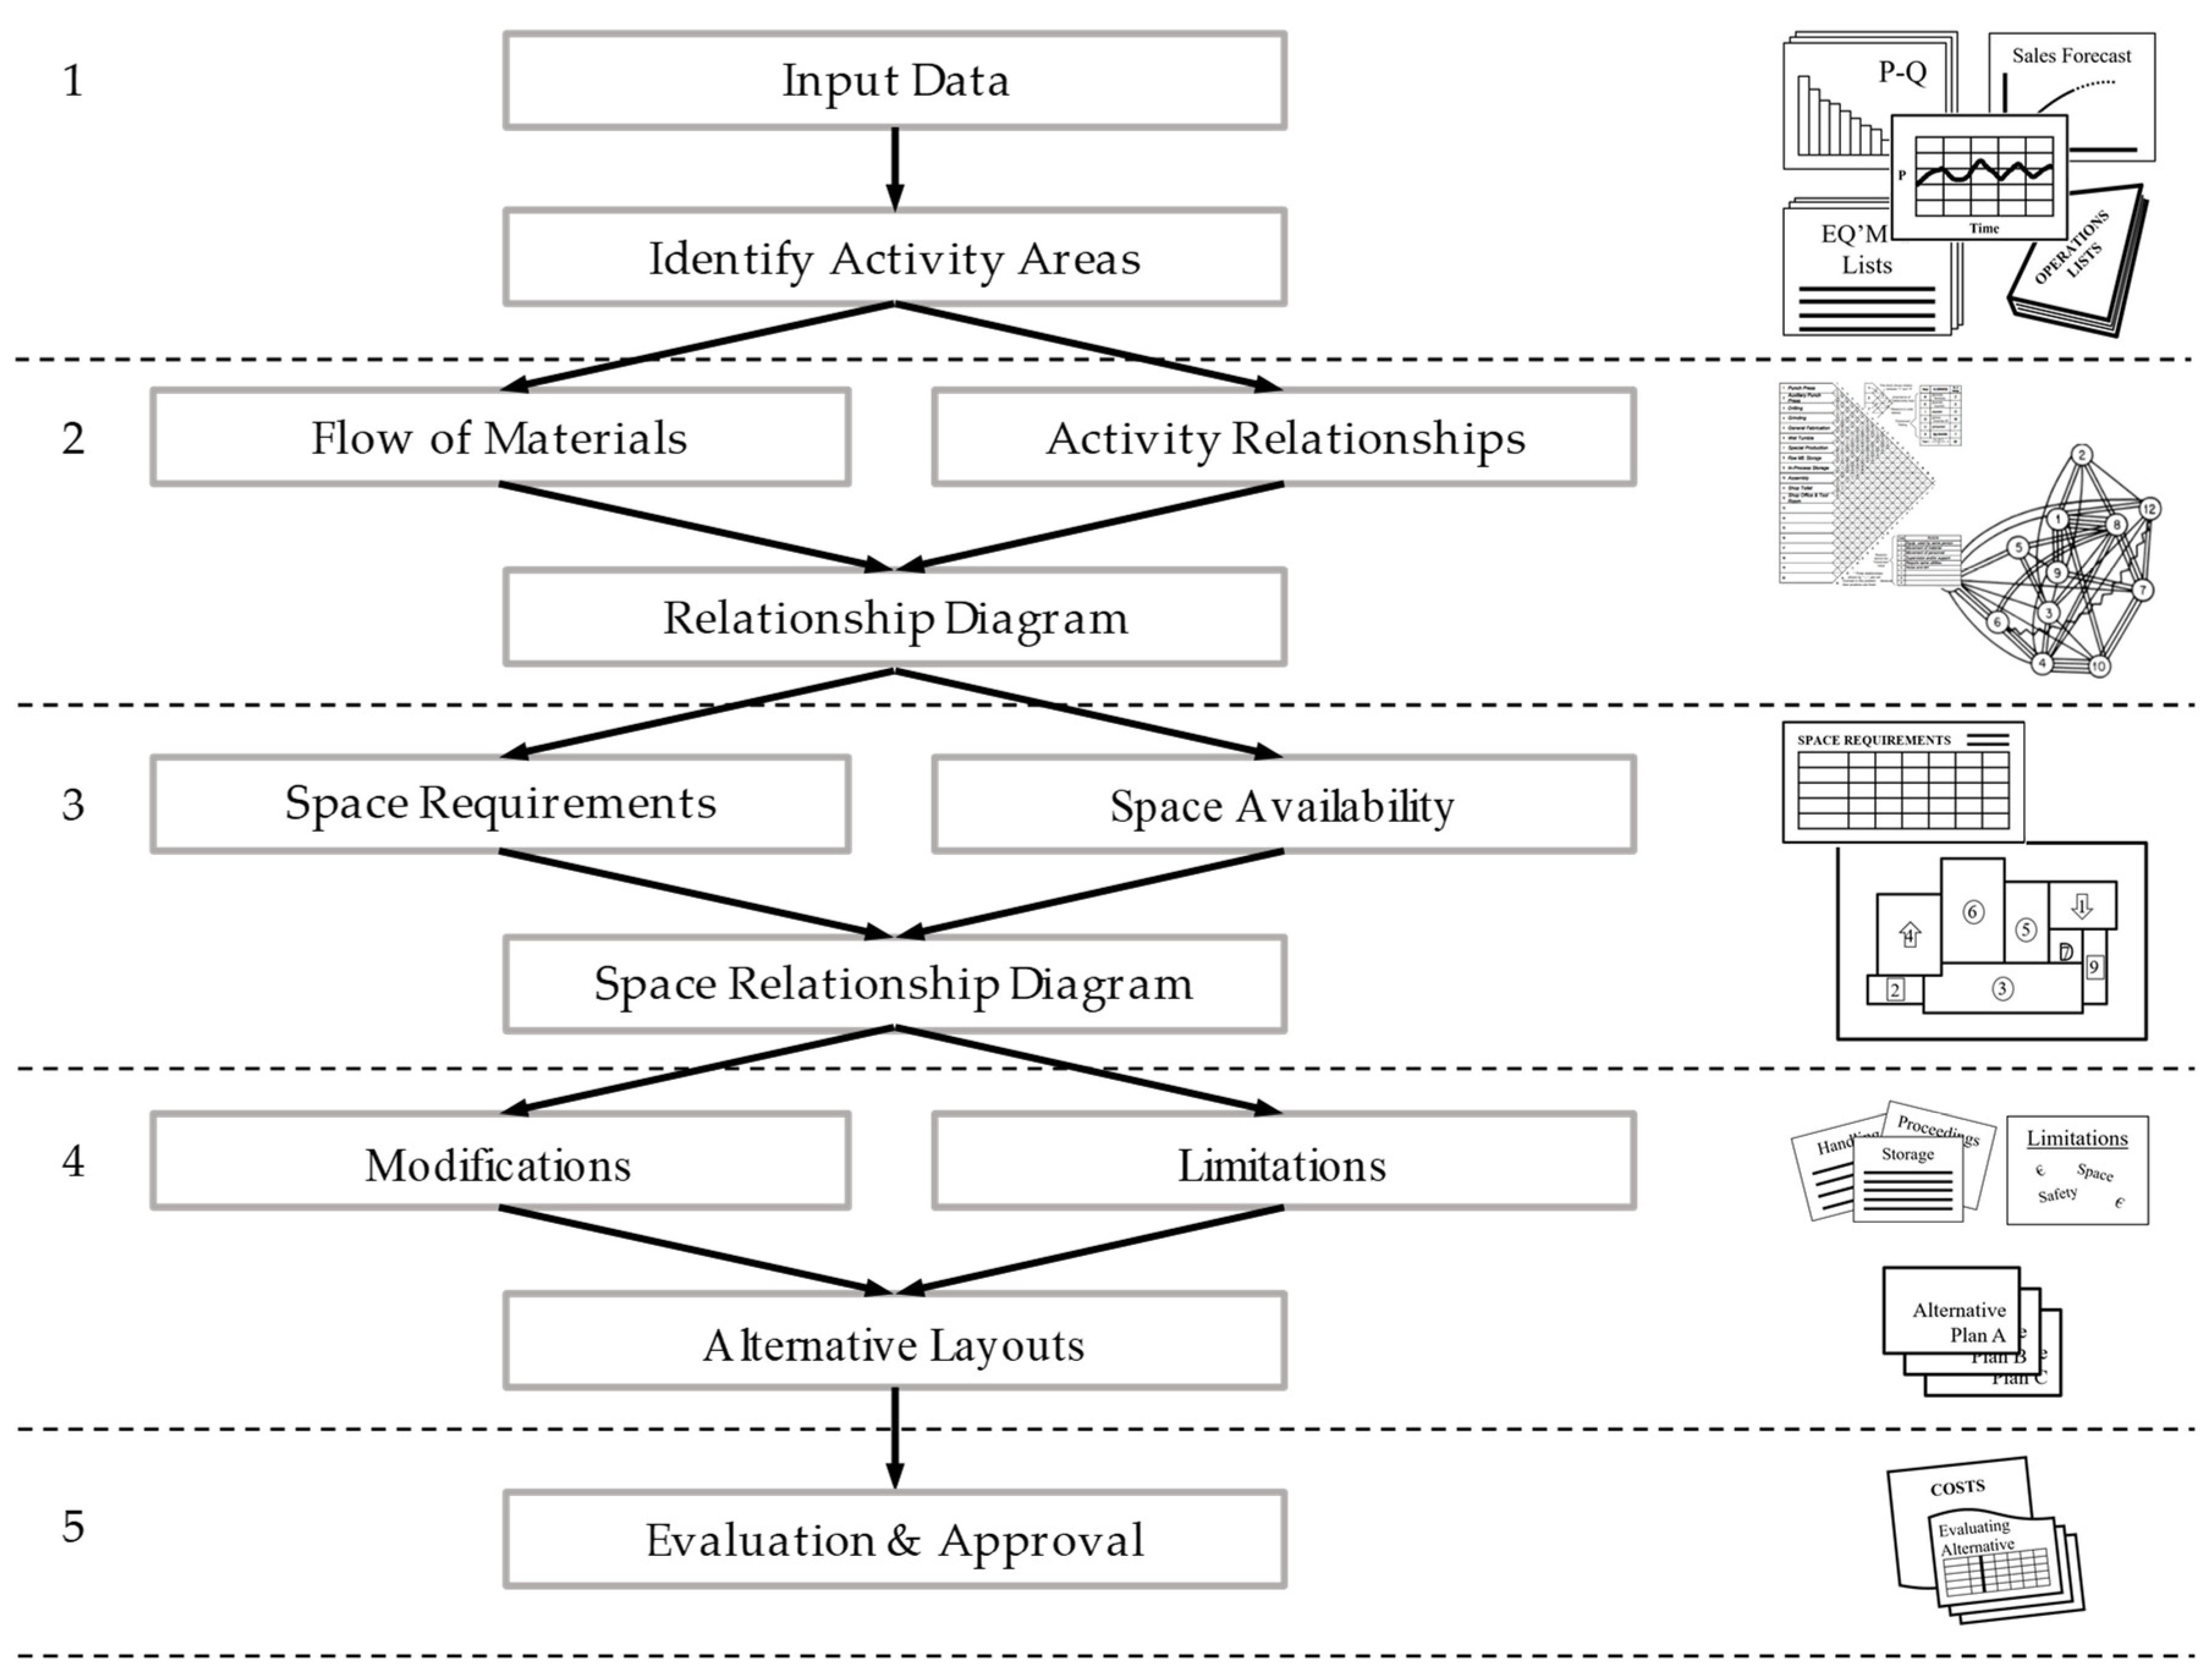
2.1. Layout Planning
- Optimize capital investment (initial investment, installation fixed costs, start-up costs, annual operating costs, maintenance costs, return on investment, payback period)
- Optimize space utilization
- Optimize flow (materials, personnel, and information)
- Optimize handling (e.g., minimize the cost of materials handling)
- Optimize the use of equipment
2.2. Digital Technologies for Layout Planning
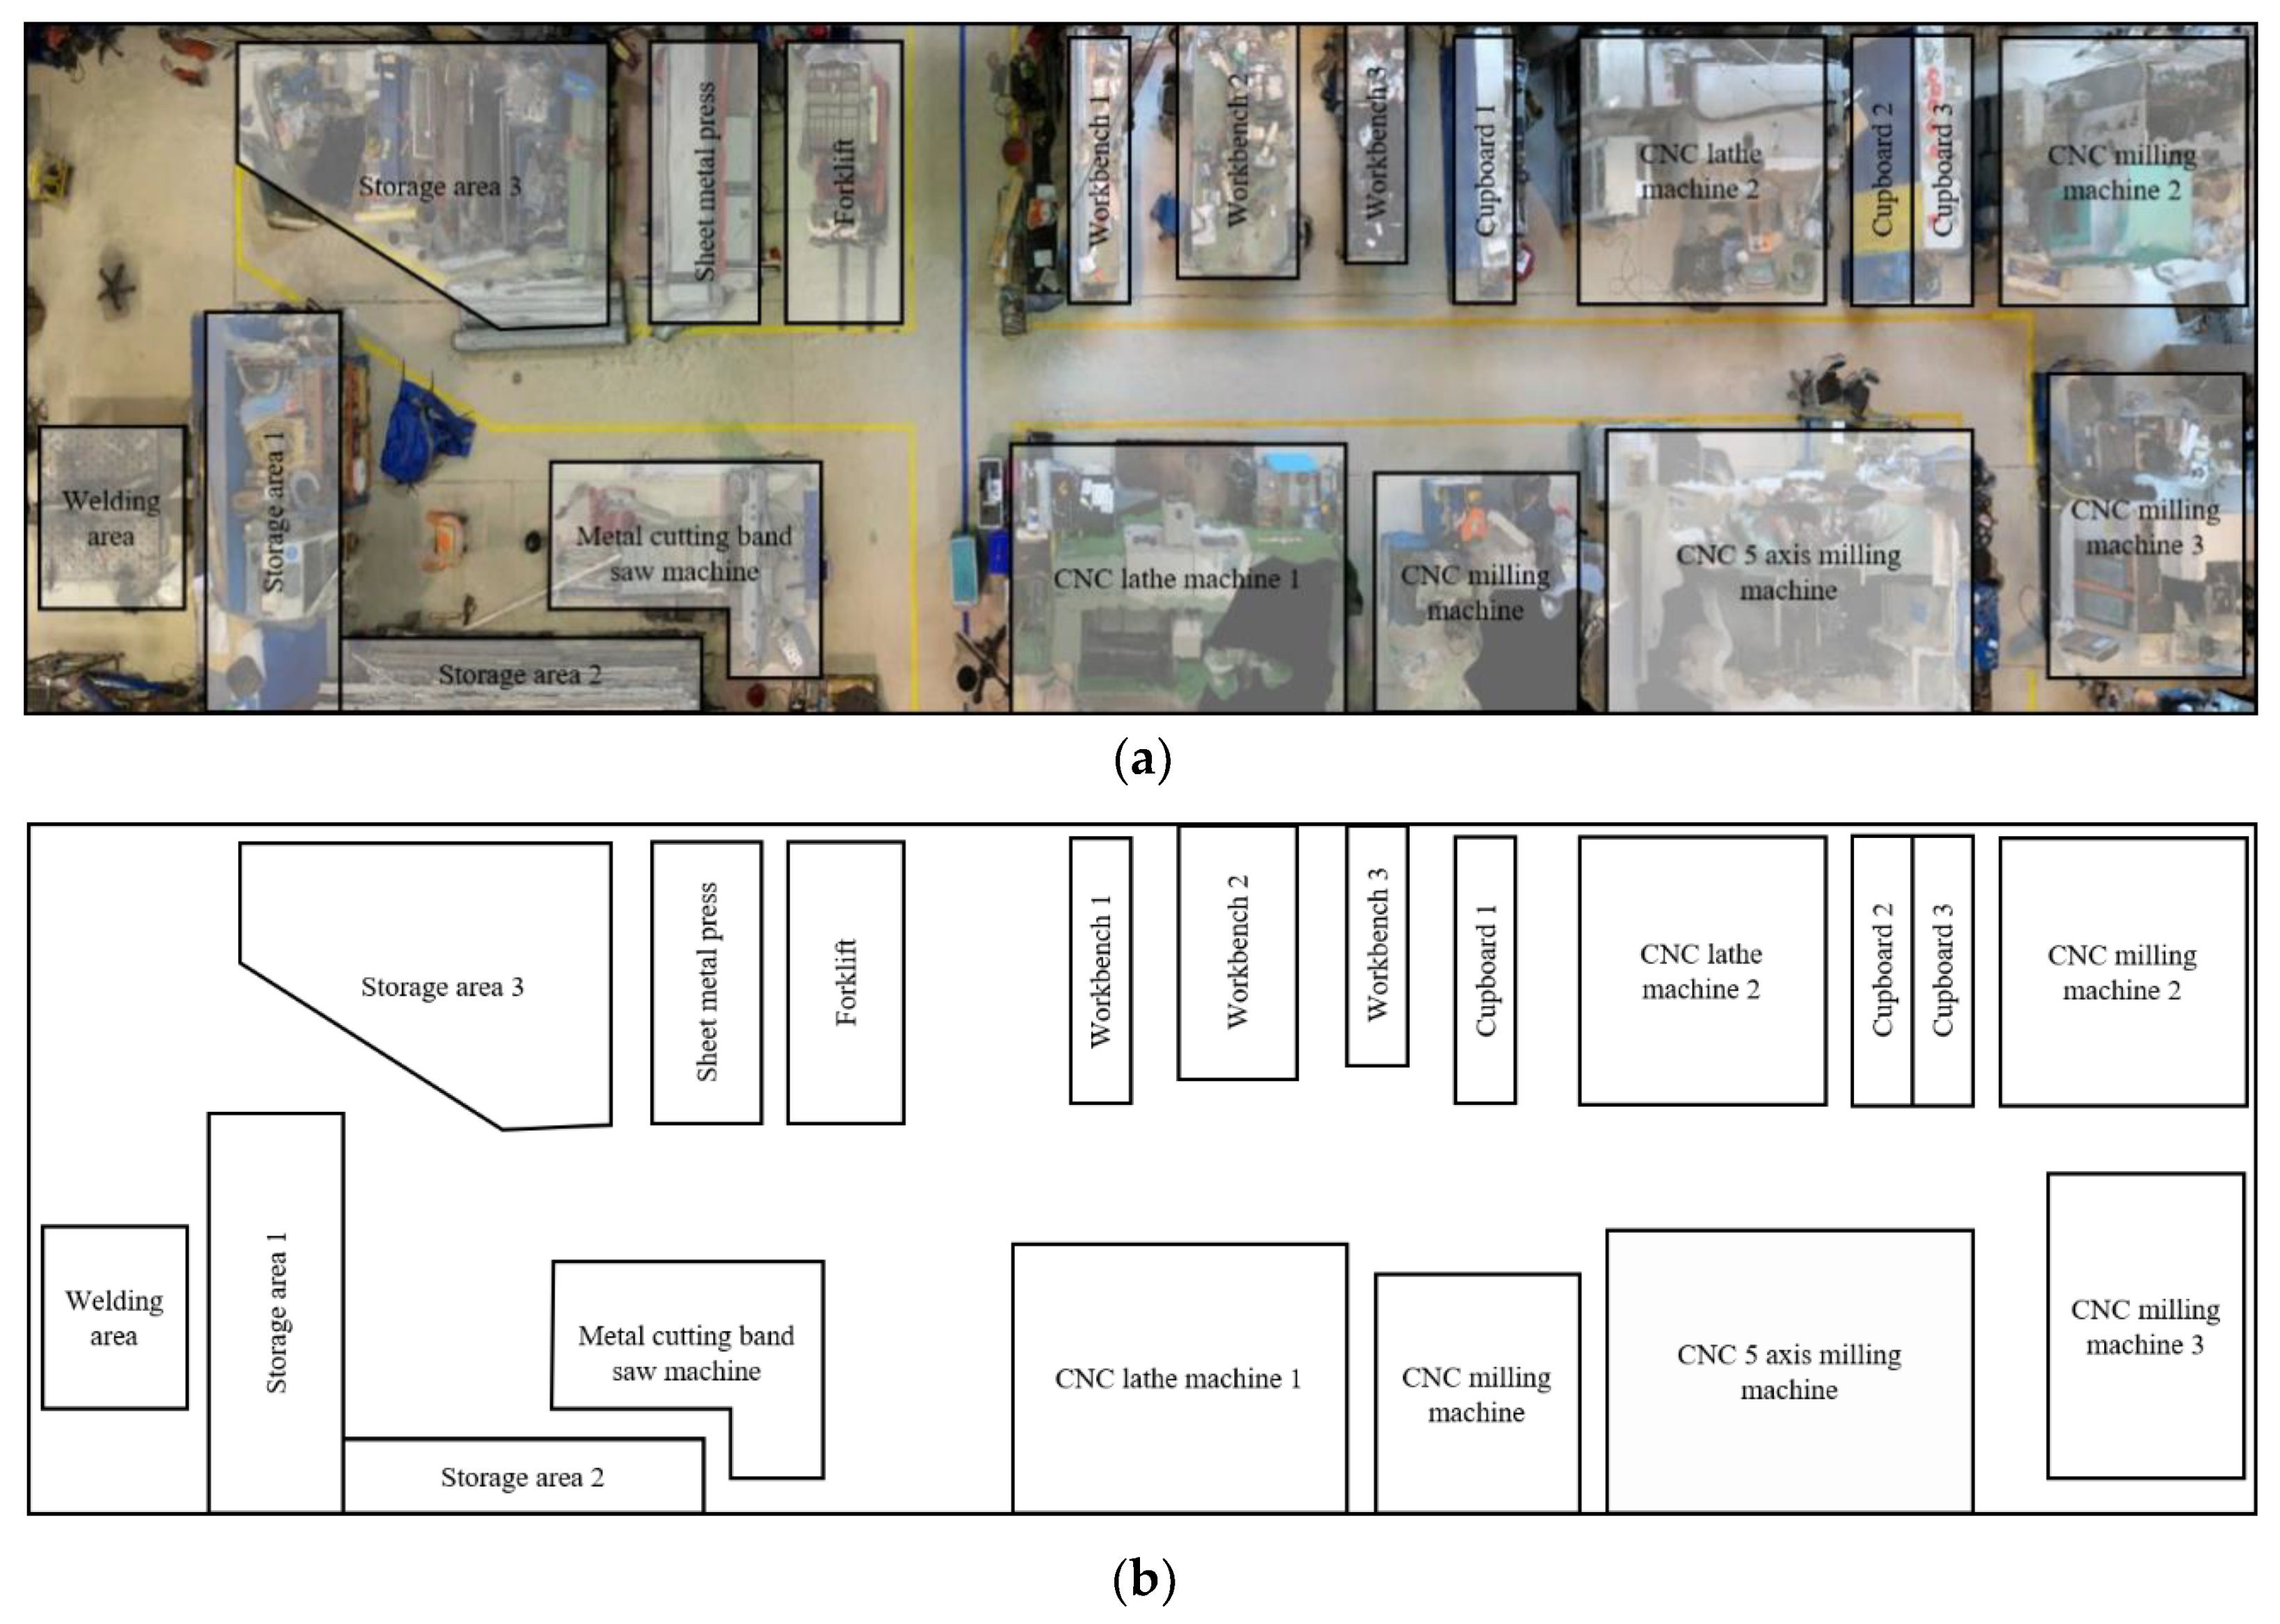
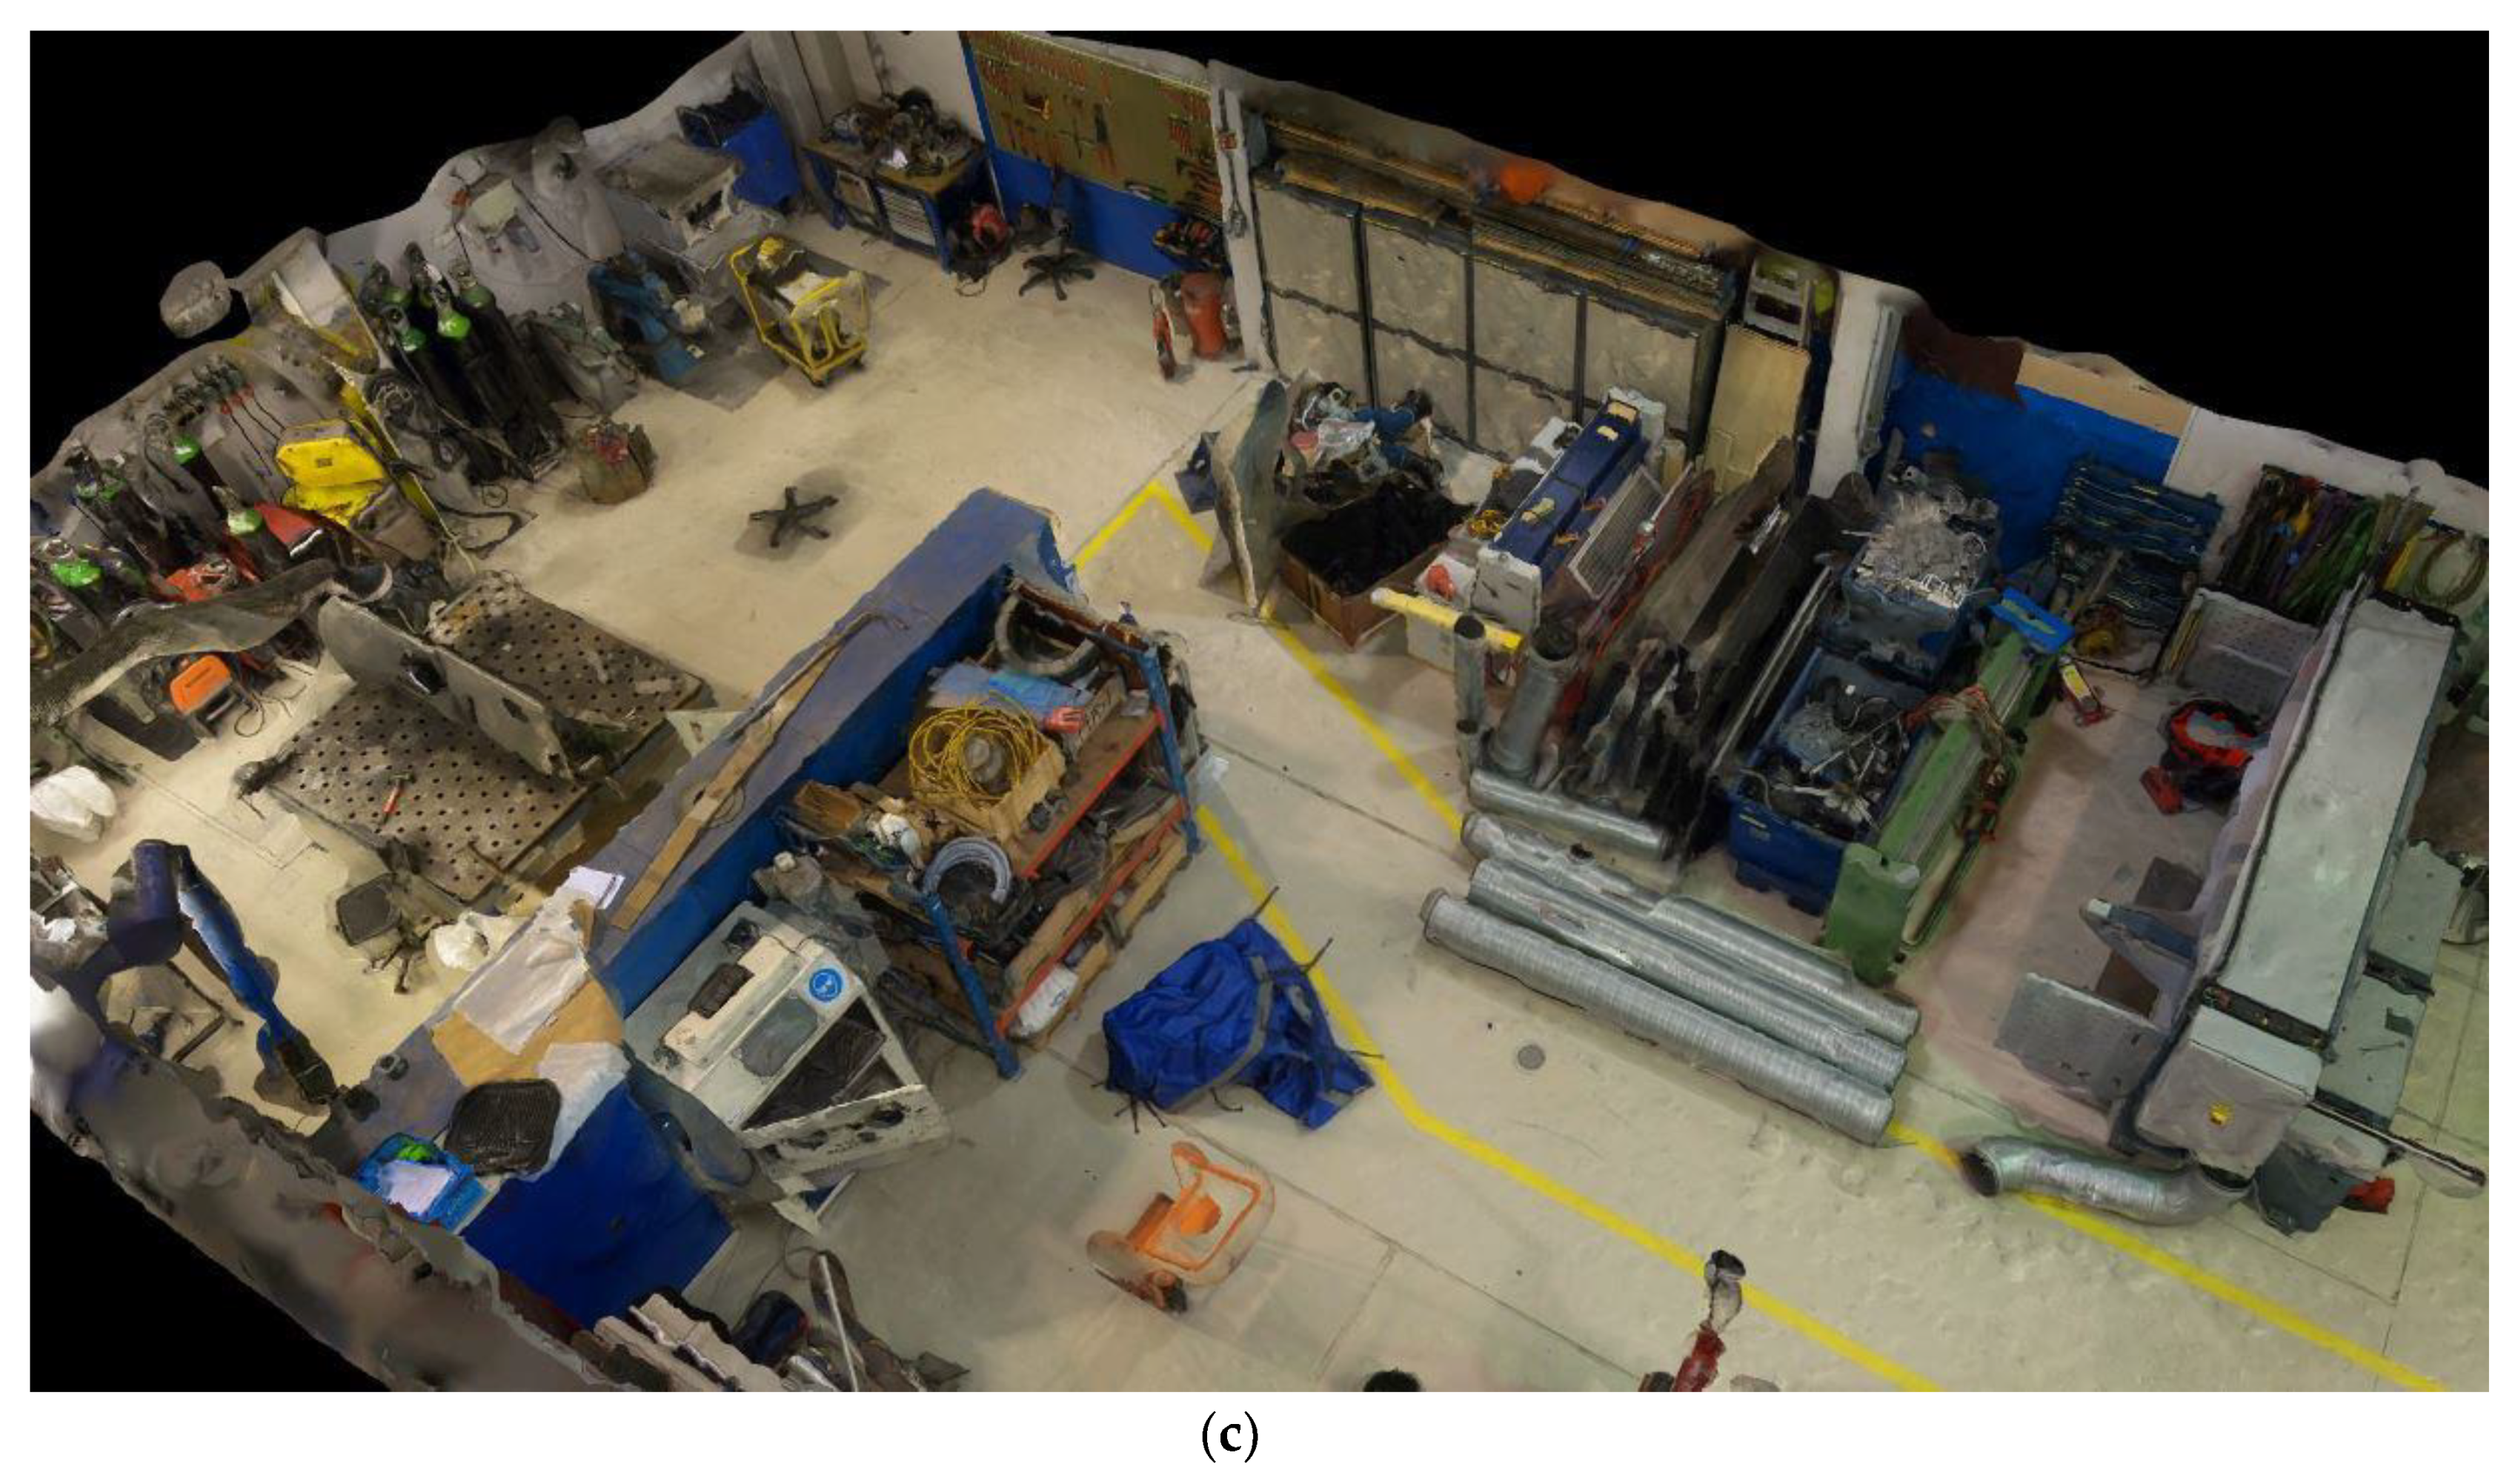
2.2.1. 3D Mapping
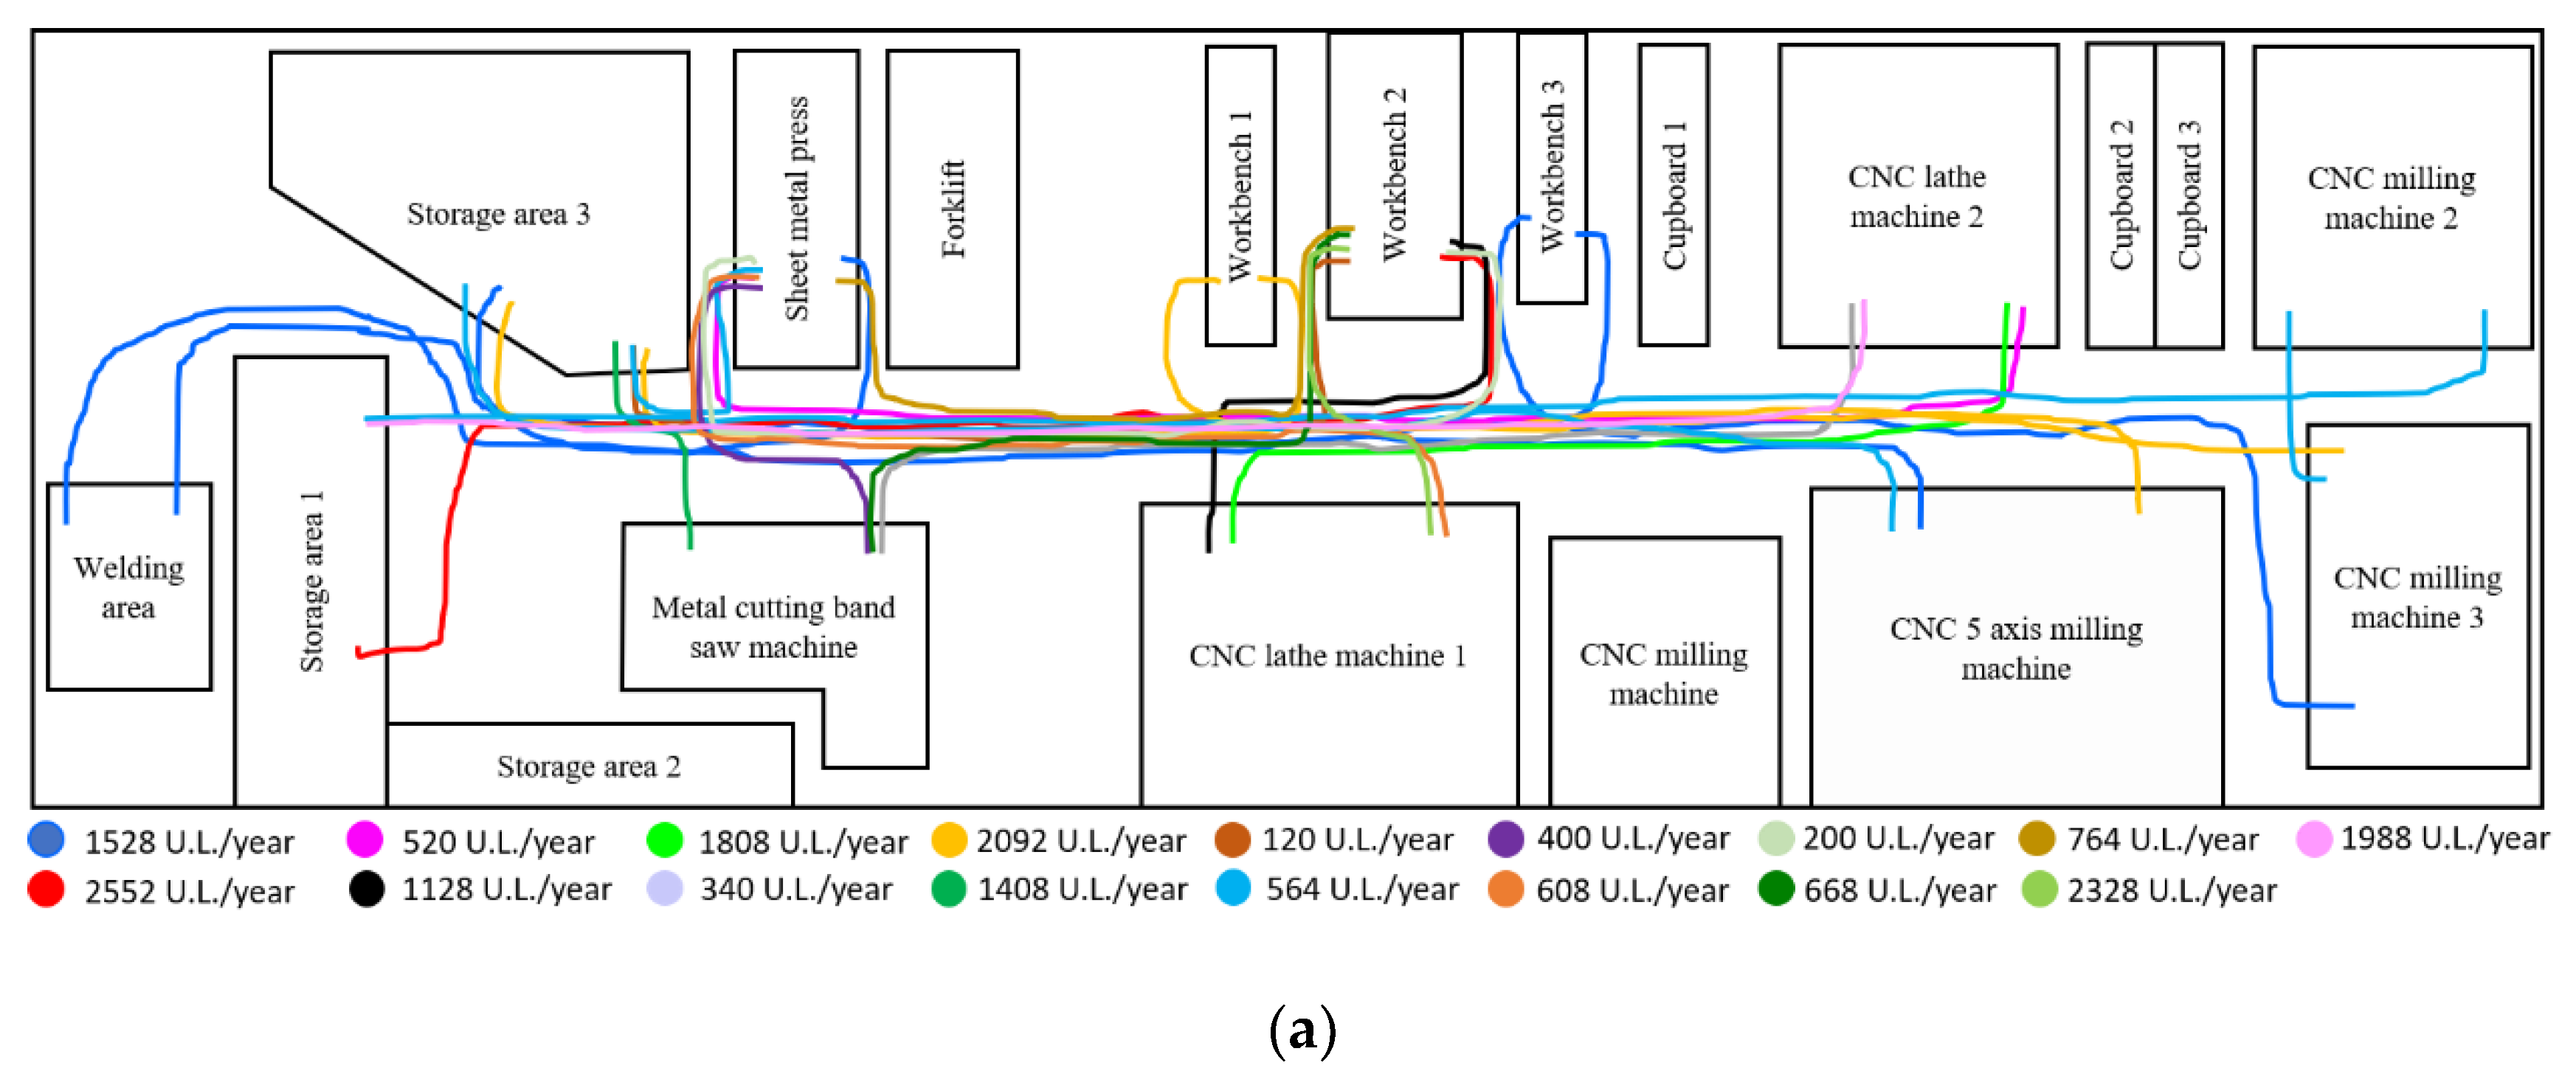
2.2.2. Indoor Positioning System (IPS)
2.2.3. Motion Capture System (MoCap) and Immersive Reality (IR)
3. Results
4. Discussion
5. Conclusions
- All the technologies herein considered reduce the time efforts, error rates and costs involved in the five-step layout planning procedures on the department, machine, and workstation level
- MoCap and IR are particularly attractive considering the social pillar since they allow to pursue a human-centered design of the workstation that improves the ergonomic of the workers and reduces their fatigue
- An optimal and dynamic layout in both the department and machine level impact the environment with a reduced need for new buildings and transportation activities
Author Contributions
Funding
Conflicts of Interest
References
- Armour, G.C.; Buffa, E.S. Heuristic algorithm and simulation approach to relative location of facilities. Manag. Sci. 1963, 9, 171–349. [Google Scholar] [CrossRef]
- Shubin, J.A.; Madeheim, H. Plant Layout: Developing and Improving Manufacturing Plants—John A. Shubin, Huxley Madeheim—Google Books; Prentice-Hall: New York, NY, USA, 1951. [Google Scholar]
- Drira, A.; Pierreval, H.; Hajri-Gabouj, S. Facility layout problems: A survey. Annu. Rev. Control 2007, 31, 255–267. [Google Scholar] [CrossRef]
- Ahmadi, A.; Pishvaee, M.S.; Akbari Jokar, M.R. A survey on multi-floor facility layout problems. Comput. Ind. Eng. 2017, 107, 158–170. [Google Scholar] [CrossRef]
- Attri, R.; Grover, S. Modelling the quality enabled factors of facility layout design stage of production system life cycle. Int. J. Syst. Assur. Eng. Manag. 2017, 8, 413–423. [Google Scholar] [CrossRef]
- Hosseini-Nasab, H.; Fereidouni, S.; Fatemi Ghomi, S.M.T.; Fakhrzad, M.B. Classification of facility layout problems: A review study. Int. J. Adv. Manuf. Technol. 2018, 94, 957–977. [Google Scholar] [CrossRef]
- Zhu, T.; Balakrishnan, J.; Cheng, C.H. Recent advances in dynamic facility layout research. INFOR 2018, 56, 428–456. [Google Scholar] [CrossRef]
- Boysen, N.; de Koster, R.; Weidinger, F. Warehousing in the e-commerce era: A survey. Eur. J. Oper. Res. 2019, 277, 396–411. [Google Scholar] [CrossRef]
- Papadimitriou, F. Modelling spatial landscape complexity using the Levenshtein algorithm. Ecol. Inform. 2009, 4, 48–55. [Google Scholar] [CrossRef]
- Hansmann, R.; Mieg, H.A.; Frischknecht, P. Principal sustainability components: Empirical analysis of synergies between the three pillars of sustainability. Int. J. Sustain. Dev. World Ecol. 2012, 19, 451–459. [Google Scholar] [CrossRef]
- Carter, C.R.; Rogers, D.S. A framework of sustainable supply chain management: Moving toward new theory. Int. J. Phys. Distrib. Logist. Manag. 2008, 38, 360–387. [Google Scholar] [CrossRef]
- Henriques, A.; Richardson, J. The Triple Bottom Line: Does It All Add Up? Routledge: Oxfordshire, UK, 2004; ISBN 1136551689. [Google Scholar]
- Tak, C.S.; Lalit Yadav, M. Improvement in Layout Design using SLP of a small size manufacturing unit: A case study. IOSR J. Eng. 2012, 2, 1–7. [Google Scholar] [CrossRef]
- Muther, R.; Hales, L. Systematic Layout Planning, Fourth Edition; Management and Industrial Research Publications: Marietta, GA, USA, 2015. [Google Scholar]
- Marcoux, N.; Riopel, D.; Langevin, A. Models and methods for facilities layout design from an applicability to real-world perspective. In Logistics Systems: Design and Optimization; Springer: Berlin, Germany, 2005; pp. 123–170. [Google Scholar]
- Heragu, S.S. Facilities Design; CRC Press: Boca Raton, FL, USA, 2016; ISBN 9781498732895. [Google Scholar]
- Singh, S.P.; Sharma, R.R.K. A review of different approaches to the facility layout problems. Int. J. Adv. Manuf. Technol. 2006, 30, 425–433. [Google Scholar] [CrossRef]
- El-Hakim, S.; Remondino, F. Image-based 3D Modelling: A Review. Photogramm. Rec. 2006, 21, 269–291. [Google Scholar]
- Luhmann, T. Close range photogrammetry for industrial applications. ISPRS J. Photogramm. Remote Sens. 2010, 65, 558–569. [Google Scholar] [CrossRef]
- Boesemann, W.; Godding, R.; Huette, H. Photogrammetric measurement techniques for quality control in sheet metal forming. In Proceedings of the Archives of Photogrammetry, Remote Sensing and Spatial Information Science, Amsterdam, The Nerthlands, 16–22 July 2000. [Google Scholar]
- Wang, J.; Sun, W.; Shou, W.; Wang, X.; Wu, C.; Chong, H.Y.; Liu, Y.; Sun, C. Integrating BIM and LiDAR for Real-Time Construction Quality Control. J. Intell. Robot. Syst. Theory Appl. 2015, 79, 417–432. [Google Scholar] [CrossRef]
- Puente, I.; González-Jorge, H.; Martínez-Sánchez, J.; Arias, P. Review of mobile mapping and surveying technologies. Meas. J. Int. Meas. Confed. 2013, 46, 2127–2145. [Google Scholar] [CrossRef]
- Gu, Y.; Lo, A.; Niemegeers, I. A survey of indoor positioning systems for wireless personal networks. IEEE Commun. Surv. Tutor. 2009, 11, 13–32. [Google Scholar] [CrossRef] [Green Version]
- Tesoriero, R.; Gallud, J.; Lozano, M.; Penichet, V. Using active and passive RFID technology to support indoor location-aware systems. IEEE Trans. Consum. Electron. 2008, 54, 578–583. [Google Scholar] [CrossRef]
- Zuin, S.; Calzavara, M.; Sgarbossa, F.; Persona, A. Ultra Wide Band Indoor Positioning System: Analysis and testing of an IPS technology. IFAC-PapersOnLine 2018, 51, 1488–1492. [Google Scholar]
- Curran, K.; Furey, E.; Lunney, T.; Santos, J.; Woods, D.; McCaughey, A. An evaluation of indoor location determination technologies. J. Locat. Based Serv. 2011, 5, 61–78. [Google Scholar] [CrossRef]
- Kaemarungsi, K.; Krishnamurthy, P. Properties of indoor received signal strength for WLAN location fingerprinting. In Proceedings of the The First Annual International Conference on Mobile and Ubiquitous Systems: Networking and Services, Boston, MA, USA, 26 August 2004; IEEE: Piscataway, NJ, USA, 2004; pp. 14–23. [Google Scholar]
- Hightower, J.; Borriello, G. Location Sensing Techniques; University of Washington: Seattle, WA, USA, 2001. [Google Scholar]
- Deak, G.; Curran, K.; Condell, J. A survey of active and passive indoor localisation systems. Comput. Commun. 2012, 35, 1939–1954. [Google Scholar] [CrossRef]
- Liang, J.Z.; Corso, N.; Turner, E.; Zakhor, A. Image Based Localization in Indoor Environments. In Proceedings of the 2013 Fourth International Conference on Computing for Geospatial Research and Application, San Jose, CA, USA, 22–24 July 2013; IEEE: Piscataway, NJ, USA, 2013; pp. 70–75. [Google Scholar]
- Mainetti, L.; Patrono, L.; Sergi, I. A survey on indoor positioning systems. In Proceedings of the 2014 22nd International Conference on Software, Telecommunications and Computer Networks (SoftCOM), Split, Croatia, 17–19 September 2014; IEEE: Piscataway, NJ, USA, 2014; pp. 111–120. [Google Scholar]
- Fernando, X.N.; Krishnan, S.; Sun, H.; Kazemi-Moud, K. Adaptive Denoising at Infrared Wireless Receivers; Andresen, B.F., Fulop, G.F., Eds.; International Society for Optics and Photonics: Bellingham, WA, USA, 2003; Volume 5074, p. 199. [Google Scholar]
- Chen, L.-H.; Wu, E.H.-K.; Jin, M.-H.; Chen, G.-H. Intelligent Fusion of Wi-Fi and Inertial Sensor-Based Positioning Systems for Indoor Pedestrian Navigation. IEEE Sens. J. 2014, 14, 4034–4042. [Google Scholar] [CrossRef]
- Ni, L.M.; Liu, Y.; Lau, Y.C.; Patil, A.P. LANDMARC: Indoor location sensing using active RFID. In Proceedings of the First IEEE International Conference on Pervasive Computing and Communications, Fort Worth, TX, USA, 26 March 2003; pp. 407–415. [Google Scholar]
- Battaïa, O.; Otto, A.; Sgarbossa, F.; Pesch, E. Future trends in management and operation of assembly systems: From customized assembly systems to cyber-physical systems. Omega 2018, 78, 1–4. [Google Scholar] [CrossRef] [Green Version]
- Pine, B.J. Mass Customization: The New Frontier in Business Competition; Harvard Business School Press: Cambridge, MA, USA, 1993; ISBN 0875843727. [Google Scholar]
- Zennaro, I.; Finco, S.; Battini, D.; Persona, A. Big size highly customised product manufacturing systems: A literature review and future research agenda. Int. J. Prod. Res. 2019, 57, 5362–5385. [Google Scholar] [CrossRef] [Green Version]
- Gonzalez, I.; Morer, P. Ergonomics for the inclusion of older workers in the knowledge workforce and a guidance tool for designers. Appl. Ergon. 2016, 53, 131–142. [Google Scholar] [CrossRef]
- Calzavara, M.; Battini, D.; Bogataj, D.; Sgarbossa, F.; Zennaro, I. Ageing workforce management in manufacturing systems: State of the art and future research agenda. Int. J. Prod. Res. 2020, 58, 729–747. [Google Scholar] [CrossRef] [Green Version]
- Brinzer, B.; Banerjee, A. Measuring the Human Aspect: The Key for Managing the Complexity in Production; Springer: Berlin, Germany, 2018; pp. 14–24. [Google Scholar]
- Dul, J.; Neumann, W.P. Ergonomics contributions to company strategies. Appl. Ergon. 2009, 40, 745–752. [Google Scholar] [CrossRef] [Green Version]
- Battini, D.; Faccio, M.; Persona, A.; Sgarbossa, F. New methodological framework to improve productivity and ergonomics in assembly system design. Int. J. Ind. Ergon. 2011, 41, 30–42. [Google Scholar] [CrossRef]
- Battini, D.; Persona, A.; Sgarbossa, F. Innovative real-time system to integrate ergonomic evaluations into warehouse design and management. Comput. Ind. Eng. 2014, 77, 1–10. [Google Scholar] [CrossRef]
- Otto, A.; Battaïa, O. Reducing physical ergonomic risks at assembly lines by line balancing and job rotation: A survey. Comput. Ind. Eng. 2017, 111, 467–480. [Google Scholar] [CrossRef]
- Otto, A.; Boysen, N.; Scholl, A.; Walter, R. Ergonomic workplace design in the fast pick area. OR Spectr. 2017, 39, 945–975. [Google Scholar] [CrossRef]
- Vignais, N.; Miezal, M.; Bleser, G.; Mura, K.; Gorecky, D.; Marin, F. Innovative system for real-time ergonomic feedback in industrial manufacturing. Appl. Ergon. 2013, 44, 566–574. [Google Scholar] [CrossRef] [PubMed]
- Vignais, N.; Bernard, F.; Touvenot, G.; Sagot, J.-C. Physical risk factors identification based on body sensor network combined to videotaping. Appl. Ergon. 2017, 65, 410–417. [Google Scholar] [CrossRef] [PubMed]
- Puthenveetil, S.C.; Daphalapurkar, C.P.; Zhu, W.; Leu, M.C.; Liu, X.F.; Gilpin-Mcminn, J.K.; Snodgrass, S.D. Computer-automated ergonomic analysis based on motion capture and assembly simulation. Virtual Real. 2015, 19, 119–128. [Google Scholar] [CrossRef]
- Faccio, M.; Gamber, M.; Piana, F.; Pilati, F. Motion analysis system for the ergonomic assessment of manufacturing and assembly manual activities. In Proceedings of the Proceedings of XXII Summer School “Francesco Turco”, Palermo, Italy, 13–15 September 2017. [Google Scholar]
- Lawson, G.; Salanitri, D.; Waterfield, B. Future directions for the development of virtual reality within an automotive manufacturer. Appl. Ergon. 2016, 53, 323–330. [Google Scholar] [CrossRef]
- Grajewski, D.; Górski, F.; Hamrol, A.; Zawadzki, P. Immersive and Haptic Educational Simulations of Assembly Workplace Conditions. Procedia Comput. Sci. 2015, 75, 359–368. [Google Scholar] [CrossRef] [Green Version]
- Grajewski, D.; Górski, F.; Zawadzki, P.; Hamrol, A. Application of Virtual Reality Techniques in Design of Ergonomic Manufacturing Workplaces. Procedia Comput. Sci. 2013, 25, 289–301. [Google Scholar] [CrossRef] [Green Version]
- Gavish, N.; Gutiérrez, T.; Webel, S.; Rodríguez, J.; Peveri, M.; Bockholt, U.; Tecchia, F. Evaluating virtual reality and augmented reality training for industrial maintenance and assembly tasks. Interact. Learn. Environ. 2015, 23, 778–798. [Google Scholar] [CrossRef]
- Caputo, F.; Greco, A.; D‘Amato, E.; Notaro, I.; Spada, S. A Preventive Ergonomic Approach Based on Virtual and Immersive Reality; Springer: Berlin, Germany, 2018; pp. 3–15. [Google Scholar]
- Vosniakos, G.-C.; Deville, J.; Matsas, E. On Immersive Virtual Environments for Assessing Human-driven Assembly of Large Mechanical Parts. Procedia Manuf. 2017, 11, 1263–1270. [Google Scholar] [CrossRef]
- Peruzzini, M.; Pellicciari, M.; Gadaleta, M. A comparative study on computer-integrated set-ups to design human-centred manufacturing systems. Robot. Comput. Integr. Manuf. 2019, 55, 265–278. [Google Scholar] [CrossRef]
- Battini, D.; Calzavara, M.; Persona, A.; Sgarbossa, F.; Visentin, V.; Zennaro, I. Integrating mocap system and immersive reality for efficient human-centred workstation design. IFAC-PapersOnLine 2018, 51, 188–193. [Google Scholar]
- AiQ Synertial. Leading Motion Capture Technologies. Available online: https://www.synertial.com/ (accessed on 7 March 2020).


| Pattern of Procedures | Input Data | Output Data | ||
|---|---|---|---|---|
| Department Level | Machine Level | Workstation Level | ||
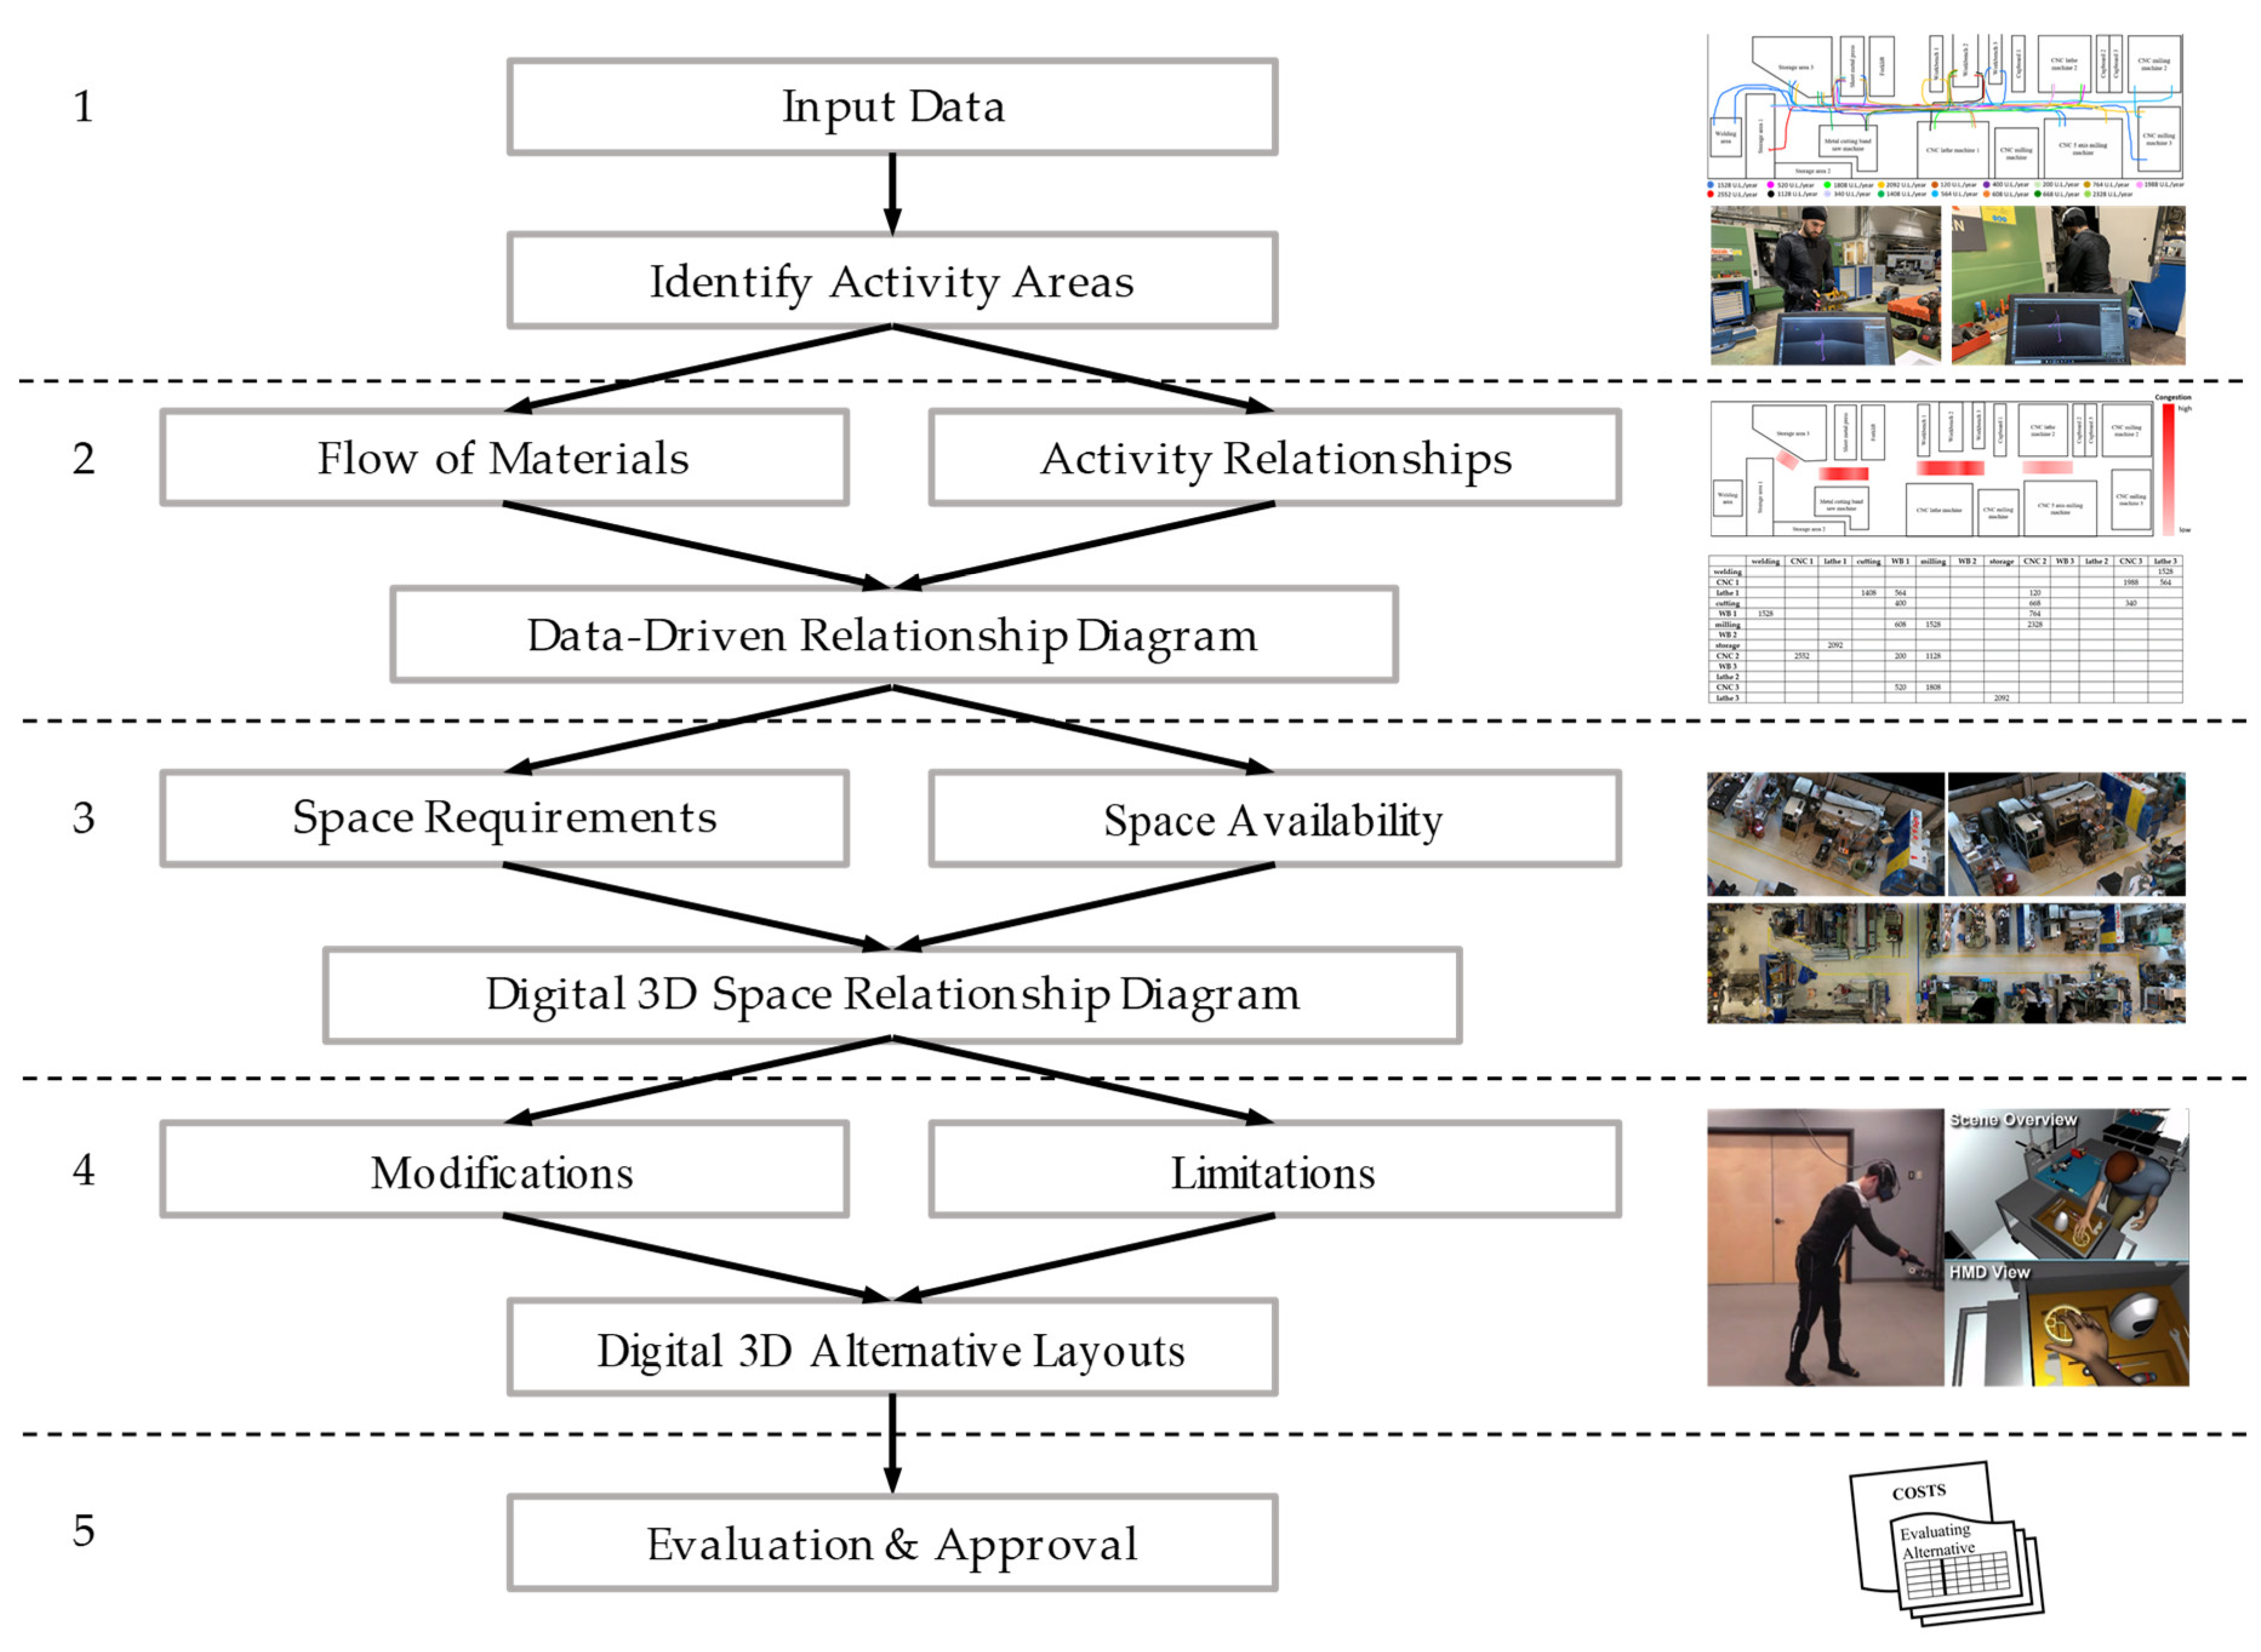
| 1. Activities: PQRST Analysis | - P-Q Data Sheet - Routing data - Service requirements | - Operation process chart - Flow process chart - Multi-product process chart | - Bill of materials - Precedence Diagram - Operation process chart | List of Activity Areas |
| 2. Relationships: Flow of Materials and Activity Relationships | - Operation Process Chart - Multi-product Process Chart - From-To Chart - Relationship Survey | - Line-feeding flow chart | - Precedence Diagram | Relationship Diagram |
| 3. Space: Space Requirements and Availability | - Survey of current space assigned - Machinery and Equipment Area and Features Sheet - Office Layout Requirements Data Space Requirements Converting form | - Machinery and Equipment Area and Features Sheet - Office Layout Requirements Data | - Components and Tools Area | Space Relationship Diagram |
| 4. Adjustment: Modifications and Limitations | - Scaled and grid-lined templates of activity areas | - Scaled equipment templates - Models and renderings - Elevation drawings | - CAD prototype - Physical mock-up | Alternative Layouts |
| 5. Evaluation | - Layout comparison based on cost, space, flow, handling, use of equipment and others | - Layout comparison based on cost, space, flow, handling, use of equipment and others | - Layout comparison based on cost, space, flow, handling, use of equipment and others | Selected Layout |
| Pattern of Procedures | Department Level | Machine Level | Workstation Level | Form of Output |
|---|---|---|---|---|
| 1. Activities | IPS: - Real-time information about Route and Quantity of the products | IPS: - Fast, easy and detailed Operation process chart - Real-time Flow process chart - Real-time Line balance | MoCap and IR / IPS: - Fast, easy and detailed Operation process chart | List of Activity Areas |
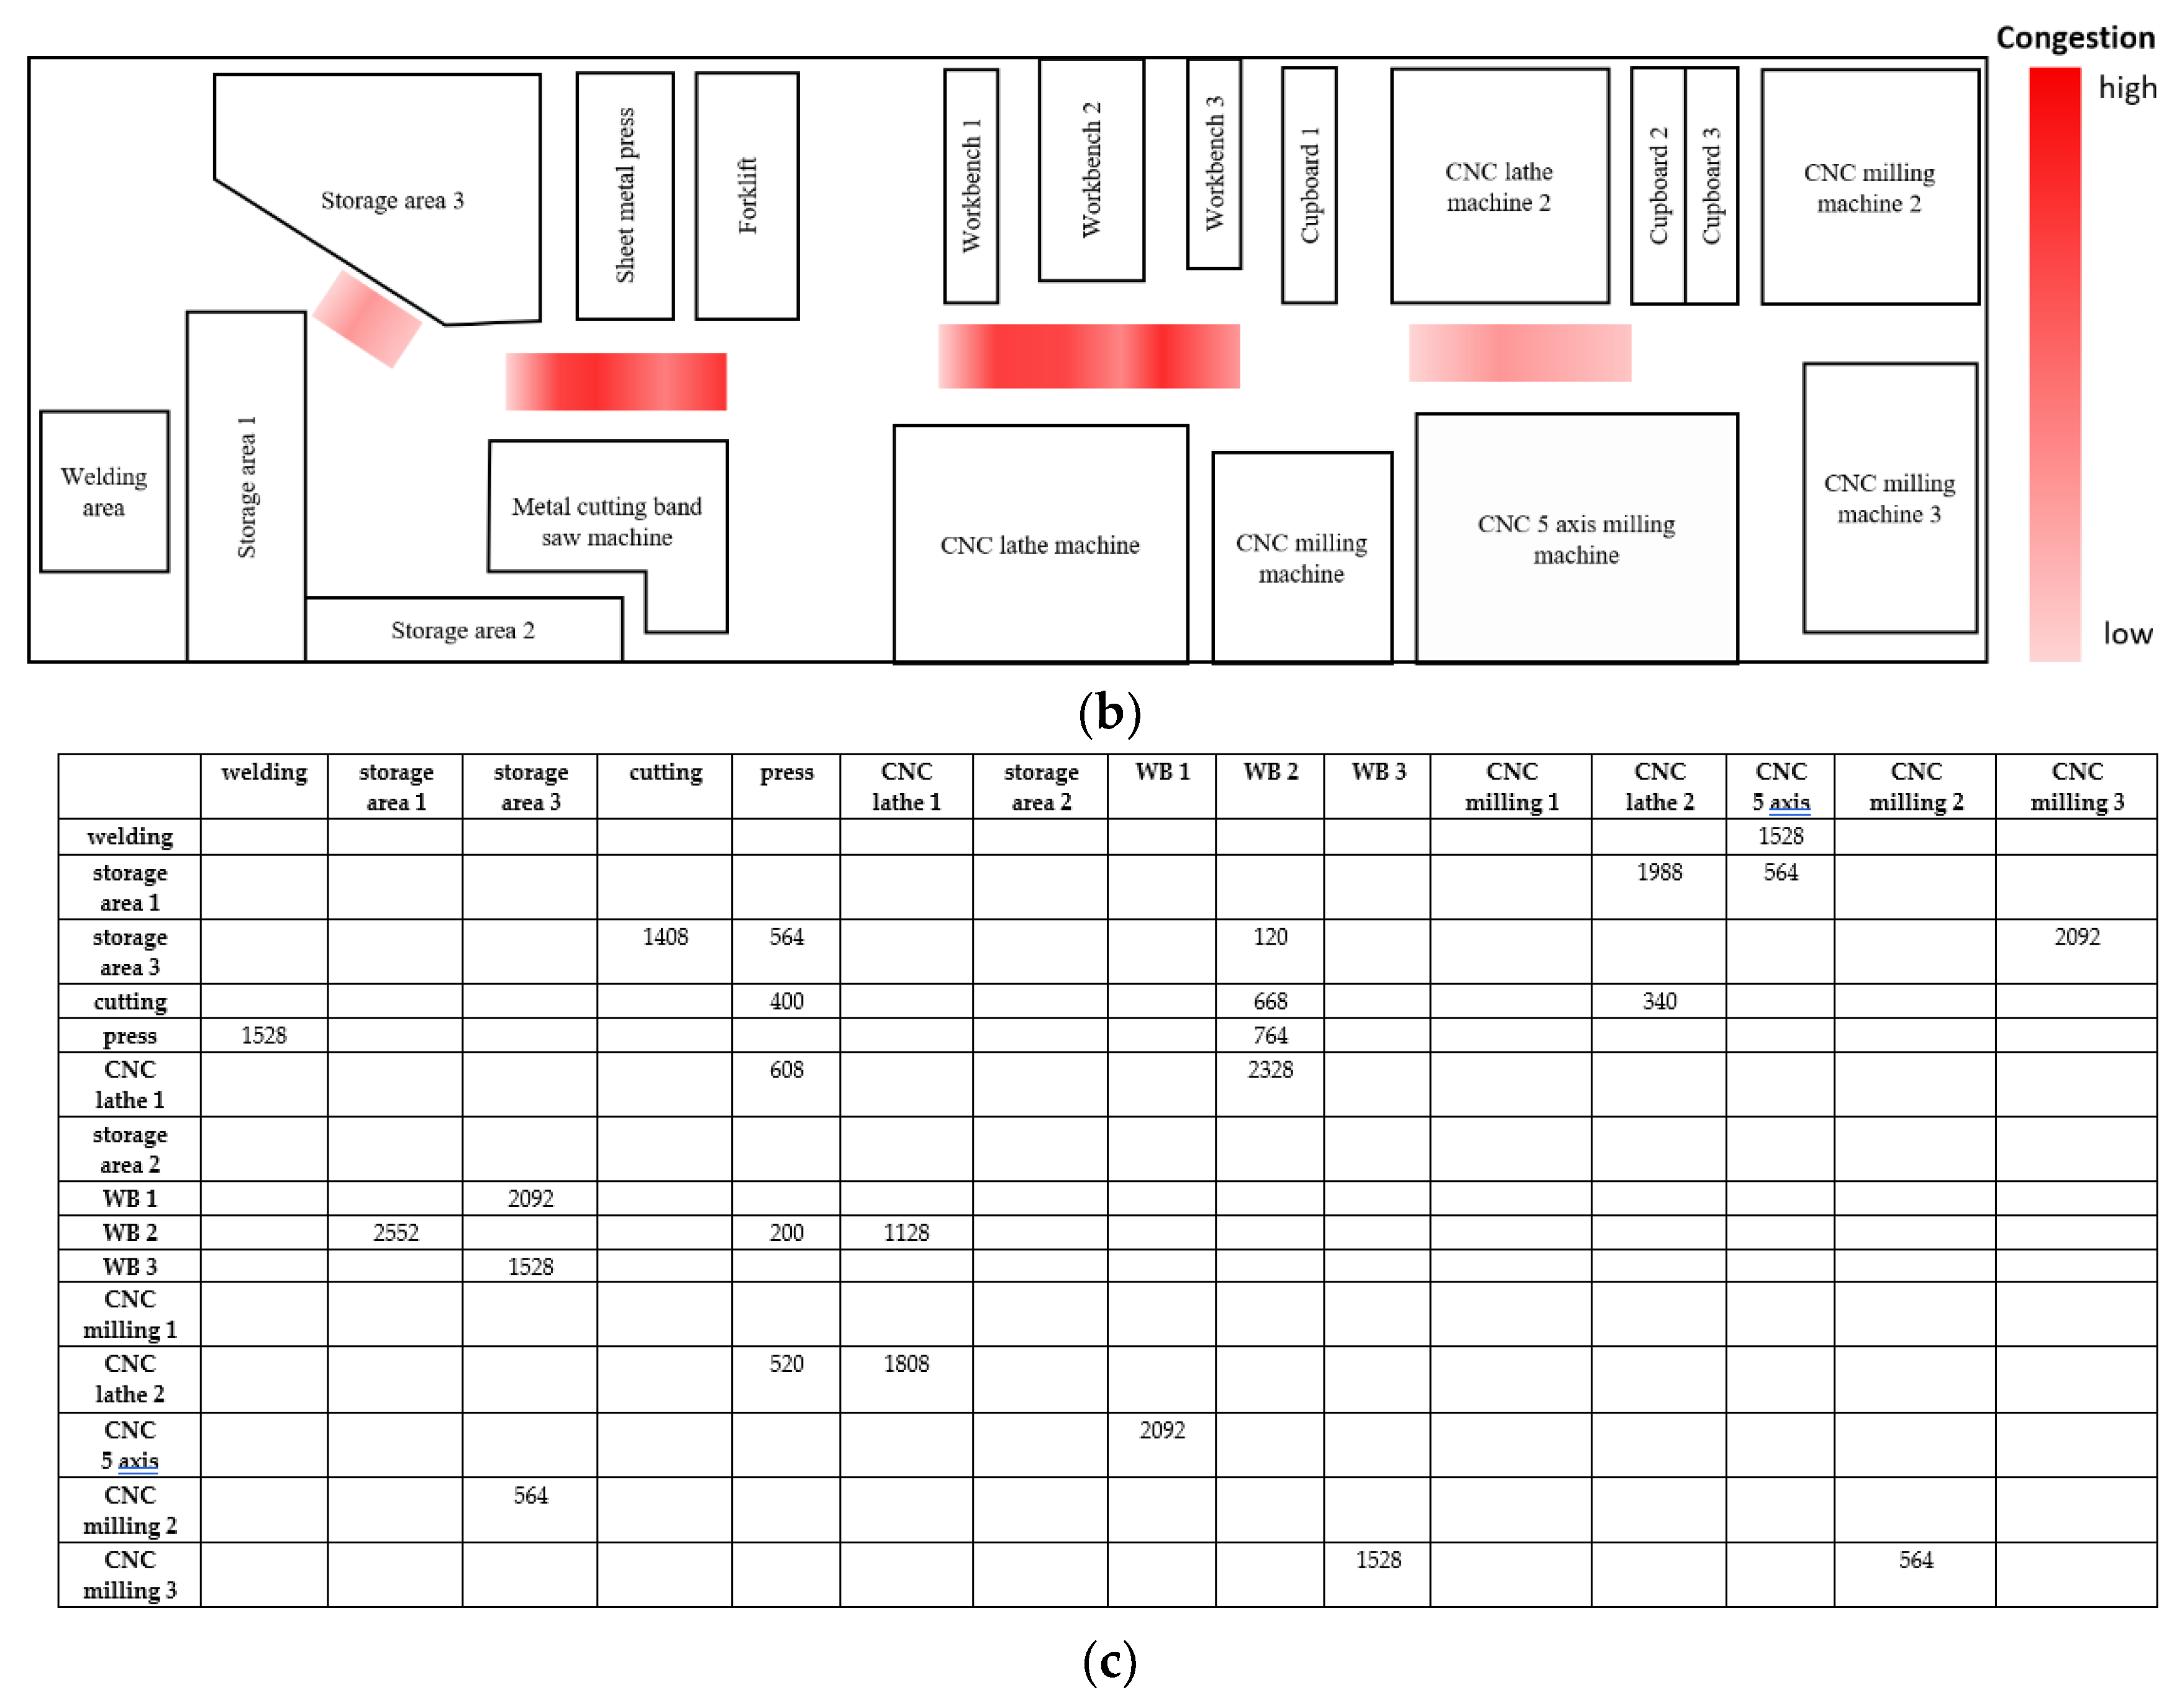
| 2. Relationships | IPS: - Fast, easy and detailed Operation Process Chart and From-To Chart - Congestion phenomena evaluation | IPS: - Fast, easy and detailed Relationship Chart - Congestion phenomena evaluation | IPS: - Fast, easy and detailed Spaghetti Chart | Data-Driven Relationship Diagram |
| 3. Space | 3D mapping: -Fast, easy and detailed Activity Areas and Features Sheet - Fast, easy and detailed Survey of current space assigned - Connection/relations between different Areas | 3D mapping: - Fast, easy and detailed Activity Areas and Features Sheet - Fast, easy and detailed Survey of machine’s position - Connection/relations between different Areas - Position of movable equipment | 3D mapping:- Fast, easy and detailed collection of space info about existing workstation to build 3D model for virtual mock-up | Digital 3D Space Relationship Diagram |
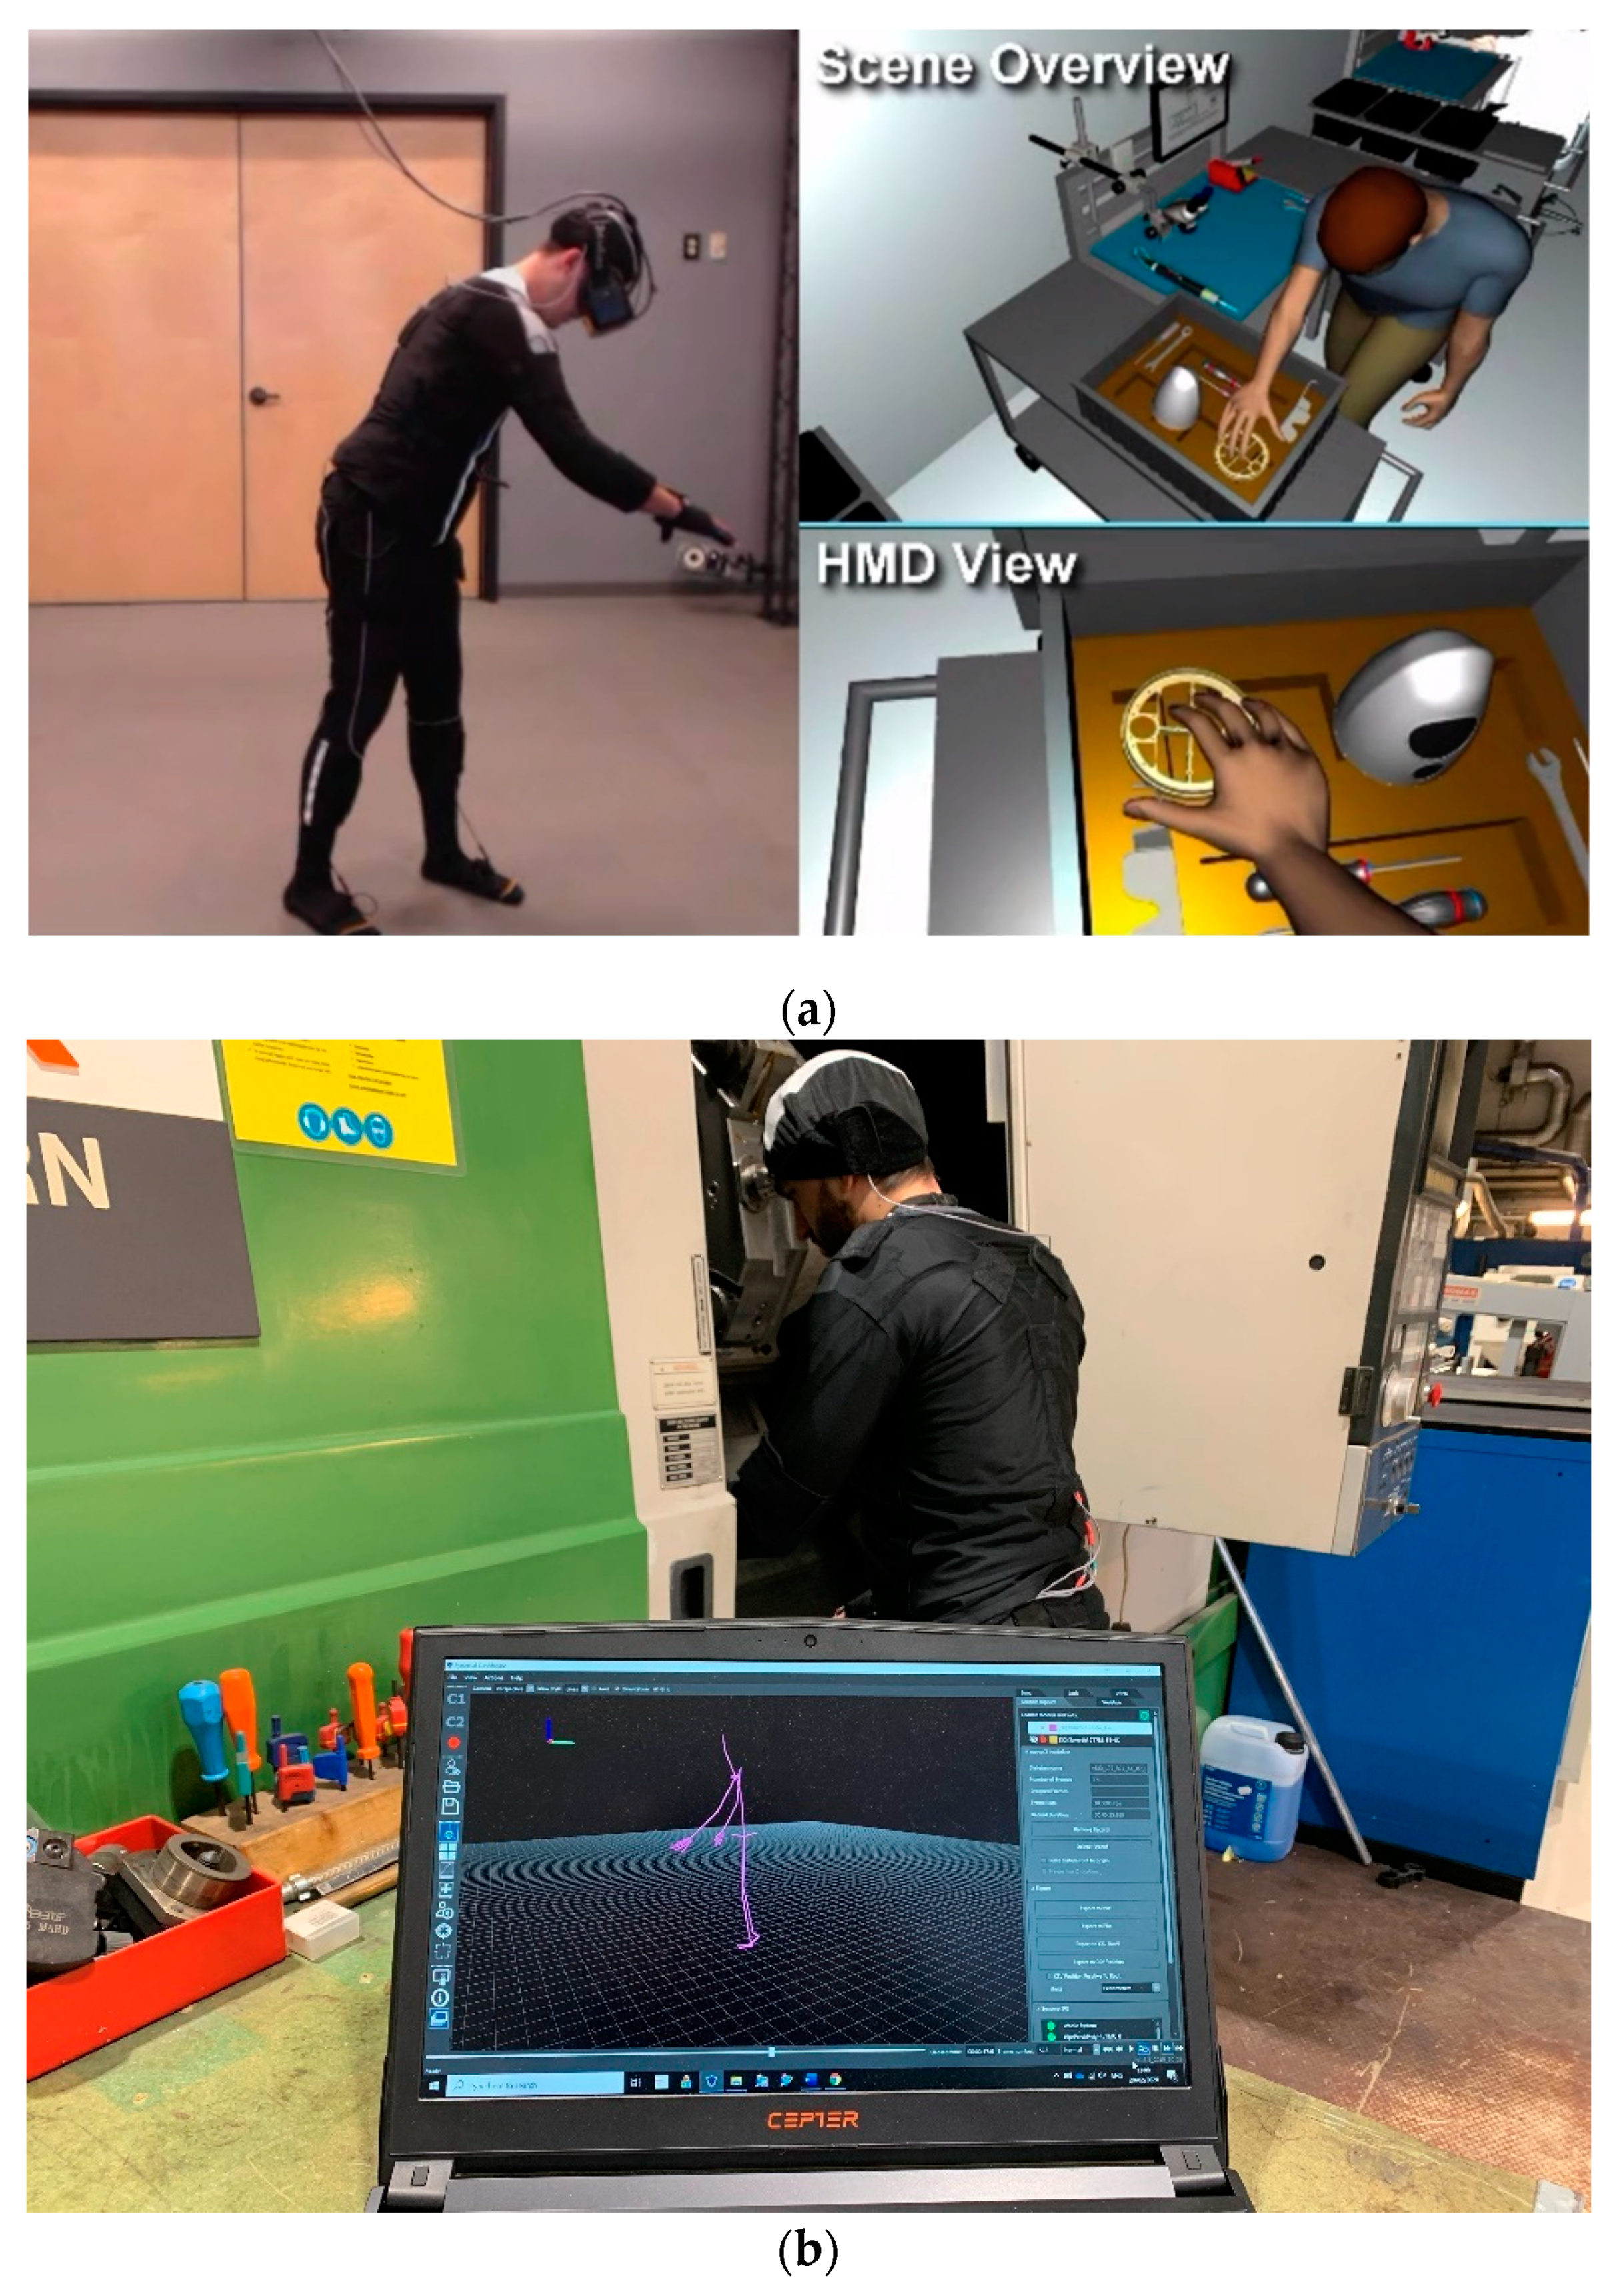
| 4. Adjustment | 3D mapping: - Fast, easy and detailed image of Block Layout | 3D mapping: - Fast, easy and detailed Layout image - Models and renderings | MoCap and IR: Detailed Workstation Simulations: - Virtual prototype - Virtual mock-up - Real-time ergonomic evaluations | Digital 3D Alternative Layouts |
| 5. Evaluation | - | - | - | Selected Layouts |
| Economic Pillar | Social Pillar | Environmental Pillar |
|---|---|---|
| - Saved time and costs in all the design procedures - Reduced uncertainty and costly errors due to wrong design solution (no need to change afterwards) - Increased understanding and better decision-making | - Better ergonomics, less fatigue - Adaptable workstations also for older workforce - More added value activities for the designers of layout, they do not need to spend time in collecting info and they increase their knowledge about the systems they are designing | - Use of the space efficient and so less building of new facilities - More compact means better use of space, less transportation activities - Optimal adaptable layout in case of reconfigurable systems |
© 2020 by the authors. Licensee MDPI, Basel, Switzerland. This article is an open access article distributed under the terms and conditions of the Creative Commons Attribution (CC BY) license (http://creativecommons.org/licenses/by/4.0/).
Share and Cite
Peron, M.; Fragapane, G.; Sgarbossa, F.; Kay, M. Digital Facility Layout Planning. Sustainability 2020, 12, 3349. https://doi.org/10.3390/su12083349
Peron M, Fragapane G, Sgarbossa F, Kay M. Digital Facility Layout Planning. Sustainability. 2020; 12(8):3349. https://doi.org/10.3390/su12083349
Chicago/Turabian StylePeron, Mirco, Giuseppe Fragapane, Fabio Sgarbossa, and Michael Kay. 2020. "Digital Facility Layout Planning" Sustainability 12, no. 8: 3349. https://doi.org/10.3390/su12083349