In this section, we report the results of various realistic numerical experiments conducted in different scenarios of analysis to demonstrate the profit and sustainability of our proposed approach. Since the main goal of this work is to propose a novel scheduling of material handling activities in labor-intensive warehouses from a proof-of-concept perspective, the conducted numerical experiments aim at showing the potentiality of the proposed optimization strategy in terms of effectiveness and efficiency in reducing the total makespan and energy cost under several scenarios. Indeed, we investigate the effects of various factors (i.e., varying the number of jobs, the number of forklifts, and the number of charging stations) in the scheduling of material handling activities.
4.1. Setup of Experiments
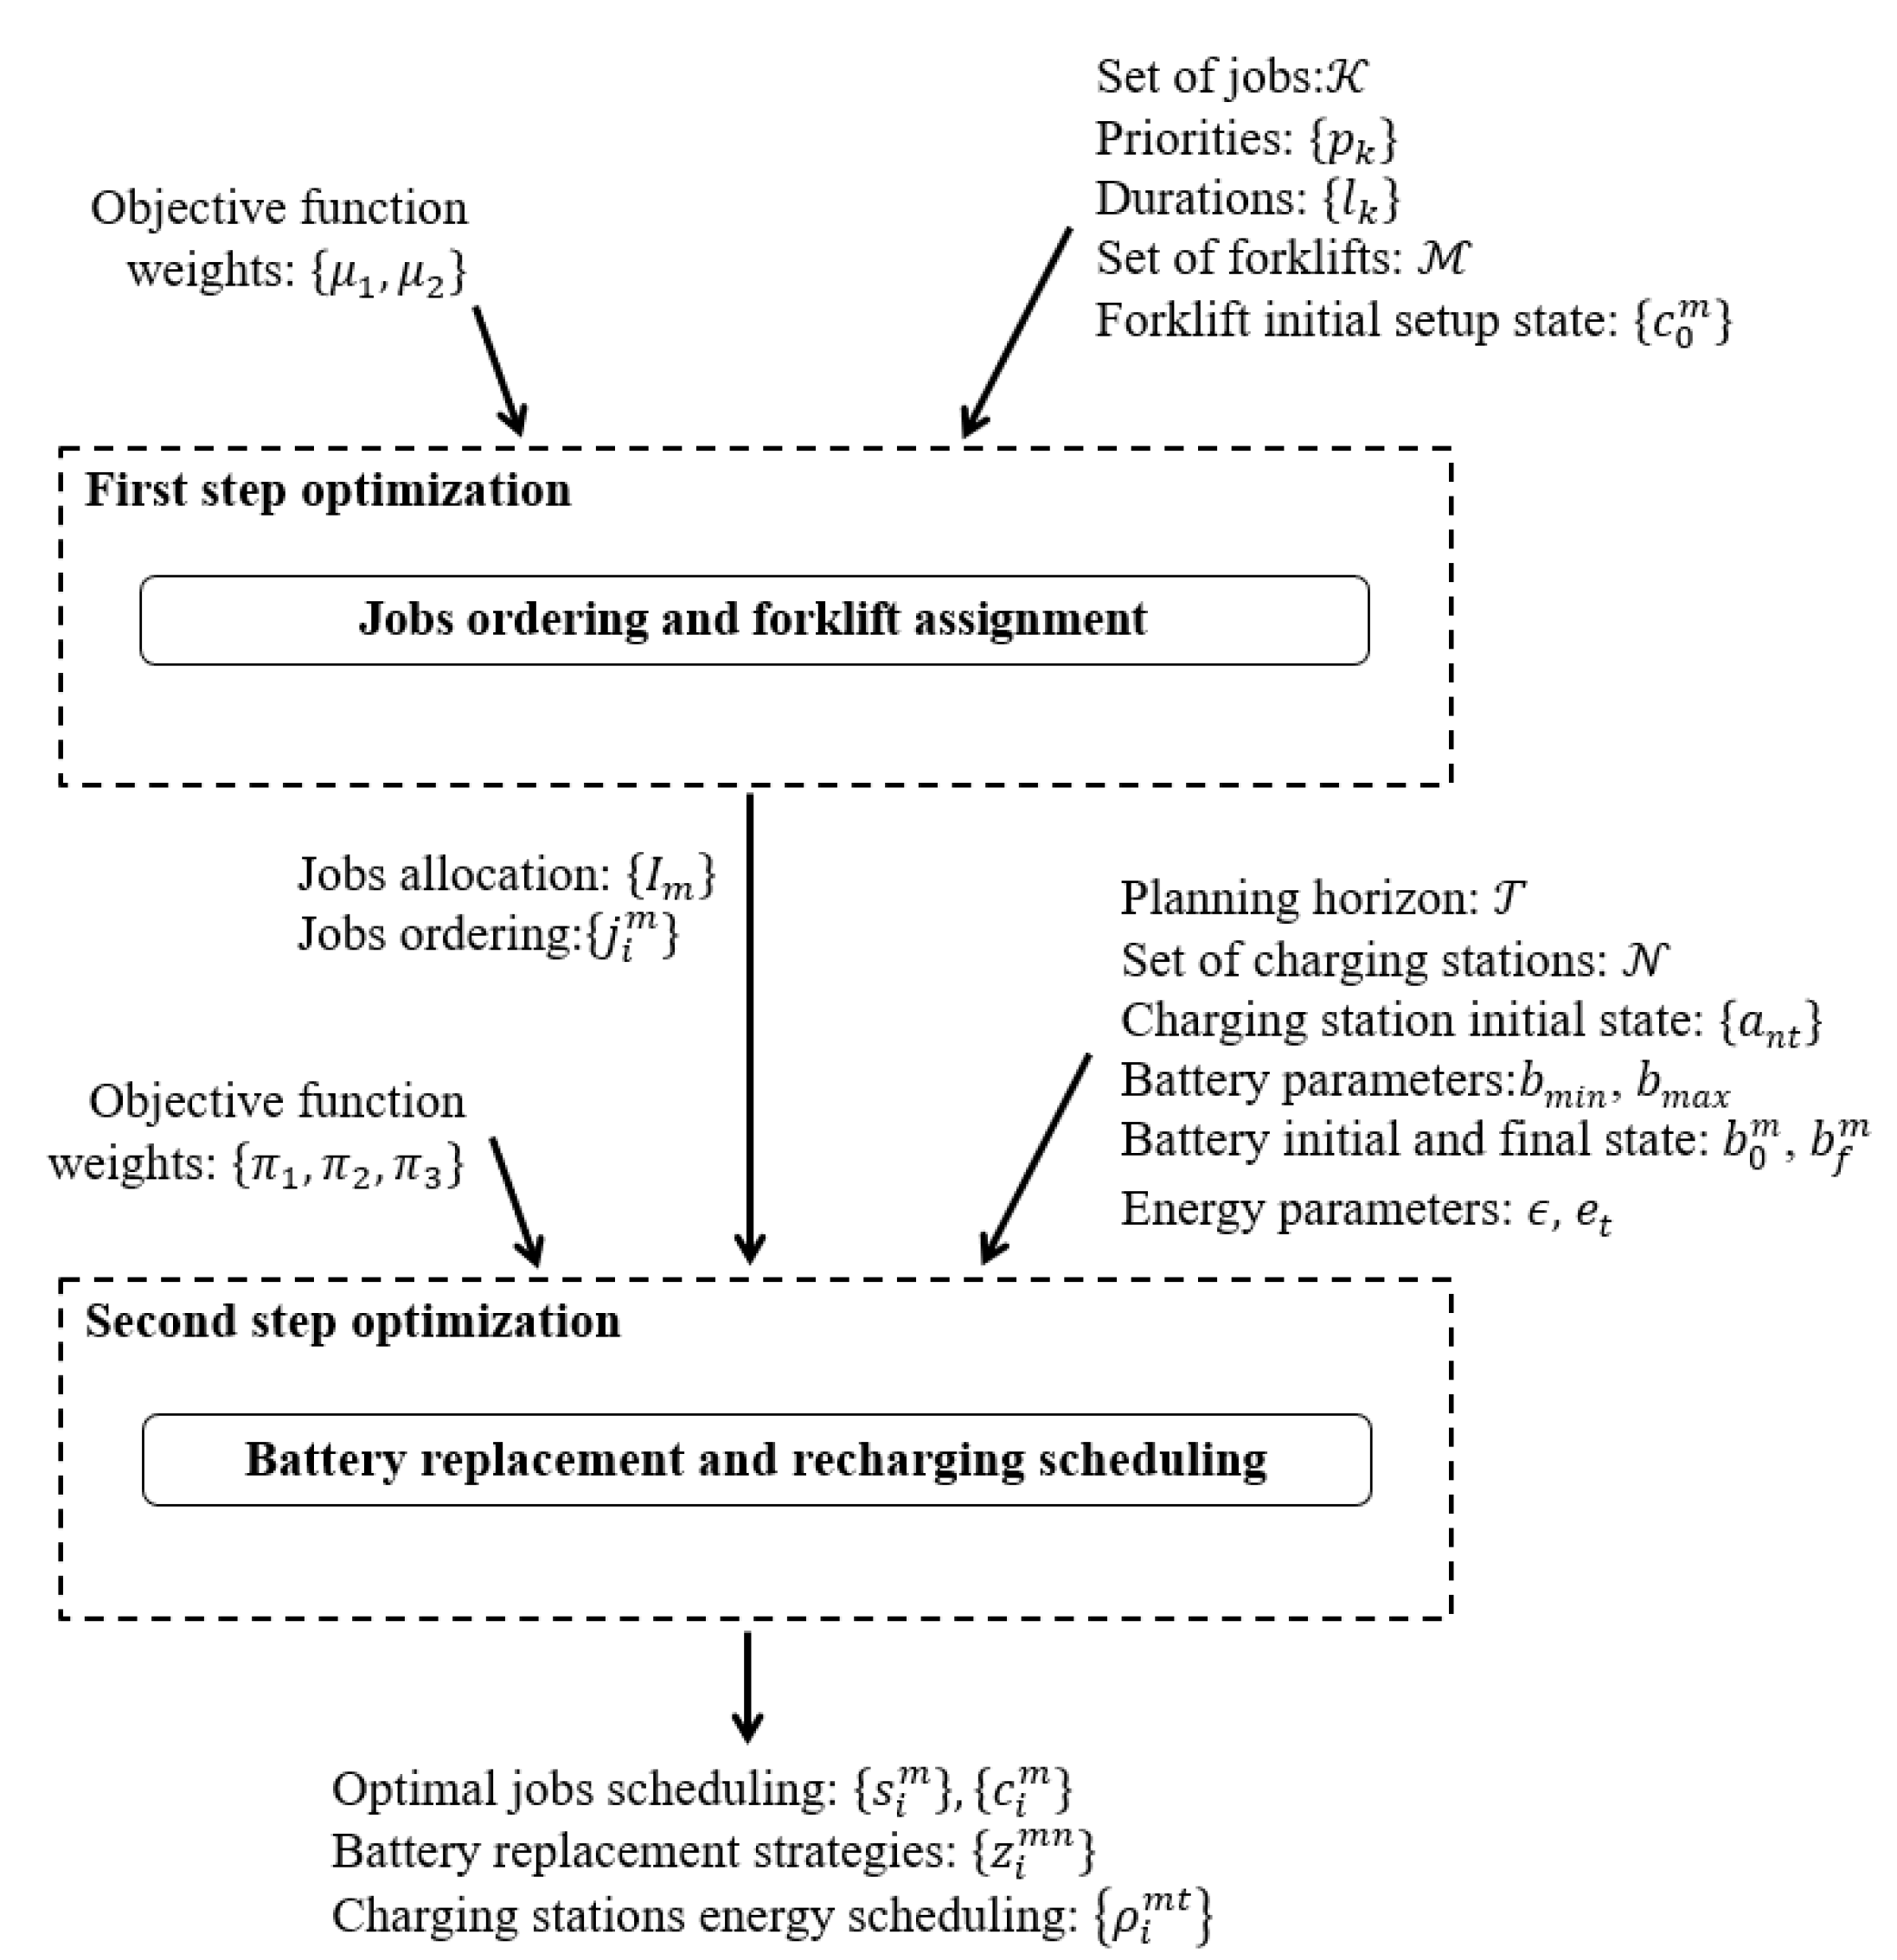
We consider a warehouse where electric forklifts have to handle independent jobs while recharging their own batteries using charging stations. The planning horizon is composed by time slots. We address the following three scenarios of analysis:
Scenario I: We analyze in detail the optimal job scheduling, battery replacement strategies, and charging station energy scheduling when jobs are handled using forklifts and charging stations under two different model set-ups:
Case I.a: With energy scheduling, i.e., 1/2 and 1/3;
Case I.b: Without energy scheduling, i.e., and 0.
Scenario II: We compare the optimal job scheduling, battery replacement strategies, and charging station energy scheduling obtained in scenario I.a (i.e., jobs, forklifts and charging stations) with the results obtained under two different configurations:
Scenario III: We analyze how the results in terms of makespan, total completion time of recharging process, and energy cost are affected by variations in the number of jobs (changed in the range 15 ÷ 30), while varying the number of forklifts (changed in the range 2 ÷ 8), and the number of charging stations (changed in the range 2 ÷ 11).
Table 2 reports the parameters related to all of the jobs (i.e., identifier, priority, and processing duration in terms of time slots). Furthermore,
Table 3 reports the initial and final state conditions for forklifts (i.e., setup completion time, initial and final state of charge of the on-board battery normalized with respect to energy consumed per slot by the forklift) and the initial availability of a fully charged battery in charging stations. In particular, as indicated in
Table 3, we assume that, in each forklift, the battery is fully charged at the beginning of operations. In order to equally compare the energy cost of the schedules computed in different cases, we impose that the final conditions of on-board batteries are equal to the initial ones and the final number of available fully charged batteries is equal to the initial one. Consequently, we assume that, at the completion of the last handled job, each forklift takes on board a fully charged battery, allowing the charging station to totally charge the lastly unloaded batteries. Finally,
Table 4 reports the parameters related to the batteries (minimum and maximum allowed state of charge normalized with respect to energy consumed per slot by the forklift), the unitary penalty costs, and the weighting factors of the objective function terms used in the optimization model.
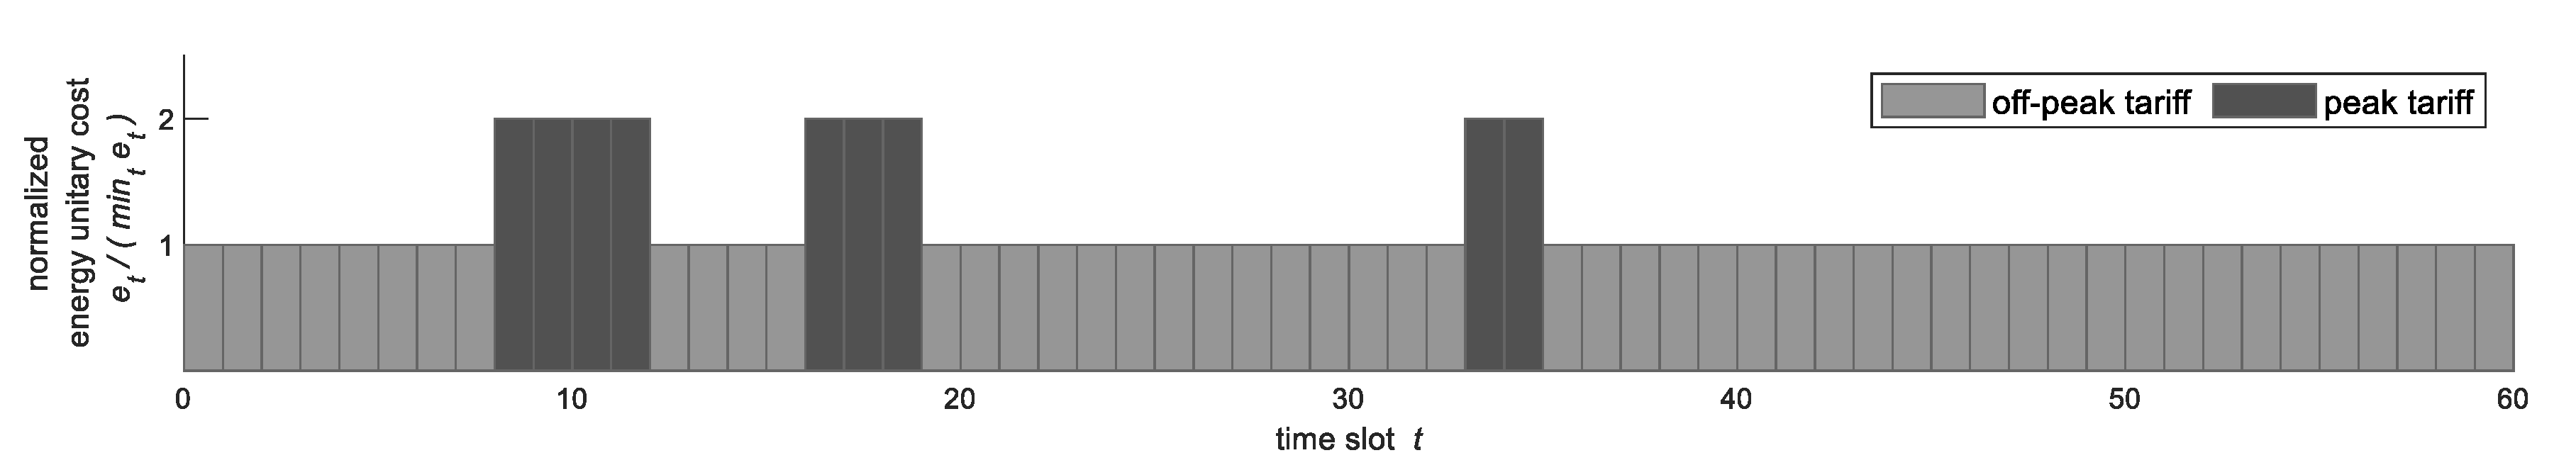
We further assume that the energy cost is time-dependent. In particular, we consider a time-of-use (TOU) pricing [
47], where two different tariffs are applied over the planning horizon divided into seven time frames. We assume that the on-peak electricity rate is two times the off-peak electricity rate.
Figure 6 shows in detail the unitary energy cost per slot, normalized with respect to the off-peak tariff.
Finally, we highlight that the proposed two-step optimization model was implemented and solved in the MATLAB environment integrated with the SCIP (Solving Constraint Integer Programs) tool [
48]. All of the presented computations were executed on a PC equipped with a 4.0 GHz Intel Core i7 CPU and 16 GB RAM. The computational runtime over all of the simulations ranged between 0.5 s to 50 min.
4.2. Results and Discussion
In particular,
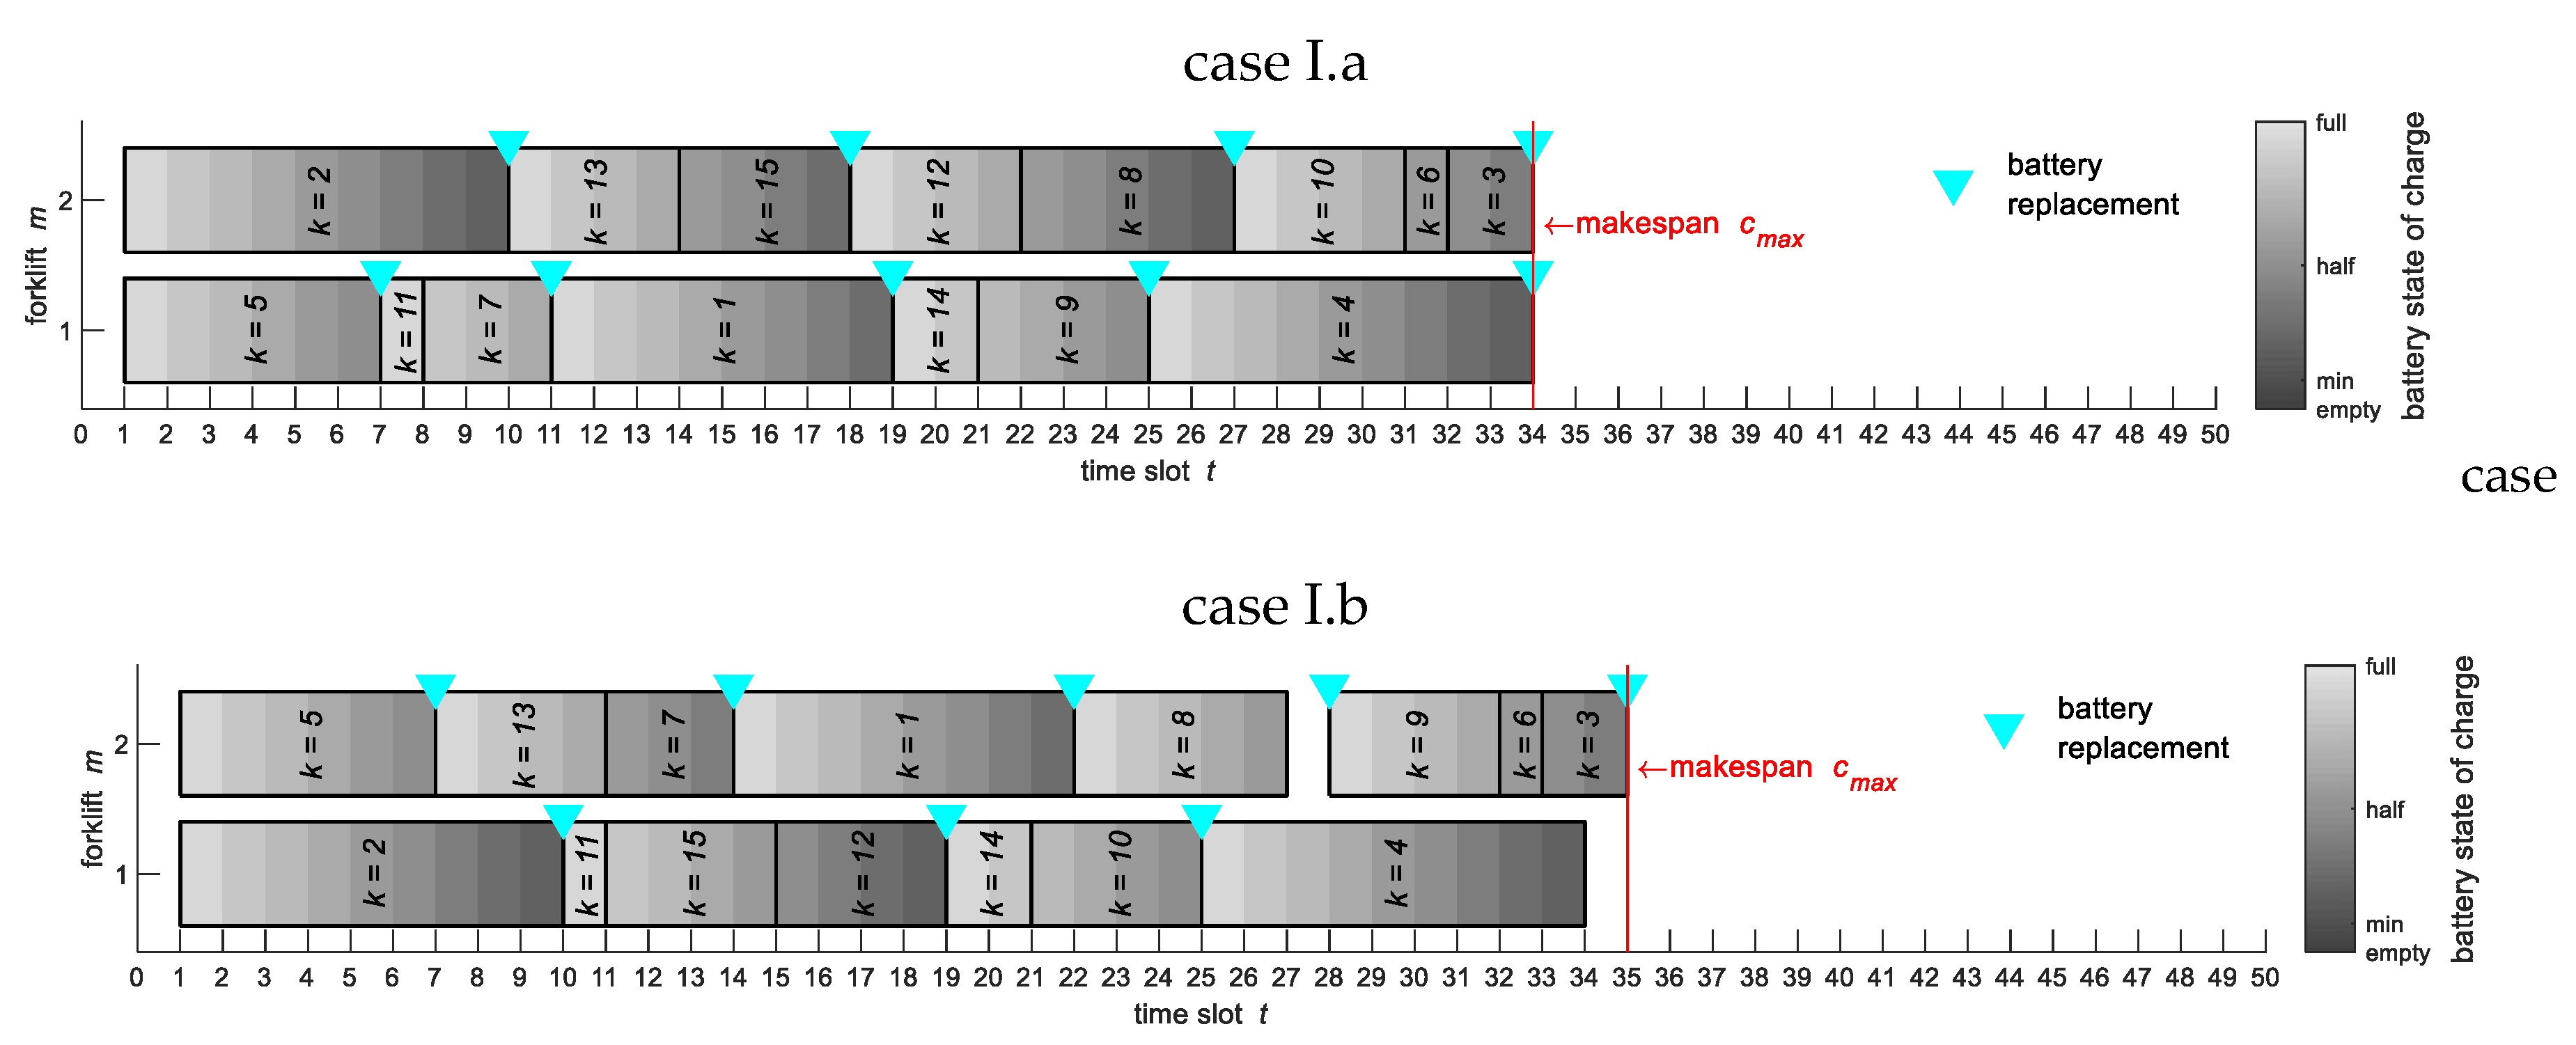
Figure 7a,b show the Gantt chart of handled jobs and, for each forklift, the discharging/replacement diagrams of batteries for both cases of analysis. It is apparent from
Figure 7a,b that jobs are handled in accordance with equal sequences, whilst the makespan is slightly different in cases I.a and I.b (as shown in the second row of
Table 5). We also highlight that forklifts generally replace batteries at different time slots.
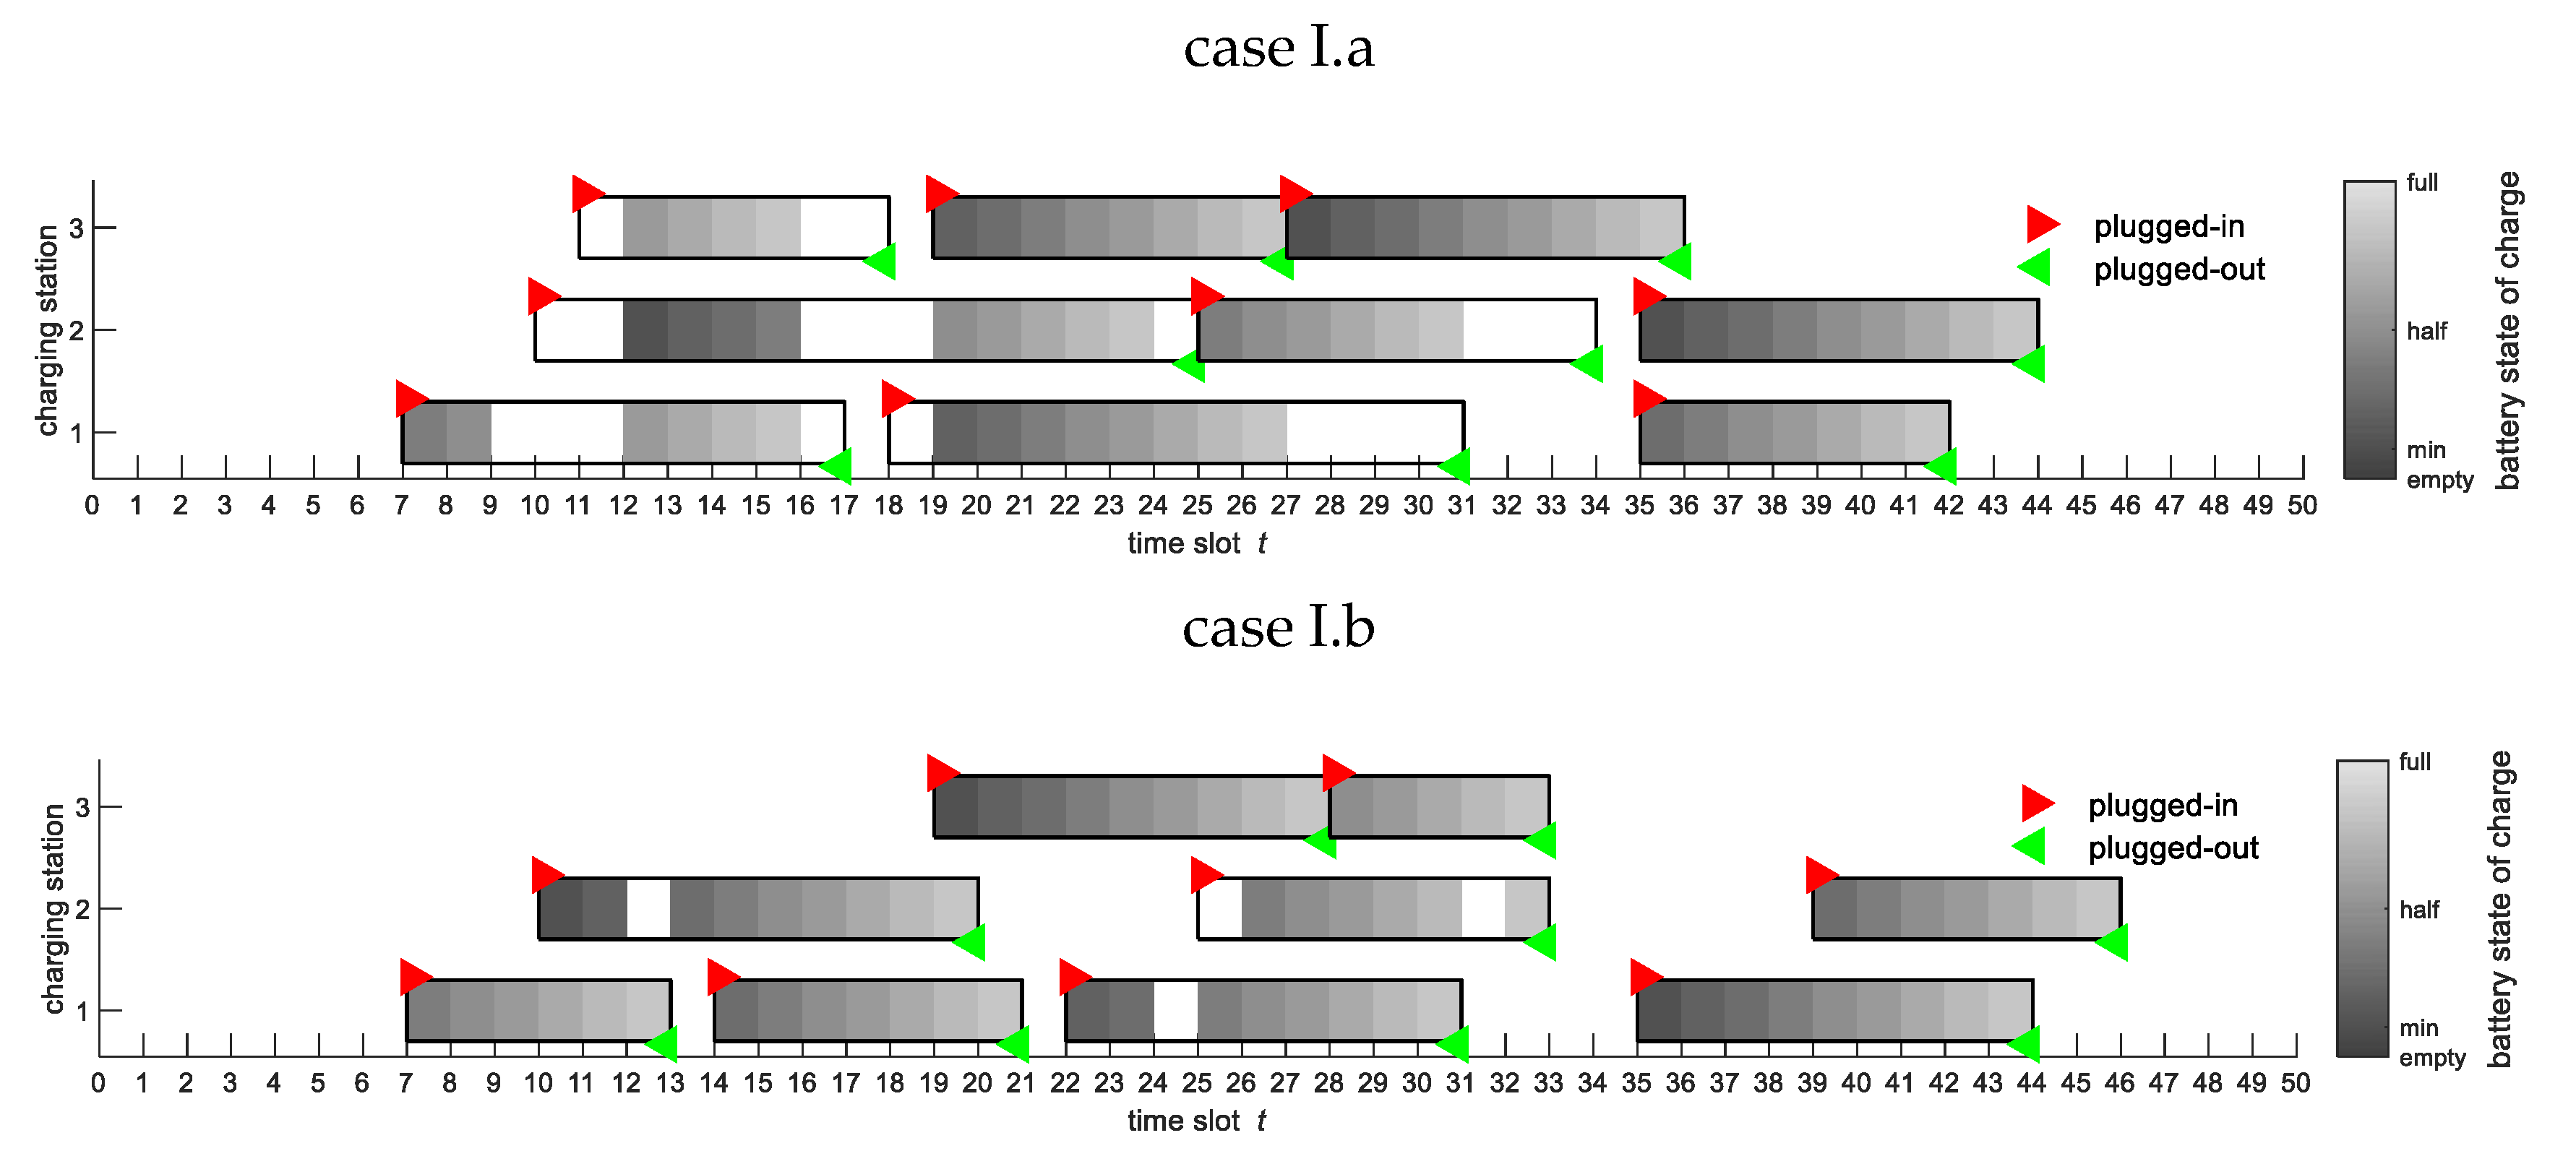
Figure 8a,b provide details about the schedules of the recharging operations for both cases of analysis. The charging process begins when the unloaded battery is plugged in the available charging station and ends when the battery is unplugged. From
Figure 8a, it is evident that, in case I.a, the charging station is not switched on over all of the plugged-in time slots. This allows charging stations to effectively acquire energy during low-cost time slots, resulting in a smart and energy-cost-saving-oriented scheduling. Conversely, from
Figure 8b it is evident that, in case I.b, the charging process is generally active while batteries are plugged in the charging stations. Moreover, we remark that, in both cases I.a and I.b, the last recharging cycle corresponds to the charging process of batteries used by forklifts to handle the last jobs of their operation sequences. This ensures that the final state of charge in each battery (both on-board batteries on forklifts and auxiliary batteries in the charging station) is equal to the initial one, resulting in an equal overall consumption of energy in both cases of analysis.
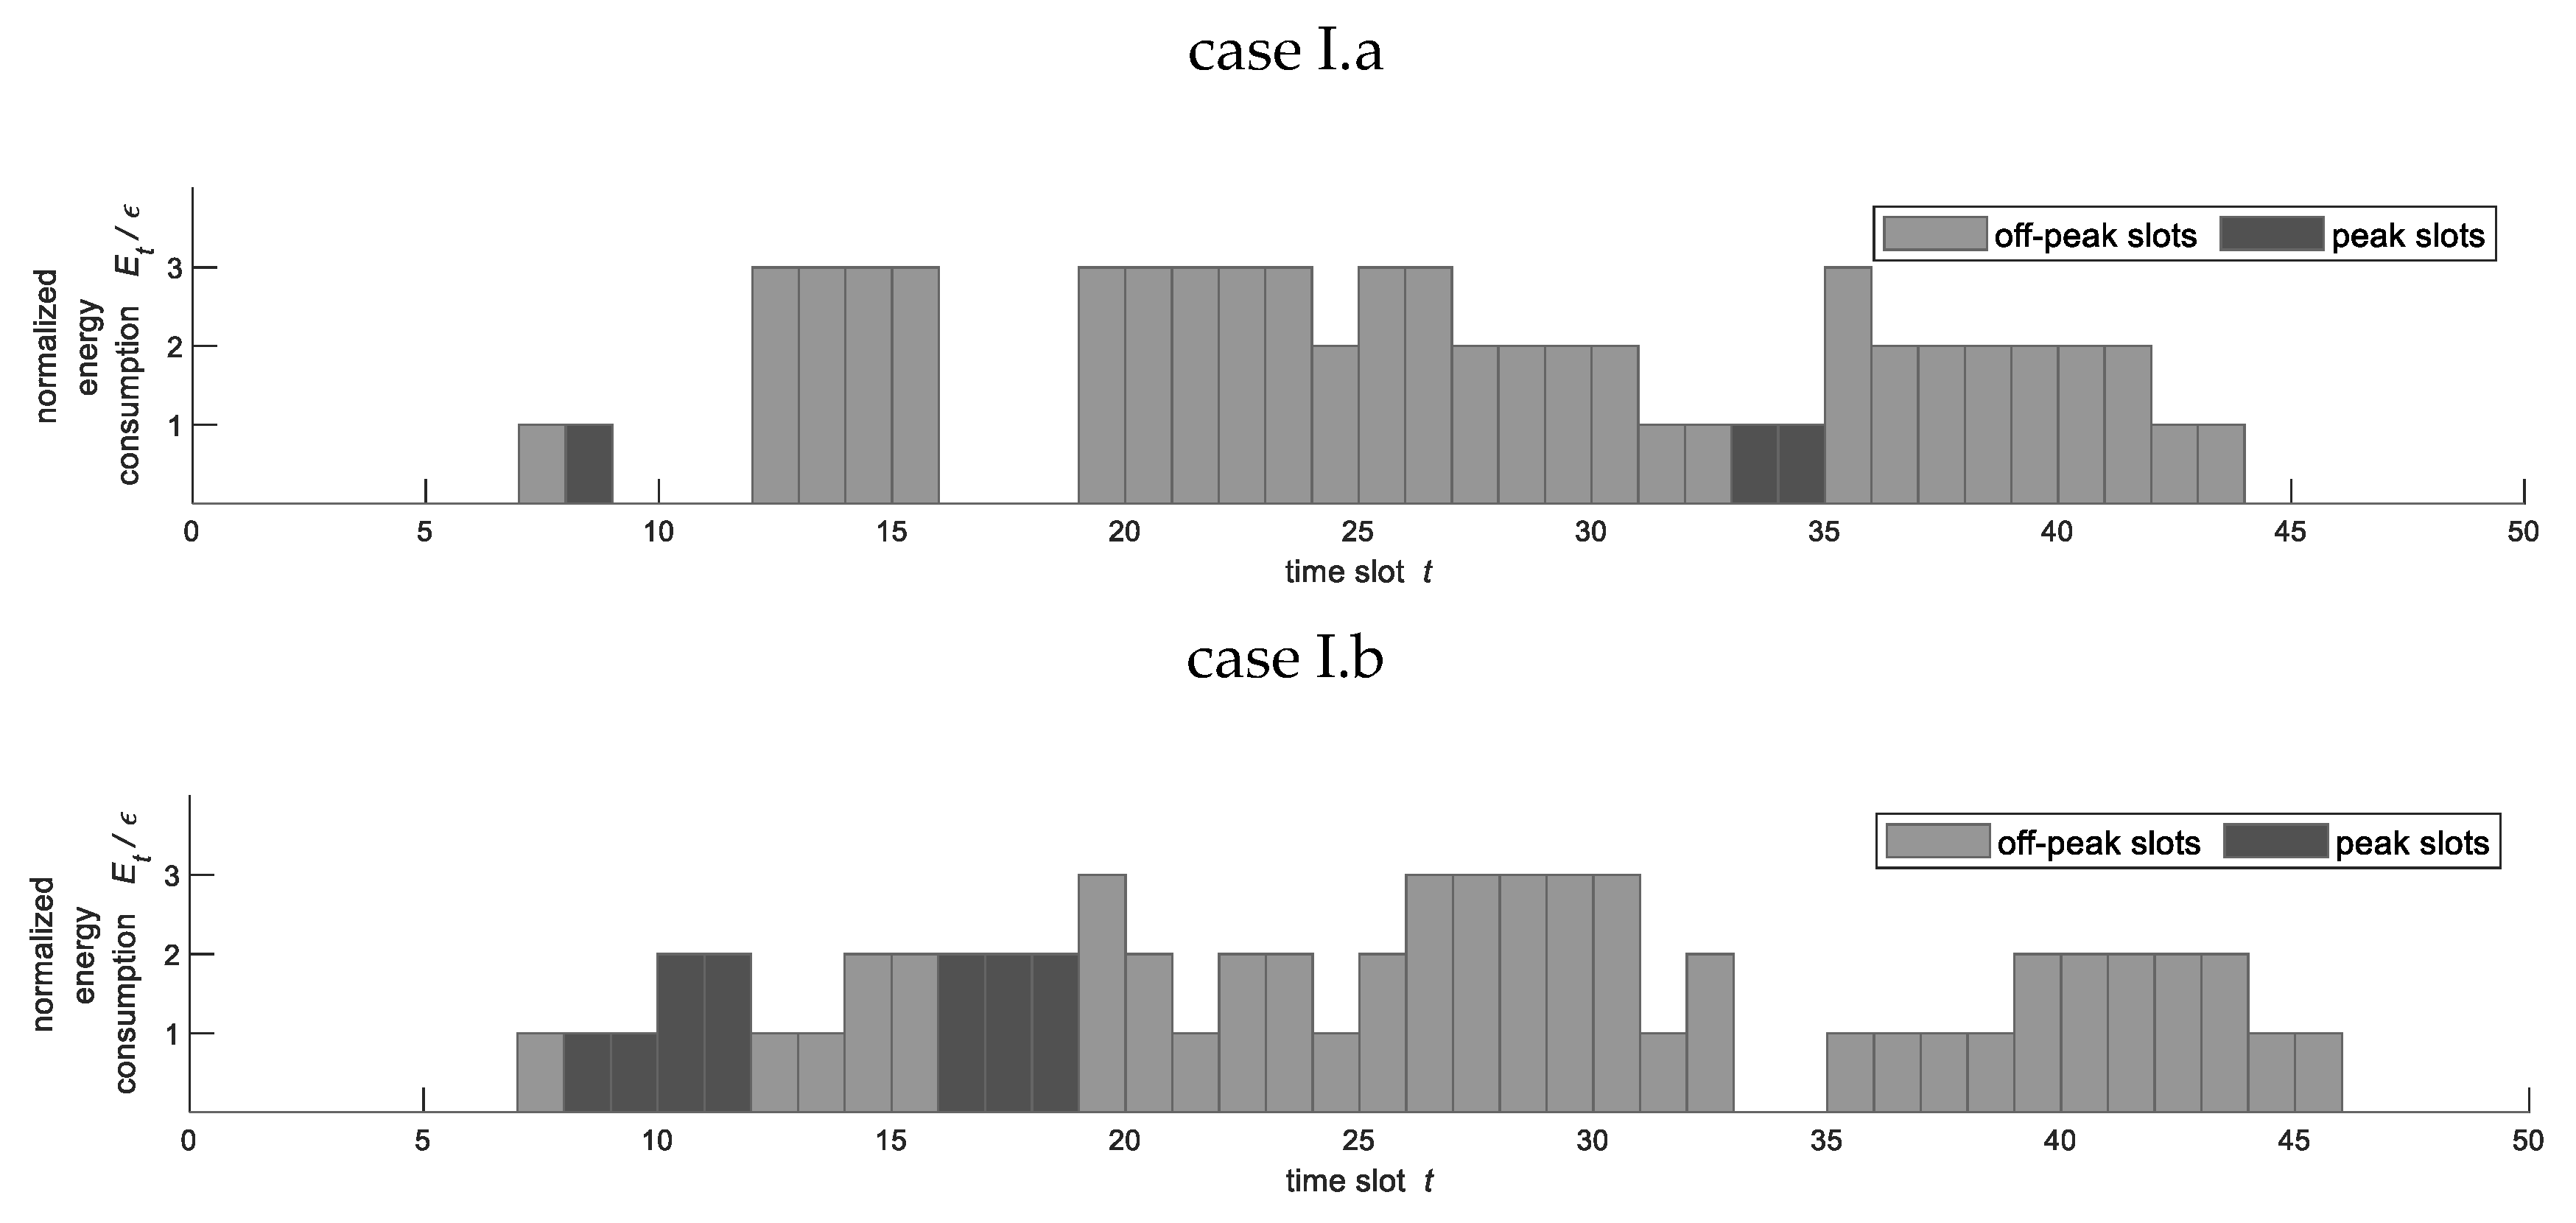
On the other hand, the profiles of the overall energy consumed over time by the charging stations are different in cases I.a and I.b, as highlighted in
Figure 9a,b. In particular, we note that the amount of energy acquired during on-peak time slots is greater in case I.b than in case I.a. As a result, the overall energy cost for the recharging operations is lower in case I.a than in case I.b (namely, 11.6%, as shown in the fourth row of
Table 5).
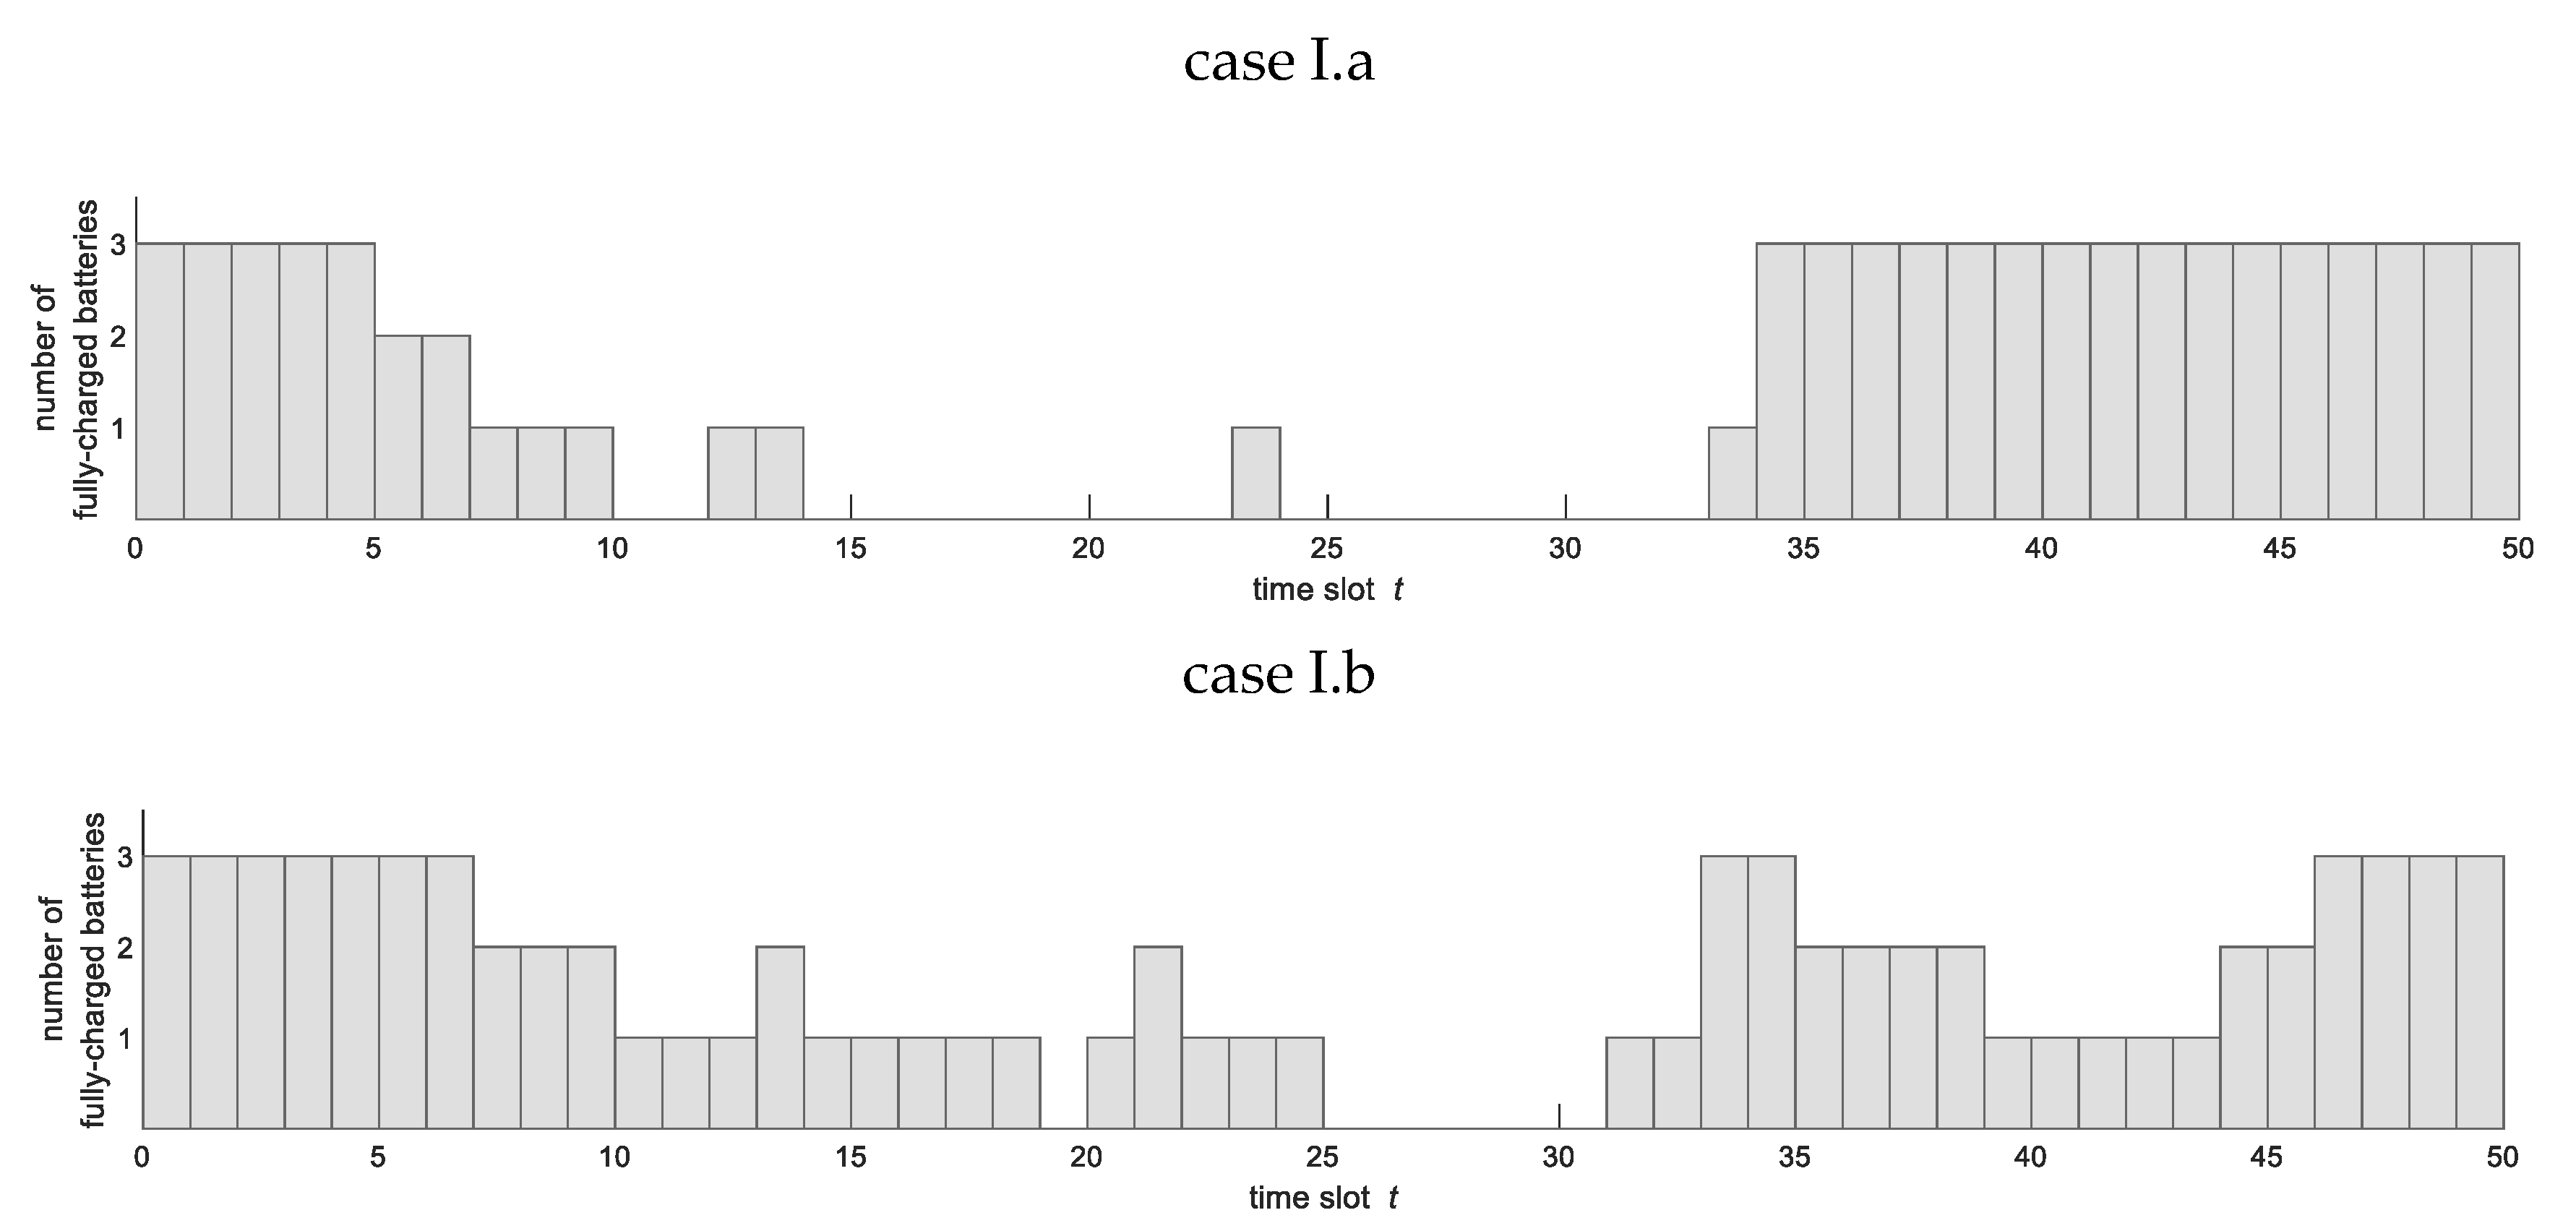
Finally,
Figure 10a,b show the number of available fully charged batteries over time slots for both cases of analysis. In both cases, the profiles are similar. In particular, at the beginning of the planning horizon (when the forklifts begin their operation with the initial fully charged batteries), such a number is kept at the highest level (i.e., equal to 3). In the middle (when the forklifts require recurrent battery replacements to finalize their operations), it achieves the lowest level (i.e., equal to 0). In the final portion of the planning horizon, the number of available fully charged batteries returns to be at the highest level. However, such a return is reached sooner in case I.b than in case I.a (as shown in the third row of
Table 5).
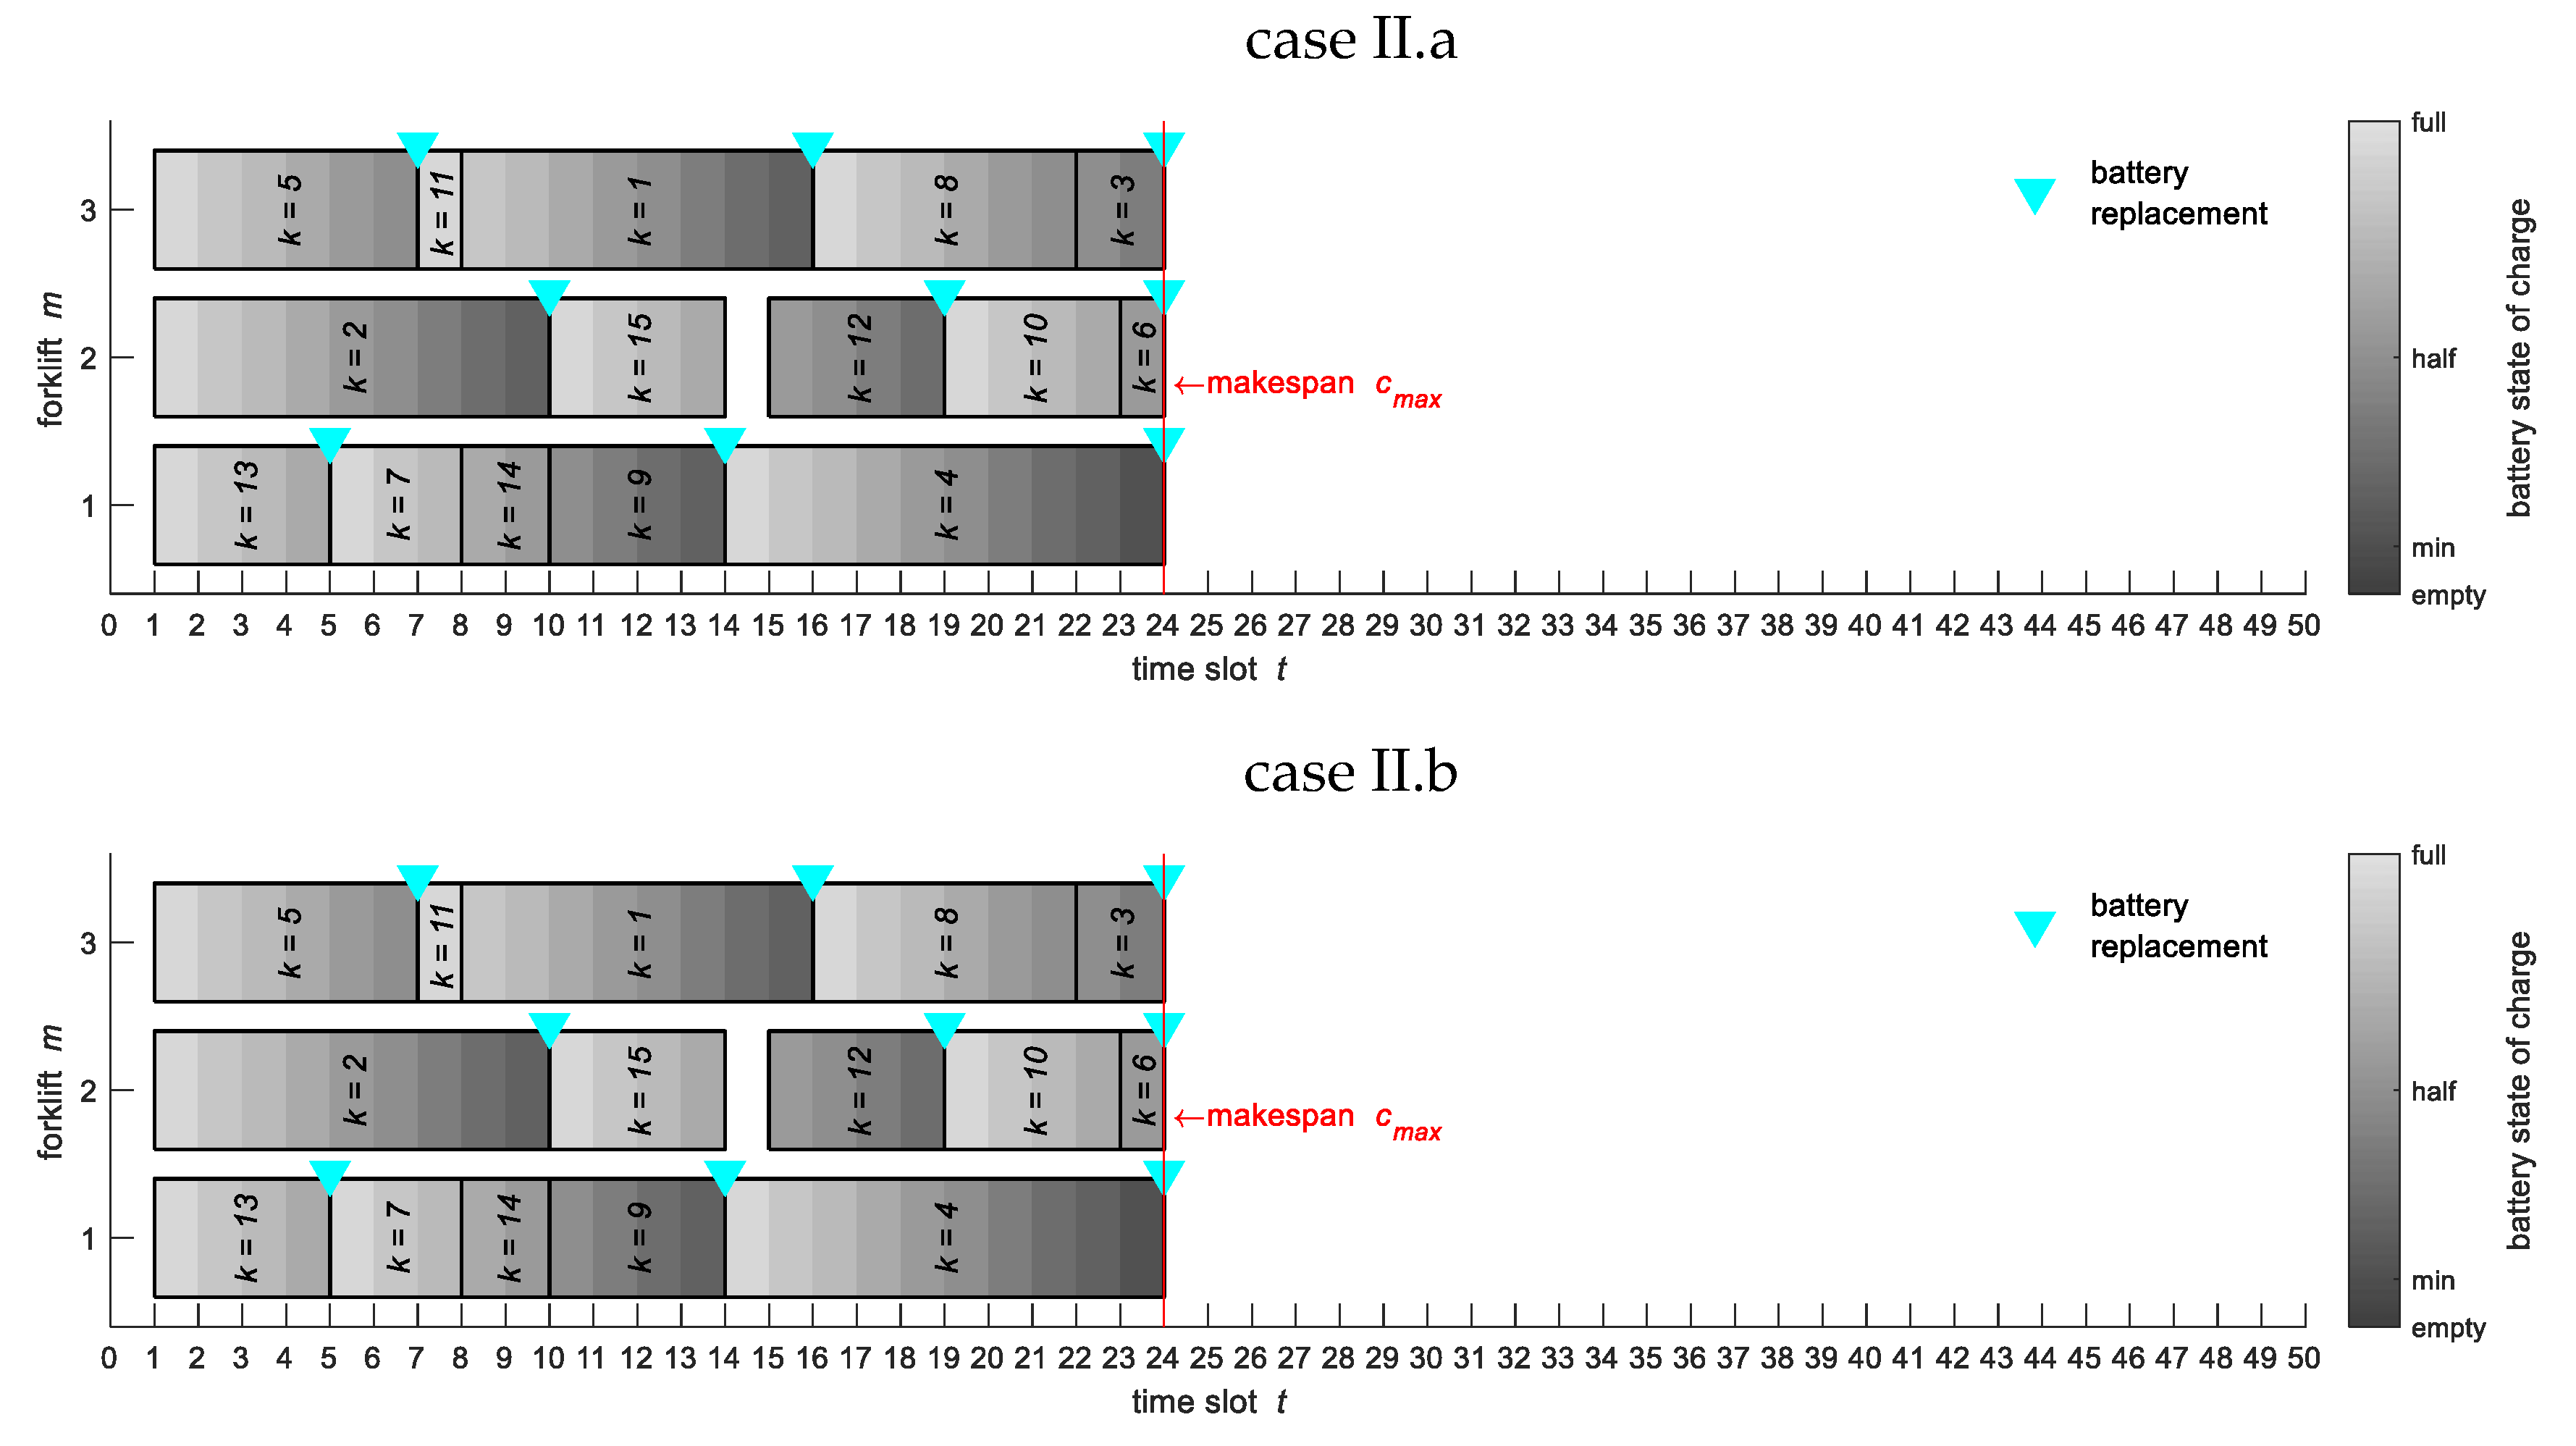
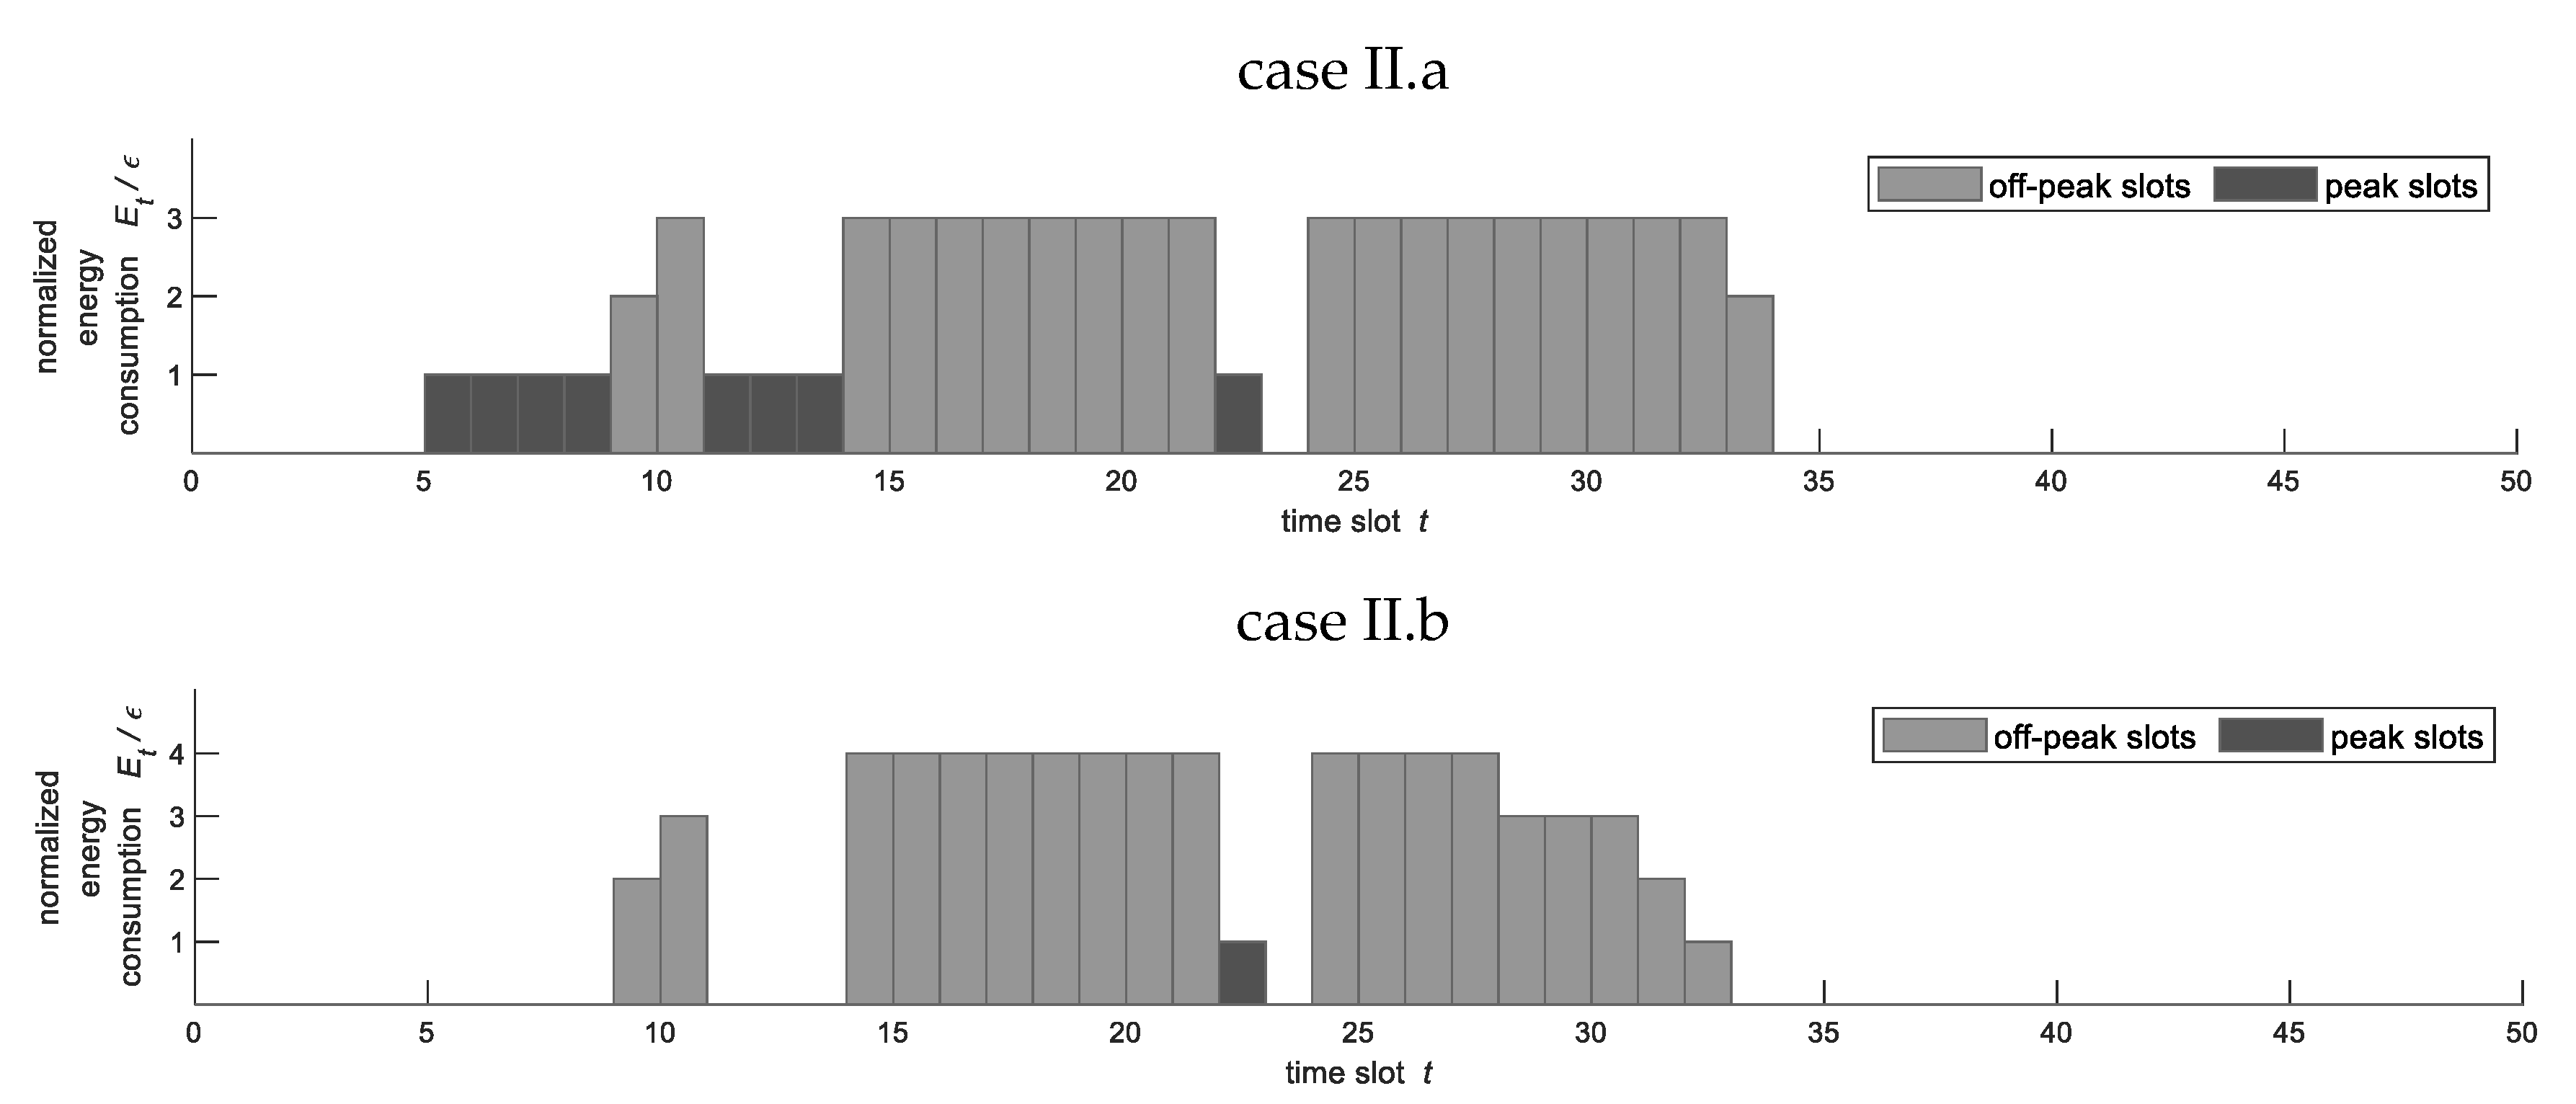
Second, we assess the performance of the proposed method in scenario II and we compare the corresponding results with respect to scenario I.a. In particular,
Figure 11a,b show the Gantt chart of handled jobs and, for each forklift, the discharging/replacement diagrams of batteries for the two cases of analysis II.a and II.b. Comparing
Figure 7a and
Figure 11a, it is apparent that the higher the number of forklifts, the lower the makespan (as shown in the second row of
Table 5). Conversely,
Figure 11a,b show that, by increasing the number of charging stations from
to
, no improvement in the makespan occurs (as reported in the second row of
Table 5): In effect, in cases II.a and II.b, the jobs are handled in accordance with the same sequences and the battery replacement occurs in the same time slots.
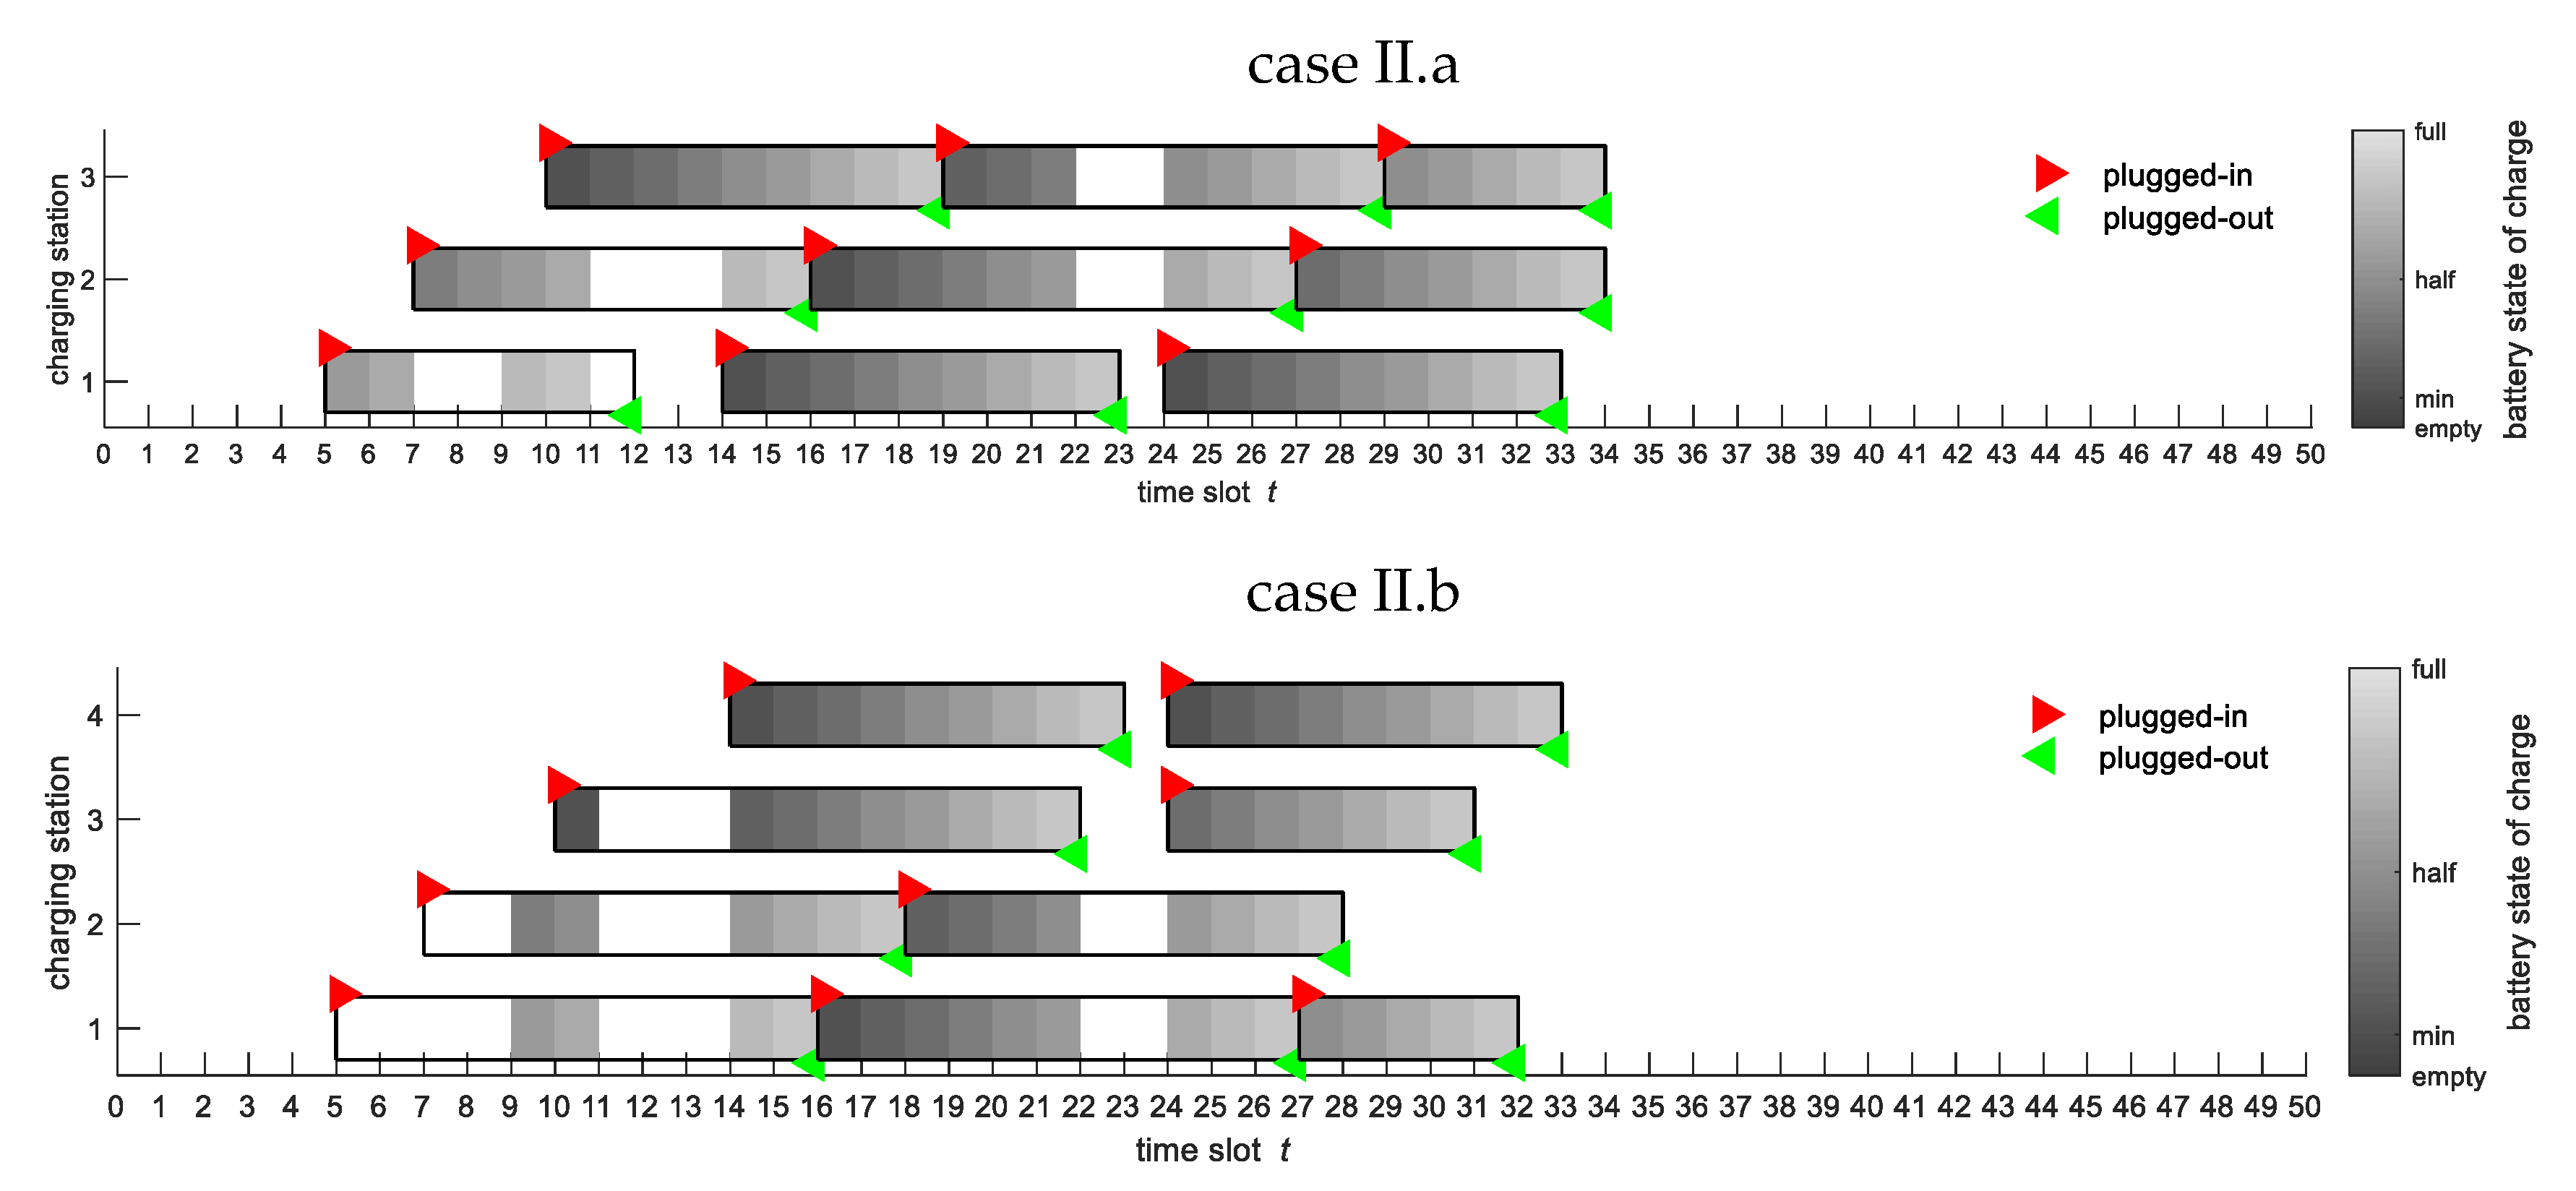
Subsequently,
Figure 12a,b provide details about the schedules of the recharging operations for the two cases of analysis related to scenario II. Comparing
Figure 8a and
Figure 12a,b, it is evident that the charging stations are not switched on over all of the plugged-in time slots. It is apparent from
Figure 8a and
Figure 12a that the higher the number of forklifts, and thus the lower the makespan, the lower the overall completion time of the recharging process (as shown in the third row of
Table 5).
Similarly, it is evident from
Figure 12a,b that, by increasing the number of charging stations from
to
, the overall completion time of the recharging process is reduced, since unplugged batteries find free charging stations sooner.
Furthermore, the profiles of the overall energy consumed over time by the charging stations are different in cases I.a, II.a, and II.b, as highlighted in
Figure 9a and
Figure 13a,b. In particular, we note that the amount of energy acquired during on-peak time slots is greater in case II.a than in case I.a, since, in case II.a, the batteries are required to be recharged within a shorter period (where the energy tariffs are less convenient) than in case I.a. Conversely, in case II.b, the amount of energy acquired during on-peak time slots is lower than in case II.a; even though the duration of the recharging process is similar in both cases, the availability of more charging stations in case II.b allows the avoidance of acquiring energy during on-peak times, differently from case II.a. As a result, the overall energy cost for the recharging operations is lower in case II.b than in cases II.a and I.a (namely, 3% and 9%, as shown in the fourth row of
Table 5).
Finally,
Figure 14a,b show the number of available fully charged batteries over time slots for the two cases of analysis related to scenario II. Comparing
Figure 10a and
Figure 14a,b, we note that, at the beginning of the planning horizon (when the forklifts begin their operation with the initial fully charged batteries), such a number is kept at the highest level (i.e., equal to 3 and 4 for cases I.a, II.a, and II.b, respectively). In the middle (when the forklifts require recurrent battery replacements to finalize their operations), it achieves the lowest level (i.e., equal to 0, that is, all of the charging stations are busy). In the final portion of the planning horizon, the number of available fully charged batteries returns to be at the highest level (i.e., all of the charging stations become available again). However, such a return is reached sooner in case II.b than in case II.a, where, in turn, it is reached sooner than in case I.a (as shown in the third row of
Table 5).
Third, we assess the performance of the proposed method in scenario III, where a more complex setup (i.e., greater number of jobs, forklifts, charging stations, etc.) is considered. The obtained results are illustrated in
Figure 15,
Figure 16,
Figure 17 and
Figure 18.
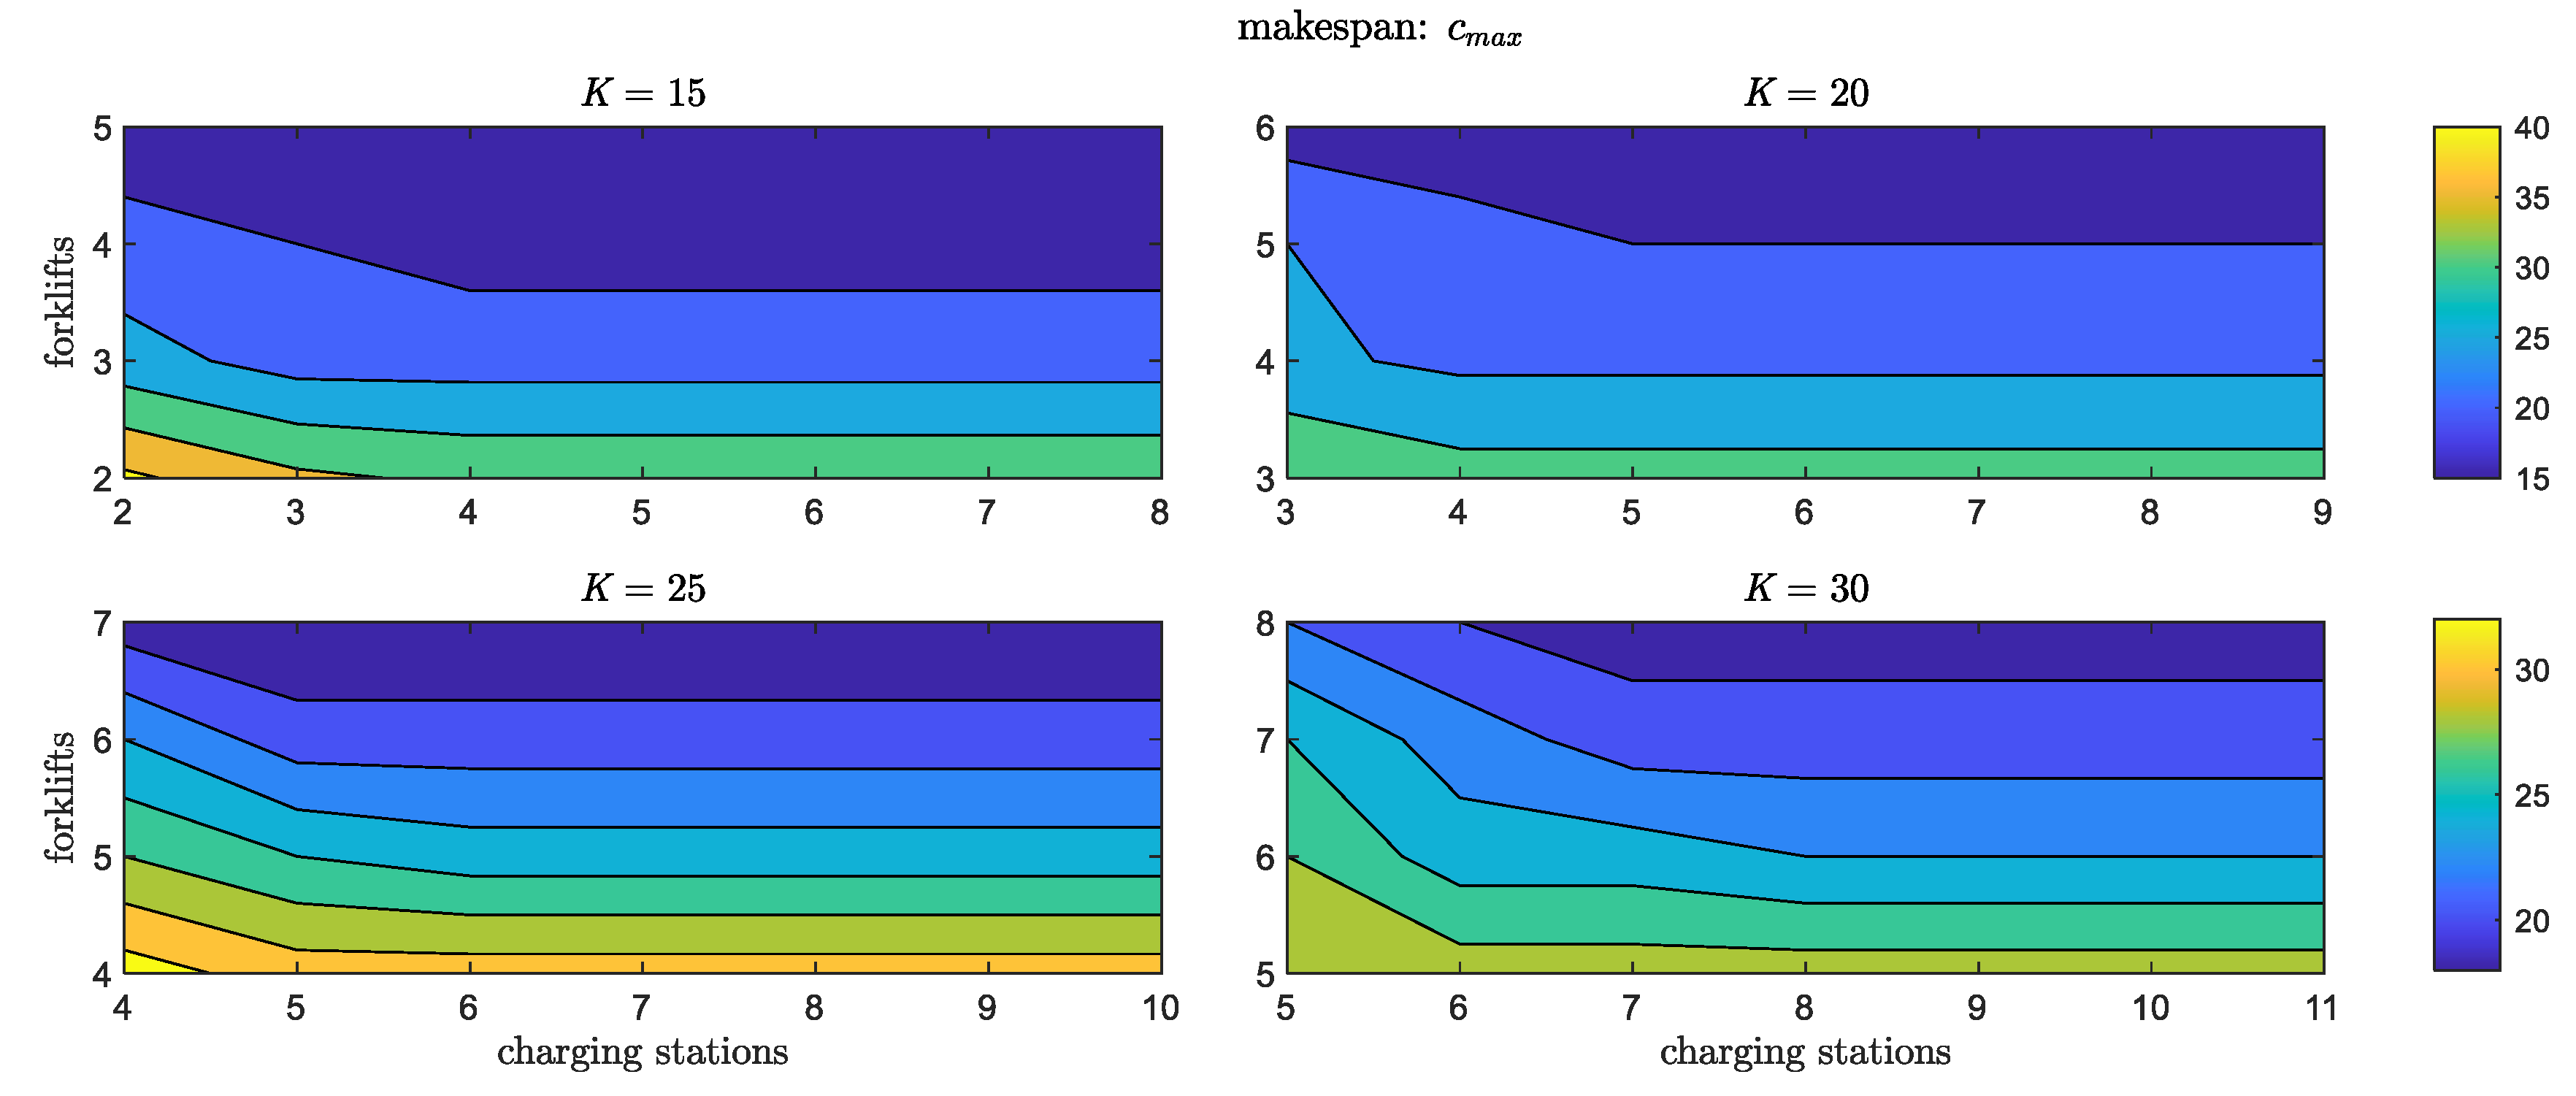
In particular,
Figure 15 shows the makespan as a function of the number of forklifts and charging stations for different numbers of jobs. It is apparent that, for a given number of jobs, the makespan could not be indefinitely reduced by increasing the number of forklifts. Similarly, for a given number of jobs and forklifts, there is no convenience in increasing the number of charging stations above a given value. We remark that
Figure 15 shows that such a value corresponds approximatively to the number of forklifts.
Furthermore,
Figure 16 shows the recharging process completion time as a function of the number of forklifts and charging stations for different numbers of jobs. It is apparent that for a given number of jobs and forklifts, the recharging process could not be indefinitely reduced by increasing the number of charging stations.
Figure 16 shows that such a value is roughly just above the number of forklifts.
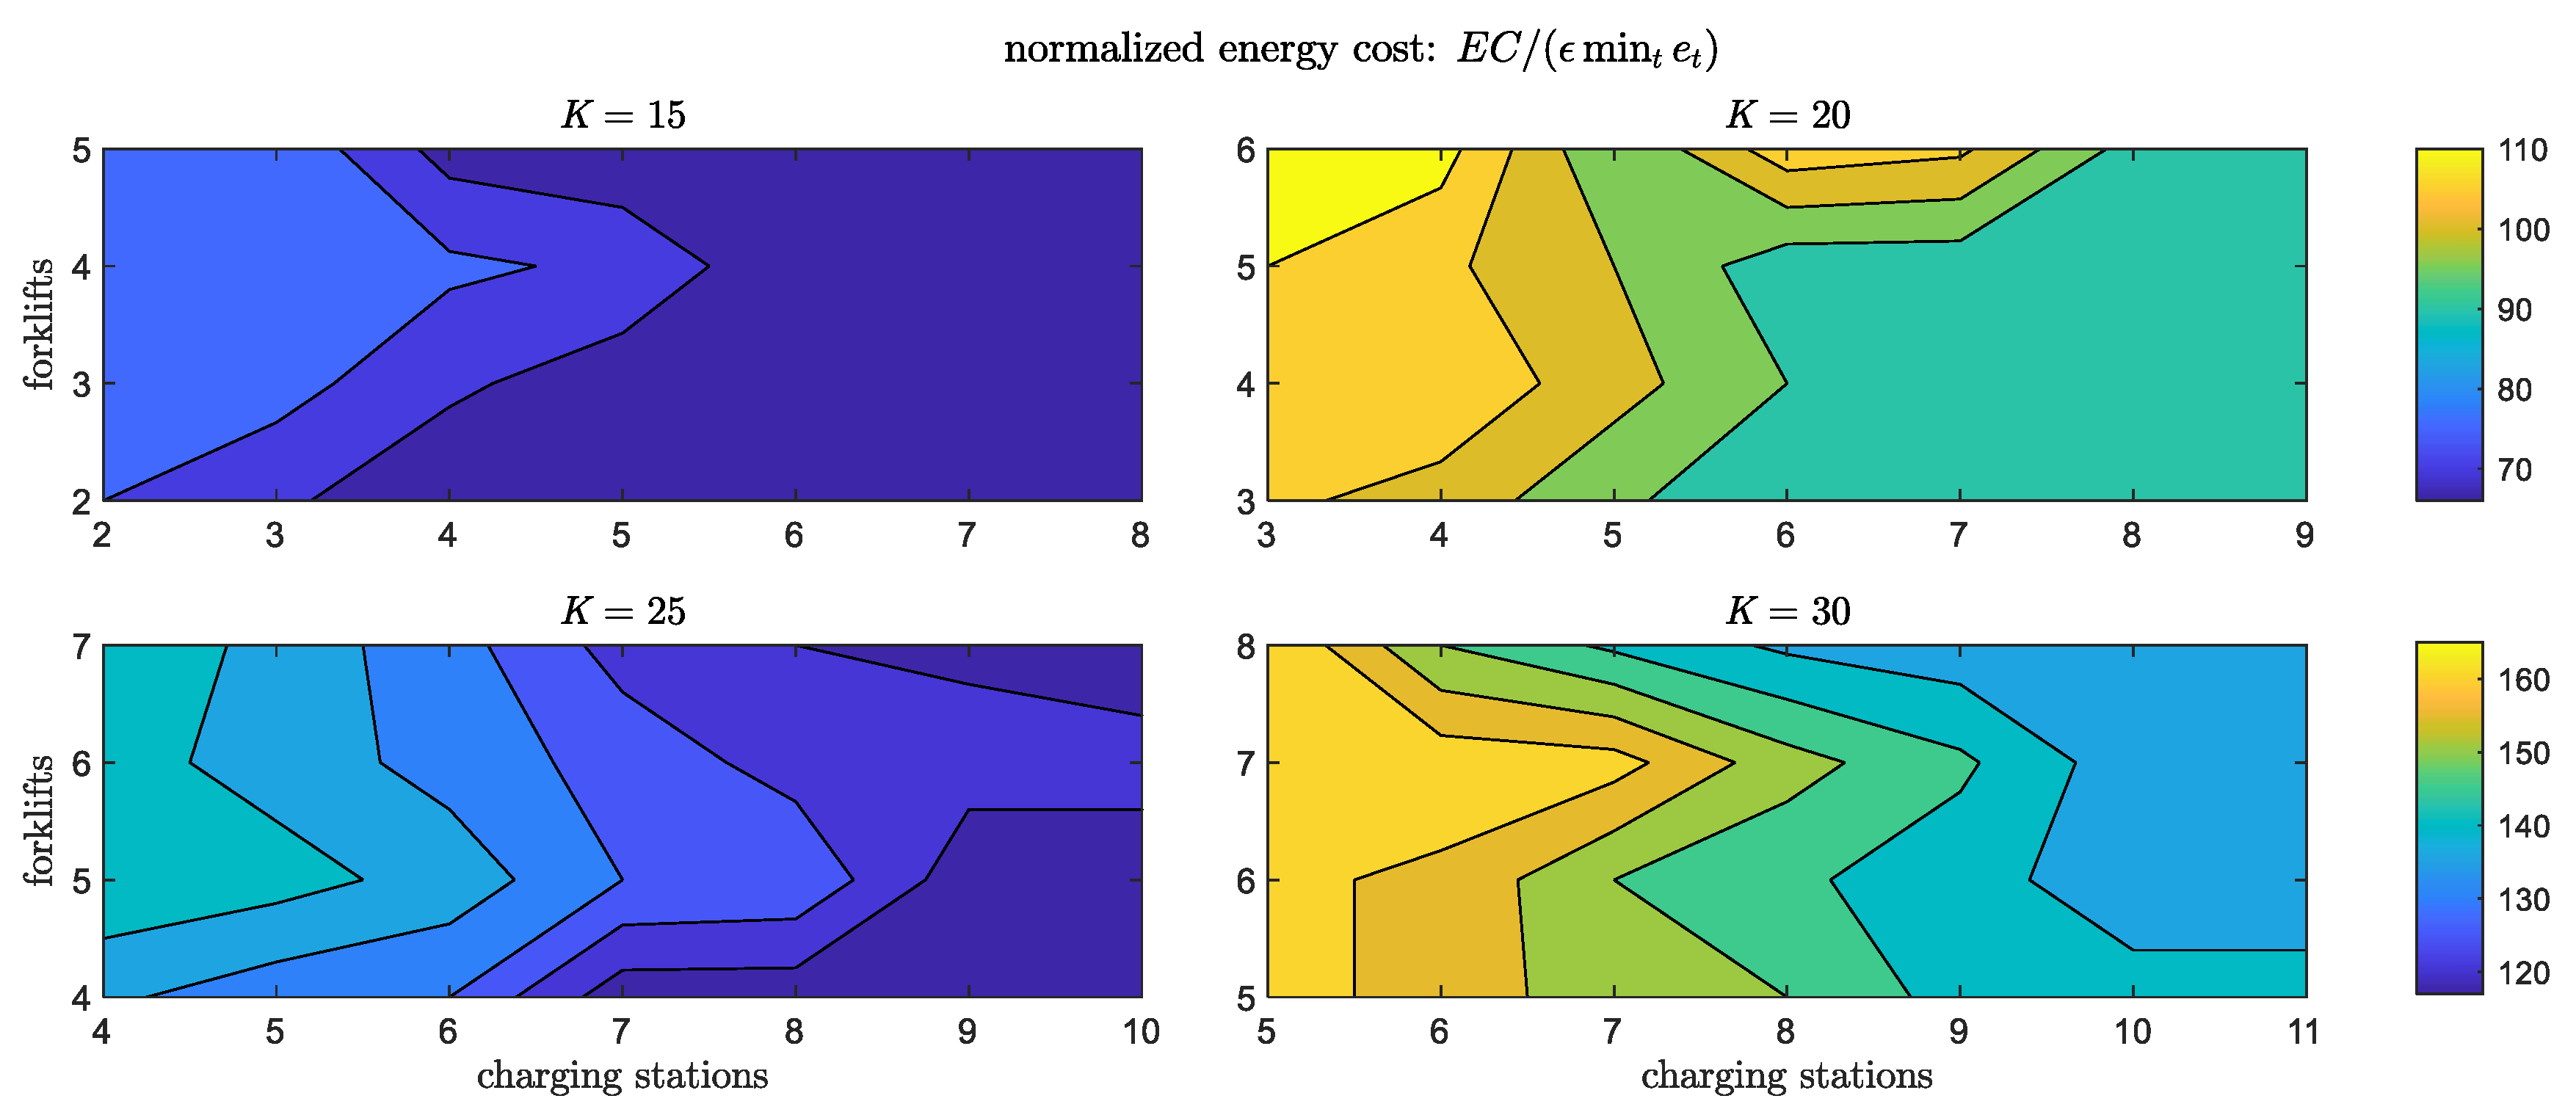
In addition,
Figure 17 shows the energy cost as a function of the number of forklifts and charging stations for different numbers of jobs. It is apparent that for a given number of jobs, the energy cost could be reduced by increasing both the number of forklifts and charging stations. For a given number of jobs and forklifts, there is no convenience in increasing the number of charging stations above a given value. However, when the number of forklifts is low, the minimum energy cost is achieved with a number of charging stations that is approximatively two times the number of forklifts (e.g., for
and
, the minimum energy cost is achieved with
). Conversely, when the number of forklifts is higher, the minimum energy cost is achieved with a number of charging stations that corresponds approximatively to the number of forklifts (e.g., for
and
, the minimum energy cost is achieved with
).
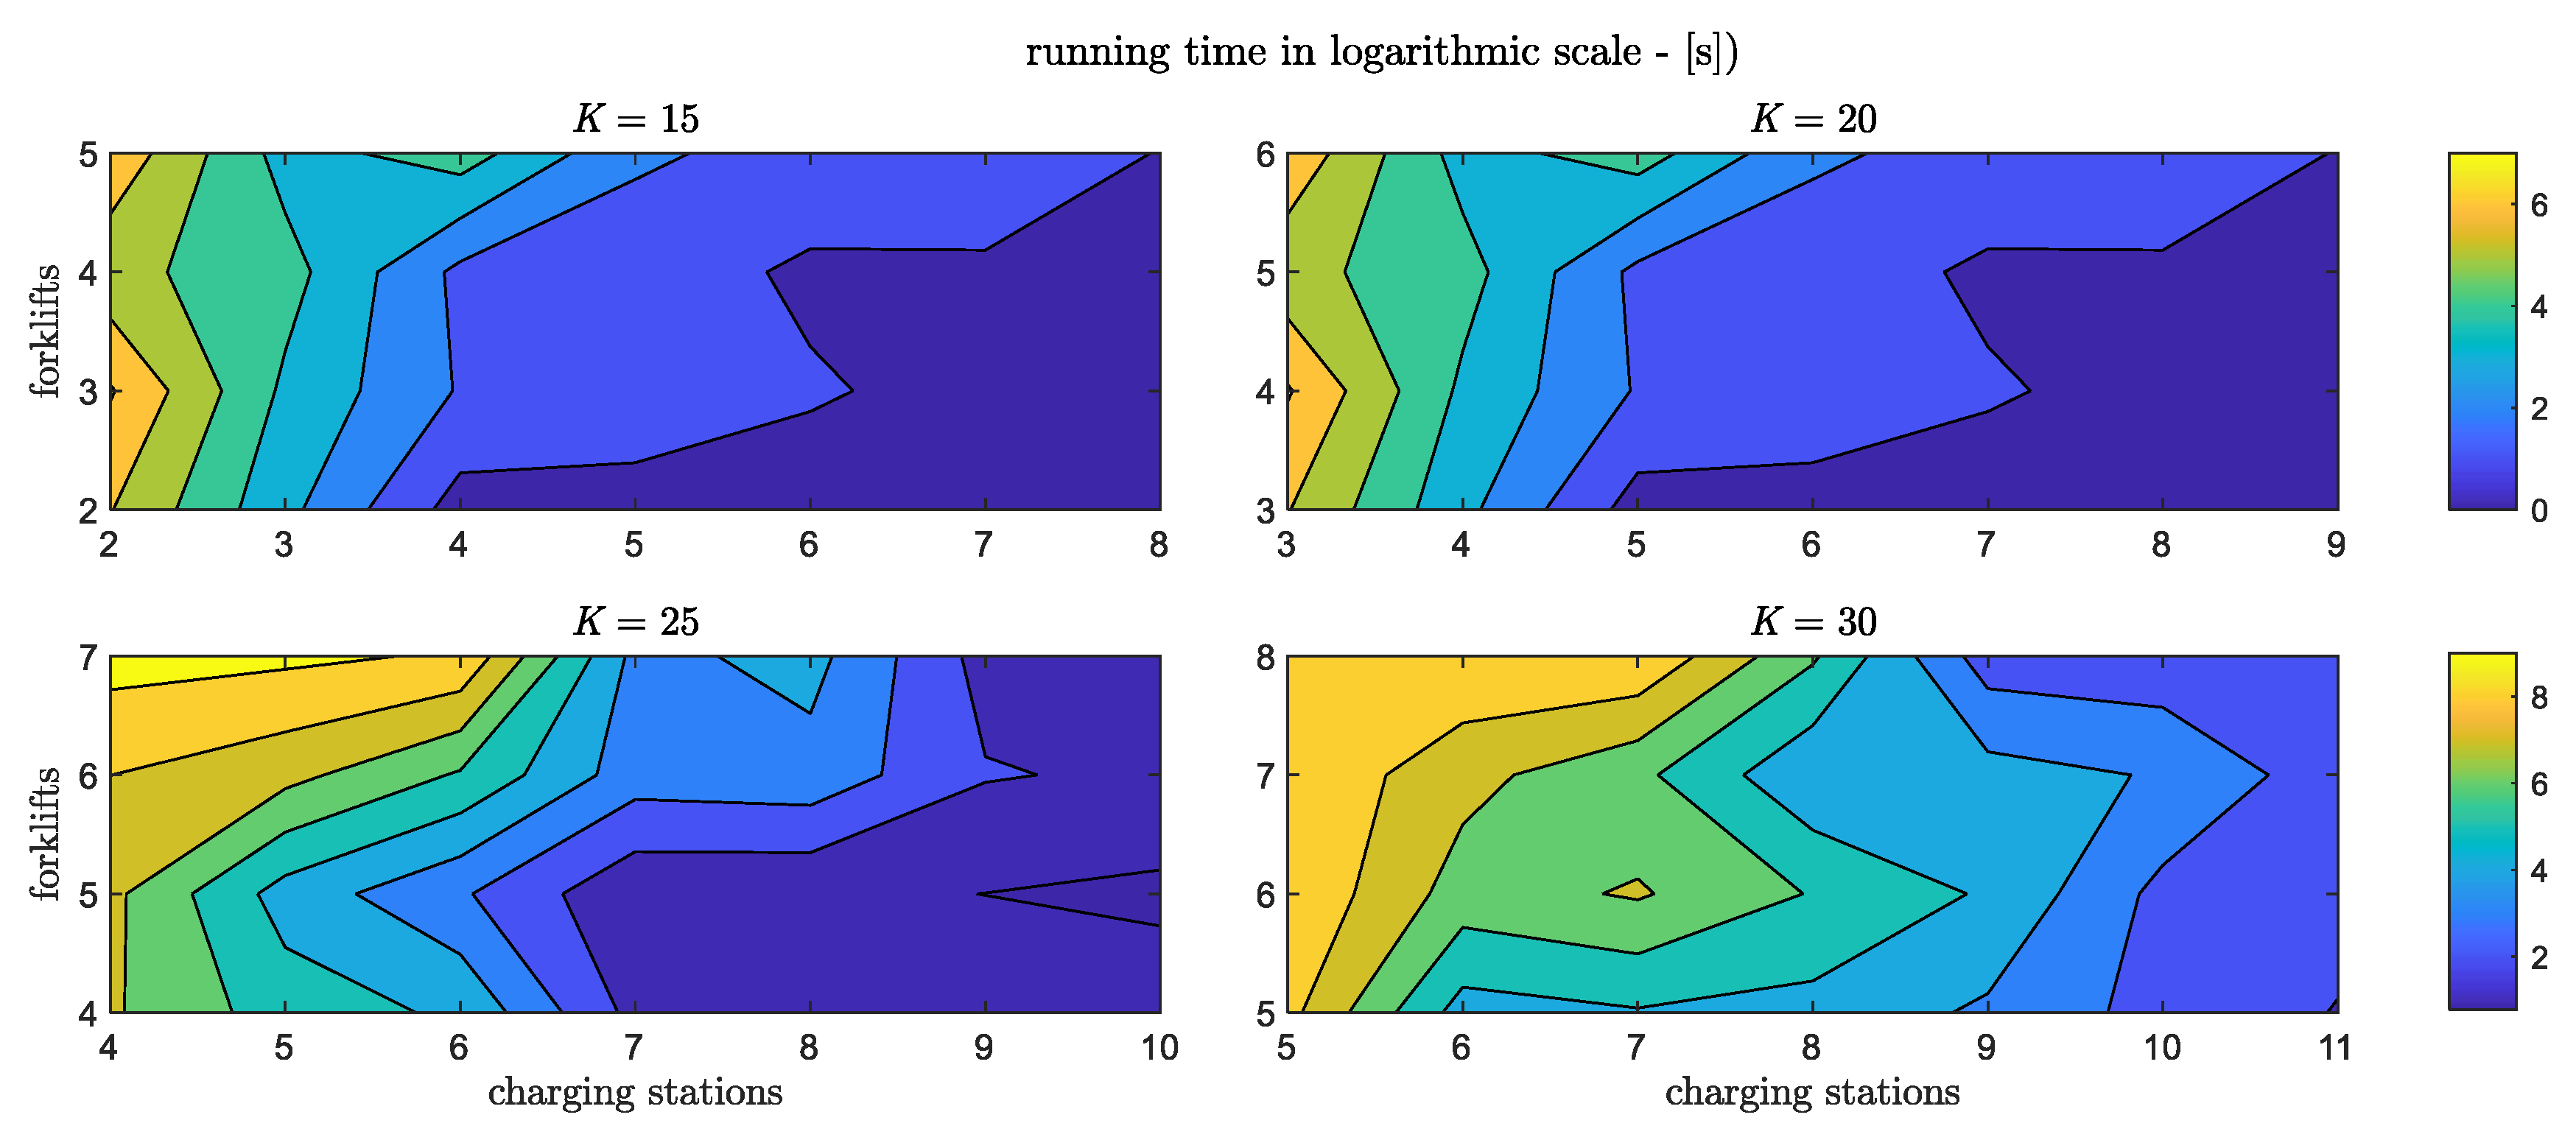
Finally, even though the addressed optimization problem arises at a planning level (where the run time is less critical than in operational management), we provide an analysis of run time. In particular,
Figure 18 shows the run time required by the proposed optimization model as a function of the number of forklifts and charging stations for different numbers of jobs. Given a number of forklifts and charging stations, it is evident that the run time grows as the number of jobs grows. Conversely, for a given number of jobs, the lower the number of forklifts and charging stations, the higher the run time. This is due the fact that, with limited resources (i.e., both forklifts and charging stations), the search for the optimal scheduling is carried out on a narrow decision space.
As a final remark, we note that
Figure 15,
Figure 16 and
Figure 17 show that the proposed model could be used as a decision support tool in defining the optimal configuration of the resources (e.g., number of forklifts and charging stations) deployed in the warehouse in order to schedule jobs in a sustainable and cost-efficient perspective.

 ,
, 


