Article

Variations in Soil Physico-Chemical Properties along Slope Position Gradient in Secondary Vegetation of the Hilly Region, Guilin, Southwest China

1
Key Laboratory of Wild Animal and Plant Ecology of Guangxi Colleges and Universities, Guangxi Normal University, Guilin 541006, China
2
State Key Laboratory of Grassland Agro-ecosystems/School of Life Sciences, Lanzhou University, Lanzhou 730000, China
3
College of Life Science, Guangxi Normal University, Guilin 541006, China
*
Author to whom correspondence should be addressed.
Sustainability 2020, 12(4), 1303; https://doi.org/10.3390/su12041303
Submission received: 12 January 2020 / Revised: 6 February 2020 / Accepted: 7 February 2020 / Published: 11 February 2020
(This article belongs to the Special Issue Suitable Agronomic Techniques for Sustainable Agriculture)

Abstract

:
Understanding the variation of soil physico-chemical properties along slope position gradients is essential for vegetation restoration and reconstruction, but how slope positions impact the soil physico-chemical properties in the secondary vegetation of hilly regions is poorly understood. To address these uncertainties, we examined the changes in soil physico-chemical properties and their relationships along the slope position gradient in secondary vegetation of the hilly region in Guilin, southwest China. The results showed that except for the soil water content, soil total phosphorus and soil total potassium which reached the highest value at the footslope, other soil physico-chemical properties reached the highest content in the middle slope, and most of the soil physico-chemical properties showed the lowest content in the upper slope or footslope. Moreover, Pearson’s correlation analysis revealed that there were no significant correlations between most of the soil physico-chemical properties and that the correlations between soil physico-chemical properties were not consistent across different slope positions. Additionally, the principal component analysis showed that the first 4 principal components together explained 84.32% of the total variation and might be interpreted as the change of soil total nitrogen, soil organic matter, soil available nitrogen, soil available potassium, soil water content and soil total potassium. Overall, our results strongly demonstrated that slope positions showed significant effects on most of the soil physico-chemical properties and would provide an important reference for the formulation of restoration strategies in different slope positions to facilitate vegetation restoration and reconstruction and the sustainable development of the ecological environment in the hilly region.

1. Introduction

Soil is an important natural resource, as a key component of the mountain ecosystem, and it underpins our very existence through providing a wide range of food, feed, fiber and timber production, as well as through earth system functions that support the delivery of other “ecosystem services” [1,2]. The suitability of the soil for those productions is based on the quality of the soil’s physical, chemical and biological properties [3,4]. However, the spatial variability of soil properties in an ecosystem is significantly influenced by some environmental factors such as parent materials, topography, climate, vegetation and disturbance due to human activities [5]. Among these factors, it is well recognized that topographic gradients (e.g., slope position, slope aspect, slope gradient) may play the most essential role due to their influence on the shape of the land surface, thereby dictating the distribution of local and regional microclimates by changing the pattern of precipitation, temperature and relative humidity [6,7]. Topography-induced microclimate differences, in turn, can cause a significant change in plant growth and soil properties, which will drastically affect the structures and functions of ecosystems [8,9,10,11]. As a major topographical parameter, the slope position, i.e., the relative height position along the hill’s side slope, could also significantly change the soil physico-chemical properties by controlling the movement of water and material in a hillslope and contributing to the spatial differences of soil properties [12,13]. In addition, changes in slope inclination, including angle and length of slopes, have a major impact on soil erosion, which is an important disturbance and causes significant loss of finer soil particles with a high content of soil organic carbon and soil total nitrogen [14]. For long slopes, soil loss was present at the upper slope position, while the lower slope was generally considered to be the sink of eroded soil particles. It is certain that slope position affects soil particle distribution, soil temperature and moisture and C and nutrient cycling processes in grasslands [8,11,15,16,17] and forestlands [18,19]. Hence, slope position is a key topographic factor influencing microclimate, soil properties, species composition and ecosystem processes and functions in many terrestrial ecosystems [16,17,19,20,21]. Therefore, neglecting slope position factors may increase uncertainty in estimating soil physico-chemical properties in those hilly and mountainous regions [22]. So, it is necessary to understand the effect of slope position on soil physico-chemical properties.
In the past decades, numerous studies have documented the relevance, and often the primacy, of slope position in determining the variability of soil properties [23]. For instance, Pierson and Mulla [24] studied the soil properties on different slope positions and concluded that soils formed on footslope and toeslope positions contained higher organic carbon and aggregate stability compared to summit position. Meanwhile, Moorman et al. [25] illustrated that footslope or toeslope positions had higher contents of total C than backslope positions. Similarly, Tsui et al. [6] studied the relationships between soil properties and slope position in a lowland rain forest of southern Taiwan and showed that organic carbon, available N, available K, extractable Fe and exchangeable Na were highest on the summit, while pH, available P, exchangeable Ca and Mg were significantly higher on the footslope at 0–15 cm depth soils. Additionally, Rezaei et al. [26] researched the effects of slope position on the soil properties in the Arasbaran Forest, Iran and found that some soil physico-chemical and morphological properties such as the thickness of soil profile and solum, clay, organic carbon and total nitrogen percentages and cation exchange capacity were significantly different on different slope positions. According to the above description, it is not difficult to find that the slope position could significantly change the soil physico-chemical properties, and the slope position has different effects on physico-chemical properties in different habitat types. However, there is still no consistent conclusion about how the soil physico-chemical properties are affected by the slope position [27]. Thus, the mechanism of how the slope position affects the soil physico-chemical properties remains poorly understood, especially in the hilly red soil region.
The hilly red soil region of southern China covers a large area (occupying approximately 1.13 × 10⁶ km2 and accounting for about 11% of the total area of China), including 11 provinces and 619 counties in southern China, and provides numerous essential ecosystem services, including carbon sequestration and climate regulation as well as economic benefits [28,29]. However, these ecosystems were once known as the “red desert of southern China” as the land resources and the environment are degraded due to severe soil erosion, long-term unreasonable land uses and bad land management practices [30]. Therefore, this region is of low ecological stability and high fluctuation in biological systems and productivity, and is sensitive to the activities of humans and sudden disasters. How to restore this degraded ecosystem is an important subject facing in this region. As is well established, understanding the variation of soil physico-chemical properties along the slope position gradient is a key step in the development of revegetation strategies for this hilly region. However, despite the international fame of this region, there are few studies about the soil physico-chemical properties of this region, and most of them are about forest vegetation. Accordingly, how slope positions affect the soil physico-chemical properties in secondary vegetation of the hilly region remains unknown, which greatly limits our understanding of the cooperative restoration process of vegetation and soil. Hence, it is especially important to investigate how slope positions affect the soil physico-chemical properties in the secondary vegetation of the hilly region.
Here, we explored the variation of soil physico-chemical properties and their relationships along the slope position gradient in the secondary vegetation of the hilly region, Guilin, southwest China. Specifically, we hypothesized that soil physico-chemical properties and their relationships will change with the slope position in this secondary vegetation ecosystem. To test our hypotheses, we investigated soil physico-chemical properties along the slope position gradient in secondary vegetation of the hilly region, Guilin, southwest China. Consequently, the main objectives of this study were to: (1) investigate how soil physico-chemical properties change in different slope positions and (2) explore the relationships between soil physico-chemical properties at different slope positions. Our results are expected to provide fundamental information about the soil physico-chemical properties of this area. Such information would be helpful to support the reasonable utilization and management of soil resources, and further to facilitate ecological restoration and reconstruction strategies and the sustainable development of the ecological environment in the hilly region.

2. Materials and Methods
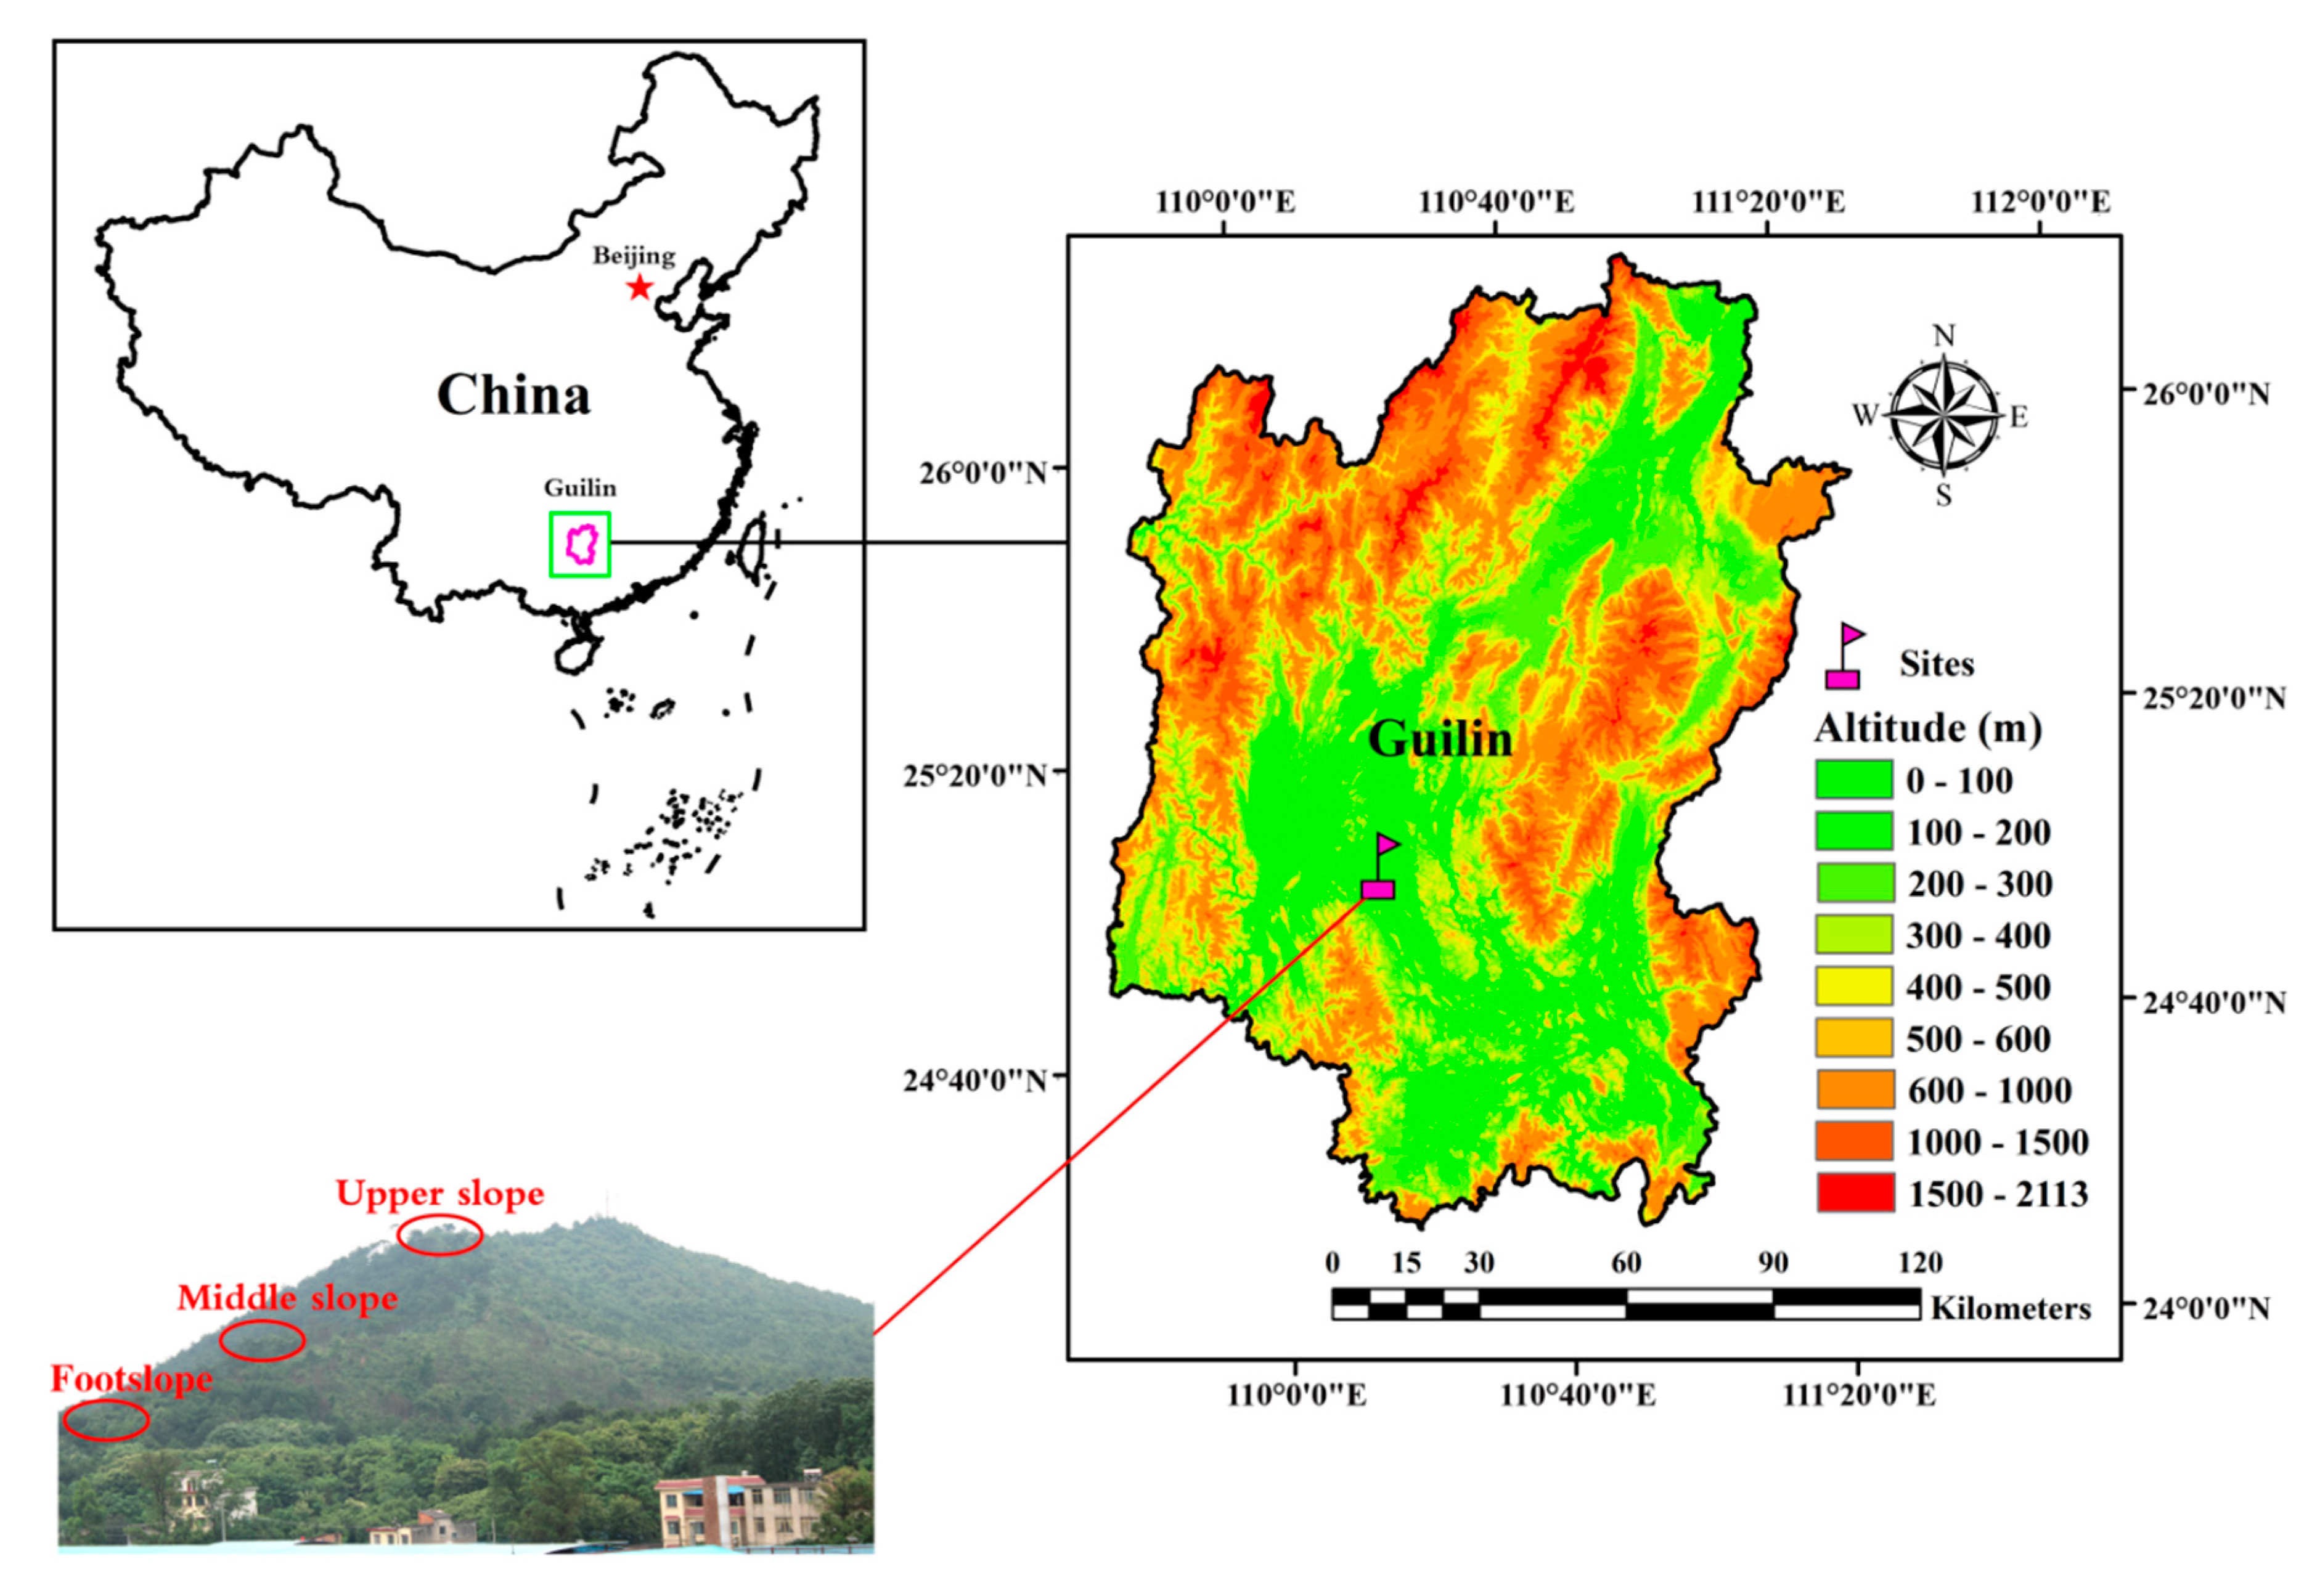
2.1. Study Area

This study was conducted in a hilly region of Yanshan Town, Guilin City, Guangxi Zhuang Autonomous Region, southwest China (25°02’ N–25°19’ N, 110°09’ E–110°20’ E, Figure 1). The topography of this region was characterized as a hilly region, and the altitude ranges from 100 to 500 m above sea level (a.s.l.). This region has a typical mid-subtropical humid monsoon climate with a climate of hot summers and cold winters, and the mean annual temperature is 17.8–19.1 °C with a frost-free period of 309 d and a mean annual sunshine duration of 1670 h (the China Meteorological Data Service Center; http://data.cma.cn). The mean annual precipitation varies from 1814 to 1941 mm, with a distinct wet season from May to October (more than 80% of precipitation occurs during the wet season) and a dry season from November to April of the following year; the annual average evaporation capacity change ranges from 1490 to 1905 mm. The region’s soil is primarily dominated by zonal red soils derived from Quaternary red clay according to the Chinese soil classification system, which was classified as ultisols based on the United States Department of Agriculture (USDA) soil taxonomy [31]. The natural vegetation of this region is characterized by subtropical evergreen and deciduous broadleaved mixed forests. Historically, most of the forests have been severely disturbed with only small tracts of intact or semi-intact forest, and at present, the main vegetation type is secondary vegetation. The dominant woody species include Pinus massoniana var. Massoniana, Melastoma candidum D. Don, Schima superba Gardn. et Champ, Rhododendron molle G. Don, Ficus hirta Vahl.

2.2. Vegetation Investigation

The main topographical factor examined in this study was the hilly slope positions, therefore three different slope positions in an altitudinal transect with the same slope aspect were chosen as the sampling sites, namely: footslope, middle slope and upper slope. From September to October 2016, a total of 28 plots (20 m × 20 m) were arranged on random locations from the bottom to the top along the footslope position (10 plots), middle slope position (9 plots) and upper slope position (9 plots) of the Jiangjiaba heaped-up mountain in Yanshan Town, Guilin City, Guangxi Zhuang Autonomous Region, southwest China (Figure 1). All the plots were on similar northwest aspects, with an altitude range from 195 to 372 m above the sea level (a.s.l.). The plots within our three different slope positions were considered to be true replicates as the distance between them exceeded the spatial dependence of most physico-chemical properties [32]. In each sampling plot, all the individual trees and shrubs were identified and measured for Latin name, diameter at breast height (DBH) or basal diameter, height and layer coverage. The nomenclature of the species followed Flora of China (English edition; http://foc.iplant.cn). Moreover, environmental variables such as geographical position, elevation, topography (such as slope aspect, slope degree and slope position), rock exposure rate and degree of human interference were surveyed and recorded for each sampling plot. The basic description information of the sample sites at each slope position is summarized in Table 1. According to the survey results, Pinus massoniana var. Massoniana, Rhododendron molle G. Don and Ficus hirta Vahl were the dominant species at the footslope position (slope: 13–18°). By contrast, in the middle slope position (slope: 7–12°), the dominant species were Pinus massoniana var. Massoniana, Melastoma candidum D. Don and Schima superba Gardn. et Champ. Additionally, Pinus massoniana var. Massoniana, Melastoma candidum D. Don and Schima superba Gardn. et Champ were the dominant species in the upper slope position (slope: 17–21°).

2.3. Soil Sampling and Analysis

Soil samples were also collected from July to September 2016. According to the “S” type, after leaf litter was removed, five topsoils (0–15 cm depth) samples were collected from each 20 m × 20 m plot and then mixed to obtain one sample to represent the soil chemical properties of each plot. Meanwhile, soil water content was measured by a portable Soil Moisture/Temperature/Salinity Meter (WET-2, Delta-T, England) at the same location where the soil samples were taken. The composite samples were placed in polyethylene bags and immediately transported to the laboratory. After manually removing the fine roots, stones and plant organic residues, each soil sample was air-dried at room temperature. Subsequently, samples were crushed, sieved through a 2 mm mesh sieve, and homogeneously mixed for further soil physico-chemical analysis.
The analyses of soil properties were determined using methods that have been described in soil agricultural and chemical analysis [33]. Briefly, soil pH (pH) was measured with a digital pH meter (FE20K, Mettler-Toledo, Zurich, Switzerland) using a soil: water ratio of 1: 2.5. Soil organic matter (SOM, g kg−1) was tested by using the dichromate oxidation method. Soil total nitrogen (TN, g kg−1) was determined by using automatic Kjeldahl analysis (KJELTECTM 8400, FOSS Quality Assurance Co., Ltd., Hillerød, Denmark). Soil total phosphorus (TP, g kg−1) was analyzed by acid digestion with an H2SO4+HClO4 solution. Soil total potassium (TK, g kg−1) was digested by the HF-HClO4-HNO3 acid mixture and determined by the flame photometric method. Soil available nitrogen (AN, mg kg−1) was quantified using the alkaline hydrolysis diffusion method. Soil available phosphorus (AP, mg kg−1) was measured using the molybdenum blue colorimetric method after samples had been extracted with 0.5 M Na2CO3 whereas the soil available potassium (AK, mg kg−1) was shaken for 30 min with 1 M ammonium acetate solution (1:10 w/v) and then analyzed by flame photometry. For each soil sample, measurements were repeated three times, and the average value was taken as the basic data of soil physico-chemical analysis.

2.4. Statistical Analysis

All data were tested for normality of distributions and homogeneity of variances prior to analysis. When data were not normally distributed, they were logarithmically transformed before analysis. The main statistical parameters (minimum, maximum, mean, median, variance, standard deviation, skewness coefficient, kurtosis coefficient and coefficient of variance (CV)) of soil physico-chemical properties at three different slope positions were calculated through the “describe” function in the Psych package of the R 3.4.2 software [34]. Differences in soil physico-chemical properties across the three different slope positions were compared by using the one-way analysis of variance (one-way ANOVA) method. Furthermore, the Tukey–Kramer honestly significant difference (HSD) test of the means was used when statistically significant differences (p < 0.05) were observed among slope positions. Subsequently, all relationships between soil variables were evaluated using Pearson’s correlation tests, and the size of the correlation coefficient was detected by using the Student’s t. In addition, Principal component analysis (PCA) was applied to tease apart differences and examine the contribution degree of the overall variation of each soil’s physico-chemical properties. The site distribution map was created using the ArcGIS 10.2 software (ESRI, Inc., Redlands, CA, USA software version 10.2; http://www.esri.com/software/arcgis/arcgis-for-desktop). All the other statistical analyses and graphing were performed using R 3.4.2 software [34] with the additional packages “vegan” [35].

3. Results

3.1. Descriptive Statistics of Soil Physico-Chemical Properties at Different Slope Positions

The descriptive statistics of all soil physico-chemical properties at different slope positions were summarized in Table 2. The coefficients of variation (CV) of soil physico-chemical properties at the footslope, middle slope and upper slope positions were 6.47%–89.51%, 2.15%–41.19%, and 4.71%–155.54%, respectively. The minimum and maximum variable coefficients of soil physico-chemical properties at the three different slope position gradients were soil pH (CV = 6.47%, 2.15% and 4.71%, respectively) and soil available phosphorus (CV = 89.51%, 41.19% and 122.54%, respectively), respectively.

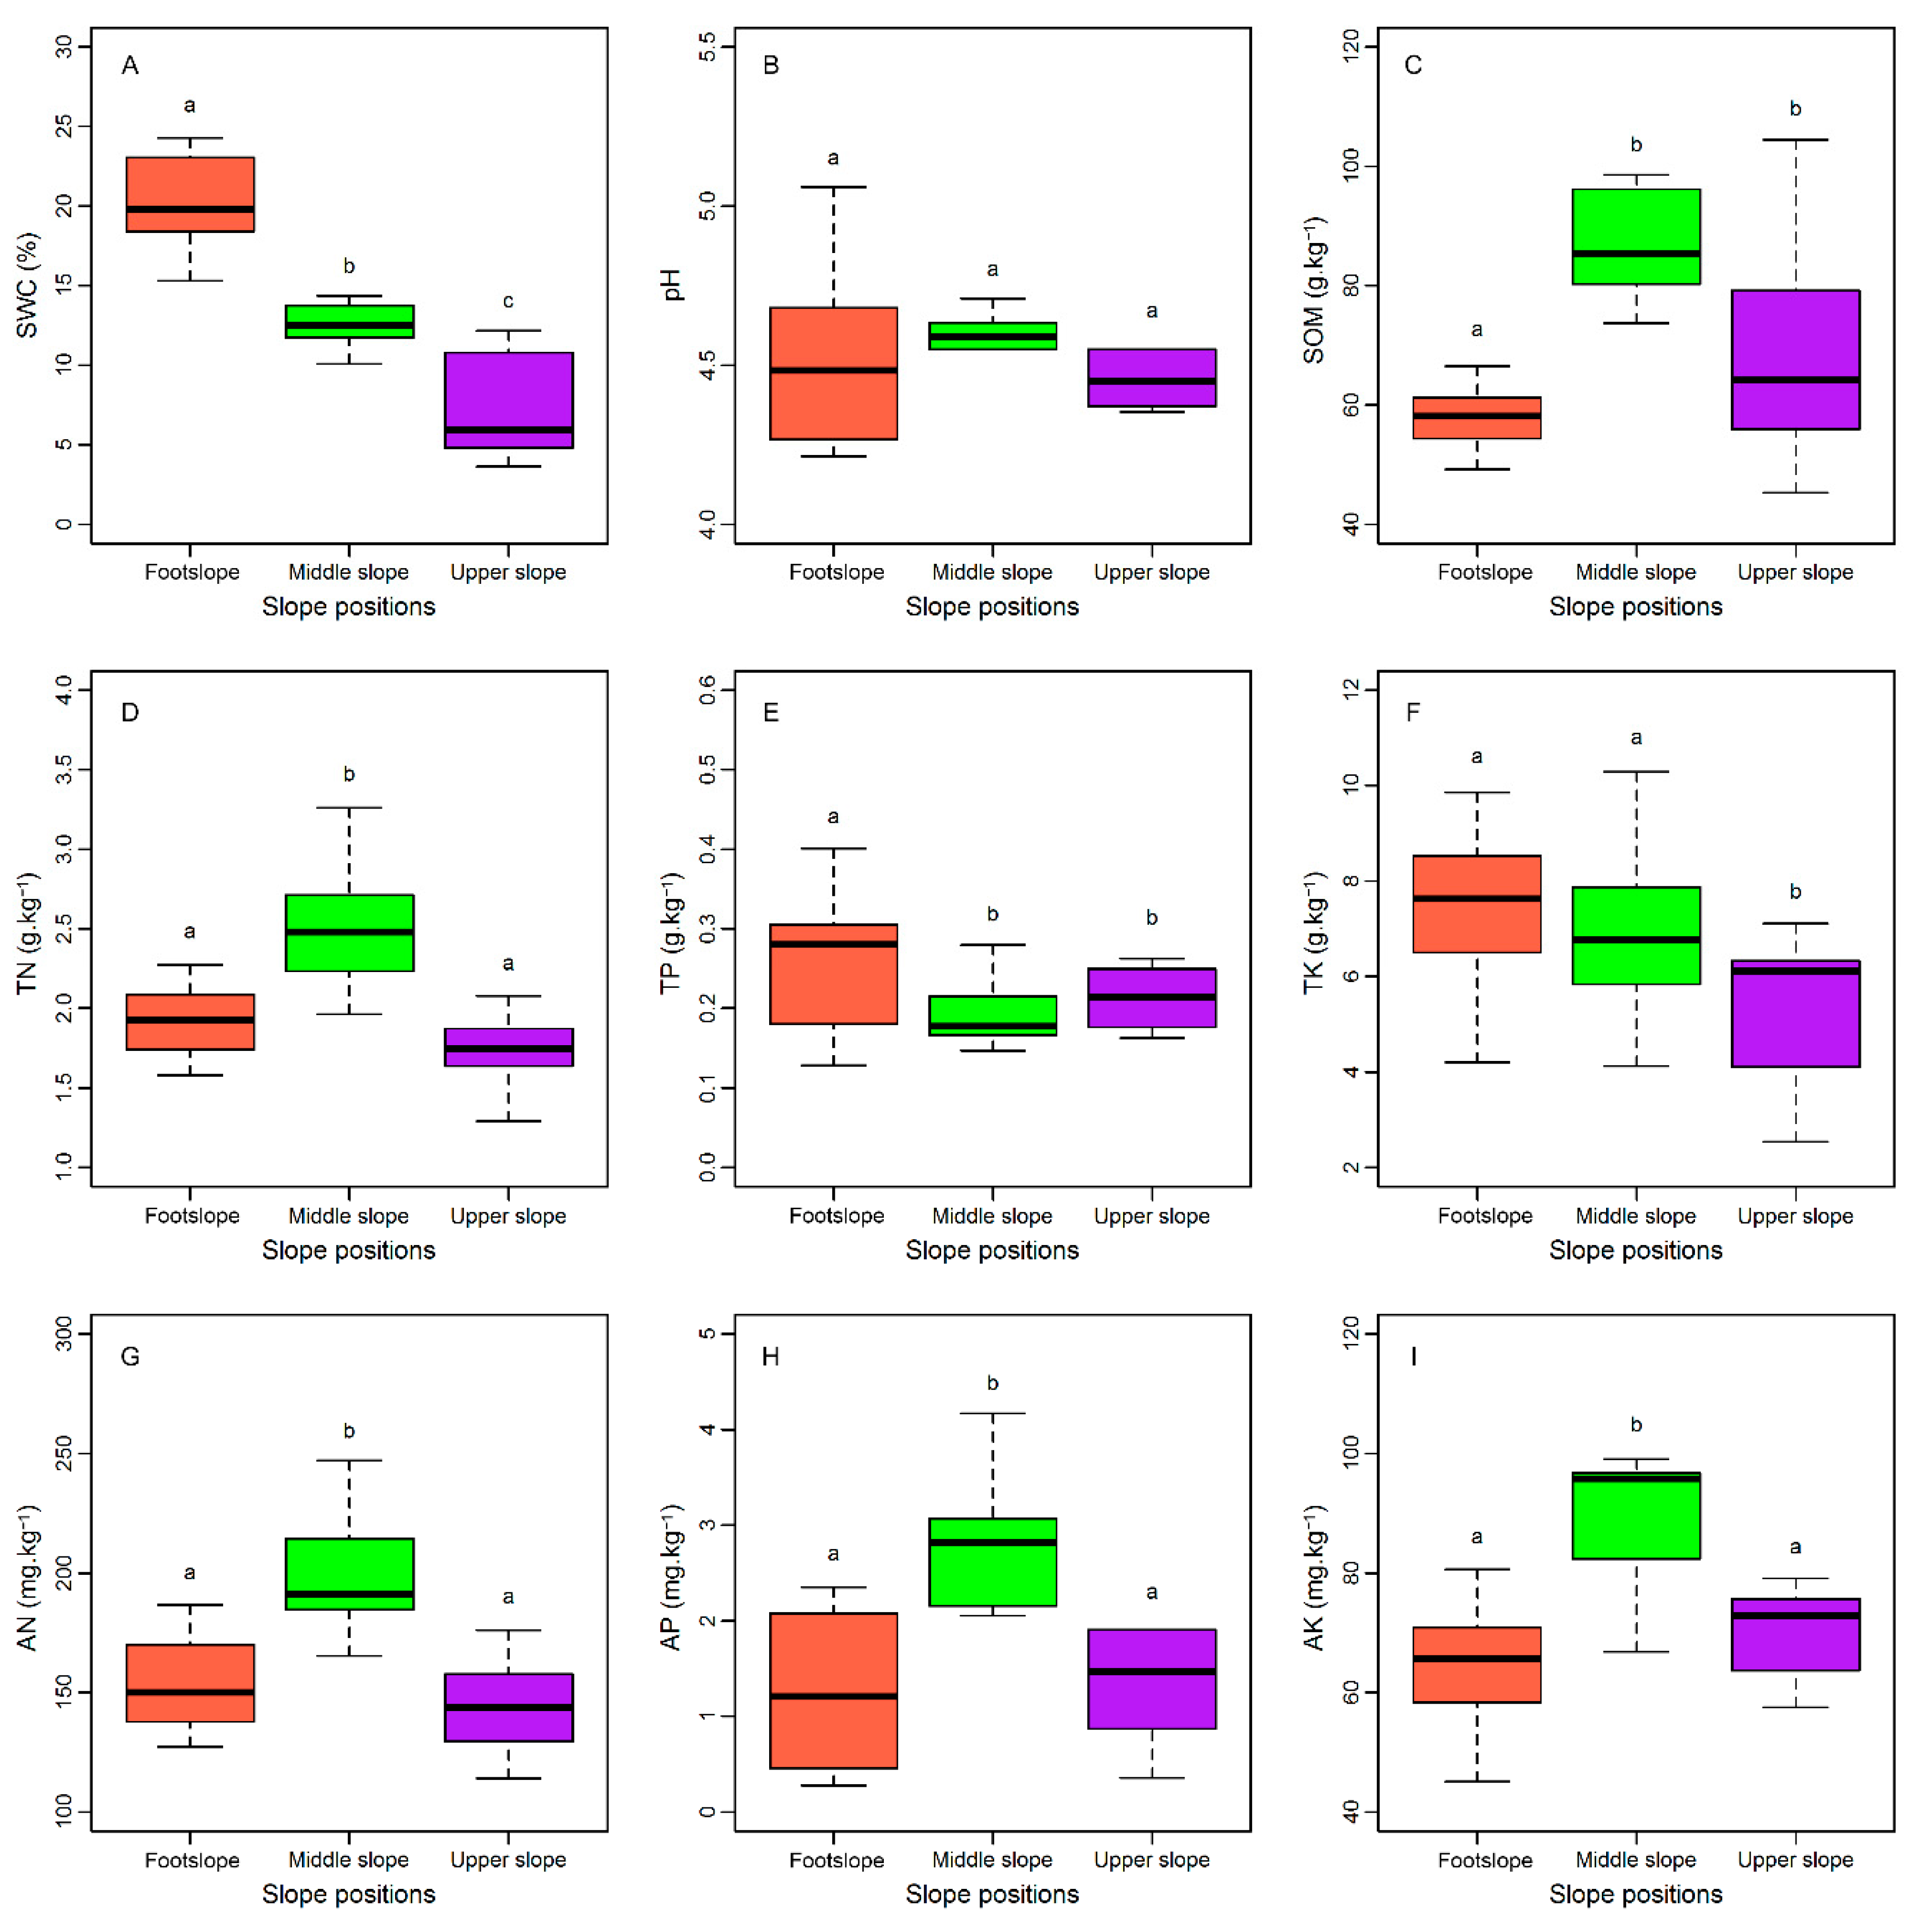
3.2. Comparison of Soil Physico-Chemical Properties at Different Slope Positions

In accordance with our predictions, most of the soil physico-chemical properties showed significant differences between the three slope positions. Specifically, the soil water content (SWC) at three slope positions was shown as footslope > middle slope > upper slope, and the difference between each slope position was significant (Figure 2A). Soil pH (pH) was slightly acidic to strongly acidic, and there was no significant difference between the three slope positions (Figure 2B). Soil organic matter (SOM) showed that the middle slope and upper slope positions were significantly higher than the footslope positions (Figure 2C). Soil total nitrogen (TN) and available nutrients (AN, AP and AK) at the middle slope positions were significantly higher than at the footslope and upper slope positions (Figure 2D, G, H and I, respectively). Soil total phosphorus content (TP) was significantly higher at the footslope positions than at the middle slope and upper slope positions (Figure 2E). Soil total potassium (TK) at the footslope and middle slope positions was significantly higher than the upper slope positions (Figure 2F). In total, except for the soil water content (SWC), soil total phosphorus (TP) and soil total potassium (TK), which reached the highest value at the footslope positions, all the remaining soil physico-chemical properties showed the highest content in the middle slope positions. In addition, most of soil physico-chemical properties were lowest in the upper slope or footslope positions.

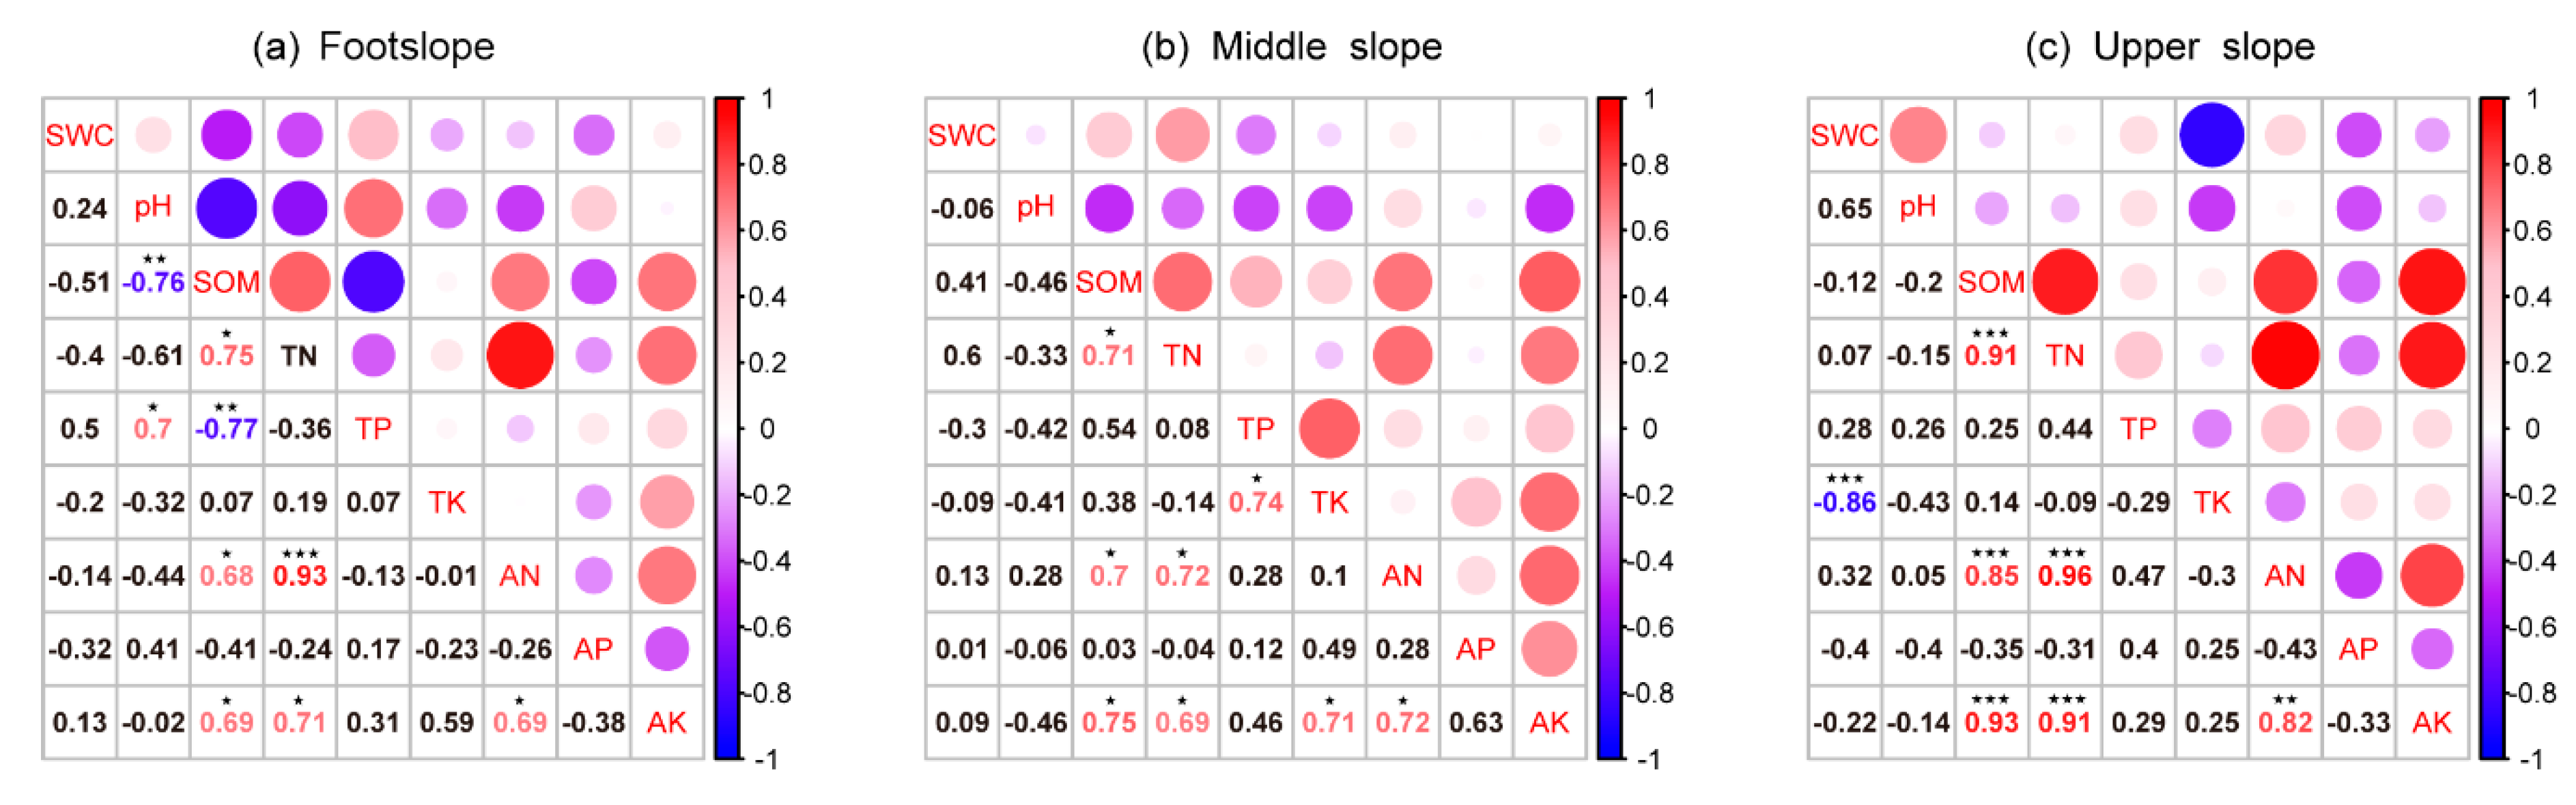
3.3. Relationships between Soil Physico-Chemical Properties at Different Slope Positions

Pearson’s correlation analysis revealed that there were no significant correlations between most of the soil physico-chemical properties, and that the correlation between soil physico-chemical properties was not consistent across the slope positions (Figure 3). However, several soil physico-chemical properties in all three slope positions showed significant correlations. For example, the soil organic matter (SOM), soil total nitrogen (TN), soil available nitrogen (AN) and soil available potassium (AK) were significantly positively correlated with each other in all three slope positions (Figure 3). Moreover, soil pH (pH) had a significantly negative and positive correlation with soil organic matter (SOM) and soil total phosphorus (TP), respectively. In addition, at the footslope, the soil pH (pH) showed significant negative and positive correlations with soil organic matter (SOM) and soil total phosphorus (TP), respectively, and soil total phosphorus (TP) was significantly negatively correlated with soil organic matter (SOM). At the middle slope, the soil total phosphorus (TP) and soil available nitrogen (AN) were significantly positively correlated with soil total potassium (TK) and soil available potassium (AK), respectively. At the upper slope, soil water content (SWC) was significantly negatively correlated with soil total potassium (TK). Apart from that, no significant correlation was found for other soil physico-chemical properties at the three slope positions.

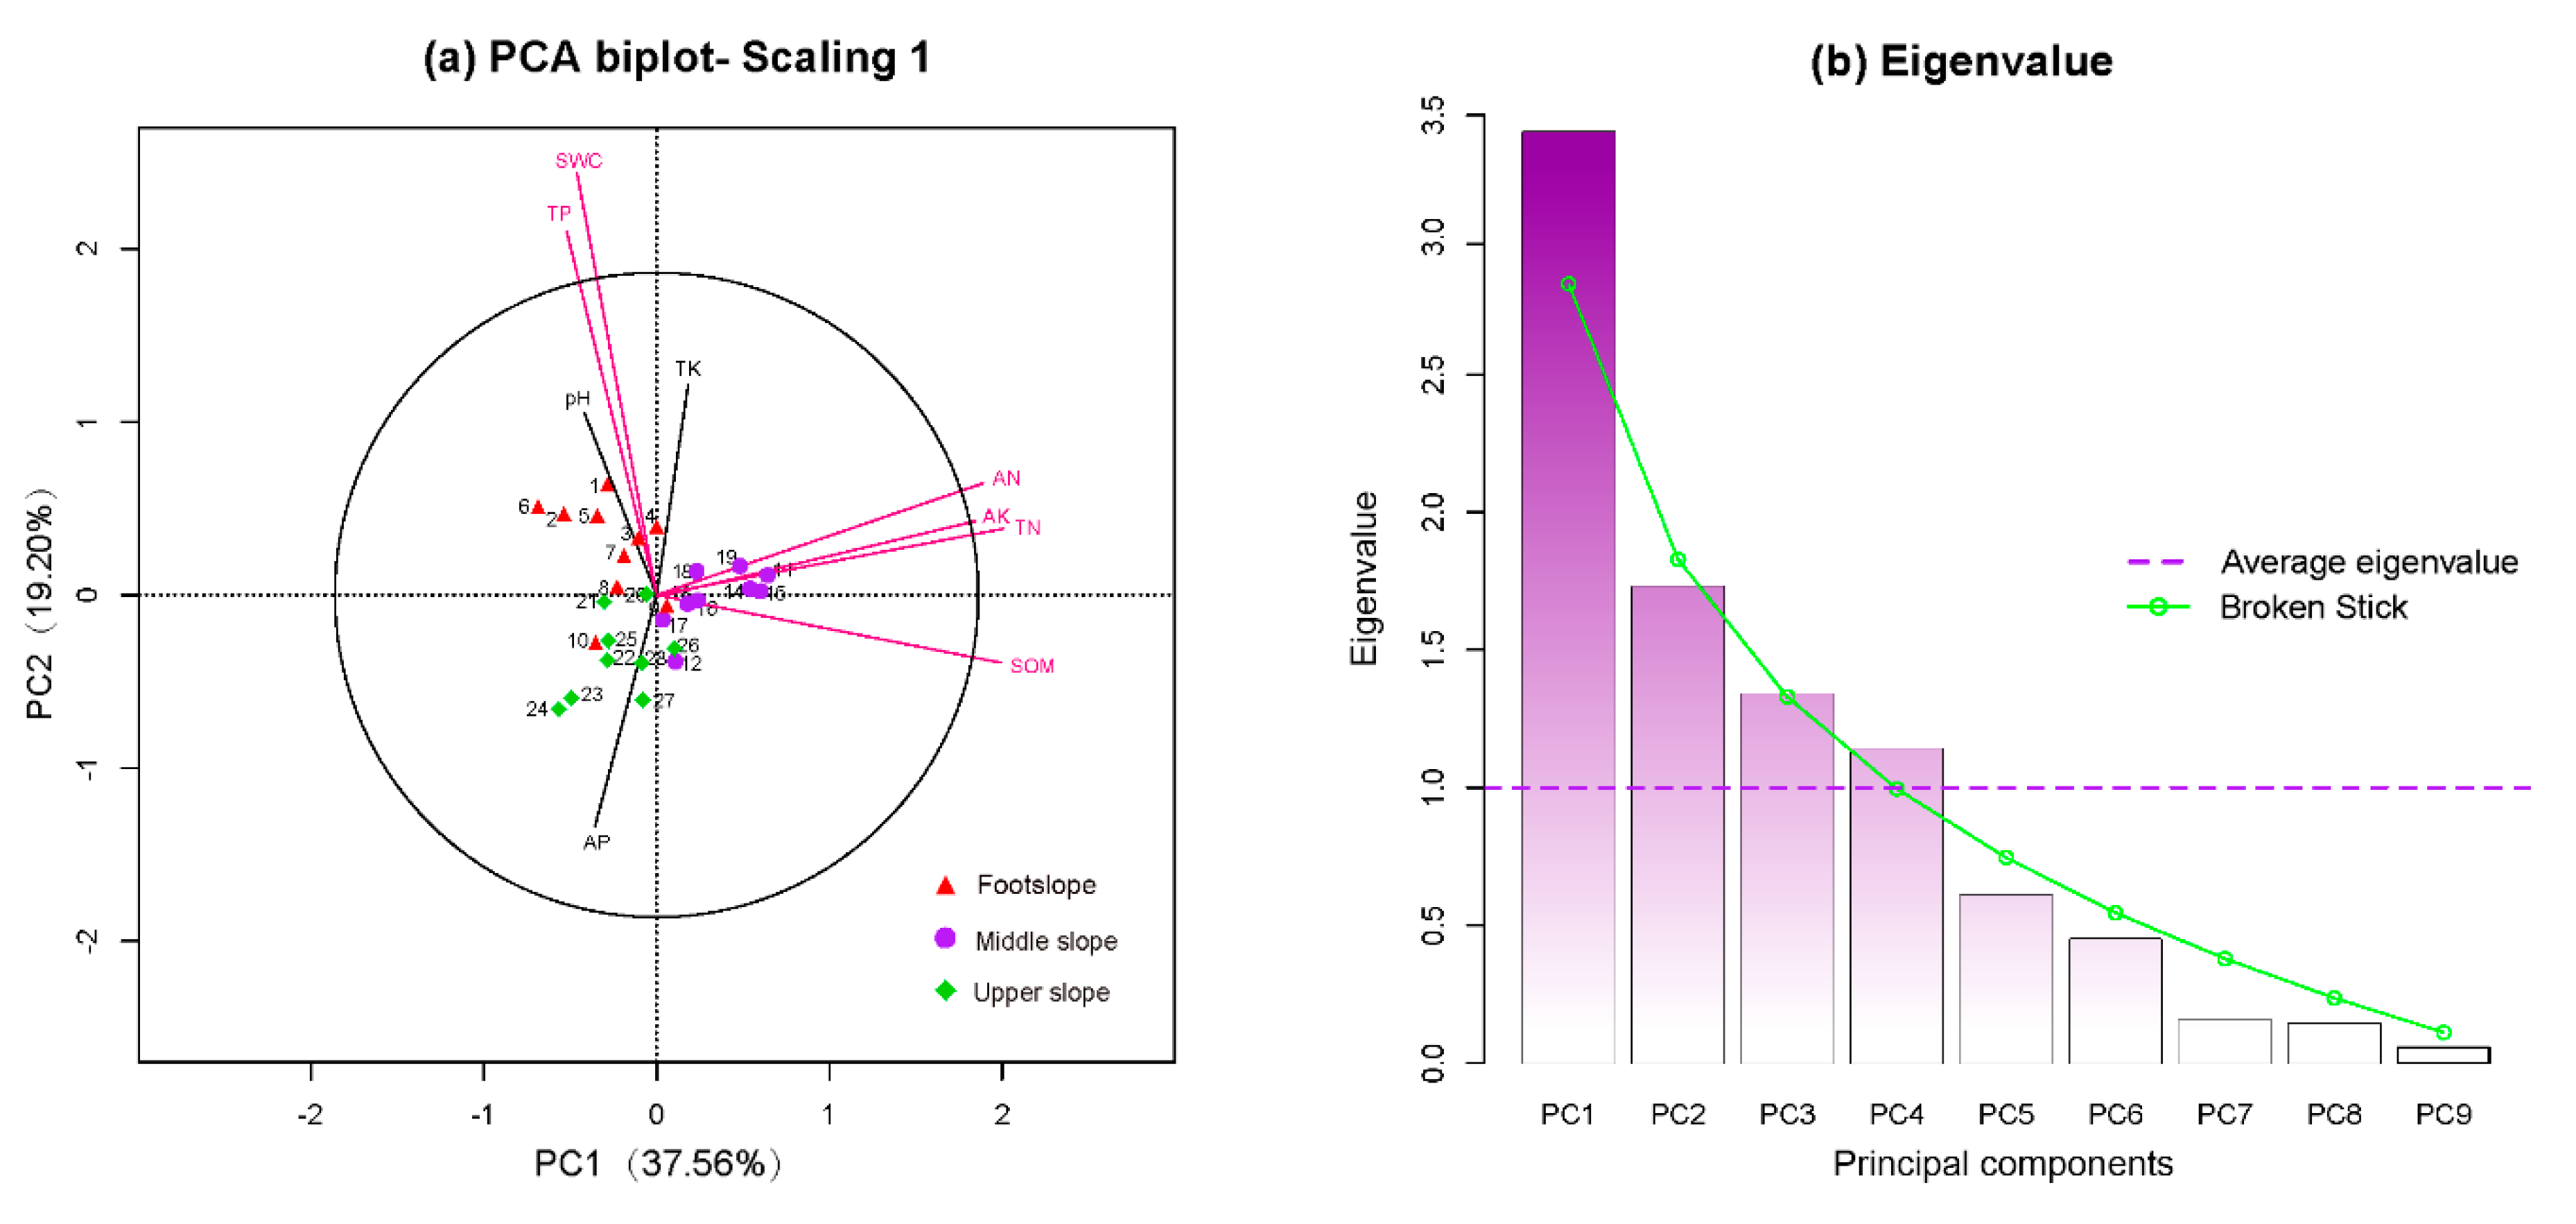
3.4. Principal Component Analysis of Soil Physico-Chemical Properties

The PCA biplots ordination diagram is called the equilibrium contribution circle, and the radius of this circle represents a variable that would contribute equally to all dimensions of the PCA space. Therefore, for any given pair of axes, the variables that have vectors longer than this radius make a higher contribution than average and can be interpreted with confidence [36]. The weights for nine original variables along the first four principal components are shown in Table 3. According to the results of the PCA ordination, the eigenvalue of the first four ordination axes was greater than 1, which can together explain 84.32% of the total variance in those properties (Figure 4, Table 3). Specifically, the first principal axis (PC1) accounted for 37.56% of the total variance and was strongly and positively related to soil total nitrogen (TN), soil organic matter (SOM), soil available nitrogen (AN) and soil available potassium (AK). The second principal component (PC2) explained 19.20% of the total variation and was strongly and positively correlated with soil water content (SWC). The third principal component (PC3) accounted for 14.89% of the total variation and showed a significant positive relationship with soil total potassium (TK). In addition, the fourth principal component (PC4) accounted for 12.67% of the total variation.

4. Discussion

4.1. Basic Characteristics of Soil Physico-Chemical Properties at Different Slope Positions

According to China’s second national soil census nutrient classification standard [37], the average content of soil organic matter, total nitrogen and available nitrogen in this study reached the first level (extremely rich), and soil total potassium and available potassium reached the fifth level (deficit), while the average soil total phosphorus and soil available phosphorus content belong to the sixth level (extremely deficient). In general, the soil pH of our study area was slightly acidic to strongly acidic, and its soil organic matter, total nitrogen and available nitrogen were relatively rich, while soil total phosphorus, available phosphorus, total potassium and available potassium were relatively deficient. Compared with the soil of the subtropical evergreen and deciduous broadleaved mixed forest in the southwestern Hubei Province, China [38], the average soil pH, soil organic matter, soil available phosphorus and soil total potassium in this study area were relatively high, while the other soil physico-chemical properties were relatively low. Similarity, compared with the soil of the evergreen broadleaved forest in Zhejiang Province, China [39], the soil pH and soil organic matter in this region were relatively high, and the soil total nitrogen and total phosphorus were relatively low, while the other soil physico-chemical properties were similar with our study.
Furthermore, descriptive statistics showed that the variable range of physico-chemical properties in the middle slope position was relatively small, while the variation at the upper slope position was relatively large. This smaller variation found in the middle slope position may be attributed to the relatively suitable environmental conditions at this slope position so that the variation of soil physico-chemical properties was relatively low. On the contrary, the environmental conditions of the upper slope position were relatively poor, with a stronger wind, stronger surface evapotranspiration and shallow soil layer, and the soil physico-chemical properties vary considerably. Moreover, soil pH has the smallest variable coefficient among all three slope positions and belongs to weak variation. These results are consistent with some studies [4] that also found that soil pH had no significant difference at different slopes. The possible reason is that soil is a huge buffer body with a self-regulating ability, which can balance the changes of the external acid and alkali environment to some extent [40]. In addition, the variable coefficient of soil available phosphorus was highest among all three slope positions, which is possibly due to the difference in aboveground vegetation composition and related physiological and ecological processes [41].

4.2. Responses of Soil Physico-Chemical Properties to Different Slope Positions

Slope position has been regarded as one of the most important abiotic factors that determine the spatial heterogeneity of soil physico-chemical properties by controlling the pedogenic process on a local scale [8]. Different slope positions lead to different influencing factors such as light, heat, water and air, and soil properties may also show differences. Specifically, the soil from the upper slope position was shallow with little capacity for moisture retention and its groundwater level was deeper, and these surfaces are exposed to intense solar radiation and strong wind, which translates into higher evapotranspiration rates; this may result in a higher risk of drought and overheating [42,43,44,45]. By contrast, the footslope position tends to constitute cooler and more humid habitats with lower solar radiation and evapotranspiration rates, and deep soils capable of accumulating surface runoff water, variables translating into habitats with low risk of drought and thermal damage [46,47,48]. For instance, Zhu et al. [49] found that lower and toe slope positions were hot spots receiving lateral surface and subsurface recharge. Our results also found that soil water content at the upper slope position was significantly lower than that at the footslope and middle slope positions. These trends are likely related to the relatively lower altitude of the footslope position, which is related to weak solar radiation and easy-to-maintain relatively high soil water content. Conversely, the upper slope position leads to stronger surface evapotranspiration due to high solar radiation, and the steeper slope contributes to the surface runoff being transported down the slope, and thus the footslope position usually has higher soil water content due to the acceptance of water from the upper slope position. Additionally, our analysis demonstrated that most of the soil physico-chemical properties showed the highest value in the middle slope position, which is consistent with other studies [11,50]. This may be attributed to the fact that the middle slope position is relatively flat among the three slope positions, and the soil from the upper slope position is heavily deposited here, and thus results in the decrease of soil nutrients. Besides, the temperature and moisture of the middle slope position are better than the upper slope position, and the light conditions are better than the footslope position. In general, the habitat conditions of the middle slope position are relatively better. This was evident from the species richness and density of woody species in the middle slope position, which reached the highest value among all three slope positions. Notably, vegetation, which plays important roles not only in reducing soil erosion but also in affecting soil nutrients cycles, is a key medium of the interactions between slope position and soil nutrients [7]. Conversely, soil physico-chemical properties resulting from modifications of slope positions could also influence the redistribution of native vegetation. Therefore, we should pay attention to the interaction between vegetation and soil in future research.

4.3. Relationships between Soil Physico-Chemical Properties

Soil physico-chemical properties, as an important indicator of soil quality, possess not only obvious differences but also interactions and close associations with each other, which jointly determine the quality characteristics of the soil [51]. According to the results above, the soil organic matter, soil total nitrogen, soil available nitrogen and soil available potassium were significantly positively correlated with each other in all three slope positions. In agreement with our results, some studies have shown that soil organic matter is a complex mixture, which influences a series of soil properties and nutrient cycling, while soil enzymes are mainly adsorbed on the soil organic matter particles or combined with humus [52]. Moreover, the soil nitrogen and potassium are mainly derived from the decomposition and mineralization of soil organic matter, and the increase of soil organic matter is beneficial to the decomposition of animal and plant residues and humus by soil enzymes, thereby releasing nitrogen and potassium [53]. Besides, soil available nitrogen is the nitrogen element that can be directly absorbed and utilized by plants, which is mainly derived from the mineralization of soil total nitrogen [54]. Therefore, the increase of soil organic matter is conducive to the accumulation of soil total nitrogen, available nitrogen and available potassium.
Furthermore, as one of the most important physico-chemical properties of soil, soil pH directly affects plant growth and microbial activities, and most plants are suitable for growth in an environment where pH is neutral [55]. Conversely, excessive pH will inhibit plant root growth, thereby reducing the accumulation of soil organic matter. Hence, suitable pH is beneficial to the decomposition of soil organic matter by microorganisms and affects the release of phosphorus [56], which may be the reason that the soil pH at the footslope position showed a significant negative and positive association with soil organic matter and soil total phosphorus, respectively. However, soil total phosphorus has a significant negative correlation with soil organic matter at the footslope position, possibly because soil organic matter is mainly wrapped in the soil clay, while the clay has a protective effect on soil organic matter, making it difficult to mineralize and easy to accumulate. Moreover, as a critical element for soil, nitrogen is usually coupled with phosphorus and potassium, so this may be attributed to the positive correlation between nitrogen, phosphorus and potassium, resulting in the soil total phosphorus and soil available nitrogen at the middle slope position showing significant positive correlation with soil total potassium and soil available potassium, respectively. These results also agree with a growing body of research that describes positive correlations between nitrogen, phosphorus and potassium [57,58]. Additionally, the soil total potassium was highly restricted by soil parent material, and the potassium resulting from weathering of parent material was converged in the surface soil through the vegetation [59,60]. Accordingly, our study found that soil total potassium at the upper slope position was negatively correlated with soil water content, which may be due to the fact that higher soil water content might change soil structure by disrupting aggregates and surface crust, thereby leading to increased soil susceptibility to water and wind erosion and stimulating soil total potassium losses.

4.4. Relationships between Different Samples and Soil Physico-Chemical Properties

Principal component analysis (PCA), one of several multivariate methods, simplifies the complexity in high-dimensional variables by geometrically projecting them onto lower dimensions called principal components (PCs), in order to find the best summary of the data using a limited number of PCs [36,61]. Our study showed that the eigenvalue of the first four ordination axes is greater than 1, which can together explain 84.32% of the total variance, which was identified as soil total nitrogen, soil available nitrogen, soil organic matter, soil available potassium, soil water content and soil total potassium. Among these ordination axes, the first principal axis accounted for 37.56% of the total variance and represented a multivariate space for soil total nitrogen, soil organic matter, soil available nitrogen and soil available potassium, and the vector lines between them have a sharp angle. This further confirmed the results of the Pearson’s correlation analysis, that is, the soil organic matter, soil total nitrogen, soil available nitrogen and soil available potassium were significantly positively correlated in all three slope positions. The second principal component explained 19.20% of the total variation and was strongly and positively correlated with soil water content. The third principal component accounted for 14.89% of the total variation and showed a significant positive relationship with soil total potassium. These findings seem to be consistent with our current research, which found that the Pearson’s correlation analysis showed that soil water content was positively correlated with soil total potassium at the upper slope position.
In addition, Principal component analysis not only visually explains the relationship between different soil physico-chemical properties, but also shows the relationship between soil physico-chemical properties and sample plots. PCA ordination results showed that the soil total phosphorus and soil water content have significant effects on the soil physico-chemical properties at the footslope position. In accordance with this result, we also found that soil total phosphorus and soil water content showed the highest content at the footslope. Meanwhile, soil total nitrogen, soil available nitrogen and soil organic matter are important soil physico-chemical properties at the middle slope. This can be clarified by the fact that the highest contents of soil total nitrogen, soil available nitrogen and soil organic matter were found at the footslope. Overall, the results of the principal component analysis are basically similar to the results of the Pearson’s correlation analysis and one-way analysis of variance, which further demonstrates the accuracy of the results of this study. As a consequence, the principal component analysis not only better reflects the relationship between the sample plots and the soil physico-chemical properties, but also the interrelationship between the sample plots and soil physico-chemical properties.

5. Conclusions

In summary, our study clearly demonstrates that the slope position showed significant effects on soil physico-chemical properties, and most of the soil physico-chemical properties showed the highest and lowest content in the middle slope position and upper slope or footslope positions, respectively. These results imply that soil physico-chemical properties should be explicitly considered to determine the impact of management practices on soil quality, and provide a reference for the species selection and vegetation layout planning in vegetation restoration and reconstruction in the hilly region. Specifically, when planting artificial forests in the hilly region, reasonable species collocation, population density and spatial structure allocation should be determined according to the differences of habitat characteristics and growth adaptability strategies of afforestation tree species in different slope positions, so that vegetation can be rationally configured to improve the utilization efficiency of plants for water, heat and nutrient resources. However, soil properties in the forest ecosystem are significantly influenced by multiple environmental factors such as land use. Hence, a further step for future studies would be required in order to clarify the complex interactive relationships among slope positions, soil properties (such as physico-chemical and biological), vegetation, land use and its history and management in this study area, as well as to develop soil physico-chemical and biological quality indicators as a tool to assist in the restoration of degraded ecosystems and sustainable land and vegetation management.

Author Contributions

S.L. and Y.J. designed and oversaw the study; R.L. and Y.P. collected the field and laboratory data; R.L. and Y.J. conducted the statistical analyses; R.L., Y.P., H.T., J.N., H.B. and W.H. wrote the first draft of the manuscript; all authors contributed critically to the drafts and approved the final manuscript. All authors have read and agreed to the published version of the manuscript.

Funding

This research was financially supported by the National Natural Science Foundation of China (31860124), the Guangxi Natural Science Foundation (2016GXNSFBA380030), and the Key Projects in the National Science and Technology Pillar Program of China during the Twelfth Five-Year Plan Period (2012BAC16B03).

Acknowledgments

We would like to sincerely thank Keying Mo, Zhiren Lu, Yuxin Huang, Caili Qin, Mingyuan Ni and many other good students and colleagues from the College of Life Science, Guangxi Normal University for their help in the field and laboratory work. We are also grateful to the editor and anonymous reviewers for insightful and constructive comments that considerably improved the earlier version of this manuscript.

Conflicts of Interest

The authors declare no conflict of interest.

References

  1. Dominati, E.; Patterson, M.; Mackay, A. A framework for classifying and quantifying the natural capital and ecosystem services of soils. Ecol. Econ. 2010, 69, 1858–1868. [Google Scholar] [CrossRef]
  2. Robinson, D.A.; Panagos, P.; Borrelli, P. Soil natural capital in Europe; a framework for state and change assessment. Sci. Rep. 2017, 7, 6706. [Google Scholar] [CrossRef] [Green Version]
  3. Mobley, M.L. Monitoring Earth’s critical zone. Science 2009, 326, 1067–1068. [Google Scholar]
  4. Khan, F.; Hayat, Z.; Ahmad, W.; Ramzan, M.; Shah, Z.; Sharif, M.; Mian, I.A.; Hanif, M. Effect of slope position on physico-chemical properties of eroded soil. Soil Environ. 2013, 32, 22–28. [Google Scholar]
  5. Umali, B.P.; Oliver, D.P.; Forrester, S.; Chittleborough, D.J.; Hutson, J.L.; Kookana, R.S.; Ostendorf, B. The effect of terrain and management on the spatial variability of soil properties in an apple orchard. Catena 2012, 93, 38–48. [Google Scholar] [CrossRef]
  6. Tsui, C.C.; Chen, Z.S.; Hsieh, C.F. Relationships between soil properties and slope position in a lowland rain forest of southern Taiwan. Geoderma 2004, 123, 131–142. [Google Scholar] [CrossRef]
  7. Yimer, F.; Ledin, S.; Abdelkadir, A. Soil property variations in relation to topographic aspect and vegetation community in the south-eastern highlands of Ethiopia. For. Ecol. Manag. 2006, 232, 90–99. [Google Scholar] [CrossRef]
  8. Hook, P.B.; Burke, I.C. Biogeochemistry in a shortgrass landscape: Control by topography, soil texture, and microclimate. Ecology 2000, 81, 2686–2703. [Google Scholar] [CrossRef]
  9. Lozano-García, B.; Parras-Alcántara, L.; Brevik, E.C. Impact of topographic aspect and vegetation (native and reforested areas) on soil organic carbon and nitrogen budgets in Mediterranean natural areas. Sci. Total Environ. 2016, 544, 963–970. [Google Scholar] [CrossRef] [PubMed]
  10. Sun, F.X.; Lu, Y.H.; Fu, B.J.; Ma, Z.M.; Yao, X.L. Spatial explicit soil moisture analysis: Pattern and its stability at small catchment scale in the loess hilly region of China. Hydrol. Process 2014, 28, 4091–4109. [Google Scholar] [CrossRef]
  11. Zhang, X.Y.; Liu, M.Z.; Zhao, X.; Li, Y.Q.; Zhao, W.; Li, A.; Chen, S.; Chen, S.P.; Han, X.G.; Huang, J.H. Topography and grazing effects on storage of soil organic carbon and nitrogen in the northern China grasslands. Ecol. Indic. 2018, 93, 45–53. [Google Scholar] [CrossRef]
  12. Begum, F.; Bajracharya, R.M.; Sharma, S.; Sitaula, B.K. Influence of slope aspect on soil physico-chemical and biological properties in the mid hills of central Nepal. Int. J. Sustain. Dev. World 2010, 17, 438–443. [Google Scholar] [CrossRef]
  13. Khormali, F.; Ayoubi, S.; Foomani, F.K.; Fatemi, A.; Hemmati, K. Tea yield and soil properties as affected by slope position and aspect in Lahijan area, Iran. Int. J. Plant Prod. 2007, 1, 245–259. [Google Scholar]
  14. Carroll, C.; Merton, L.; Burger, P. Impact of vegetative cover and slope on runoff, erosion, and water quality for field plots on a range of soil and spoil materials on central Queensland coal mines. Soil Res. 2000, 38, 313–328. [Google Scholar] [CrossRef]
  15. Turner, C.L.; Blair, J.M.; Schartz, R.J.; Neel, J.C. Soil N and plant responses to fire, topography and supplemental N in tallgrass praire. Ecology 1997, 78, 1832–1843. [Google Scholar] [CrossRef]
  16. Burke, I.C.; Lauenroth, W.K.; Riggle, R.; Brannen, P. Spatail variability of soil properties in the shortgrass steppe: The relative importance of topography, grazing, microsite, and plant species in controlling spatial patterns. Ecosystems 1999, 2, 422–438. [Google Scholar] [CrossRef]
  17. Xu, W.; Wan, S. Water- and plant-mediated responses of soil respiration to topography, fire, and nitrogen fertilization in a semiarid grassland in northern China. Soil Biol. Biochem. 2008, 40, 679–687. [Google Scholar] [CrossRef]
  18. Tateno, R.; Takeda, H. Forest structure and tree species distribution in relation to topography-mediated heterogeneity of soil nitrogen and light at the forest floor. Ecol. Res. 2003, 18, 559–571. [Google Scholar] [CrossRef]
  19. Sariyildiz, T.; Anderson, J.M.; Kucuk, M. Effects of tree species and topography on soil chemistry, litter quality, and decomposition in Northeast Turkey. Soil Biol. Biochem. 2005, 37, 1695–1706. [Google Scholar] [CrossRef]
  20. Xing, S.H.; Chen, C.R.; Zhang, H.; Zhou, B.Q.; Nang, Z.M.; Xu, Z.H. Genotype and slope position control on the availability of soil soluble organic nitrogen in tea plantations. Biogeochemistry 2010, 103, 245–261. [Google Scholar] [CrossRef]
  21. Feng, T.J.; Wei, W.; Chen, L.D.; Rodrigo-Comino, J.; Die, C.; Feng, X.R.; Ren, K.M.; Brevik, E.C.; Yu, Y. Assessment of the impact of different vegetation patterns on soil erosion processes on semiarid loess slopes. Earth Surf. Process. Landf. 2018, 43, 1860–1870. [Google Scholar] [CrossRef]
  22. Chen, Z.S.; Hsieh, C.F.; Jiang, F.Y.; Hsieh, T.H.; Sun, I.F. Relationship of soil properties to topography and vegetation in a subtropical rain forest in southern Taiwan. Plant Ecol. 1997, 132, 229–241. [Google Scholar] [CrossRef]
  23. Gou, Y.; Chen, H.; Wu, W.; Liu, H.B. Effects of slope position, aspect and cropping system on soil nutrient variability in hilly areas. Soil Res. 2015, 53, 338–348. [Google Scholar] [CrossRef]
  24. Pierson, F.B.; Mulla, D.J. Aggregate stability in the Palouse region of Washington: Effect of landscape position. Soil Sci. Soc. Am. J. 1990, 54, 1407–1412. [Google Scholar] [CrossRef]
  25. Moorman, T.B.; Cambardella, C.A.; James, D.E.; Karlen, D.L.; Kramer, L.A. Quantification of tillage and landscape effects on soil carbon in small Iowa watersheds. Soil Tillage Res. 2004, 78, 225–236. [Google Scholar] [CrossRef]
  26. Rezaei, H.; Jafarzadeh, A.A.; Alijanpour, A.; Shahbazi, F.; Kamran, K.V. Effect of slope position on soil properties and types along an elevation gradient of Arasbaran Forest, Iran. Int. J. Adv. Sci. Eng. Inf. Technol. 2015, 5, 449–456. [Google Scholar] [CrossRef] [Green Version]
  27. Gisilanbe, S.A.; Philip, H.J.; Solomon, R.I.; Okorie, E.E. Variation in soil physical and chemical properties as affected by three slope positions and their management implications in Ganye, North-Eastern Nigeria. Asian. J. Soil Sci. Plant Nutr. 2017, 2, 1–13. [Google Scholar] [CrossRef]
  28. Li, Z.W.; Zeng, G.M.; Zhang, H.; Yang, B.; Jiao, S. The integrated eco-environment assessment of the red soil hilly region based on GIS—A case study in Changsha City, China. Ecol. Model. 2007, 202, 540–546. [Google Scholar] [CrossRef]
  29. Chen, J.; Xiao, H.B.; Li, Z.W.; Liu, C.; Wang, D.Y.; Wang, L.X.; Tang, C.J. Threshold effects of vegetation coverage on soil erosion control in small watersheds of the red soil hilly region in china. Ecol. Eng. 2019, 132, 109–114. [Google Scholar] [CrossRef]
  30. Hou, X.L.; Han, H.; Tigabu, M.; Cai, L.P.; Meng, F.R.; Liu, A.Q.; Ma, X.Q. Changes in soil physico-chemical properties following vegetation restoration mediate bacterial community composition and diversity in Changting, China. Ecol. Eng. 2019, 138, 171–179. [Google Scholar] [CrossRef]
  31. Soil Survey Staff. Keys to Soil Taxonomy, 12th ed.; USDA-Natural Resources Conservation Service: Washington, DC, USA, 2014. [Google Scholar]
  32. Marriott, C.A.; Hudson, G.; Hamilton, D.; Neilson, R.; Boag, B.; Handley, L.L.; Wishart, J.; Scrimgeour, C.M.; Robinson, D. Spatial variability of soil total C and N and their stable isotopes in an upland Scottish grassland. Plant Soil 1997, 196, 151–162. [Google Scholar] [CrossRef]
  33. Bao, S.D. Soil Agricultural and Chemical Analysis, 3rd ed.; China Agriculture Press: Beijing, China, 2008. [Google Scholar]
  34. R Development Core Team. R: A Language and Environment for Statistical Computing, 3.4.2 ed.; R Foundation for Statistical Computing: Vienna, Austria, 2017. [Google Scholar]
  35. Oksanen, J.; Blanchet, F.G.; Friendly, M.; Kindt, R.; Legendre, P.; McGlinn, D.; Minchin, P.R.; O’ Hara, R.B.; Simpson, G.L.; Solymos, P.; et al. Vegan: Community Ecology Package. R package version 2.4-0. 2016. Available online: https://cran.r-project.org/src/contrib/Archive/vegan_2.4-0.tar.gz (accessed on 25 May 2017).
  36. Borcard, D.; Gillet, F.; Legendre, P. Numerical Ecology with R, 2nd ed.; Springer Press: New York, NY, USA, 2018. [Google Scholar]
  37. Chinese National Soil Survey Office (CNSSO). China Soil; China Agriculture Press: Beijing, China, 1998. [Google Scholar]
  38. Feng, G.; Ai, X.R.; Zang, R.G.; Ding, Y. Soil characteristics under different community types in the subtropical evergreen and deciduous broad-leaved mixed forest in southwest Hubei. J. Nat. Res. 2016, 31, 1173–1184. [Google Scholar]
  39. Zhang, N.; Wang, X.H.; Zheng, Z.M.; Ma, Z.P.; Yang, Q.S.; Fang, X.F.; Xie, Y.B. Spatial heterogeneity of soil properties and its relationships with terrain factors in broadleaved forest in Tiantong of Zhejiang Province, East China. Chin. J. Appl. Ecol. 2012, 23, 2361–2369. [Google Scholar]
  40. Ma, Q.; Zhao, G.X. Effects of different land use types on soil nutrients in intensive agricultural region. J. Nat. Res. 2010, 25, 1834–1844. [Google Scholar]
  41. Zhang, S.L.; Jiang, L.L.; Liu, X.B.; Zhang, X.Y.; Fu, S.C.; Dai, L. Soil nutrient variance by slope position in a Mollisol farmland area of Northeast China. Chin. Geogr. Sci. 2015, 26, 508–517. [Google Scholar] [CrossRef]
  42. McNab, W.H. A topographic index to quantify the effect of mesoscale landform on site productivity. Can. J. For. Res. 1993, 23, 1100–1107. [Google Scholar] [CrossRef]
  43. Galicia, L.; Lopez-Blanco, J.; Zarco-Arista, E.A.; Filips, V.; Garcıa-Oliva, F. The relationship between solar radiation interception and soil water content in a tropical deciduous forest in Mexico. Catena 1999, 36, 153–164. [Google Scholar] [CrossRef]
  44. Wang, L.; Wei, S.P.; Robert, H.; Shao, M.A. Effects of vegetation and slope aspect on water budget in the hill and gully region of the Loess Plateau of China. Catena 2011, 87, 90–100. [Google Scholar] [CrossRef]
  45. Ebel, B.A. Simulated unsaturated flow processes after wildfire and interactions with slope aspect. Water Resour. Res. 2013, 49, 8090–8107. [Google Scholar] [CrossRef]
  46. Holland, P.; Steyn, D. Vegetational responses to latitudinal variations in slope angle and aspect. J. Biogeogr. 1975, 2, 179–183. [Google Scholar] [CrossRef]
  47. Daws, M.I.; Mullins, C.E.; Burslem, D.F.; Paton, S.R.; Dalling, J.W. Topographic position affects the water regime in a semideciduous tropical forest in Panamá. Plant Soil 2002, 238, 79–89. [Google Scholar] [CrossRef]
  48. Méndez-Toribio, M.; Ibarra-Manríquez, G.; Navarrete-Segueda, A.; Paz, H. Topographic position, but not slope aspect, drives the dominance of functional strategies of tropical dry forest trees. Environ. Res. Lett. 2017, 12, 085002. [Google Scholar] [CrossRef]
  49. Zhu, Q.; Nie, X.F.; Zhou, X.B.; Liao, K.H.; Li, H. Soil moisture response to rainfall at different topographic positions along a mixed land-use hillslope. Catena 2014, 119, 61–70. [Google Scholar] [CrossRef]
  50. Wei, X.R.; Shao, M.A.; Fu, X.L.; Horton, R. Changes in soil organic carbon and total nitrogen after 28 years grassland afforestation: Effects of tree species, slope position, and soil order. Plant Soil 2010, 331, 165–179. [Google Scholar] [CrossRef]
  51. García-Ruiz, R.; Ochoa, V.; Vinegla, B.; Hinojosa, M.B.; Pena-Santiago, R.; Liebanas, G.; Linares, J.C.; Carreira, J.A. Soil enzymes, nematode community and selected physico-chemical properties as soil quality indicators in organic and conventional olive oil farming: Influence of seasonality and site features. Appl. Soil Ecol. 2009, 41, 305–314. [Google Scholar] [CrossRef]
  52. Loveland, P.; Webb, J. Is there a critical level of organic matter in the agricultural soils of temperate regions: A review. Soil Tillage Res. 2003, 70, 1–18. [Google Scholar] [CrossRef]
  53. Six, J.; Conant, R.T.; Paul, E.A.; Paustian, K. Stabilization mechanisms of soil organic matter: Implications for C-saturation of soils. Plant Soil 2002, 241, 155–176. [Google Scholar] [CrossRef]
  54. Liu, Y.; He, N.P.; Wen, X.F.; Yu, G.R.; Gao, Y.; Jia, Y.L. Patterns and regulating mechanisms of soil nitrogen mineralization and temperature sensitivity in Chinese terrestrial ecosystems. Agric. Ecosyst. Environ. 2016, 215, 40–46. [Google Scholar] [CrossRef]
  55. Simek, M.; Cooper, J.E. The influence of soil pH on denitrification: Progress towards the understanding of this interaction over the last 50 years. Eur. J. Soil Sci. 2002, 53, 345–354. [Google Scholar] [CrossRef]
  56. Yu, Y.C.; Yang, J.Y.; Zeng, S.C.; Wu, D.M.; Jacobs, D.F.; Sloan, J.L. Soil pH, organic matter, and nutrient content change with the continuous cropping of Cunninghamia lanceolata, plantations in South China. J. Soil Sediments 2017, 17, 2230–2238. [Google Scholar] [CrossRef]
  57. Sarooshi, R.; Weir, R.; Barchia, I. Soil pH, extractable phosphorus, and exchangeable cations as affected by rates of fertiliser nitrogen, phosphorus, and potassium applied over several years to Valencia orange trees. Aust. J. Exp. Agric. 1994, 34, 419–425. [Google Scholar] [CrossRef]
  58. Baribault, T.W.; Finley, K.A.O. Tropical tree growth is correlated with soil phosphorus, potassium, and calcium, though not for legumes. Ecol. Monogr. 2012, 82, 189–203. [Google Scholar] [CrossRef]
  59. Pietsch, D.; Mabit, L. Terrace soils in the Yemen Highlands: Using physical, chemical and radiometric data to assess their suitability for agriculture and their vulnerability to degradation. Geoderma 2012, 185–186, 48–60. [Google Scholar] [CrossRef]
  60. Zhang, Y.; Tigabu, M.; Yi, Z.G.; Li, H.T.; Zhuang, Z.; Yang, Z.; Ma, X.Q. Soil parent material and stand development stage effects on labile soil C and N pools in Chinese fir plantations. Geoderma 2019, 338, 247–258. [Google Scholar] [CrossRef]
  61. Lever, J.; Krzywinski, M.; Altman, N. Principal component analysis. Nat. Methods 2017, 14, 641–642. [Google Scholar] [CrossRef] [Green Version]
Figure 1. Sketch map of the location of the study area and sampling sites in the hilly region, Guilin, southwest China.
Sustainability 12 01303 g001
Figure 2. Changes of soil physico-chemical properties at different slope positions. (A), SWC: Soil water content; (B), pH: Soil pH; (C), SOM: Soil organic matter; (D), TN: Soil total nitrogen; (E), TP: Soil total phosphorus; (F), TK: Soil total potassium; (G), AN: Soil available nitrogen; (H), AP: Soil available phosphorus; (I), AK: Soil available potassium. Error bars show 1 SE (the footslope, middle slope and upper slope are n = 10, n = 9 and n = 9, respectively). In each panel, boxes with different letters on top of the bars represent a significant difference at p < 0.05.
Sustainability 12 01303 g002
Figure 3. Correlation coefficients matrix of Pearson’s correlation analysis of soil physico-chemical properties at different slope positions. *, **, and *** indicate significant correlation at p < 0.05, < 0.01 and < 0.001, respectively; figures without * indicate p > 0.05, i.e., no significant correlation. The color scale and circle size both represent Pearson’s correlation coefficients as shown in the lower left corner. Abbreviations of soil physico-chemical properties are detailed in Figure 2.
Sustainability 12 01303 g003
Figure 4. PCA biplots and scree plot and broken stick model of soil physico-chemical properties at different slope positions. The diagram on the left is a PCA ordination biplot by using scaling = 1 with a focus on samples. The sampling plots are indicated by different symbols with different numbers. Specifically, 1–10 represent the sample plots of the footslope position (red triangle); 11–19 represent the sample plots of the middle slope position (purple circle); 20–28 represent the sample number of the upper slope position (green diamond). Abbreviations of soil physico-chemical properties are detailed in Figure 2. The variables that have vectors longer than the radius of the equilibrium contribution circle are shown by pink line. The intersection angle between vector lines shows significant correlations between its corresponding variables, in which a sharp angle represents positive correlation, an obtuse angle represents negative correlation and a right angle represents no significant correlation relationship. Moreover, the right diagram is a scree plot and broken stick model to help compare the real eigenvalues with null model values generated by the broken stick model (green broken line) and mean eigenvalues (Keiser–Guttman criterion, purple horizontal line).
Sustainability 12 01303 g004
Table 1. Basic information on each of the sample sites at different slope positions.
Slope PositionsGeographic PositionElevation Range (m)Slope Degree Range (°)Number of PlotsDominant Species
Footslope25°05’23.33” N 110°17’37.48” E195–20913–1810Pinus massoniana var. Massoniana − Rhododendron molle + Ficus hirta
Middle slope25°05’16.96” N 110°17’38.68” E270–2857–129Pinus massoniana var. Massoniana − Melastoma candidum + Schima superba
Upper slope25°05’06.17” N 110°17’43.65” E355–37217–219Pinus massoniana var. Massoniana − Melastoma candidum + Schima superba
Table 2. Descriptive statistics of soil physico-chemical properties at different slope positions.
Slope PositionsSoil Physico-C hemical PropertiesMinimumMaximumMeanMedianVarianceStandard DeviationSkewness CoefficientKurtosis CoefficientCoefficient of Variance (%)
FootslopeSoil water content (SWC, %)15.3124.2920.3819.788.852.97−0.06−1.4414.59
Soil pH (pH)4.215.064.524.480.090.290.51−1.276.47
Soil organic matter (SOM, g kg−1)41.1777.5158.3558.1594.029.700.18−0.3616.62
Soil total nitrogen (TN, g kg−1)1.582.271.911.930.050.230.02−1.4412.21
Soil total phosphorus (TP, g kg−1)0.130.400.270.280.010.090.01−1.4033.76
Soil total potassium (TK, g kg−1)4.209.867.427.632.621.62−0.49−0.7221.83
Soil available nitrogen (AN, mg kg−1)127.31186.67154.68150.00432.2720.790.26−1.4613.44
Soil available phosphorus (AP, mg kg−1)0.284.531.451.211.681.291.190.4289.51
Soil available potassium (AK, mg kg−1)45.0992.0266.1465.77183.3113.540.32−0.8220.47
Middle slopeSoil water content (SWC, %)10.0820.8113.3912.529.423.071.380.9622.92
Soil pH (pH)4.364.714.584.590.010.10−0.950.202.15
Soil organic matter (SOM, g kg−1)73.6698.5586.5185.4088.199.39−0.03−1.6810.86
Soil total nitrogen (TN, g kg−1)1.963.262.492.480.160.390.46−0.9115.80
Soil total phosphorus (TP, g kg−1)0.090.280.180.180.000.05−0.01−0.6528.88
Soil total potassium (TK, g kg−1)4.1310.286.906.774.292.070.18−1.3330.00
Soil available nitrogen (AN, mg kg−1)165.34247.01198.11191.30598.6924.470.59−0.7412.35
Soil available phosphorus (AP, mg kg−1)0.384.172.682.821.211.10−0.63−0.3741.19
Soil available potassium (AK, mg kg−1)66.8699.0788.3495.79151.1712.30−0.72−1.3213.92
Upper slopeSoil water content (SWC, %)3.6312.157.095.9210.523.240.48−1.7045.75
Soil pH (pH)4.354.944.534.450.050.210.85−1.004.71
Soil organic matter (SOM, g kg−1)45.28174.1879.1664.131577.8039.721.410.7650.18
Soil total nitrogen (TN, g kg−1)1.294.261.991.750.770.881.811.9744.02
Soil total phosphorus (TP, g kg−1)0.160.260.210.210.000.04−0.04−1.9919.03
Soil total potassium (TK, g kg−1)2.547.115.376.102.781.67−0.51−1.4831.07
Soil available nitrogen (AN, mg kg−1)114.01253.45152.79143.601833.4042.821.280.5528.02
Soil available phosphorus (AP, mg kg−1)0.3610.482.871.4712.373.521.22−0.23122.54
Soil available potassium (AK, mg kg−1)57.52115.1873.7072.83294.5217.161.390.9423.29
Table 3. The loadings and explained variance for nine original variables in the first four principal components in the principal component analysis (PCA). Eigenvalues for the most important variables (with absolute values higher than 1.0) in the PCA are shown in bold font.
Soil Physico-Chemical PropertiesPrincipal Components
PC1PC2PC3PC4
Soil water content (SWC)−0.28191.0665−0.02750.4477
Soil pH (pH)−0.25600.4605−0.8252−0.7234
Soil organic matter (SOM)1.2214−0.1717−0.0572−0.0273
Soil total nitrogen (TN)1.23070.1679−0.1392−0.0223
Soil total phosphorus (TP)−0.31870.91960.1383−0.6287
Soil total potassium (TK)0.11170.53131.11270.0061
Soil available nitrogen (AN)1.15720.2826−0.2226−0.0362
Soil available phosphorus (AP)−0.2191−0.58700.4825−0.8494
Soil available potassium (AK)1.09650.18220.2784−0.3633
Eigenvalue3.38031.72791.34031.1403
Proportion explained (%)37.5619.2014.8912.67
Cumulative proportion (%)37.5656.7671.6584.32

