Article

Evaluation of Agricultural Sustainability on a Mixed Vineyard and Olive-Grove Farm in Southern Spain through the INSPIA Model

by
Paula Triviño-Tarradas
1,*,
Pilar Carranza-Cañadas
1,
Francisco-Javier Mesas-Carrascosa
1 and
Emilio J. Gonzalez-Sanchez
2,3
1
Departamento de Ingeniería Gráfica y Geomática, Universidad de Córdoba, 14014 Córdoba, Spain
2
Departamento de Ingeniería Rural, ETSIAM, Universidad de Córdoba, 14014 Córdoba, Spain
3
Asociación Española Agricultura de Conservación. Suelos Vivos—European Conservation Agriculture Federation (AEAC.SV-ECAF), 14004 Córdoba, Spain
*
Author to whom correspondence should be addressed.
Sustainability 2020, 12(3), 1090; https://doi.org/10.3390/su12031090
Submission received: 13 December 2019 / Revised: 24 January 2020 / Accepted: 31 January 2020 / Published: 4 February 2020
(This article belongs to the Special Issue Suitable Agronomic Techniques for Sustainable Agriculture)

Abstract

:
The volume of the food produced across the world should be related to agricultural sustainability and is crucial for natural capital protection. Hence, sustainability assessment on farms and the identification of improvements is relevant. A mixed farm of vineyard and olive trees was chosen for sustainability assessment, based on the Best Management Practices (BMPs) that have been implemented. The aim of this research was to assess sustainability on a mixed vineyard and olive-grove farm and validate the INSPIA model for this kind of typology of a farm, which is very typical in the South of Spain. The sustainability assessment was monitored across 5-agricultural seasons based on the INSPIA methodology. INSPIA is based on the application of a set of BMPs, calculated on 31 basic indicators, providing a final composite index of sustainability. The greater the implementation of sustainable farming practices, the higher the value of the composite index. Enhanced soil, water, and air quality, improvement for biodiversity and for ecosystem services help towards sustainable agricultural productivity. Indicators’ results are shown during that period, depicting their relationship with the BMPs. The highest composite index was reached in the 4th year. This paper confirms the relevance of BMPs, such as groundcover establishment and minimum soil disturbance to upgrade sustainability on the permanent croplands in Southern Spain. The indicator-based sustainability assessment is considered a helpful tool in decision-making, which guides farmers towards BMPs performance.

1. Introduction

1.1. Agricultural Sustainability Assessment

There is a broad consensus that sustainability, in the agricultural sector, could be based on a set of Best Management Practices (BMPs) that are economically viable, environmentally safe, and socially acceptable. Agricultural sustainability aims to create a system that is capable of meeting the needs of the present without compromising future generations with regard to food, feed and fibre production [1], and preserving the initial characteristics over the time [2].
In this context, there are some successful initiatives to monitor specific issues in agricultural systems, such as soil quality [3] or water quality [4]. However, there are not many holistic approaches, among stakeholders, that take into account a multi-disciplinary aspect for agricultural sustainability assessment [5,6]. Despite the difficulties in assessing agricultural sustainability, since 1987, when the first discussions on sustainable agriculture appeared [7], numerous attempts to measure agricultural sustainability have been raised and developed on a different scale, e.g., the Indicateurs de Durabilité des Exploitations Agricoles-IDEA method [8], the SOSTARE model [9] or the Initiative for Sustainable Productive Agriculture-INSPIA model [10] measuring sustainability at the farm-level. Others are found in the literature, such as the Sustainability Assessment of farming and the Environment-SAFE framework [11], measuring sustainability at the regional and national levels. Some of these initiatives tackle the three main dimensions of sustainability: economic, social and environmental, such as for instance: SAFE, Multicriteria Assessment of the Sustainability of Cropping Systems-MASC 2.0. [12], Sustainable Agri-Food Evaluation methodology-SAEMETH [13], IDEA, Monitoring Tool for Integrated Farm Sustainability-MOTIFS [14], whereas others, pay attention to just one or two of the aforementioned aspects, e.g., INDIGO method [15], which is only based on the environmental dimension, or the SOSTARE models which are lacking in their social dimension.
These tools help farmers monitor their farm sustainability, year by year, helping them with their decision-making, and allowing them to improve their performance in the field, through the implementation of a set of BMPs that improve the farmed environment for biodiversity and protect and enhance the natural capital on which productivity relies [10].
Any cropland should be committed to sustainability these days [16]. It is therefore important, to conduct the work research over different types of farms (annual crops and permanent crops). In this context, the aim of this paper is to evaluate the farming management carried out on a mixed farm (vineyard and olive trees) in the last five agricultural seasons (from 2013/2014 to 2017/2018) and validate the INSPIA methodology for key permanent crops in Southern Spain.

1.2. The Relevance of the Permanent Cropped Land in Spain

The wine and the olive sector are of great relevance to the economy of Spain [17,18]. This importance is not only due to the extended areas dedicated to grapevine cultivation and much more to the olive oil production, but also for their well-recognised worldwide quality. Apart from the economic impact, the olive-oil and wine sector have also a social and cultural impact in Southern Spain. Of the cropped land of Andalusia, 55.2% concerns permanent crops. Andalusia is the leader in the growth of olive oil, which has more than 1.5 million hectares of land distributed among 190,000 holdings. These Andalusian acreages produce 28% of the world’s olive-oil production and nearly 80% of the Spanish production [19]. According to the data from the last agrarian census, about 250,000 families depend on this sector, and this accounts for 40% of the total of Agricultural employment [20]. Despite the less importance of the Andalusian wine sector (3.2% of the total in about 9000 holdings), [19], it ranks eighth in national wine production with 6.1 million tonnes of grapes [21], reflecting the 3.4% of the national wine production [22]. The economic value of wine production, which is marketed and sold in Andalusia, represents 55.5% of the rest of the current quality figures such as olive-oil, hams and fruits among other products [23].

1.3. Conventional Farming Practices and Their Environmental Problems

Nowadays, many of the agrarian ecosystems in Andalusia undergo severe erosion and degradation of soil, due to inappropriate agricultural practices. More than 12.5% of the soils are classified with a high (50–100 t ha−1 yr−1) and very high (> 100 t ha−1 yr−1) erosion rate [24]. In the Mediterranean area, most of the soil dedicated to permanent crops are vulnerable to soil erosion [25]. Inappropriate agricultural practices have accelerated soil degradation and are considered the main cause of soil fertility decreases. Soils of olive groves and vineyards are usually managed by tillage, causing organic matter depletion and soil structure degradation [26]. In this context, and thanks to the agri-environmental schemes of former EU agricultural policies [27], the establishment of groundcovers for permanent crops was introduced into the Andalusia region. Indeed, this practice means a starting point for many authors thinking that sustainability starts from the presence of grass in between the permanents tree lines [2,28]. Certainly, covering the soil surface with grass is a common practice for steep slopes in Northern countries but not everywhere. In Spain, implementing groundcovers in permanent crops is not an extended practice despite their environmental benefits [29]. This farming practice was increasingly gaining popularity due to a large number of benefits it generates because of its implementation. Some of the data to bear in mind are the increase in the establishment of groundcovers in permanent crops had in the last seven years (more than 23%), [21,30], prevailing spontaneous vegetation [31]. Nowadays, 42% and 11.36% of the olive orchards and vineyards respectively are under these kinds of soil management [21]. Ibañez et al. (2011) [32] highlighted the groundcovers as the most suitable management systems for vineyards, due to the manifold benefits.
Agricultural policies progressively address agricultural competitiveness, environmental conservation and social equity. In this context, the next Common Agricultural Policy (CAP) for the members countries in the European Union that will be established beyond 2021, aims to be responsible in order to consider the current challenges, such as climate change and the need to feed the world’s growing population foreseen by 2050 [33], while also continuing to support farmers for farming sustainable. Therefore, policies should reward farmers in implementing effective soil-management practices that take care of natural resources [34], shifting away from conventional production systems to more sustainable ones.
To the best of our knowledge, some traditional soil-management practices which are implemented in the farming sector do not lead on to the best sustainability indexes. e.g., conventional tillage-based practices have largely caused land degradation, water run-off increases and soil erosion, and the vulnerability of agriculture to extreme climatic events [35].
The farmers’ mindset is not likely to easily change and sometimes, making changes is difficult for this population of the rural society [36]. For this purpose, farmers’ decision-making should be facilitated by taking into account the results coming from any of the solid sustainability assessment tools. Obtaining these results and indexes enable improvement of agricultural and environmental policies from the policy-makers’ perspective. The novelty of this research concerns the comparison of different soil managements and other farming practices (BMPs) in permanent crops. These crops sustainability can be assessed based on the indicators, which will serve for the roadmap elaboration for guiding farmers towards more sustainable performance.
The aim of this paper is to show the evolution of sustainability in the typical cropped farms of olive-groves and vineyards in Southern Spain according to different soil-management practices using the INSPIA model. Both crops comprise almost 83% of the Andalusian woody crops [21], and its area, at a national level, shows an upward positive trend of 1.15% within the last two years [37]. Likewise, an important goal of this paper is to identify and propose the BMPs that farmers could implement to enhance farming sustainability, monitoring it from the three significant factors (economic, social and environmental) at farm level.

2. Materials and Methods
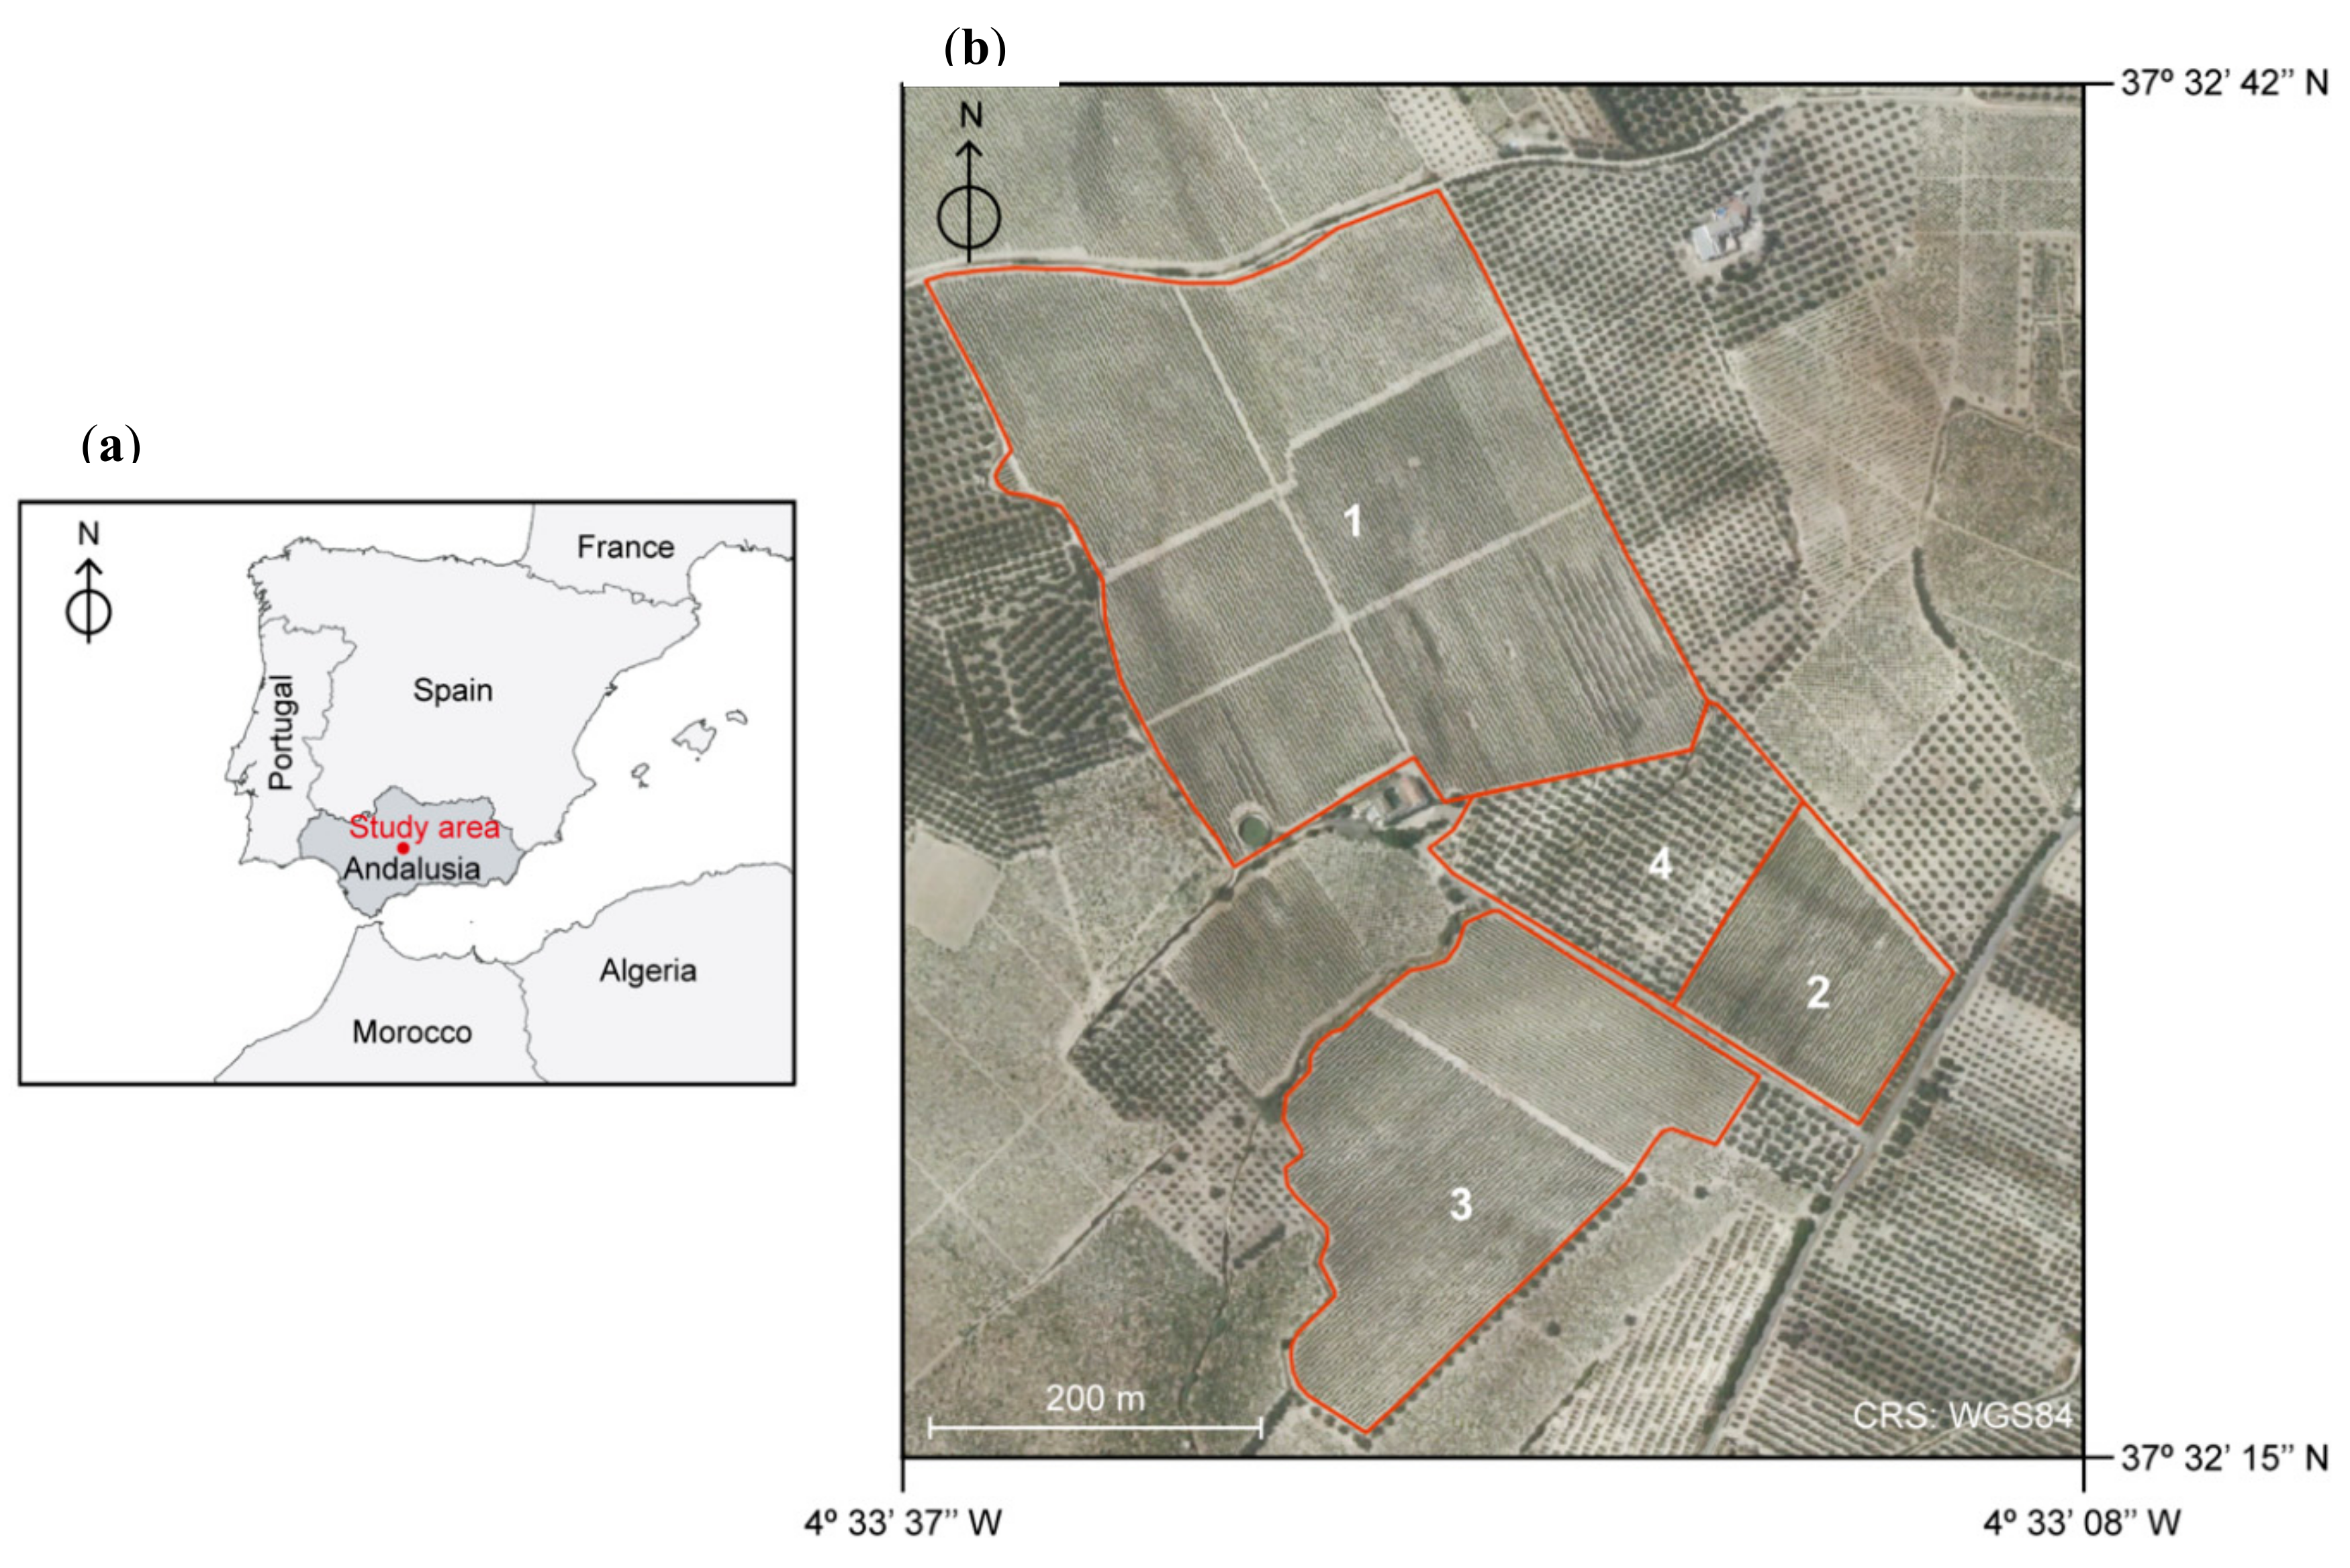
2.1. Study Farm

For this study, a typical average farm of vineyard and olive-groves was selected as a role-model farm. The farm selected and assessed in this study is the one so-called ‘Lagar Cañada Navarro’. This is a mixed farm of 20.16 ha of vineyard and olive trees located in Montilla, South of the province of Cordoba (Spain): 37°32´29.09” N, 04°33´24.59” W according to the WGS84 geodesic system (Figure 1a). Montilla is one of the seventeen townships that fully or partially conform to the appellation of origin of wine Montilla-Moriles, regulated in its own regulation [38]. There are 18.01 ha. of rainfed vineyard on trellises with a 2.90 × 1.20 m of plantation frame and 2.11 ha of irrigated olive trees, with a plantation frame of 8 × 8 m (Figure 1b).
The climate in the area is semi-continental Mediterranean, with hot and dry summers, and short and relatively mild winters [39]. The average annual precipitation is between 500 and 566 mm (20 years). Temperature data are shown in Table 1, for the two closest weather stations ‘Doña Mencía’ and ‘Cordoba Aeropuerto’ [40].

2.2. Method of Sustainability Assessment

Among the different methodologies found in the literature to measure sustainability, the selected one was the INSPIA model, due to its wide thematic scope. The INSPIA model takes into account multi-dimensional aspects such as economic, social and environmental aspects. It addresses these three sustainability dimensions and the feasibility of obtaining a well-balanced composite index [10]. Indicator-values derive from what farmers do in their fields. They are mostly based on the level of how the BMPs have been implemented. Indicators are tools which assess the status of sustainability, highlighting what needs to be changed to enhance sustainability. The INSPIA model is a holistic approach to assessing agricultural sustainability at the farm level. In this context, INSPIA measures the direct effects of certain BMPs on the farm, such as ‘soil cover rate’, ‘organic matter content’ or ‘crop diversity’. However, INSPIA also measures indirect effects on the whole farm, stemming from these BMPs, such as ‘biodiversity’ changes, ‘soil erosion risks’, ‘greenhouse gas balance’ or ‘farmers’ satisfaction index’, which should be evaluated within a multidisciplinary approach, that takes into account economic and social aspects.
The performance of these BMPs is monitored through a tailored set of 31 open-source basic indicators, that have been developed, aggregated and weighted by a panel of experts, covering the three main thematic dimensions of sustainable development [41,42]. The correspondent calculation formula and definition of each basic indicator can be found on the website www.inspia-europe.eu [43].
Each basic indicator has a measurement unit, therefore, a normalisation procedure is needed in order to make it operational. Basic indicators are transformed into a non-dimensional value between 0–100. Once indicators are normalised, the weighting and subsequent aggregation operations are conducted to obtain the final composite INSPIA index. Indeed, to understand sustainability giving an aggregate indicator is, by far, much more interesting than providing an isolated value of a basic indicator [44].
In order to address a balance, agreed by many authors [14,45], the INSPIA approach is based on the equality of the three mentioned sustainability dimensions. This equality is intrinsically developed in the methodology with the explicit end-result of unifying an overall integral vision (Figure 2).
The way of showing farm sustainability grade for INSPIA, alike other indicators-based sustainability assessments, is providing a composite index scaled between 0–100. INSPIA methodology is fully described in Triviño-Tarradas et al. (2019) [10].

2.3. Data Collection

The study farm considered was annually monitored from the 2013/2014 agricultural season to 2017/2018. Every year, a technician visited the farm, performed an interview with the farmer and conducted a survey at the end of the season, to collect soil and field-crops’ data ‘operation-related’. The data collected enabled the ability to calculate the set of basic and aggregated indicators, and finally the composite index of sustainability. In the end, the more data that was made available and compiled by the technician, the more accurate the sustainability index extracted from the INSPIA methodology.

2.4. BPMs Implementation Assessment through Sustainability Indicators

The whole farm management e.g., crop and soil management, input management and its application, and some BMPs aimed at environmental improvements and natural capital protection are annually monitored. The resulting INSPIA composite index and the value of the basic indicators are also inter-related to the number of BMPs utilised by each farmer, as it will be justified on the results [10]. Indeed, the sustainable performance of the farm is affected by the number of BMPs implemented. Therefore, the increase of the final INSPIA composite index is due to the greater implementation of some of the BMPs.
The farming practices implementation rate was monitored by asking directly to the farmer in the physical interview, about the level of implementation of each BMP over three agricultural seasons (2013/2014, 2015/2016, and 2016/2017). This ratio ranges from 0 (non-implemented) to 10 (fully implemented).

3. Results

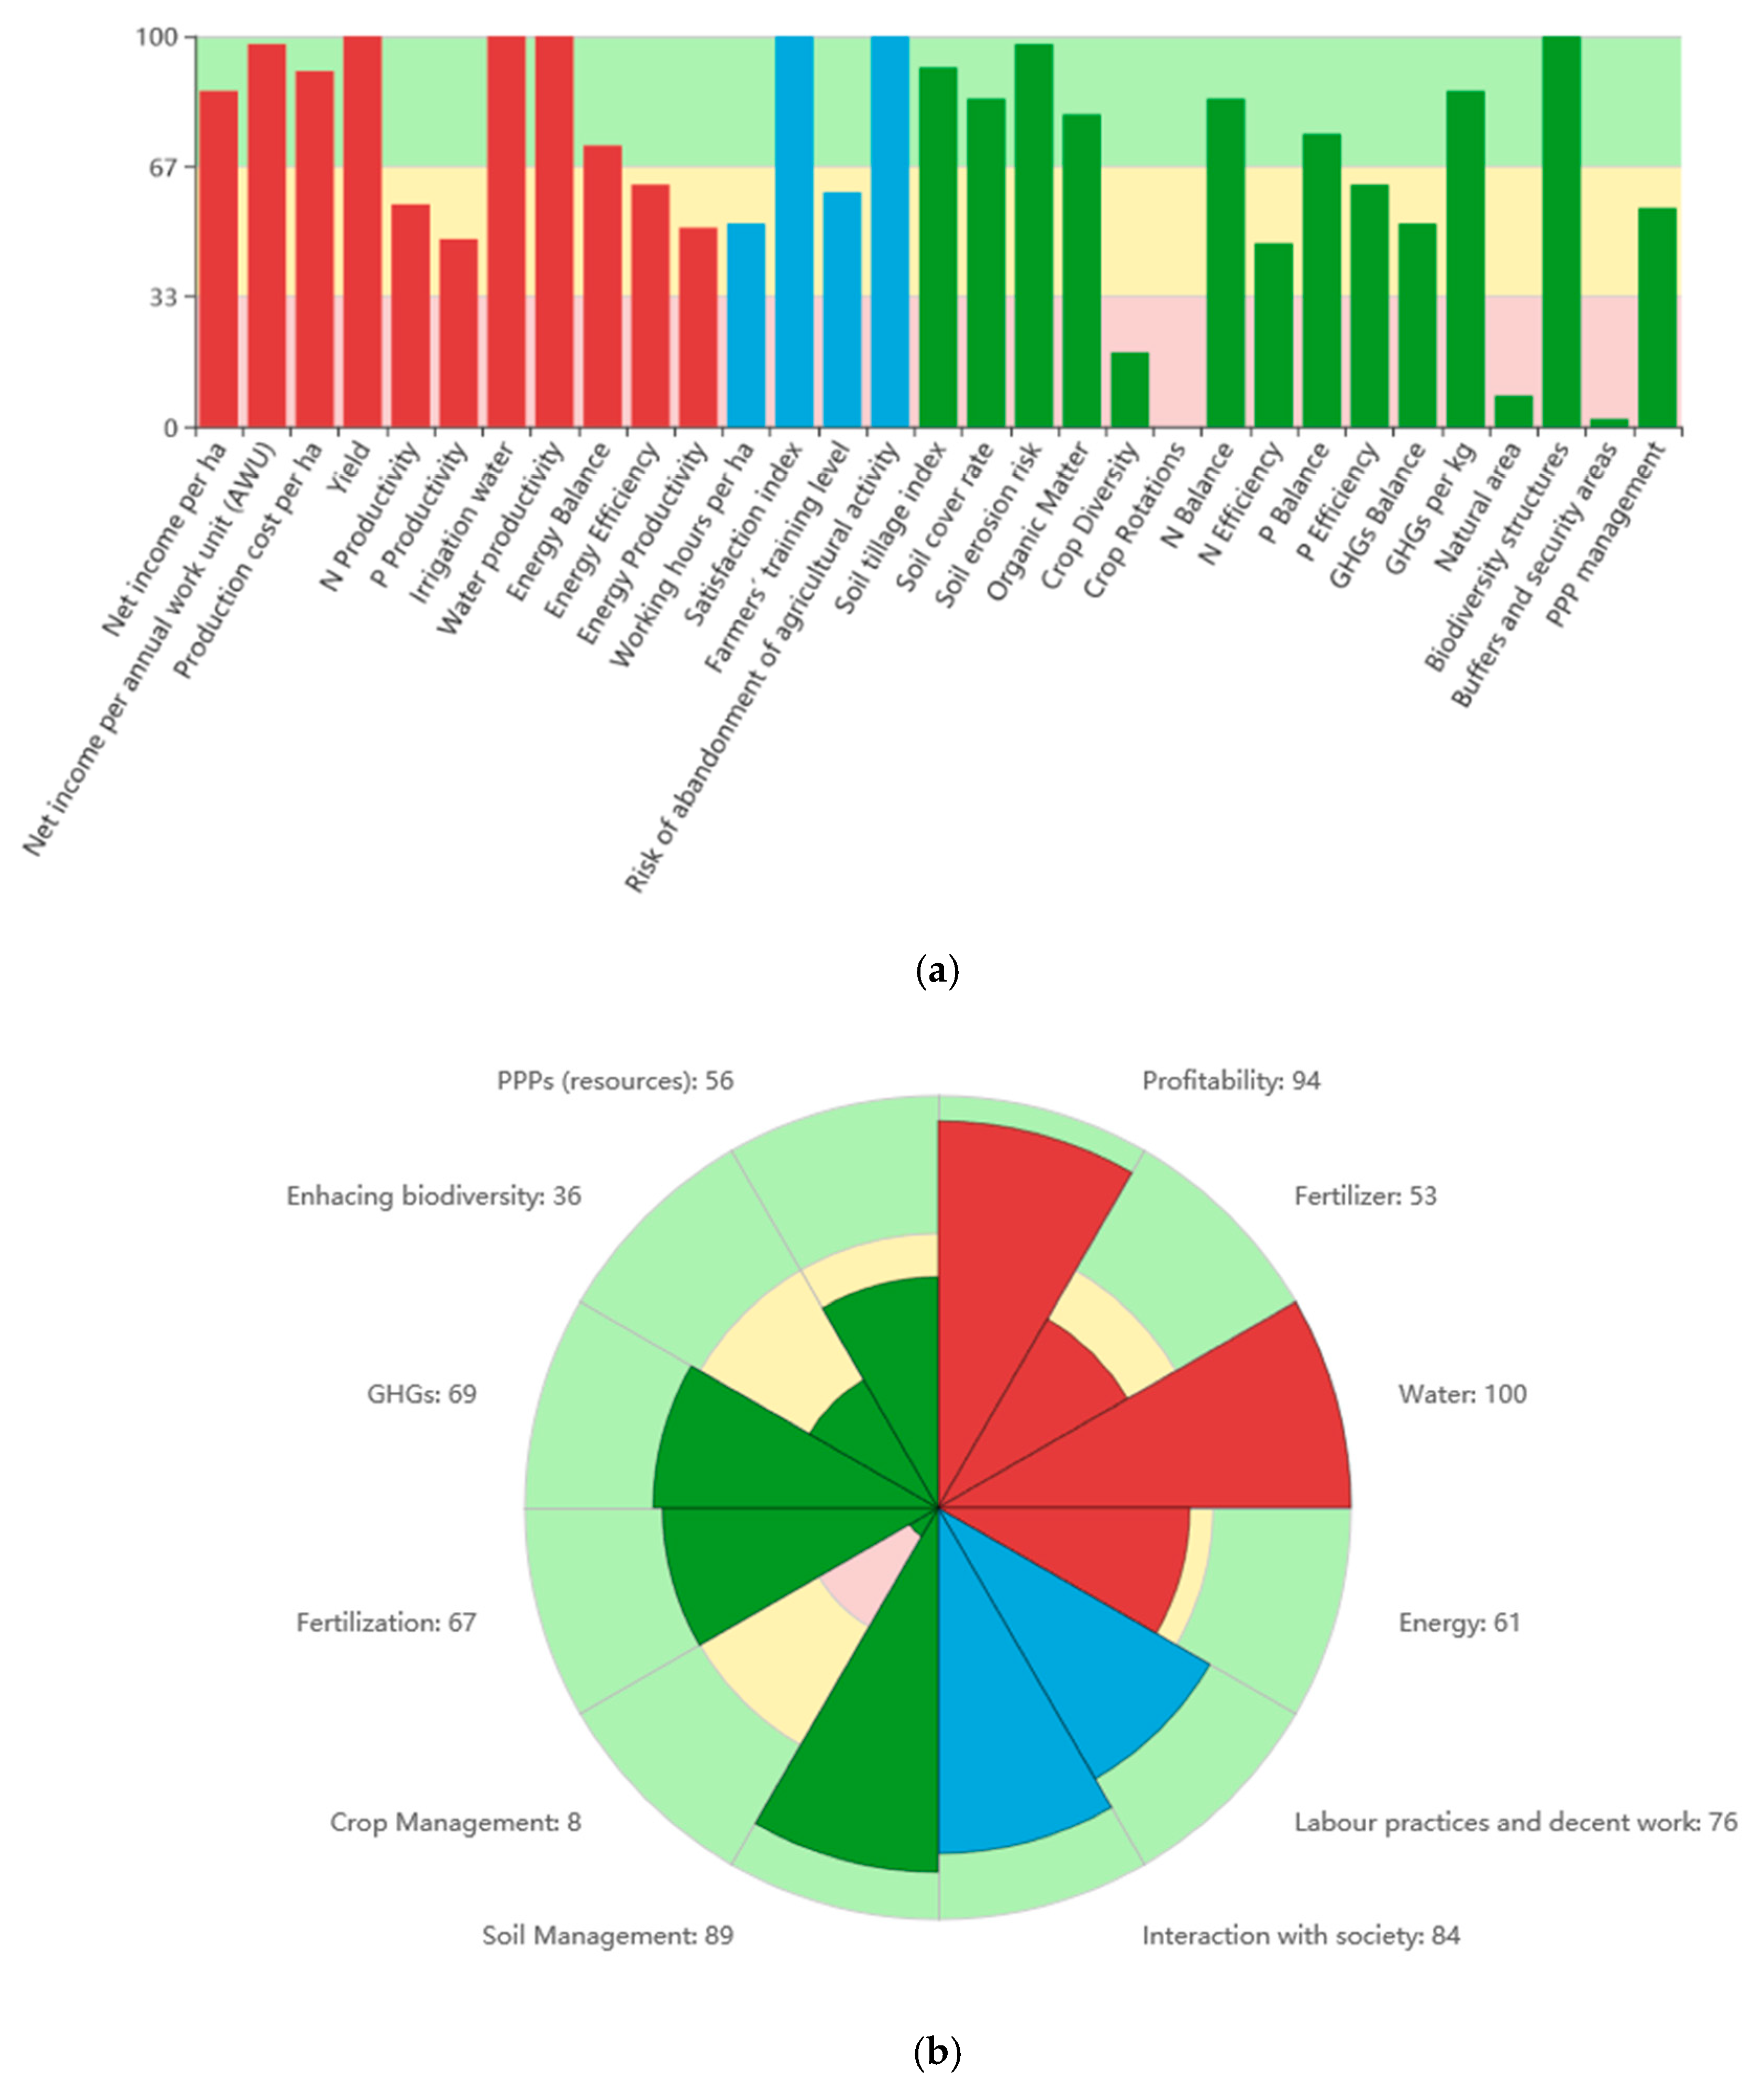
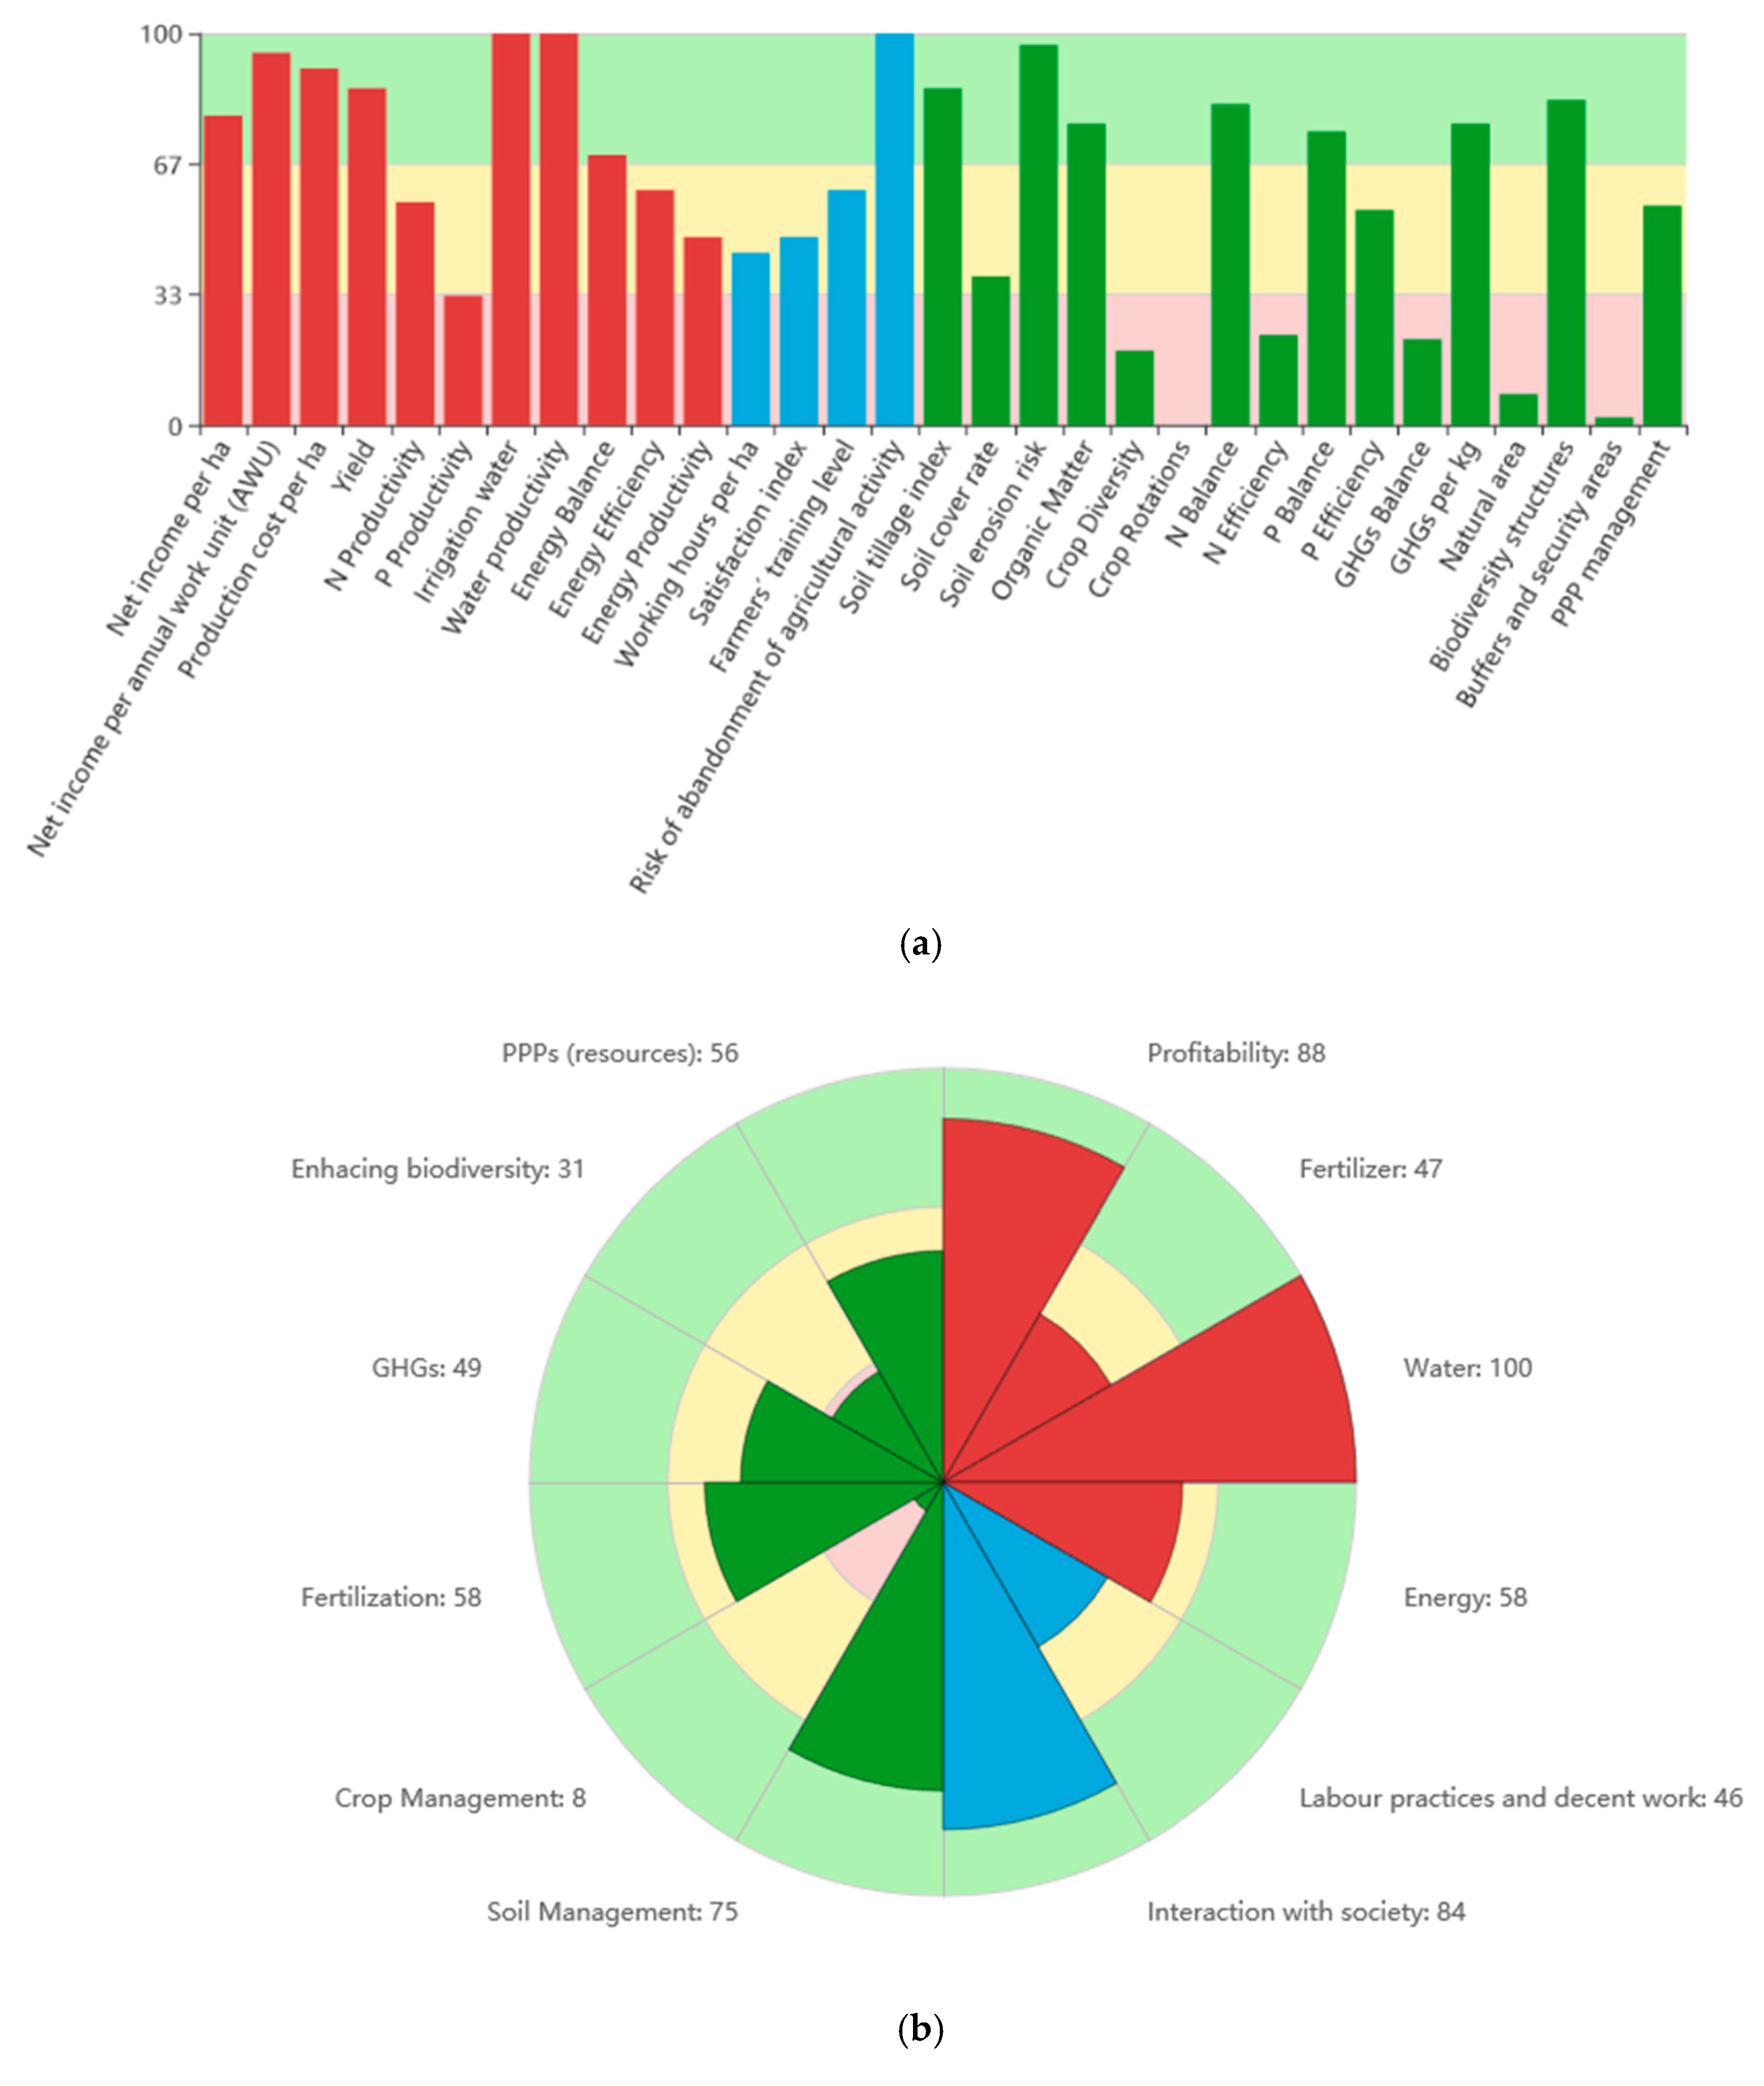
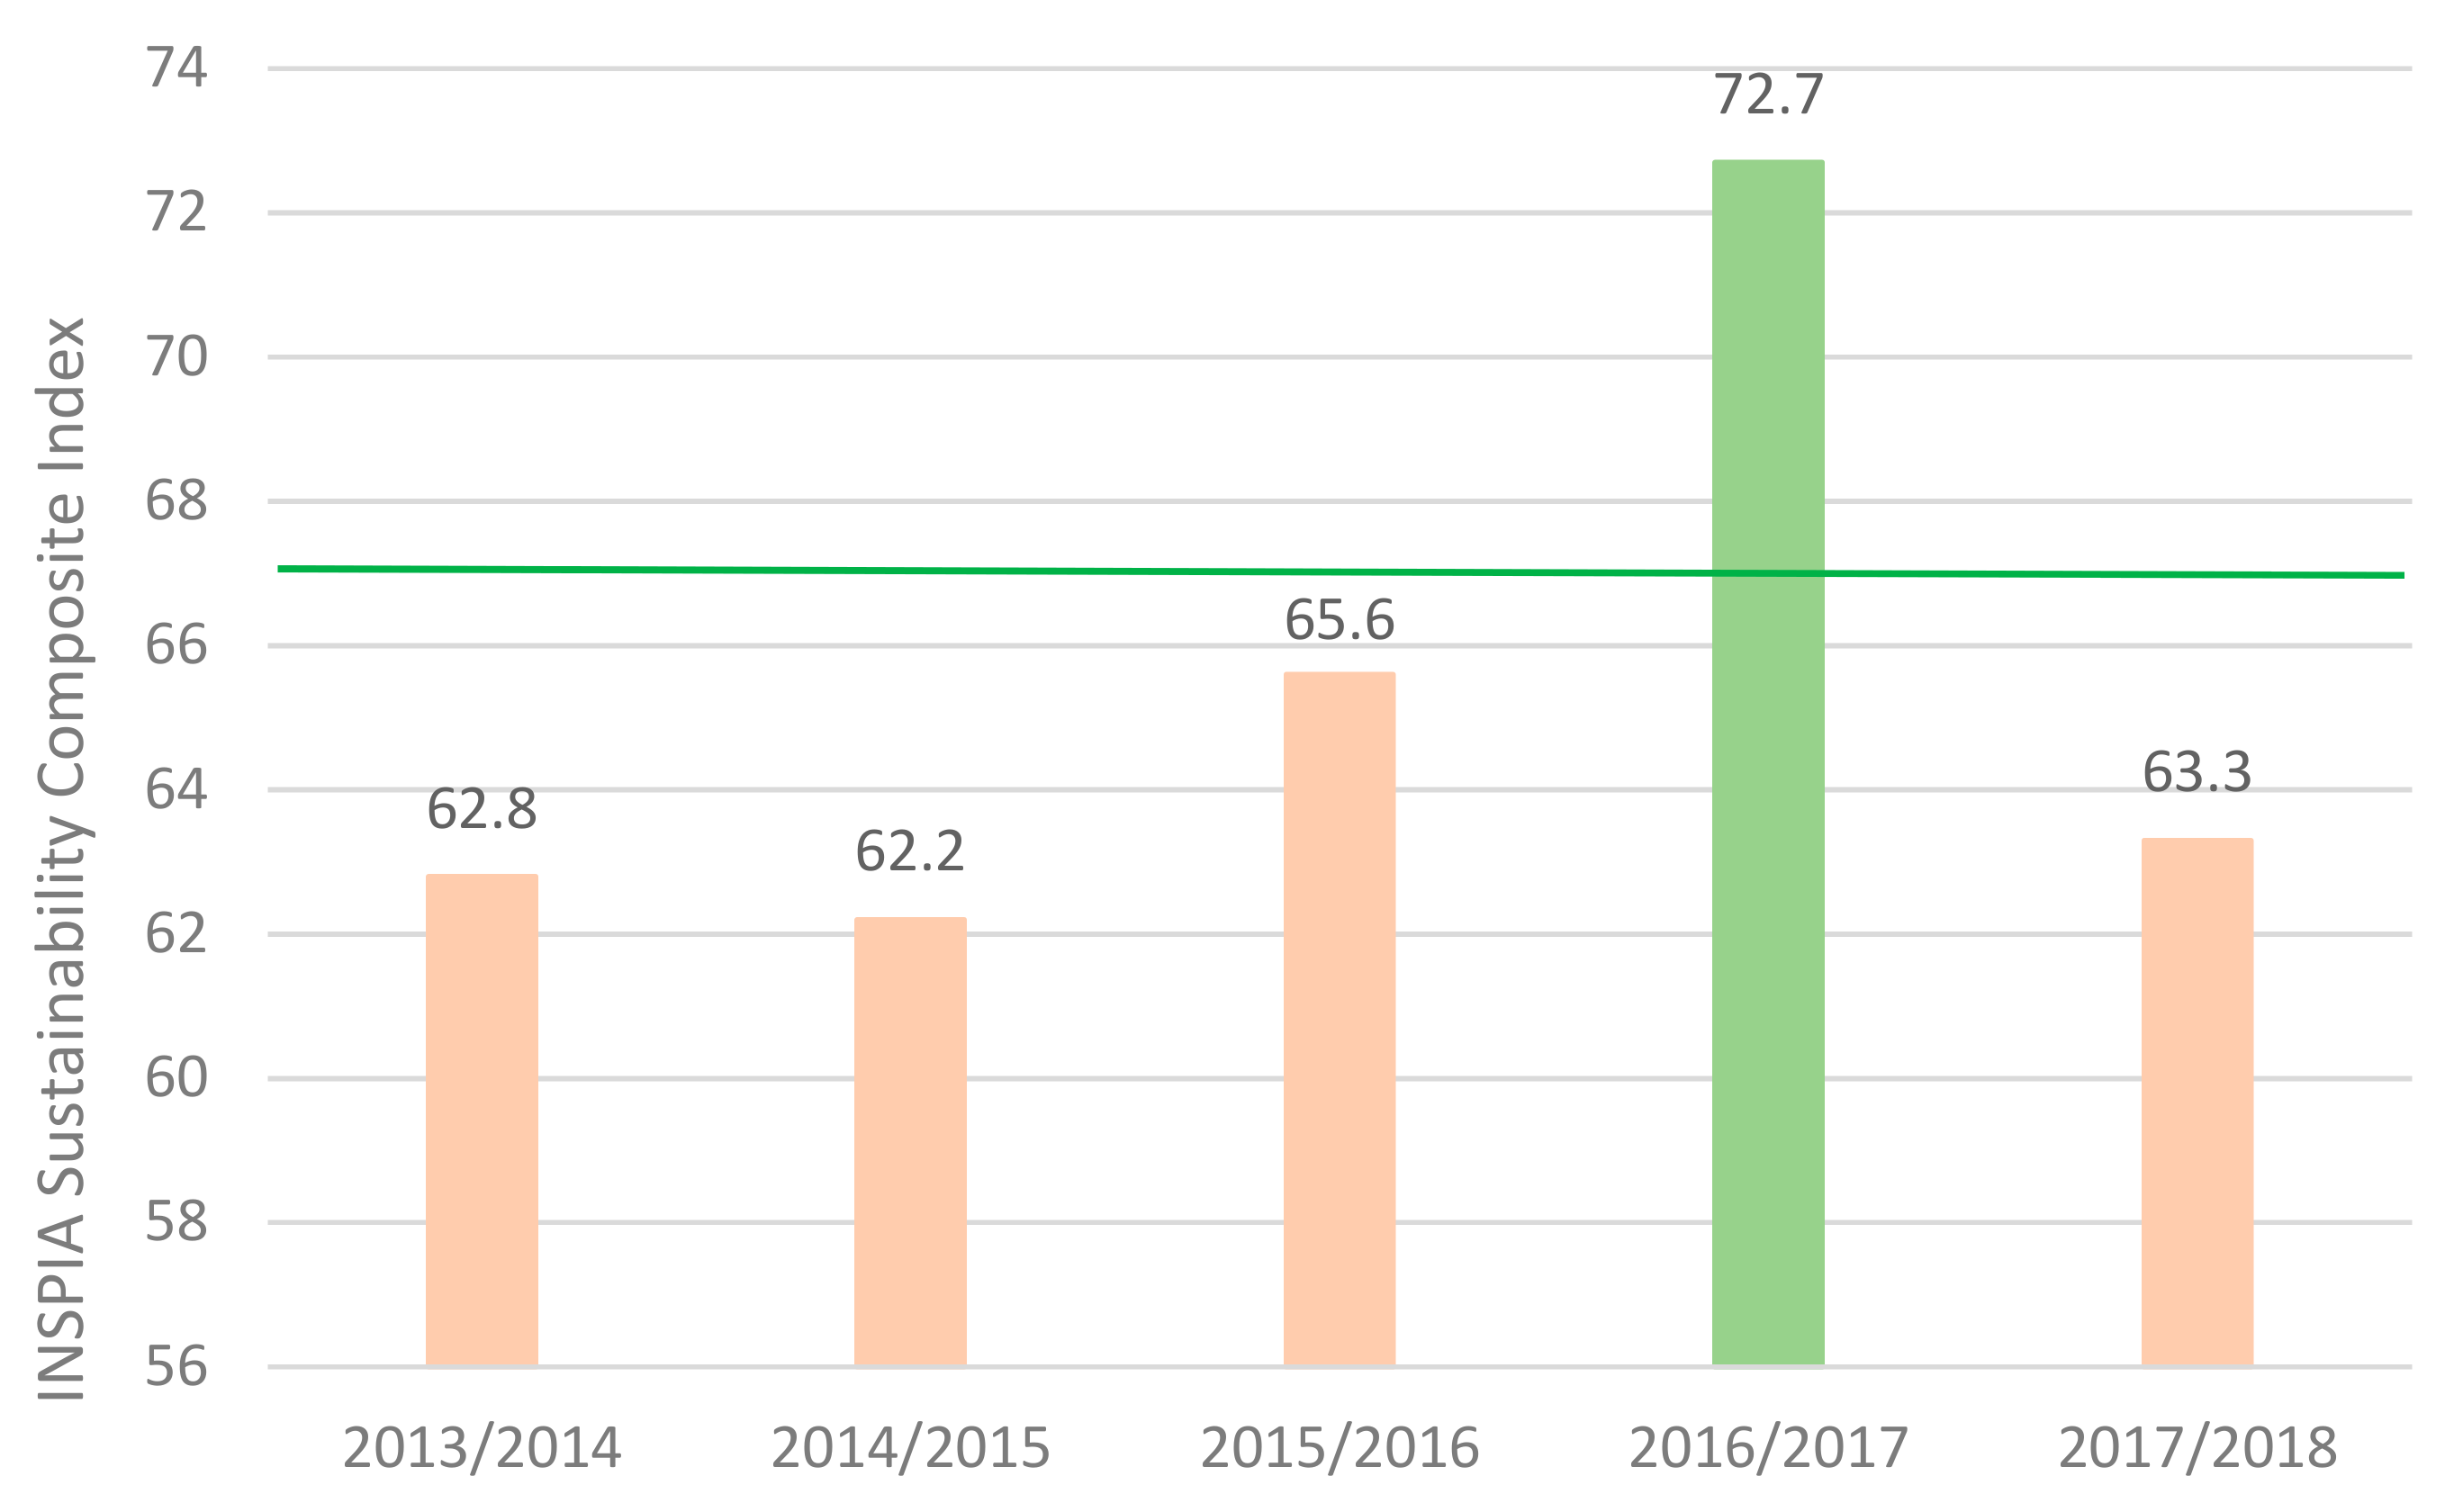
3.1. Basic Indicators Results

Table 2 depicts the 31 INSPIA basic sustainability indicators results for the annual sustainability assessment.
According to the INSPIA model, the three different types of graphical and alphanumeric sustainability results were calculated for each agricultural season, whereas in Figure 3a–c, data have shown to belong to agricultural season 2016/2017, and in Figure 4a–c for agricultural season 2017/2018. Basic indicators could be divided into the three main compartments of sustainability (Figure 3a and Figure 4a) and likewise, into the twelve aggregated indicators (Figure 3b and Figure 4b). Finally, the dendrogram hierarchical structure based was utilised to set the final sustainability index calculation for the five agricultural seasons (Figure 7).
The differences between Figure 3a–c and Figure 4a–c, especially correspond to different soil managements and are due to the different level of implementation of BMPs. This will be explained through the discussion section.
Figure 3c, Figure 4c and Figure 5 show that the year in which the INSPIA sustainability index reached an optimal level of sustainability (≥67), was in the 4’ (agricultural season 2016/2017). However, this composite final index was considered as having a critical level, according to INSPIA methodology, for the rest of the years (>33–≤67).

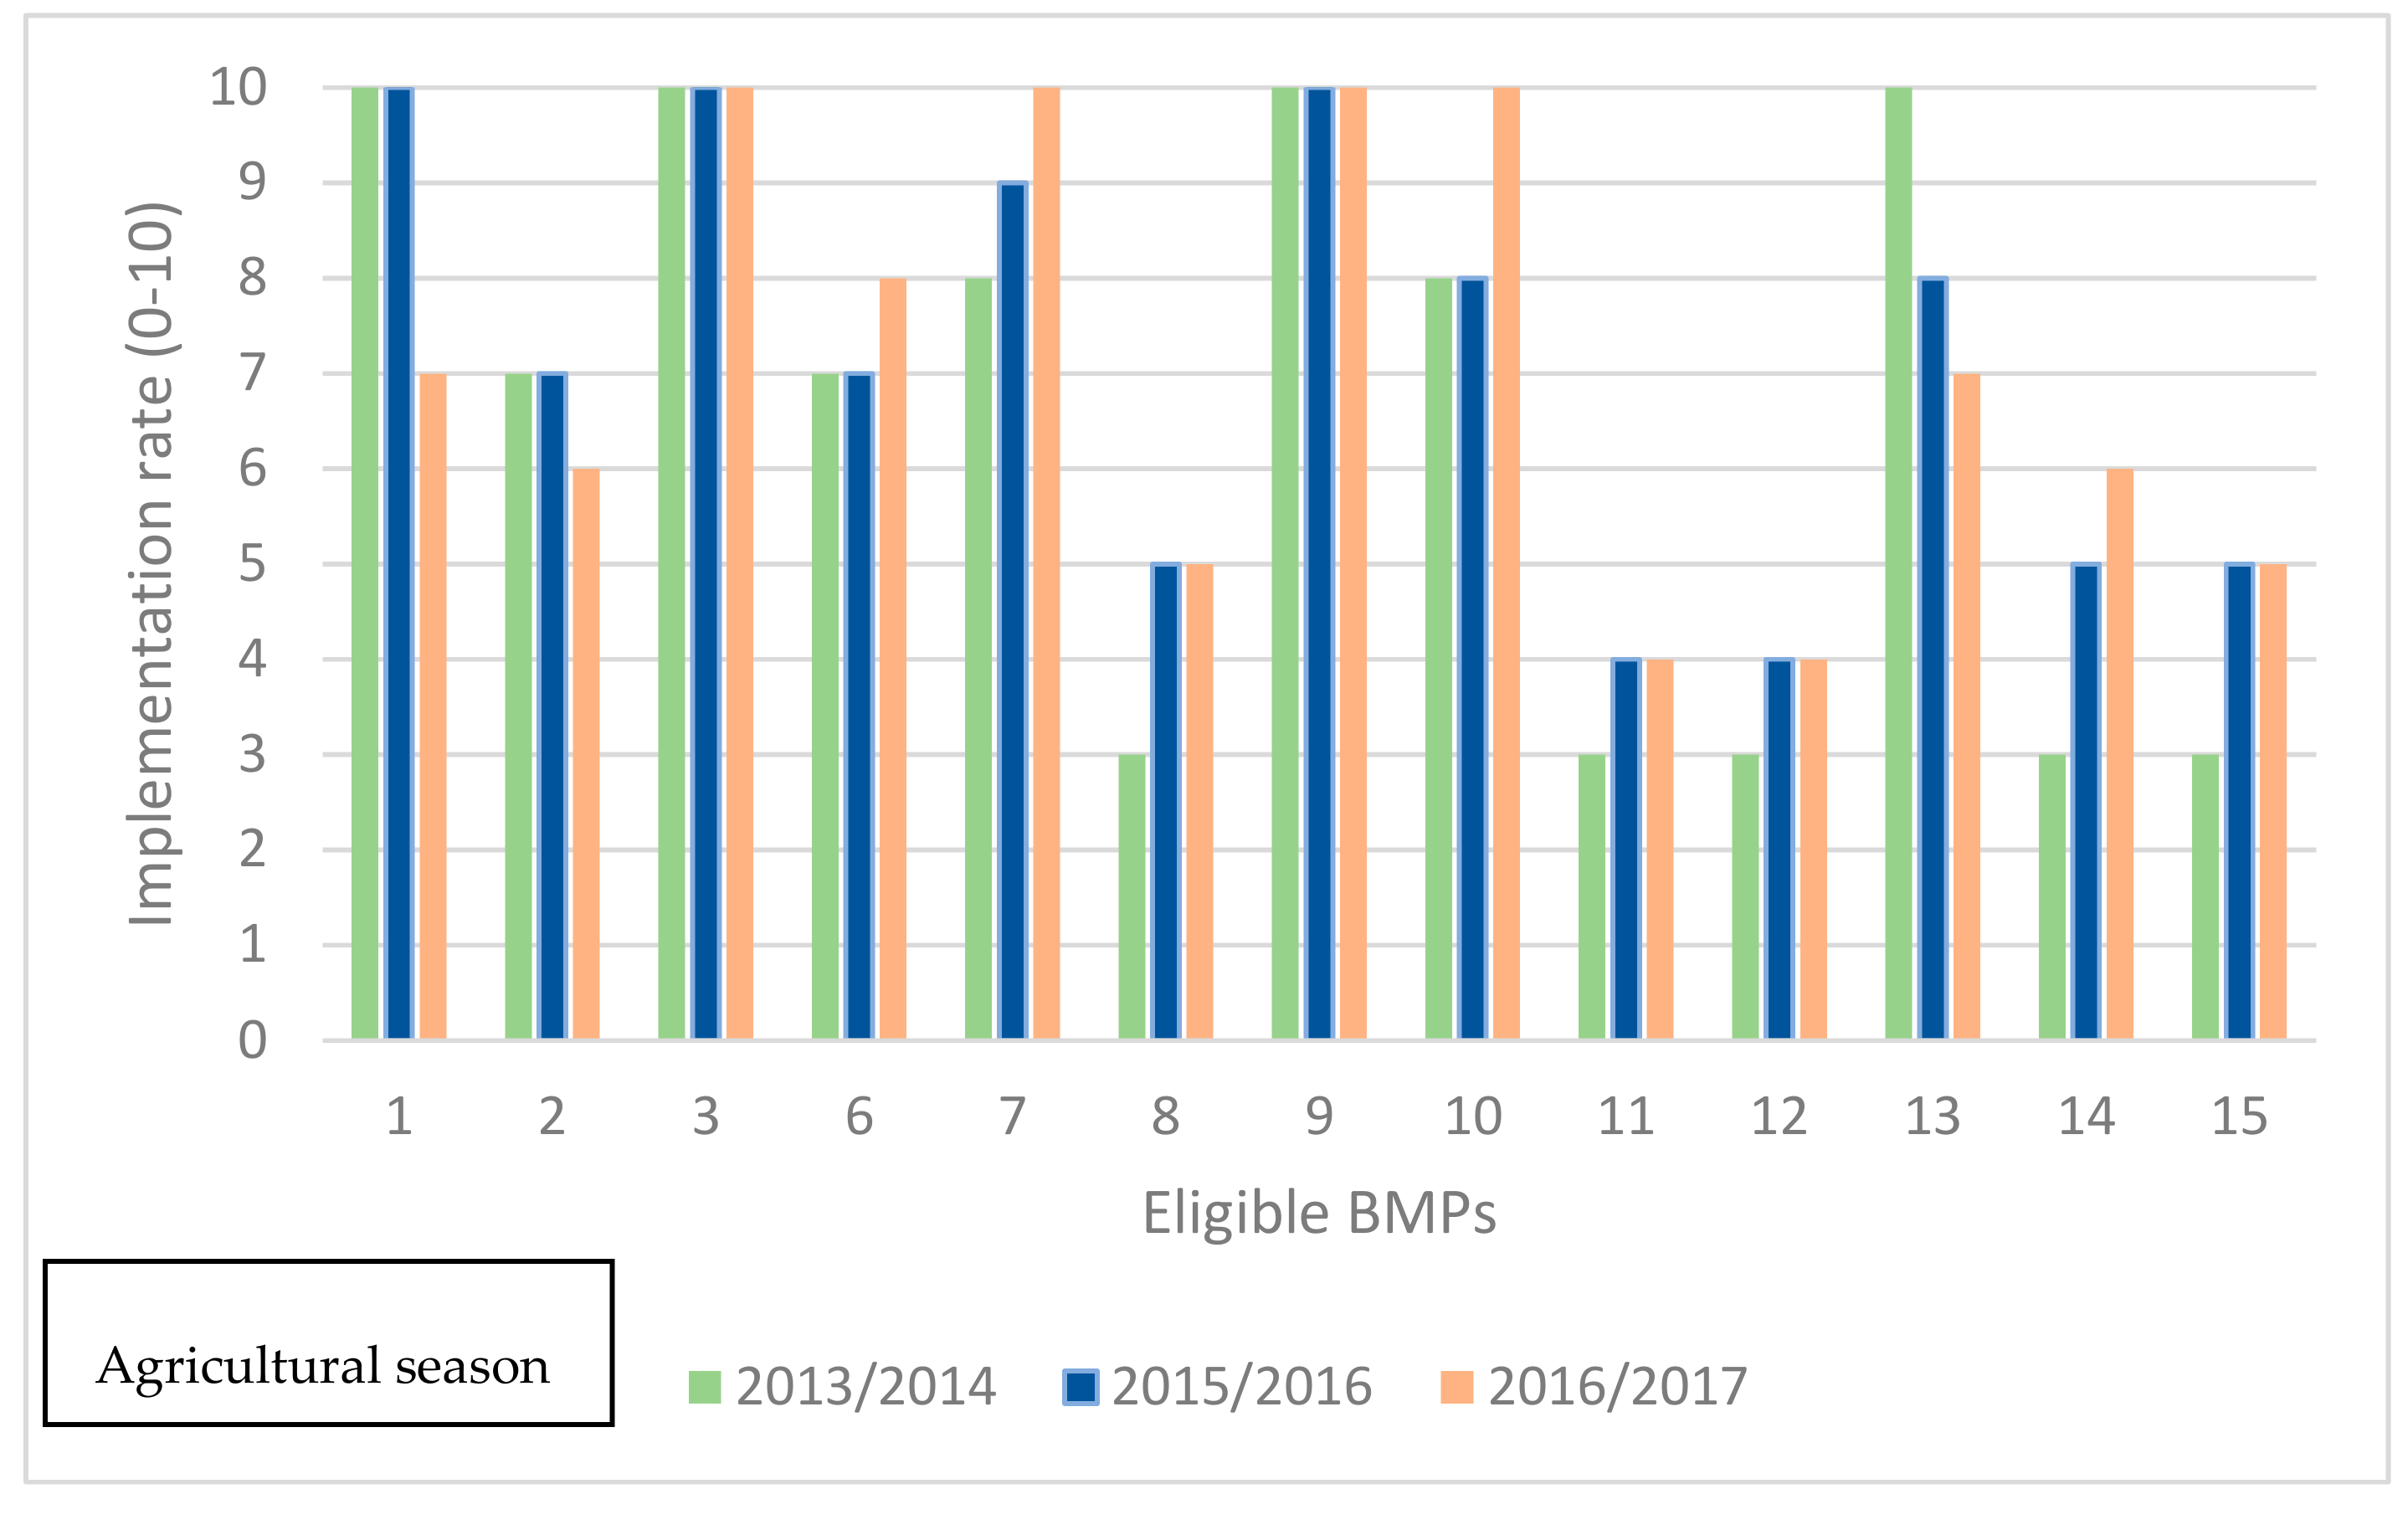
3.2. BMPs Implementation Data

The set of 15 BMPs considered is shown in Table 3. There are some for in-cropping, such as the ones linked to the soil and crop management, and the ones for guiding the use of crop inputs, and other BMPs, that are those focused on the capital natural (biodiversity, soil and water) (off-cropping). There are some dealing with the basic soil and crop management, while others imply an improvement on the use of crop inputs and their application (in-cropping) or even some BMPs which aim to maintain and enhance habitats, and protect not only the environment of the surroundings but also the farming lands (off-cropping).
There are two BMPs which are not eligible for the study farm, therefore BMP-4 and BMP-5 have not been considered. BMP-4 can be applied only for annual crops. BMP-5 does not make sense in permanent crops.
Figure 6 shows the breakdown of the 13 INSPIA eligible BMPs that are implemented in the studied farm over the three-seasons mentioned in the methodology. According to the results, two BMPs do not vary and 11 BMPs vary their implementation rate over time.
Three of the first INSPIA BMPs are soil management related and were successfully implemented over the first 4 seasons. The use of permanent soil covers over the autumn-winter by seeding barley groundcovers in between the vineyard lines, and the establishment of spontaneous cover in between the olive trees endorse BMP-1 (permanent soil green cover), BMP-2 (minimum soil disturbance) and BMP-3 (groundcovers in permanent crops). According to the SigPac database 2019 [47], the cartography used by the regional government of Andalusia, most of the vineyards were located on steep slopes (around 16% is slope), [32,48]. Therefore, the farmer established barley groundcovers in between the tree lines to mitigate soil erosion from agricultural season 2013/2014 to 2016/2017 (Figure 7a,b). Nevertheless, from the agricultural season 2016/2017 onwards, the owner decided not to continue seeding groundcovers in between the vineyards. The main reason was the lack of improvement signs on organic matter content, besides the existing uncertainty regarding the hydric competition between the main crop and the groundcover, and the handling difficulties that may cause the groundcover. The lower implementation of BMP-2, related to soil tillage, concerns to the slight tillage needed for the ‘aserpiado task’ (Aserpiado task: It consists of making some ridges on the ground to retain rainwater and reduce runoff water.) on the surface of the vineyards before the seeding works (Figure 8). Soil-management in the farm (vineyard and olive orchard plots) was changed over the 5-years’ dataset.
The farmer was increasingly sensitised to other BMPs related to the inputs and the way they were applied. Therefore, there were increases in the implementation level of BMP-6, BMP-7, BMP-8, BMP-10 and BMP-14. Since the farmer was working with BMPs from agriculture season 2013/2014, he was increasingly aware of the higher level of their training on the negative impacts that relate to the environment and society, in general. Likewise, farming practices related to the capacity and capability of the pesticides and other plant protection products of being potential sources of pollution on the farm have a higher level of implementation as the BMPs-14 shows. Carrying on with an adequate waste management system has also been positively conducted by the farmer (BMP-15). Finally, Figure 6 also shows the positive progress, the farmer has achieved because of the improvement for upgrading the establishment of buffer zones and multi-functional margins, along the watercourses and between plots (BMP-11 and BMP-12). The establishment of these areas not only leads to environmental benefits but also to agronomic ones [49,50].

4. Discussion

Figure 3a–c and Figure 4a–c show that sustainability indicators have been monitored over the two last agricultural seasons, and in the same way sustainability indicators have been evaluated over a 5-year period. Therefore, the basic and aggregated indicators, which are additional to the final composite index, are measurable, being variables able to assess the performance of certain farming practices which have been implemented over a 5-years period [44].

4.1. Analyses of the Scores Which Deal with Basic Criteria

4.1.1. Measures about the Economic Aspects of Sustainability

Economic basic indicators’ results endorsed what was stated by Pastor et al. (2001) [48] about the profitability of establishing groundcover in between the tree lines in perennial crops. Likewise, Fraga and Santos [51], stated that the more the soil is covered, the less the loss of potential performance. This is mainly due to soil degradation in the Mediterranean climate regions of Southern Europe. In this regard, DeVetter et al. (2015) [52] highlight that covering the soil by establishing groundcovers in between the vineyards may help to maintain yield levels under adverse climatic conditions. Conversely, others showed that the use of groundcovers in vineyards drives to lower crop yields [53,54].
In our research, soil-cover is calculated through the indicator known as ‘soil-cover rate’, (indicator No. 17) that refers to the number of days per year on which the soil is covered [55], and mainly depends on soil management. Indeed, the findings from the five agricultural seasons show that the more the soil is covered, the higher the crop yield indicator (Table 2). INSPIA yield indicator (indicator No. 4) explains the real crop yield obtained compared to that which is perceived, as a potential one calculated from asking farmers and farm managers who are close proximity to where the study is being conducted. An increase of 1.2% in the value on indicator No. 17 was calculated while monitoring an increase of 27.3% in term of the crop yield factor (indicator No. 4) from agricultural season 2013/2014 to 2016/2017, in which the landowner decided to cease the implementation of BMP-3, for both crops (establishing groundcover in between the tree lines) and started to plough the soil with increased intensity.
Perego et al. (2019) [56], pointed out that crop yields could be higher when the implementation of BMP-1, BMP-2 and BMP-4 was longer than 12 years, however, our research findings provide higher crop yields within only 4 years of implementation of these soil practices (27.3% increases). ‘Soil cover rate’ (indicator No. 17) has shown stability throughout the first 4 seasons, in which groundcover is established both in the vineyard plots and in the olive grove plot. Nevertheless, the situation reverses when these groundcovers are removed from the 4’ to the 5’ agricultural season. Certainly, there is a 54.7% decrease in this indicator (No. 17) and a 20.6% drop in the yield indicator (Table 2).
Likewise, a certain stability is observed amongst the very first four indicators (Nos. 1, 2, 3 and 4), and this is related to the economic dimension, over the first three agricultural seasons before the soil management drastically shifted on the farm from the 4’ to the 5’ season. However, there are sharp fluctuations on these first basic indicators in the 4’ season. For instance, concerning the ‘production costs’ indicator (indicator No. 3), results are aligned with Paustian et al. (2016) [57] insights, who stated that groundcovers implementation on perennial cropped land is a low-cost practice. The value of this indicator was rather balanced over the five seasons (Table 2). Productions costs are related to variable production expenses and include seeds, fertilizers, energy, labour costs, etc. There should have been a larger gap in production costs, between the implementation of groundcovers (up to agricultural season 2016/2017) and the fact of having the bare soil with tillage (season 2017/2018), mainly because of the upward trend in the price of fuel. Nevertheless, production costs (indicator No. 3) have always been on average 2.4% superior to when not having implemented groundcovers (BMP-3). The reason is due to the lack of the farmer possessing a suitable no-till seeder would have made lighter tillage between the tree lines before seeding the barley cover in the vineyards, with the correspondent fuel costs of tillage despite having implemented groundcovers. Therefore, production costs stemming only from groundcover establishment itself have not been calculated in this study. The small variation of the ‘production costs’ indicator (indicator No. 3) examined from the 4’ to the 5’ agricultural season is due to the chemical way of weeding and removing, in the 4’ season versus the tillage in the 5’ one.
The implementation of the mentioned BMPs affects direct or indirectly to indicators’ value such as ‘nitrogen productivity’ (indicator No. 5) increasing by 1.8% from the 1st to the 5’ year, ‘energy productivity’ (indicator No. 11), improving by 3.7% up to the 4’ year, and decreasing by 4.9% from the 4’ to the 5’ one. The ‘energy balance’ (indicator No. 9) and ‘energy efficiency’ (indicator No. 10) drop by 5.1% and 3% respectively from the 4’ to the 5’, when fuel-consumption increases because of the need of tillage and therefore the emission of greenhouse gases GHGs to the atmosphere increases [58].
As Fernandez-Ugalde et al. (2009) [59] indicated, reduction of tillage by establishing the groundcovers leads to better soil structure which ends up with higher productivity and crop yield particularly for semi-arid areas. In this context, the practice of minimum soil disturbance (BMP-2) and the use of soil-covers (BMP-1 for annual crops and BMP-3 for permanent crops) highlight as the best management practices on this farm. No-tillage techniques improve the water retention capacity of the soils during the driest period of the year when there is less water available for the crop.
In general, economic sustainability basic indicators (concerning yield, costs, income, inputs productivity, etc.), and the aggregated ones have been affected by the soil management shift occurred on the farm. This fact is very remarkable from agricultural season 2016/2017 to the 2017/2018.

4.1.2. Measures about the Environmental Aspects of Sustainability

According to the literature, covering the soil also reduces soil erosion [29,35,44,60]. In this context, there is a strong relationship between ‘soil cover rate’ (indicator No. 17) and ‘soil erosion rate’ (indicator No. 18). Results of these two indicators remain virtually unchanged for the first 4 agricultural seasons, whereas there is an increase observed of 64.7% in the soil erosion rate when soil cover rate drops to 54.6%. This is due to the removal of the groundcovers (Table 2). However, there has always been a certain level of soil erosion, especially in the vineyard plots because of the need to plough in order to create a suitable seedbed prior to seeding. The fact of ploughing the soil makes it much more disaggregated and prone to erosion [35,53]. Degraded soils, along with long hill-side lengths in the farm, provide favourable conditions for soil erosion problems when occurring episodes of torrential rainfall [61]. This is so if the barley groundcover has not become fully established in the field.
In our research, the soil-tillage measure monitored by indicator No. 16 (‘Soil tillage index’) amended its value, 41.4% over the first 4-years because the soil tillage was diminishing. However, when the farmer decided not to continue with the barley groundcovers, indicator No. 16 increased by 70.7% because the tillage needs were higher. The action of tillage was always meant to prepare the seedbed since this farmer did not own any adequate no-till seeder. This circumstance, besides the higher need for tillage since the 4’ year (2016/2017) justifies indicator No. 16 had reached higher values than expected, when the groundcovers were established.
Many authors point out that environmental services are derived as a result of improved conditions in the soil volume used by plant roots and enhanced functional agro-biodiversity. Minimisation or avoidance of soil disturbance leads to increases in organic matter content [49,59,62] since crop residue mineralization is reduced. Results found over a period of 5-years endorsed what is found in the literature. Our research findings show 41.4% ‘Soil tillage index’ reductions have been linked to 66.6% organic matter content increases (Table 2). The low values of the organic matter content (indicator No. 19) are justified because of the tillage frequency needed and therefore, the low amount of residue-content incorporated through the groundcover, as was studied by Colnenne-David et al., (2017) [63]. In this sense, and as found in the literature, soil fertility and the ability of the soil to produce food is intrinsically linked to the organic matter content [35,49]. In this context, this research finds a positive correlation between the soil organic matter (indicator No. 19) and the soil cover rate (indicator No. 17). An increase of 1.20% in ‘soil cover rate’ indicator during the first 4-years originates increases by 66.6% in the ‘organic matter content’. Likewise, a decrease of 54.7% in ‘soil cover rate’ indicator due to soil tillage from the 4’ to the 5’ season has resulted in decreases by 3.8% in the ‘organic matter content’. Indeed, the highest values of organic matter content (indicator No. 19) are calculated for the 4’ agricultural (0.8%), coinciding with the highest value for yield indicator (108.7), (Table 2). The accumulation of organic residues from the groundcovers established in the vineyards during the first 4 agricultural seasons have degraded the organic matter less and therefore have provided higher values of indicator No. 19, despite the soil management, was not the optimum one. To the best of our knowledge, increasing the level of soil organic matter can provide environmental and production benefits. Enriched organic matter improves soil aggregation which in turn improves soil aeration, improves infiltration, and generally reduces soil erosion risks. Our results on ‘soil organic matter’ (indicator No. 19) and ‘soil erosion risk’ (indicator No. 18) endorse what is pointed out in the literature [49]. The higher the value of indicator No. 19 coincides with the lowest value of indicator No. 18 in the 4’ agricultural season (Table 2).
Nowadays, requiring a reduced fertiliser content and its efficient use is imperative for the financial and economic viability of farms. Therefore, soil fertility enhancements, via increased organic matter, guarantee efficient nutrient cycling that helps to achieve the objective of optimization of overall nutrient efficiency, leading to minimization of production costs for crop nutrition. Reduced soil disturbance and maintaining the soil cover have shown to require considerably less (up to 50%) mineral fertilizer inputs for the same or even higher yields [29,64]. Our results underpin the literature, since the calculated increases of 66.7% in the organic matter levels’ values over the first 4-years have been able to compensate, to some extent, for some mineral fertilizer inputs of Nitrogen and Phosphorus, reducing their needs for the same period of time, and even obtaining higher yields (increases of 27.3%). Indeed, there is a certain stability in the nitrogen and phosphorus balance (indicator Nos. 22 and 24), conversely to what happens from the 4’ to the 5’ agricultural season, in which groundcovers were eliminated. Negative values on the ‘nitrogen balance’ means that the system consumes all the provided inputs, and therefore, there is no risk of contamination to the water. In addition, indicator No. 23 ‘nitrogen efficiency’ corroborates the results, since it is quite even over the 4-years when it drops to 29% in the last agricultural season (Table 2).
From the stable results on ‘phosphorus balance’ (indicator No. 24), average 7.7%, authors might assume that phosphorus fertilization has been adjusted to the crop needs, which concerns the BMP-6, which means fertilize according to soil and crop needs. In this sense, and although phosphorous is not a severe pollutant in dry conditions with basic pH, it can be a risk factor for the fauna of the watercourses bordering the farm because of its facility of de-stabilising the development of algae and phytoplankton that live in these aquatic habitats [65]. The high imbalanced of nutrients favours eutrophication processes in the farming areas in which phosphorus is dragged by runoff with soil particles. Therefore, again the BMP-3 consisting of groundcover is highlighted, to reduce the potential soil runoff to water streams.
The amount of GHGs emitted into the atmosphere during the whole agriculture season is paramount. In this context, and regarding the mitigation and adaptation capacity to climate change, there are two basic indicators in play: indicator No. 26, ‘GHG balance’ and indicator No. 27, ‘GHG per kg’. Perennial cropped lands, like vineyards and olive orchards, are characterized for their CO2 sequestration capacity from the atmosphere, to be kept in the vegetation structures [66]. It is acknowledged, that soil management improvements, such as the reduction in soil tillage for annual crops and establishment of groundcovers in between the tree lines in permanent crops, enhance carbon soil sequestration [60,67,68]. However, these statements conflict with the findings of some other authors who did not find significant differences in organic carbon sequestration in deeper layers of the Mediterranean area for rainfed land, according to different soil management [69]. Indicator No. 26, ‘GHG Balance’, measures the amount of (GHGs) emitted or sequestered into the atmosphere. These gases emissions are composed of two main factors and mainly depend on the soil management of the farm. First, there are the correspondent CO2 emissions of farming tasks, and, second, there are the GHGs emissions needed for the inputs’ manufacturing processes. Therefore, the close relationship between indicators Nos. 26 and 16, referring to soil tillage. Where increases of 70% on soil tillage when groundcovers were removed, favoured indicator No. 26 increased to 63% (Table 2). These figures could be explained thanks to the average carbon fixation rate of 1.30 Mg ha−1 yr−1, determined by González-Sanchez et al. (2017) [60], in olive and almond orchards and vineyards, managed with groundcovers under climatic Mediterranean conditions. This indicator No. 26 might grow because of two factors. Firstly, to the CO2 emissions into the atmosphere because of the tillage, facilitating the entry of air inside and therefore the mineralization of humus, generating CO2 as the main sub-product. Secondly, to the CO2 generated by the fuel combustion from the farming work tasks.
Overall, groundcovers implementation in perennial crops offers manifold benefits, enhancing soil quality [70], improving organic matter contents [26,48,71], increasing the capacity of soil carbon sequestration and even reducing the development of weeds [51]. Nevertheless, there is a need for doing further research in groundcovers in vineyards, since there is not much insight on how these practices could affect wine quality. Authors like Ibañez et al. (2011) [32] and Trigo-Córdoba et al. (2015) [72] highlight their preferences for wines produced with grapes cultivated under covered soils.
The INSPIA indicators related to biodiversity in a permanent cropped holding are two. The first is ‘biodiversity structures’ (indicator No. 29) and the second is ‘buffers and security areas’ (indicator No. 30). Since ‘natural area’ (indicator No. 28) does not vary over years because of the relationship between the natural vegetation area, either tree, shrub or herbaceous and if the total farm area remains constant. Indicator No. 29 concerns ‘biodiversity structures’ reflects functional agrobiodiversity of the farm. There is a slight upward trend of this indicator No. 29 that quantifies biodiversity in-field, and off-size. Our study shows an increase of 3 points of this indicator when soil tillage and soil disturbance, monitored though indicator No. 16, have been reduced, endorsing what was stated by Basch et al. (2012) [49]. The optimum value of indicator No. 29, in the 4’ agricultural season (4) corresponds to the lowest value for indicator No. 16 in the 3rd and 4’ year (8.2).
The establishment of multi-functional margins or buffer areas alongside a watercourse delivers many environmental and agronomic benefits to the farm [73,74]. Species diversity conforming these to margins favours pollination, increasing pest predators [73] by providing soil shelter areas for these predators [75] and even suitable areas to place hives [76], which enhances crop yield. One of the main goals of these buffers is to filter the possible off-site transport of contaminants, by reducing diffuse source pollution of water [50]. Despite the fact that there are authors that highlight the added value of these multi-functional margins in contributing towards a sustainable production [75], there are others such as Haddaway et al. (2018) [74] that suggest a further investigation of the possible environmental concerns when a higher production is needed. Our results endorse that the optimal value for biodiversity structures (4) corresponds to the agricultural seasons in which the groundcovers were established.
Concerning plant protection products ‘PPP management’ (indicator No. 31), there is an increase of 425% of this indicator over the dataset time. This indicator, as explained in Triviño-Tarradas et al. (2019) [10] refers not only to the manipulation of products, and their application with suitable equipment but also to their prevention as point source pollution. Alike Salvia et al. (2018) [36] pointed out farmers’ adoption of optimal farm management goes hand by hand with their training level, since there is a huge increase from the 3rd to the 4’ year of the indicator No. 31 (425%), whereas the training level indicator (indicator No. 14) augments by 100%.

4.1.3. Measures about the Social Aspects of Sustainability

Concerning the social aspect, indicators such as ‘working hours per hectare’ (indicator No. 12), ‘satisfaction index’ (indicator No. 13), ‘farmers’ training level’ (indicator No. 14) and ‘risk of abandonment of agricultural activity’ (indicator No. 15) are the ones providing information on this sustainability dimension. There is a downward trend monitored by the indicator No. 12, which monitors the number of working hours needed in each hectare. This is mainly because of tillage reduction over the first 4 seasons, which provides farmers allocate more time for their professional life (e.g., for training) or even for their personal life. However, this trend reverses, and indicator No. 12 increases by 27.9% from the 4’ to the 5’ year. This is because the farmer decided not to continue with the groundcover practice and engaged in soil tillage (Table 2). The farmers’ environmental awareness level is, of course, linked to their level of training in courses, congresses, workshops, etc., they have attended. This is calculated by indicator No. 14 ‘farmers’ training level’. This indicator soared by 140% from the 1st to the 4’ year (Table 2). Whereas, from the 4’ to the 5’ agricultural season this indicator related to training level, remains the same (Table 2). This indicator depends on the previous training performed and the current one. The higher level of training is normally linked to an upper degree of management and technical skills.
‘Satisfaction index’ monitored through indicator No. 13 increases in the first 4 agricultural seasons. The farmer relies on the existence of a certain room for improvement on the best management practices taking place, reaching the maximum value on the 4’ year. However, the downward trend calculated through the 52.5% decrease in this indicator, shows a certain degree of pessimism in the satisfaction level.

4.2. Analysis of the Criteria Sustainability Scores

Basic, aggregated and INSPIA composite index results shown in Figure 3a–c, confirm that global farm sustainability depends on the three dimensions (economic, social and environmental). According to INSPIA methodology, one farm is considered sustainable if the average set of basic indicators is uniformly high and the final composite index value is above 67, like other methodologies such as RISE [77].
Improvements performed on the farm and BMPs implementation over the five seasons show a final composite index of 62.8%, 62.2%, 65.6%, 72.7% and 63.3% (Figure 4). These results show that the maximum sustainability composite index was calculated in the 4’ agricultural season (2016/2017), whereas the lowest indexes were reached on the 1st and 2nd year. The final composite sustainability index increase was by 16.4% from the 1st to the 4’ season due to the higher implementation of certain BMPs (Figure 5). This increase is not an optimal one but is certainly a move in the right direction of progress and agricultural sustainability. INSPIA allows the opportunity for farm performance to be assessed over each agricultural season, comparing their performances.

4.3. BMPs Achievements

Potential benefits of soil management practices, such as minimum soil disturbance and permanent soil cover, have already been reported in our results. However, to the best of our knowledge, few studies have shown the true impact of these practices (e.g., covering the soil by establishing groundcovers in permanent crops BMP-1, BMP-2 and BMP-3) under different climate-change scenarios. In this context, González-Sanchez et al. launched in 2017 [60] a major research study explaining how European farmers could make the difference, and revert to the situation of continuously rising of CO2 emissions [51], removing nearly 200 million tonnes of CO2 from the atmosphere by implementing Conservation Agriculture techniques. Making a simple calculation, by utilizing the coefficient of the rate of carbon sequestration and the potential of carbon fixation for permanent crops in the Mediterranean biogeographical area of Southern Spain (1.54 t ha−1 yr−1) [60,67], the potential of ‘Lagar Cañada Navarro’ is 33.63 t yr−1, and it would be 168.17 t, taking into account the 5 agricultural seasons. Since 1 tonne of organic carbon corresponds to 3.7 tonnes of CO2, the fixing potential of this farm is 124.44 t CO2 yr−1, which means 622.22 t CO2 the 5 agricultural seasons.
These first four BMPs concern the principle of Conservation Agriculture (CA): (i) minimum soil disturbance; (ii) permanent soil cover; and (iii) crop rotations [31,49,78,79]. While soil-tillage reductions of 41.4% are measured, economic, social or environmental benefits emerge, such as increases in both organic matter content and in energy productivity of 66.6% and 3.7% respectively, soil erosion risk reductions of 10.5% and 12.7% reductions on the working hours needed to farm, among others. The implementation of CA principles plays a major part in the mitigation and adaptation towards climate change since it implies a reduction of greenhouse gas emissions (GHGs) by fixing CO2 from the atmosphere as soil organic carbon [60]. Moreover, CA systems deliver ecosystem services as a result of improved in the soil volume used by plant roots, and by enhanced functional agro-biodiversity [35,78,80].

5. Conclusions

Although measuring agricultural sustainability is a complex issue, this paper provides farmers, technicians and other stakeholders, with a robust evaluation of a mixed vineyard and olive-grove farm. The results facilitate a better understanding of the BMPs that farmers should consider when they seek to improve their sustainability levels.
INSPIA methodology has been validated as an assessment sustainability tool for permanent cropped land. Since, the higher the implementation of the BMPs infield, the higher the value of the sustainability indicators (basic, aggregated and index). This could be applicable, not only in Southern Spain but in any other country suitable for growing this kind of crops. The assessment study for the BMPs provides an approximate roadmap, which objectively shows the farming practices that should upgrade their implementation level in the field. INSPIA model application and use facilitate the decision-making of farmers, increasing their awareness of the potential opportunities and weaknesses when these farming practices are applied. The agricultural sustainability of the mixed farm (vineyards and olive groves) has improved when the BMPs, soil management-related aspects have been more implemented and, therefore, supported by the final composite index.
The farmer has been sensitive to most BMPs over the period of this study, except in the last agricultural season, where some of the BMPs (soil management-related) were not applied. However, this fact shows that changes can either improve or decrease the INSPIA index value.
Soil management sustainability impact on permanent crops can be measured through assessment tools such as INSPIA. Sudden changes in the behaviours of farmers concerning the implementation of some BMPs should not be expected because of the farmers’ mindset and culture.
The step back found in the last season reflects the need for training to farmers. The process of improving farmer performance should be accompanied by a continuous training period and correct capacity-building actions, as well as the need to create and exchange knowledge-transfer among the groups of farmers that concern their collective achievements.

Author Contributions

Conceptualization, P.T.-T., P.C.-C. and E.J.G.-S.; methodology, P.T.-T. and E.J.G.-S.; validation, P.T.-T., P.C.-C. and E.J.G.-S.; investigation, P.T.-T. and E.J.G.-S.; data curation, P.T.-T.; writing—original draft preparation, P.T.-T.; writing—review and editing, P.T.-T., F.-J.M.-C. and E.J.G.-S.; supervision, P.T.-T., P.C.-C., F.-J.M.-C., and E.J.G.-S. All authors have read and agreed to the published version of the manuscript.

Funding

This research was supported by the European Crop Protection Association (ECPA) and the European Conservation Agriculture Federation (ECAF).

Acknowledgments

The authors want to thank the following organisations: Asociación Española Agricultura de Conservación Suelos Vivos (AEACSV) and Association pour la Promotion d’une Agriculture Durable (APAD) for putting the ideas into practice on farms, and to the European Conservation Agriculture Federation (ECAF) and the European Crop Protection Association (ECPA) for co-sponsoring the INSPIA project. We would also like to especially thank the Jiménez del Pino’s brothers, who kindly offered theirs time and farm to get all needed data for this research.

Conflicts of Interest

The authors declare no conflicts of interest.

References

  1. Hansen, J.W. Is agricultural sustainability a useful concept? Agric. Syst. 1996, 50, 117–143. [Google Scholar] [CrossRef]
  2. Lamastra, L.; Balderacchi, M.; Guardo, A.D.; Monchiero, M.; Trevisan, M. A novel fuzzy expert system to assess the sustainability of the viticulture at the wine-estate scale. Sci. Total Environ. 2016, 572, 724–733. [Google Scholar] [CrossRef]
  3. Bohanec, M.; Cortet, J.; Griffiths, B.; Znidarsic, M.; Debeljak, M.; Caul, S.; Thompson, J.; Krogh, P.H. A qualitative multi-attribute model for assessing the impact of cropping systems on soil quality. Pedobiologia 2007, 51, 239–250. [Google Scholar] [CrossRef]
  4. Juwana, I.; Muttil, N.; Perera, B.J.C. Indicator-based water sustainability assessment-A review. Sci. Total Environ. 2012, 438, 357–371. [Google Scholar] [CrossRef] [Green Version]
  5. Abbona, E.A.; Sarnadón, S.J.; Marasas, M.E.; Astier, M. Ecological sustainability evaluation of traditional management in different vineyard systems in Berisso, Argentina. Agric. Ecosyst. Environ. 2007, 119, 335–345. [Google Scholar] [CrossRef]
  6. Lichtfouse, E.; Navarrete, M.; Debaeke, P.; Souchère, V.; Alberola, C.; Menassieu, J. Agronomy for Sustainable Agriculture, A review. Agron. Sustain. Dev. 2009, 29, 1–6. [Google Scholar] [CrossRef]
  7. Brundtland, G.; Khalid, M.; Agnelli, S.; Saleh, A.A.; Chidzero, B.; Fadika, L.M.; Hauff, V.; Lung, I.; Shijun, M.; Botero, M.M.D.; et al. United Nations World Commission on Environment and Development. 1987. Brundtland Report. Our Common Future. Available online: https://en.wikisource.org/wiki/Brundtland_Report?linklisted=2812 (accessed on 30 November 2019).
  8. Zahm, F.; Viaux, P.; Vilain, L.; Girardin, P.; Mouchet, C. Assessing farm sustainability with the IDEA method- from the concept of agriculture sustainability to case studies of farms. Sustain. Dev. 2008, 16, 271–281. [Google Scholar] [CrossRef]
  9. Paracchini, M.L.; Bulgheroni, C.; Borreani, G.; Tabacco, E.; Banterle, A.; Bertoni, D.; De Paola, C. A diagnostic system to assess sustainability at a farm level: The SOSTARE model. Agric. Syst. 2015, 133, 35–53. [Google Scholar] [CrossRef]
  10. Triviño-Tarradas, P.; Gomez-Ariza, M.R.; Basch, G.; Gonzalez-Sanchez, E.J. Sustainability Assessment of Annual and Permanent Crops: The INSPIA model. Sustainability 2019, 11, 738. [Google Scholar] [CrossRef] [Green Version]
  11. Van Cauwenbergh, N.; Biala, K.; Bielders, C.; Brouckaert, V.; Franchois, L.; García-Cidad, V.; Hermy, M.; Mathijs, E.; Muys, B.; Reijnders, J.; et al. SAFE_A hierarchical framework for assessing sustainability of agricultural systems. Agric. Ecosyst. Environ. 2007, 120, 229–242. [Google Scholar] [CrossRef]
  12. Craheix, D.; Angevin, F.; Bergez, J.E.; Bockstaller, C.; Colomb, B.; Guichard, L.; Reau, R.; Doré, T. MASC 2.0. un outil d’evaluation multicritère our estimer la contribution des systèmes de culture au développement durable. Innov. Agron 2012, 20, 35–48. [Google Scholar]
  13. Peano, C.; Tecco, N.; Dansero, E.; Girgenti, V.; Sottile, F. Evaluating the sustainability in complex agri-food systems: The SAEMETH framework. Sustainability 2015, 7, 6721–6741. [Google Scholar] [CrossRef] [Green Version]
  14. Meul, M.; Van Passel, S.; Nevens, F.; Dessein, J.; Rogge, E.; Mulier, A.; Van Hauwermeire, A. MOTIFS: A monitoring tool for integrated farm sustainability. Agron. Sustain. Dev. 2008, 28, 321–332. [Google Scholar] [CrossRef] [Green Version]
  15. Bockstaller, C.; Girardin, P.; van der Werf, H.M.G. Use of agro-ecological indicators for the evaluation of farming systems. Eur. J. Agron. 1997, 7, 261–270. [Google Scholar] [CrossRef]
  16. FAO. The Future of Food and Agriculture: Trends and Challenges. 2017. Available online: http://www.fao.org/3/a-i6583e.pdf (accessed on 10 December 2019).
  17. Pardo-Calle, C.; Segovia-González, M.M.; Paneque-Macías, P.; Espino-Gonzalo, C. An approach to zoning in the wine growing regions of “Jerez-Xérez-Sherry” and “Manzanilla-Sanlúcar de Barrameda” (Cádiz, Spain). Span. J. Agric. Res. 2011, 9, 831–843. [Google Scholar] [CrossRef] [Green Version]
  18. Hinojosa-Rodríguez, A.; Parra-López, C.; Carmona-Torres, C.; Sayadi, S. Protected Designation of Origin in the Olive Growing Sector: Adoption Factors and Goodness of practices in Andalusia, Spain. New Medit. 2014, 13, 2–12. [Google Scholar]
  19. MAPAMA. Encuesta Sobre Superficies y Rendimientos de Cultivos. 2017. Available online: https://www.mapa.gob.es/es/estadistica/temas/estadisticas-agrarias/boletin2017sm_tcm30-455983.pdf (accessed on 27 November 2019).
  20. INE. 2009. Available online: https://www.ine.es/dyngs/INEbase/es/operacion.htm?c=Estadistica_C&cid=1254736176851&menu=ultiDatos&idp=1254735727106 (accessed on 12 November 2019).
  21. MAPAMA b. 2017. Available online: https://www.mapa.gob.es/es/estadistica/temas/publicaciones/anuario-de-estadistica/2017/default.aspx?parte=3&capitulo=13 (accessed on 12 November 2019).
  22. Consejería de Agricultura, Pesca y Desarrollo Rural. El sector del vino andaluz en cifras; Secretaria General de Agricultura y Alimentación, 2017; Consejería de Agricultura, Pesca y Desarrollo Rural. Available online: https://www.juntadeandalucia.es/export/drupaljda/estudios_informes/17/11/El_sector_del_vino_andaluz_en_cifras_SEE.pdf (accessed on 21 November 2019).
  23. Consejería de Agricultura, Pesca y Desarrollo Rural. 2013. Available online: https://www.juntadeandalucia.es/export/drupaljda/Datos%20sector%20agrario%20y%20pesquero%202016-1.pdf (accessed on 20 November 2019).
  24. Consejería de Medio Ambiente y Ordenación del Territorio. 2011. Available online: http://www.juntadeandalucia.es/ (accessed on 21 November 2019).
  25. Martinez-Raya, A.; Francia, J.R.; Martinez-Vilela, A. Introducción a la agricultura de conservación en olivar. Evaluación del comportamiento de los sistemas de manejo de suelo; Cubiertas vegetales en olivar, Ed.; Junta de Andalucía, Consejería de Agricultura y Pesca: Sevilla, Spain, 2007; Available online: https://www.juntadeandalucia.es/export/drupaljda/1337161293CUBIERTAS_VEGETALES_9-07_mod_por_JMD.pdf (accessed on 31 January 2020).
  26. Sastre, B.; Marquez, M.J.; García-Díaz, A.; Bienes, R. Three years of management with cover crops protecting sloping olive groves soils, carbon and water effects on gypsiferous soil. Catena 2018, 171, 115–124. [Google Scholar] [CrossRef]
  27. COUNCIL REGULATION (EC) No 1257/1999 of 17 May 1999 on Support for Rural Development from the European Agricultural Guidance and Guarantee Fund (EAGGF) and Amending and Repealing Certain Regulations. Available online: https://op.europa.eu/en/publication-detail/-/publication/c70dfc8c-6243-4b1a-817e-4673042024c4 (accessed on 10 October 2019).
  28. Prosdocimi, M.; Cerdà, A.; Tarolli, P. Soil water erosion on Mediterranean vineyards: A review. Catena 2016, 141, 1–41. [Google Scholar] [CrossRef]
  29. González-Sánchez, E.J.; Kassam, A.; Basch, G.; Streit, B.; Holgado-Cabrera, A.; Triviño-Tarradas, P. Conservation Agriculture and its contribution to the achievement of agri-environmental and economic challenges in Europe. AIMS Agric. Food 2016, 1, 387–408. [Google Scholar] [CrossRef]
  30. MAPAMA. Encuesta Sobre Superficies y Rendimientos de Cultivos. 2011. Available online: https://www.mapa.gob.es/es/estadistica/temas/estadisticas-agrarias/boletinweb2011_corregido_tcm30-122319.pdf (accessed on 29 November 2019).
  31. González-Sánchez, E.J.; Veroz-González, O.; Blanco-Roldán, G.L.; Marquez-Garcia, F.; Carbonell-Bojollo, R. A renewed view of Conservation Agriculture and its evolution over the last decade in Spain. Soil Tillage Res. 2015, 146, 204–212. [Google Scholar] [CrossRef]
  32. Ibañez, S.; Pérez, J.L.; Peregrina, F.; García-Escudero, E. Utilización de cubiertas vegetales en viñedos de la DOP. Rioja (España). Le Bulletin de l’OIV 2011, 84, 347–360. [Google Scholar]
  33. FAO. 2009. Available online: http://www.fao.org/fileadmin/templates/wsfs/docs/Issues_papers/HLEF2050_Global_Agriculture.pdf (accessed on 19 November 2019).
  34. FAO. Safe and Growth. A Policymaker’s Guide to the Sustainable Intensification of Smallholder Crop Production. 2011. Available online: http://www.fao.org/3/a-i2215e.pdf (accessed on 22 November 2019).
  35. Kassam, A.; Basch, G.; Friedrich, T.; Gonzalez, E.; Triviño, P.; Mkomwa, S. Mobilizing greater crop and land potentials sustainably. Hung. Geogr. Bull. 2017, 66, 1–9. [Google Scholar] [CrossRef] [Green Version]
  36. Salvia, R.; Simone, R.; Salvati, L.; Quaranta, G. Soil Conservation Practices and Stakeholder’s Participation in Research Projects—Empirical Evidence from Southern Italy. Agriculture 2018, 8, 85. [Google Scholar] [CrossRef] [Green Version]
  37. MAPAMA. Encuesta Sobre Superficies y Rendimientos de Cultivos. 2019. Available online: https://www.mapa.gob.es/es/estadistica/temas/estadisticas-agrarias/comentariosespana2019_tcm30-522390.pdf (accessed on 30 December 2019).
  38. BOJA. Orden de 3 de mayo de 2016 (BOJA 89 de 12 de mayo 2016), por la que se emite decisión favorable en relación a la solicitud de aprobación de una modificación del pliego de condiciones de la denominación de origen protegida ‘Montilla-Moriles’. 2016. Available online: https://www.juntadeandalucia.es/boja/2016/89/23 (accessed on 31 January 2020).
  39. Consejo Regulador Montilla-Moriles. 2016. Available online: https://www.montillamoriles.es/la-denominacion/viticultura/el-clima.html (accessed on 21 January 2020).
  40. AEMET. Agencia Estatal de Meteorología de España. 2019. Available online: https://datosclima.es/Aemethistorico/Lluviasol.php (accessed on 21 January 2020).
  41. FAO. The Sustainable Development Agenda. 2016. Available online: www.fao.org/sustainable-development-goals/indicators/en/ (accessed on 22 November 2019).
  42. Marchand, F.; Debruyne, L.; Triste, L.; Gerrard, C.; Padel, S.; Lauwers, L. Key characteristics for tool choice in indicator-based sustainability assessment at farm level. Ecol. Soc. 2014, 19, 46. [Google Scholar] [CrossRef] [Green Version]
  43. INSPIA. 2013. Available online: http://www.inspia-europe.eu/ (accessed on 29 November 2019).
  44. Santiago-Brown, I.; Metcalfe, A.; Jerram, C.; Collins, C. Sustainability Assessment in Wine-Grape Growing in the New World: Economic, Environmental, and Social Indicators for agricultural Businesses. Sustainability 2015, 7, 8178–8204. [Google Scholar] [CrossRef] [Green Version]
  45. Qiu, H.; Zhu, W.; Wang, H.; Cheng, X. Analysis and design of agricultural sustainability indicators systems. Agric. Sci. China 2007, 6, 475–486. [Google Scholar] [CrossRef]
  46. Directive 2009/128/EC of the European Parliament and of the Council of 21 October 2009 Establishing a Framework for Community Action to Achieve the Sustainable Use of Pesticides. Available online: https://eur-lex.europa.eu/legal-content/EN/TXT/PDF/?uri=CELEX:32009L0128&rid=8 (accessed on 21 November 2019).
  47. SigPac Junta de Andalucía. 2019. Available online: http://ws128.juntadeandalucia.es/agriculturaypesca/sigpac/index.xhtml (accessed on 11 November 2019).
  48. Pastor, M.; Castro, J.; Humanes, M.D.; Muñoz, J. Sistemas de Manejo de Suelo en Olivar de Andalucía. Edafología 2001, 8, 75–98. [Google Scholar]
  49. Basch, G.; Kassam, A.; González-Sanchez, E.J.; Streit, B. Making Sustainable Agriculture Real in CAP 2020: The Role of Conservation Agriculture; ECAF: Brussels, Belgium, 2012; Available online: http://www.agricarbon.eu/fichas_publicaciones/ca%20and%20cap%202020.pdf (accessed on 31 January 2020).
  50. Topps Prowadis. 2017. Available online: http://www.topps-life.org/uploads/8/0/0/3/8003583/runoff_field_manual_eng.pdf (accessed on 26 November 2019).
  51. Fraga, H.; Santos, J.A. Vineyard mulching as a climate change adaptation measure: Future simulations for Alentejo, Portugal. Agric. Syst. 2018, 164, 107–115. [Google Scholar] [CrossRef]
  52. DeVetter, L.W.; Dilley, C.A.; Nonnecke, G.R. Mulches Reduce Weeds, Maintain Yield, and Promote Soil Quality in a Continental-Climate Vineyard. Am. J. Enol. Vitic. 2015, 6, 54–64. [Google Scholar] [CrossRef]
  53. Pou, A.; Gulias, J.; Moreno, M.; Tomas, M.; Medrano, H.; Cifre, J. Cover cropping in “Vitis vinifera” L. cv. Manto negro vineyards under Mediterranean conditions: Effects on plant vigour, yield and grape quality. J. Int. Des Sci. De La Vigne Et Du Vin. 2011, 45, 223–234. [Google Scholar] [CrossRef] [Green Version]
  54. Ramírez-Pérez, P.; Lucena-Molina, A.I.; Gonzalez-Caballero, V.; Lasheras-Ocaña, J.; López-Infante, I. Efectos del uso de una cubierta vegetal en el rendimiento, vigor y calidad de la uva. SERVIFAPA. Junta de Andalucía. Instituto de Investigación y Formación Agraria y Pesquera. Consejería de Agricultura, Pesca y Desarrollo Rural. 2011. Available online: http://www.sech.info/ACTAS/Acta%20n%C2%BA%2060.%20XIII%20Congreso%20Nacional%20de%20Ciencias%20Hort%C3%ADcolas/Viticultura/Efectos%20del%20uso%20de%20una%20cubierta%20vegetal%20en%20el%20rendimiento,%20vigor%20y%20calidad%20de%20la%20uva.pdf (accessed on 12 November 2019).
  55. Organisation for Economic Cooperation and Development (OECD). Environmental Indicators for Agriculture, Methods and Results; OECD: Paris, France, 2001; Volume 3, Available online: https://www.oecd.org/greengrowth/sustainable-agriculture/1916629.pdf (accessed on 31 January 2020).
  56. Perego, A.; Rocca, A.; Cattivelli, V.; Tabaglio, V.; Fiorini, A.; Barbieri, S.; Schillaci, C.; Chiodini, M.E.; Brenna, S.; Acutis, M. Agro-environmental aspects of conservation agricultura compared to conventional systems: A 3-year experience on 20 farms in the Po valley (Norther Italy). Agric. Syst. 2019, 168, 73–87. [Google Scholar] [CrossRef] [Green Version]
  57. Paustian, K.; Lehmann, J.; Ogle, S.; Reay, D.; Robertson, G.P.; Smith, P. Climate-smart soils. Nature 2016, 532, 49–57. [Google Scholar] [CrossRef] [PubMed] [Green Version]
  58. AEAC.SV. Asociación Española de Agricultura de Conservación. Suelos Vivos. 2017. Available online: http://www.agriculturadeconservacion.org/index.php/descargas/fichas-tecnicas (accessed on 1 December 2019).
  59. Fernández-Ugalde, O.; Virto, I.; Bescansa, P.; Imaz, M.J.; Enrique, A.; Karlen, D.L. No-tillage improvement of soil physical quality in calcareous, degradation-prone, semiarid soils. Soil Tillage Res. 2009, 106, 29–35. [Google Scholar] [CrossRef]
  60. González-Sánchez, E.J.; Moreno-García, M.; Kassam, A.; Holgado-Cabrera, A.; Triviño-Tarradas, P.; Carbonell-Bojollo, R.; Pisante, M.; Veroz-González, O.; Basch, G. Conservation Agriculture: Making Climate Change Mitigation and Adaptation Real in Europe. ECAF, Brussels. 2017. Available online: http://www.ecaf.org/inaction/news/item/60-a-major-new-research-study-in-favour-of-conservation-agriculture (accessed on 15 November 2019).
  61. Rodrigo-Comino, J.; Senciales, J.M.; Ramos, M.C.; Martínez-Casanovas, J.A.; Lasanta, T.; Brevik, E.C.; Ries, J.B.; Ruiz-Sinoga, J.D. Understandib soil erosion processes in Mediterranean sloping vineyards (Montes de Málaga, Spain). Geoderma 2017, 296, 47–59. [Google Scholar] [CrossRef] [Green Version]
  62. Ruiz-Colmenero, R.; Bienes, R.; Eldridge, D.J.; Marquez, M.J. Vegetation cover reduces erosion and enhances soil organic carbon in a vineyard in central Spain. Catena 2013, 104, 153–160. [Google Scholar] [CrossRef]
  63. Colnenne-David, C.; Grandeau, G.; Jeuffroy, M.H.; Dore, T. Ambitious environmental and economic goals for the future of agriculture are unequally achieved by innovative cropping systems. Field Crops Res. 2017, 210, 114–128. [Google Scholar] [CrossRef]
  64. Lafond, J.; Pageau, D. Economically optimal nitrogen rate and soil nitrate after canola harvest. Can. J. Plant Sci. 2008, 88, 1035–1042. [Google Scholar] [CrossRef]
  65. Consejería de Agricultura y Pesca. Suelo, Riego, Nutrición y Medio Ambiente del olivar. Instituto Andaluz de Investigación y Formación Agraria, Pesquera, Alimentaria y de la Producción Ecológica. 2004. Available online: https://www.juntadeandalucia.es/export/drupaljda/1337165053SUELOx_RIEGO_Y_NUTRICION_OLIVAR.pdf (accessed on 2 December 2019).
  66. Lopez-Bellido, P.J.; Lopez-Bellido, L.; Fernandez-Garcia, P.; Muñoz-Romero, V.; Lopez-Bellido, F.J. Assessment of carbon sequestration and the carbon footprint in olive groves in Southern Spain. Carbon Manag. 2016, 7, 161–170. [Google Scholar] [CrossRef]
  67. González-Sánchez, E.J.; Ordoñez-Fernández, R.; Carbonell-Bojollo, R.; Veroz-González, O.; Gil-Ribes, J.A. Meta-analysis on atmospheric carbon capture in Spain through the use of conservation agriculture. Soil Tillage Res. 2012, 122, 52–60. [Google Scholar] [CrossRef]
  68. Vicente-Vicente, J.L.; García-Ruiz, R.; Francaviglia, R.; Aguilera, E.; Smith, P. Soil carbon sequestration rates under Mediterranean Woody crops using recommended management practices: A meta-analysis. Agric. Ecosyst. Environ. 2016, 235, 204–214. [Google Scholar] [CrossRef] [Green Version]
  69. Melero, S.; López-Bellido, R.J.; López-Bellido, L.; Muñoz-Romero, V.; Moreno, F.; Murillo, J.M. Long-tern effect of tillage, rotation and nitrogen fertiliser on soil quality in a Mediterranean Vertisol. Soil Tillage Res. 2011, 114, 97–107. [Google Scholar] [CrossRef]
  70. Chen, S.Y.; Zhang, X.Y.; Pei, D.; Sun, H.I.; Chen, S.L. Effects of straw mulching on soil temperature, evaporation and yield of winter wheat: Field experiments on North China plain. Ann. Appl. Biol. 2007, 150, 261–268. [Google Scholar] [CrossRef]
  71. García-Díaz, A.; Marquéz, M.J.; Sastre, B.; Bienes, R. Labile and stable soil organic carbon and physical improvements using groundcovers in vineyards from central Spain. Sci. Total Environ. 2018, 321, 387–397. [Google Scholar] [CrossRef] [PubMed] [Green Version]
  72. Trigo–Córdoba, E.; Bouzas-Cid, Y.; Orriols-Fernández, L.; Díaz-Losada, E.; Mirás-Avalos, J. Influence of cover crops treatments on the performance of a vineyard in a humid region. Span. J. Agric. Res. 2015, 13, 12. [Google Scholar] [CrossRef] [Green Version]
  73. Marshall, E.; Moonen, A. Field margins in northern Europe: Their functions and interactions with agriculture. Agric. Ecosyst. Environ. 2002, 89, 5–21. [Google Scholar] [CrossRef]
  74. Haddaway, N.R.; Brown, C.; Eales, J.; Eggers, S.; Josefsson, J.; Kronvang, B.; Randall, N.P.; Uusi-Kämppä, J. The multifunctional roles of vegetated strips around and within agricultural fields. Environ. Evid. 2018, 7, 14. [Google Scholar] [CrossRef] [Green Version]
  75. Helps, M.B. Field margins-an agricultural perspective. In Field Margins: Integrating Agriculture and Conservation; Boatman, N.D., Ed.; BCPC Monograph No 58; British Crop Protection Council: Farnham, UK, 1997; pp. 21–30. [Google Scholar]
  76. Carr, S.N.; Bell, M. Practical Conservation: Boundary Habitats; Hodder and Stoughton: London, UK, 1991; 127p. [Google Scholar]
  77. Häni, F.; Braga, F.; Stämpfli, A.; Keller, T.; Fischer, M.; Porsche, H. RISE, a tool for Holistic Sustainability assessment at the farm level. Int. Food Agribus. Manag. Rev. 2003, 6, 1–13. [Google Scholar] [CrossRef]
  78. Kassam, A.; Friedrich, T.; Shaxson, F.; Pretty, J. The spread of Conservation Agriculture: Justification, sustainability and uptake. Int. J. Agric. Sustain. 2009, 7, 292–320. [Google Scholar] [CrossRef]
  79. FAO. Conservation Agriculture Website. Food and Agriculture Organization of the United Nations. 2015. Available online: http://www.fao.org./ag/ca/index.html (accessed on 7 December 2019).
  80. Jordan, V.W.L. The development of integrated arable production systems to meet potential economic and environmental requirements. Outlook Agric. 1998, 27, 145–151. [Google Scholar] [CrossRef]
Figure 1. Location of the study farm ‘Lagar Cañada Navarro’ (a). Location of the vineyard plots and olive trees plot of the farm. Plots number 1, 2 and 3 (vineyards) and plot number 4 (olive orchard) (b).
Sustainability 12 01090 g001
Figure 2. Dendrogram of basic and aggregated (level 1 and 2) indicators to calculate the final INSPIA composite index [10].
Sustainability 12 01090 g002
Figure 3. Graphical and numerical outcomes on basic indicators (a), aggregated indicators (level 1) (b), and composite sustainability index of the studied farm (c) for the agricultural season 2016/2017. Basic and aggregated indicators in red correspond to the economic INSPIA indicators, basic and aggregated indicators in blue correspond to the INSPIA social indicators, and basic and aggregated indicators in green correspond to the INSPIA environmental indicators (bar and pie chart graphs). The colour code used in the background in (a,b) reflects the sustainability degree, unacceptable (0–≤33), critical (>33–≤67), and optimal (>67–100).
Sustainability 12 01090 g003aSustainability 12 01090 g003b
Figure 4. Graphical and numerical outcomes on basic indicators (a), aggregated indicators (level 1) (b), and composite sustainability index of the studied farm (c) for the agricultural season 2017/2018. Basic and aggregated indicators in red correspond to the economic INSPIA indicators, basic and aggregated indicators in blue correspond to the INSPIA social indicators, and basic and aggregated indicators in green correspond to the INSPIA environmental indicators (bar and pie chart graphs). The colour code used in the background in (a,b) reflects the sustainability degree, unacceptable (0–≤33), critical (>33–≤67), and optimal (>67–100).
Sustainability 12 01090 g004aSustainability 12 01090 g004b
Figure 5. Evolution of the INSPIA sustainability composite index.
Sustainability 12 01090 g005
Figure 6. Evolution of the eligible BMPs implementation rate.
Sustainability 12 01090 g006
Figure 7. Barley groundcovers in between the vineyards. Source: Hermanos Jiménez del Pino (a), Chemical harvest of groundcovers (agricultural season 2015/2016). Source: Compiled by authors (b).
Sustainability 12 01090 g007
Figure 8. Soil management alternation (“aserpiado” tillage and barley groundcovers) in vineyards (agricultural season 2013/2014). Source: Hermanos Jiménez del Pino.
Sustainability 12 01090 g008
Table 1. Temperature and rainfall data of the two nearest weather stations to the study farm: ‘Doña Mencía’ and ‘Córdoba Aeropuerto’.
Doña Mencía (25 km)Córdoba Aeropuerto (35 km)
Average annual precipitation (mm) (20 years)500566
Maximum temperature (°C)41.9 (10/08/2012)46.9 (13/07/2017)
Minimum temperature (°C)−9.3 (27/01/2015)−8.2 (28/01/2005)
Average annual precipitation * (2013/2014) (mm)393.2465.3
Average annual precipitation * (2014/2015) (mm)375.4387.1
Average annual precipitation * (2015/2016) (mm)446.0514.8
Average annual precipitation * (2016/2017) (mm)364.6463.7
Average annual precipitation * (2017/2018) (mm)662.3529.9
* Data monitored from October 1st to September 31st of the following year.
Table 2. INSPIA Basic indicators results of the studied farm for the 5 agricultural seasons dataset.
No.INSPIA Basic IndicatorUnits2013/20142014/20152015/20162016/20172017/2018
1Net income per ha€/ha2114.001890.001951.002156.001915.00
2Net income per annual work unit (AWU)€/AWU91,219.0083,362.0086,236.0098,277.0095,167.00
3Production cost per ha€/ha1672.001623.001628.001653.001605.00
4Yield-85.4086.5086.80108.7086.20
5N Productivitykg/kg111.03113.87114.35113.91113.08
6P Productivitykg/kg95.6096.3296.5695.6065.00
7Irrigation water applicationm3/ha750.00750.00750.00750.00750.00
8Water productivitykg/m313.3314.0014.0914.1512.00
9Energy balanceMJ/ha3311.003313.003283.003321.003150.00
10Energy efficiencyMJ/MJ3.303.303.403.303.20
11Energy productivitykg/MJ9.749.839.8710.109.60
12Working hours per hah/ha15.8215.7915.7813.8117.67
13Satisfaction index-5.505.508.5010.004.75
14Farmers’ training levels-2.502.503.006.006.00
15Risk of abandonment of agricultural activity-00000
16Soil tillage index-14.0010.018.208.2014.00
17Soil cover rate-0.830.840.840.840.38
18Soil erosion risk-0.190.190.180.170.28
19Organic matter%0.480.480.520.800.77
20Crop diversity-0.190.190.190.190.19
21Crop rotations-00000
22N Balancekg N/ha−7.10−6.20−6.02−6.42−3.32
23N Efficiencykg/kg1.161.201.201.200.85
24P Balancekg P/ha7.607.757.797.697.60
25P Efficiencykg/kg1.431.441.451.431.33
26GHGs BalanceKg CO2eq/ha1677.001677.001671.001678.002735.00
27GHGs per kgkg CO2eq/kg0.140.140.140.140.23
28Natural area%1.631.631.631.631.63
29Biodiversity structures-1.001.001.334.003.33
30Buffers and security areas%0.360.360.360.360.30
31Plant Protection Product (PPP) management-4.004.004.0021.0021.00
Table 3. List of INSPIA best management practices (BMPs).
BMP No.Name of the BMP
1Use permanent soil cover (green cover or residue cover)
2Use of minimum soil disturbance practices
3Use of groundcovers (for permanent crops)
4Perform suitable crop rotation/diversification
5Perform farming operations following the contour lines
6Fertilize according to soil deficiencies and crop needs
7Plant Protection Product (PPP, i.e., pesticide) use according to Integrated Pest Management Strategy [46]
8Use of modern technologies for applications (Precision Agriculture)
9Optimise irrigation timing and rate
10Optimised use of pesticides (correct dose and appropriate product)
11Implementation of field margins and buffer strips with diversity of plant species
12Establish and maintain riparian buffers
13Build retention structures across slopes to reduce the length of plots (fascines, vegetative buffers)
14Point source prevention of PPP (pesticide) pollution on the farm
15Perform optimised waste management

