Article

Core Competitiveness Evaluation of Clean Energy Incubators Based on Matter-Element Extension Combined with TOPSIS and KPCA-NSGA-II-LSSVM

1
School of Economics and Management, North China Electric Power University, Beijing 102206, China
2
School of Management, Hebei Geo University, Shijiazhuang 050031, China
*
Author to whom correspondence should be addressed.
Sustainability 2020, 12(22), 9570; https://doi.org/10.3390/su12229570
Submission received: 17 October 2020 / Revised: 12 November 2020 / Accepted: 15 November 2020 / Published: 17 November 2020
(This article belongs to the Special Issue Energy Development for Sustainability)

Abstract

:
Scientific and accurate core competitiveness evaluation of clean energy incubators is of great significance for improving their burgeoning development. Hence, this paper proposes a hybrid model on the basis of matter-element extension integrated with TOPSIS and KPCA-NSGA-II-LSSVM. The core competitiveness evaluation index system of clean energy incubators is established from five aspects, namely strategic positioning ability, seed selection ability, intelligent transplantation ability, growth catalytic ability and service value-added ability. Then matter-element extension and TOPSIS based on entropy weight is applied to index weighting and comprehensive evaluation. For the purpose of feature dimension reduction, kernel principal component analysis (KPCA) is used to extract momentous information among variables as the input. The evaluation results can be obtained by least squares support vector machine (LSSVM) optimized by NSGA-II. The experiment study validates the precision and applicability of this novel approach, which is conducive to comprehensive evaluation of the core competitiveness for clean energy incubators and decision-making for more reasonable operation.

1. Introduction

Clean energy plays an important role in reducing carbon emissions, so more and more countries vigorously develop clean energy [1]. As a promotion agency of clean energy industrialization, clean energy incubator has become a crucial part of innovation system. With the burgeoning development of clean energy incubators in recent years, governments all over the world are introducing policies to actively encourage their establishment [2]. Whereas, these incubators are faced with the problems of valuing quantity and neglecting quality. Some incubators still stay in the stage of property leasing and simple incubation service, but still enjoy the preferential policies of the government and waste public resources [3]. In addition, the planning of many clean energy business incubators is mainly oriented towards the layout of hardware and space, and ignores the planning of soft capabilities such as incubation ability [4]. In order to further play the role of incubators and realize their sustainable development, it is necessary to make the factors clear which affect the core competitiveness and propose a feasible evaluation model. The research on the core competitiveness evaluation of clean energy incubator can help managers find out the deficiencies, and then help managers to improve these deficiencies. Thus this study can provide suggestions for enhancing competitiveness of clean energy incubators.
In 1990, C.K. Prahalad and Gary Hamel, professors of Michigan University and London Business School, respectively, formally raised the concept of “core competitiveness” for the first time. They pointed out that core competitiveness was the ability to coordinate different production skills as well as organically combine various technological schools [5]. Literature [6] discussed how to integrate technological innovation into the core competitiveness of enterprises. The research held that it was of great theoretical and practical significance to put the core competitiveness evaluation into force for sustainable development. Reference [7] considered that environmental adaptability was an important component of the core competitiveness in photovoltaic module supply enterprises. Thereby, it provided suggestion in business decision-making. Thirteen influential factors of core competitiveness were selected in modern circulation industry from market expansion, innovation, circulation efficiency, sustainable development and circulation effect in reference [8]. The evaluation was achieved through study on both independent and synergistic effect of the factors. Hence, it becomes a good entry point to analyze the key resources and capabilities demanded by the sustainable development of enterprises.
At present, scholars have published their significant work on core competitiveness evaluation of incubators, but few focus on the clean energy enterprise. There are some similarities among these research subjects, such as the content and components of kernel competence. Thus the existing study also can provide reference for the research. Reference [9] developed Principal component analysis (PCA) and SPSS based model to evaluate scientific enterprise incubators of nine cities in Pearl River Delta. The results showed the ranking and classification of incubators and put forward development plan accordingly. Literature [10] conducted a questionnaire survey on six chain incubators. The relationship between quantitative performance and importance was revealed through IPA in competitiveness evaluation. Reference [11] outlined the assessment approach of enterprise incubator based on PCA and DEA from the perspective of service and operation efficiency. A comprehensive technique that integrates questionnaire survey with grey correlation assesses the national incubators regarding knowledge service capability in [12]. Reference [13] paid close attention to social benefits in core competitiveness assessment of incubators. The evaluation is executed from five aspects, that is, public service, innovation and development, social education, labor employment and enterprise cultivation.
Evaluation methods can be separated into two categories: traditional assessment technique and modern intelligent algorithm. The former needs complex calculation despite its mature development and accurate results, such as fuzzy comprehensive evaluation method [14] matter-element extension assessment [15] and TOPSIS [16]. Reference [14] developed an approach to reveal the relationship between exposure, sensitivity and adaptive capacity for better flood vulnerability assessment, based on the fuzzy comprehensive evaluation method. Reference [15] utilized the improved fuzzy matter-element extension assessment model to evaluate urban water ecosystem health effectively. Reference [16] used the improved TOPSIS model to evaluate the sustainability of power grid construction projects. Modern intelligent approaches chiefly consist of back propagation neural network [17], extreme learning machine [18], support vector machine [19], least squares support vector machine (LSSVM) [20]. Thereby, this paper intends to combine the traditional evaluation model and intelligent algorithm to assess the core competitiveness of clean energy incubators. Concretely, matter-element extension assessment is first applied to obtain the results. Then, LSSVM is employed for intelligent evaluation. However, owing to blind selection of penalty and kernel coefficients, it’s essential to use an appropriate method for optimization [21]. NSGA-II is a multi-objective model based on the first generation of non dominated sorting genetic algorithm with the advantage of excellent performance and high efficiency [22]. For example, reference [23] used the NSGA-II algorithm to obtain the multi-objective optimisation of an interactive buildings-vehicles energy sharing network with high energy flexibility, which achieved good optimization results. To this end, this paper exploits NSGA-II to automatically decide the appropriate values in LSSVM.
It is worth noting that there exist many influencing factors on the core competitiveness of clean energy incubators. Dimension reduction is critical for accuracy on account of strong coupling, nonlinearity and redundancy in the indicators [24]. PCA, as a multivariate statistical approach, has the advantage over dealing with indexes with strong linear relationship [25]. Nevertheless, the relationship among the core competitiveness indicators of clean energy incubators is mostly nonlinear. PCA is not able to acquire high-order features which ignores the nonlinear information while reducing the dimension [26]. As a result, kernel principal component analysis (KPCA) is used in this paper to map the initial input variables to high-dimensional feature space through nonlinear transformation so that the input dimension can be reduced on the premise of retaining nonlinear information among variables [27].
Therefore, this paper establishes the core competitiveness index system of clean energy incubator and proposes a hybrid model integrated matter-element extension assessment and KPCA-NSGA-II-LSSVM for evaluation. The rest of paper is organized as follows: 
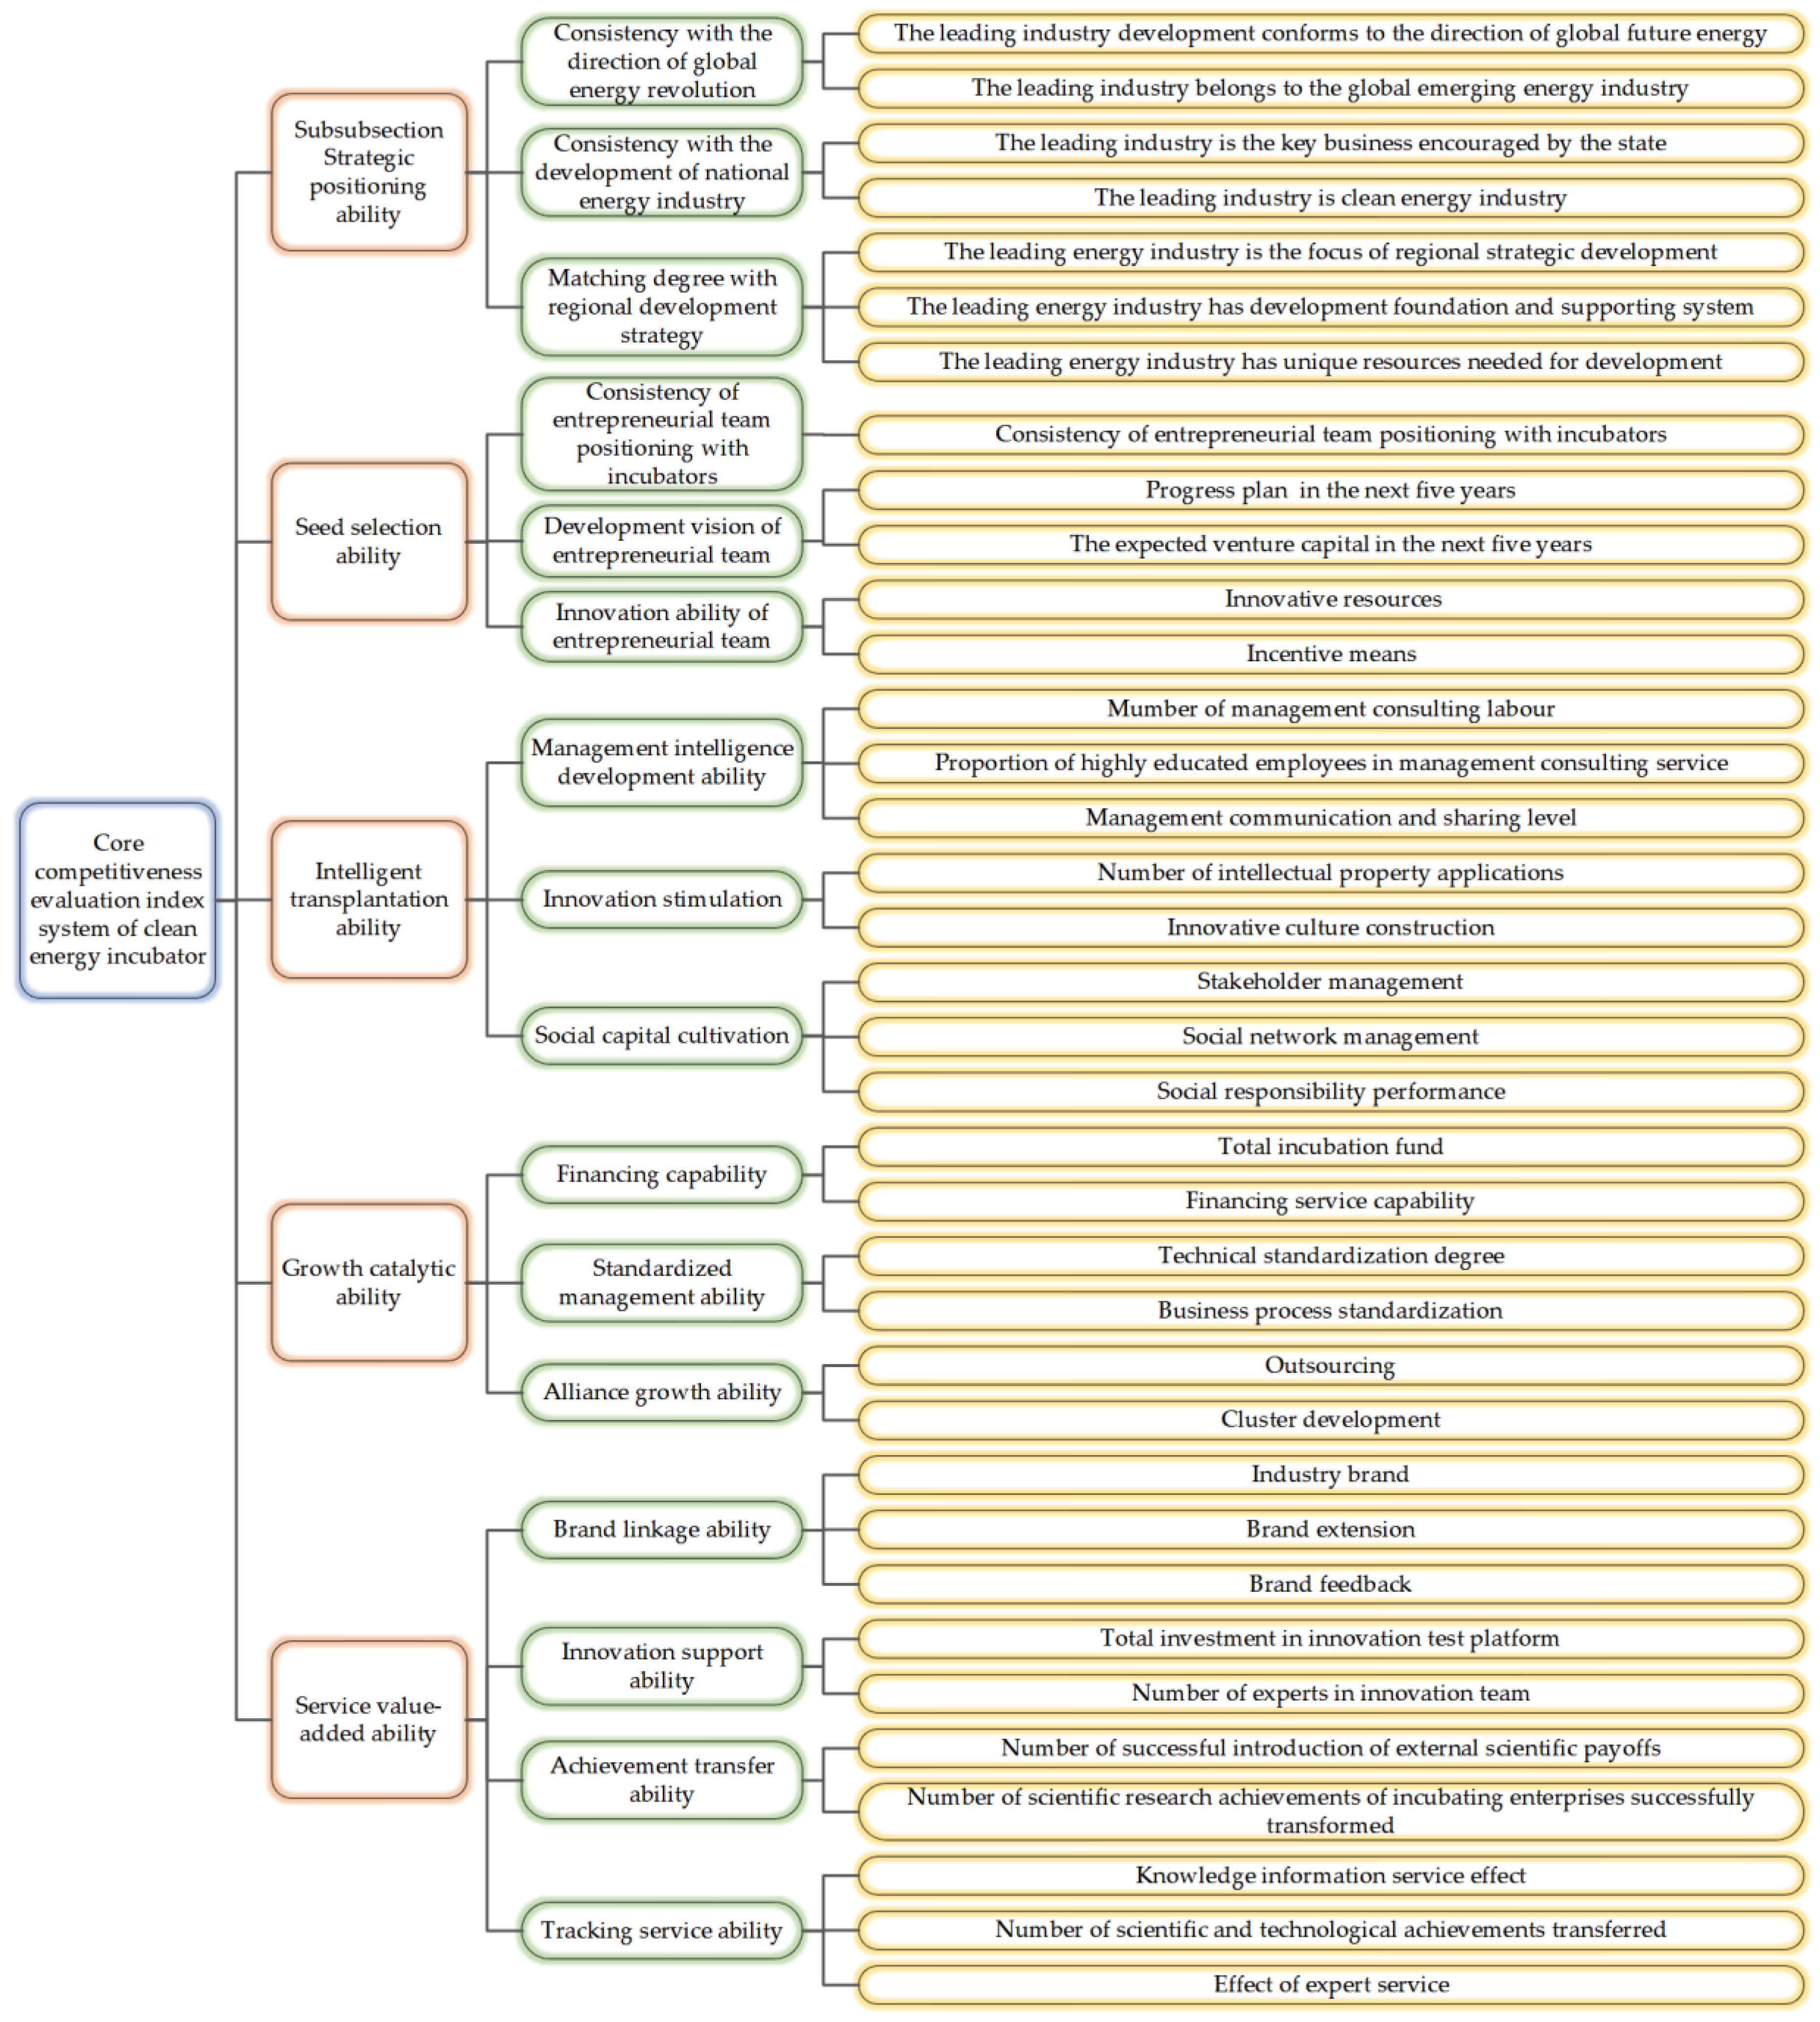
Section 2 designs the indicator system including strategic positioning ability, seed selection ability, intelligent transplantation ability, growth catalytic ability as well as service value-added ability, and introduces the preprocessing method. Section 3 presents a brief description of the proposed evaluation technique. In Section 4, a case study is carried out to validate the established model. Section 5 concludes the paper.

2. Establishment of Evaluation Index System for Core Competitiveness of Clean Energy Incubator

2.1. Selection of Evaluation Index

The kernel function of clean energy incubator is to cultivate corresponding enterprises. Whether incubator owns core competitiveness resolves its survival rate and growth. The main workflow includes seed business selection, related incubation service and tracking. Thus, specific conditions can be employed for judgement whether incubated enterprises are able to graduate or be obsoleted. These links are closely relevant and interact with each other. The core competitiveness is dependent on the crucial resource and capabilities required by these parts.
It is obvious that the seed quality is significant. Clean energy incubators must make a choice subjected to the resource. Furthermore, incubated service is an interactive process limited both by the ability of incubator and enterprise itself. Enterprises with no development potential can hardly survive or grow slowly even if they devote quantities of resources. Consequently, the quality of incubated seed is quite important which is principally determined by strategic positioning ability and seed selection ability [4].
The service provided by clean energy incubator aims at making the enterprises realize burgeoning development. Entrepreneurs are mostly confronted with lack resource and systematic knowledge, weak management capability as well as experience. Service with core competitiveness can be measured by the following conditions: An entrepreneurial team can become an independent and growing enterprise after incubation. It means incubator should possess the ability to transfer or graft the pivotal resource needed by entrepreneurs. In particular, it mainly refers to intelligent transplantation ability, growth catalytic ability, and service value-added ability.
In brief, the core competitiveness of clean energy incubator is chiefly decided by: strategic positioning ability, seed selection ability, intelligent transplantation ability, growth catalytic ability, service value-added ability. Figure 1 shows the established index system.

2.1.1. Subsubsection Strategic Positioning Ability

Strategic positioning ability refers to the location capability of clean energy incubators in industries, regions and entrepreneurial groups. Incubators should first make strategic positioning for the target enterprises or customers. The more technology opportunities and better development prospects the incubators face, the more they match the regional progress. Additionally, strategic positioning ability displays the positive change with the potential the entrepreneurial group.
(1)
Consistency with the direction of global energy revolution: judge whether the leading business development conforms to the direction of global future energy and whether it belongs to the global emerging energy industry via the literature on key progress of clean energy assembled from the United States, the United Kingdom, the European Union, Japan and other developed countries.
(2)
Consistency with the development of national energy industry: considering national economic planning and policy, identify the key development of clean energy industry in China. Determine whether the leading industry of the incubator is the key business encouraged by the state.
(3)
Matching degree with regional development strategy: provincial and regional energy planning as well as relevant materials can be used as the foundation to distinguish strategic development. Thus, matching degree is able to be estimated from the perspective of supporting system and unique resources through enterprise research and expert interview.

2.1.2. Seed Selection Ability

Seed selection ability represents the capability of incubator to identify the prospects of clean energy enterprises. If the seed is identical with incubator positioning, development as well as innovation ability, it declares the seed selection capability is strong.
(1)
Consistency of entrepreneurial team positioning with incubators.
(2)
Development vision of entrepreneurial team: progress plan and the expected venture capital in the next five years.
(3)
Innovation ability of entrepreneurial team: innovative resources and incentive means.

2.1.3. Intelligent Transplantation Ability

Intelligent transplantation ability stands for the capability to improve intellectual capital of incubated enterprises including management intelligence development, innovation stimulation and social capital cultivation.
(1)
Management intelligence development ability: number of management consulting labour, proportion of highly educated employees in management consulting service, management communication and sharing level.
(2)
Innovation stimulation: number of intellectual property applications, innovative culture construction.
(3)
Social capital cultivation: stakeholder management, social network management, social responsibility performance.

2.1.4. Growth Catalytic Ability

Growth catalytic ability can judge whether the incubated enterprises grow rapidly and expand well which includes financing capability, standardized management ability as well as alliance development ability.
(1)
Financing capability: total incubation fund, financing service capability.
(2)
Standardized management ability: technical standardization degree, business process standardization.
(3)
Alliance growth ability: outsourcing, cluster development.

2.1.5. Service Value-Added Ability

Service value-added ability reflects the increase of value that incubator brings itself and enterprises, including brand linkage ability, innovation support ability, achievement transfer ability and tracking service ability.
(1)
Brand linkage ability: industry brand, brand extension, brand feedback.
(2)
Innovation support ability: total investment in innovation test platform, number of experts in innovation team.
(3)
Achievement transfer ability: number of successful introduction of external scientific payoffs, number of scientific research achievements of incubating enterprises successfully transformed.
(4)
Tracking service ability: knowledge information service effect, number of scientific and technological achievements transferred, effect of expert service.

2.2. Preprocessing of Evaluation Index

There mainly exist three kinds in the indicator system, namely extremely large, extremely small and interval indexes. For example, extremely large indicators change in accordance with core competitiveness. In order to make comparison with schemes and obtain the valuation results, normalization processing should be implemented. In this paper, all the indicators are assigned into extremely large indexes.
Due to distinguished attribute and quantity level of original data, it is essential to make the indicators dimensionless as Equation (1):
x i j * = x i j i = 1 m x i j 2 ,   i = 1 , 2 , , m ; j = 1 , 2 , , n
where m and n represent the number of incubators and indexes, respectively.

3. Methodology

3.1. Entropy Weight Method

As a common approach in objective weight calculation, the principle of entropy weight method derives from thermodynamics. Entropy is a measure of the system uncertainty. The greater entropy means more chaotic system and less information [28]. Suppose the system locates in n states, the probability of each state is set as P i ( i = 1 n ) . The entropy of the system is described as Equation (2)
E = i = 1 n P i ln p i
where P i ( i = 1 n ) satisfies: 0 P i 1 , i = 1 n P i = 1 .
The following procedures are listed:
(1) Establishment of standardized judgment matrix
In accordance with standardized data obtained from Equation (1), the standardized judgment matrix is acquired.
(2) Calculate the information entropy of each index
H j = k i = 1 m f i j ln f i j
f i j = x i j * i = 1 m x i j *
k = 1 ln m
(3) Index weighting
w j = 1 H j j = 1 n ( 1 H j )
where 0 w j 1 ,   j = 1 n w j = 1 .

3.2. Evaluation Model Integrated Matter-Element Extension with TOPSIS

TOPSIS, also known as approximate ideal solution, firstly draws up two schemes. One of the scheme presents the best attribute values, called positive ideal solution, while the attributes of the other plan are all the worst, named negative ideal solution. Then, compare each scheme with the positive as well as negative ideal solutions, respectively. The optimal programme is selected which is close to the positive ideal solution and far away from the negative one simultaneously [29]. Hence, this best scheme shows the highest core competitiveness. Whereas, TOPSIS can not judge the competitiveness level of each plan, that is, it can’t be decided whether the level belongs to very high, high, general or low [30].
Matter-element extension evaluation method combined matter-element theory, extension set with correlation degree for quantitative evaluation. This model divides the data interval of the evaluated target into several orders and determine their levels. Correlation degree is calculated between each plan and the grade. The larger the correlation degree is, the higher the membership extent present. The level of the evaluated target depends on the grade of data interval with the highest membership degree [31].
Thus, this paper integrates matter-element extension model with TOPSIS for core competitiveness assessment. TOPSIS is firstly used to determine the positive and negative ideal solutions and divide the interval into several grades by equal distance. Each grade corresponds to the given level of core competitiveness. Then calculate the correlation degree between each scheme and the grades. Hence, the core competitiveness level of the plan can be accordingly judged.
The main measures can be described as follows:
(1) Establishment of standardized index matrix
Suppose the scheme set including n evaluation indicators is M = ( M 1 , M 2 , , M m ) . The assessment indexes are presented as D = ( D 1 , D 2 , , D n ) . The standardized index matrix C is derived from consistent and dimensionless processing as Equation (7)
C = ( c i j ) m × n = [ c 11 c 12 c 1 n c 21 c 22 c 2 n c m 1 c m 2 c m n ]
where c i j = ( i = 1 , 2 , , m ; j = 1 , 2 , , n ) is the standardized indicator of D i in scheme M i .
(2) Establishment of weighted standardized matrix
The entropy weight method is applied to calculate the weight of indexes w j . The weighted standardized matrix is shown as Equation (8)
X = ( x i j ) m × n = [ w 1 c 11 w 2 c 12 w n c 1 n w 1 c 21 w 2 c 22 w n c 2 n w 1 c m 1 w 2 c m 2 w n c m n ]
(3) Determine positive and negative ideal solutions of each scheme
The positive ideal solution is:
X + = { max 1 i m x i ( j ) | j J + , min 1 i m x i ( j ) | j J }
The negative ideal solution is:
X = { min 1 i m x i ( j ) | j J + , max 1 i m x i ( j ) | j J }
(4) Division of extremum interval and calculation of closeness degree
The extremum interval composed of negative positive ideal solutions is divided into N layers. namely, H i t = ( h i t 1 , h i t 2 ) , i = 1 , 2 , , n ; t = 1 , 2 , , N , x i h i t 1 x i + , x i h i t 2 x i + , [ x i , x i + ] consists of h i t 1 and h i t 2 .
The closeness degree between each index and evaluation interval in standardized decision matrix can be obtained according to Equation (11):
E ( N i ) = | x i j h j t 1 + h j t 2 2 |
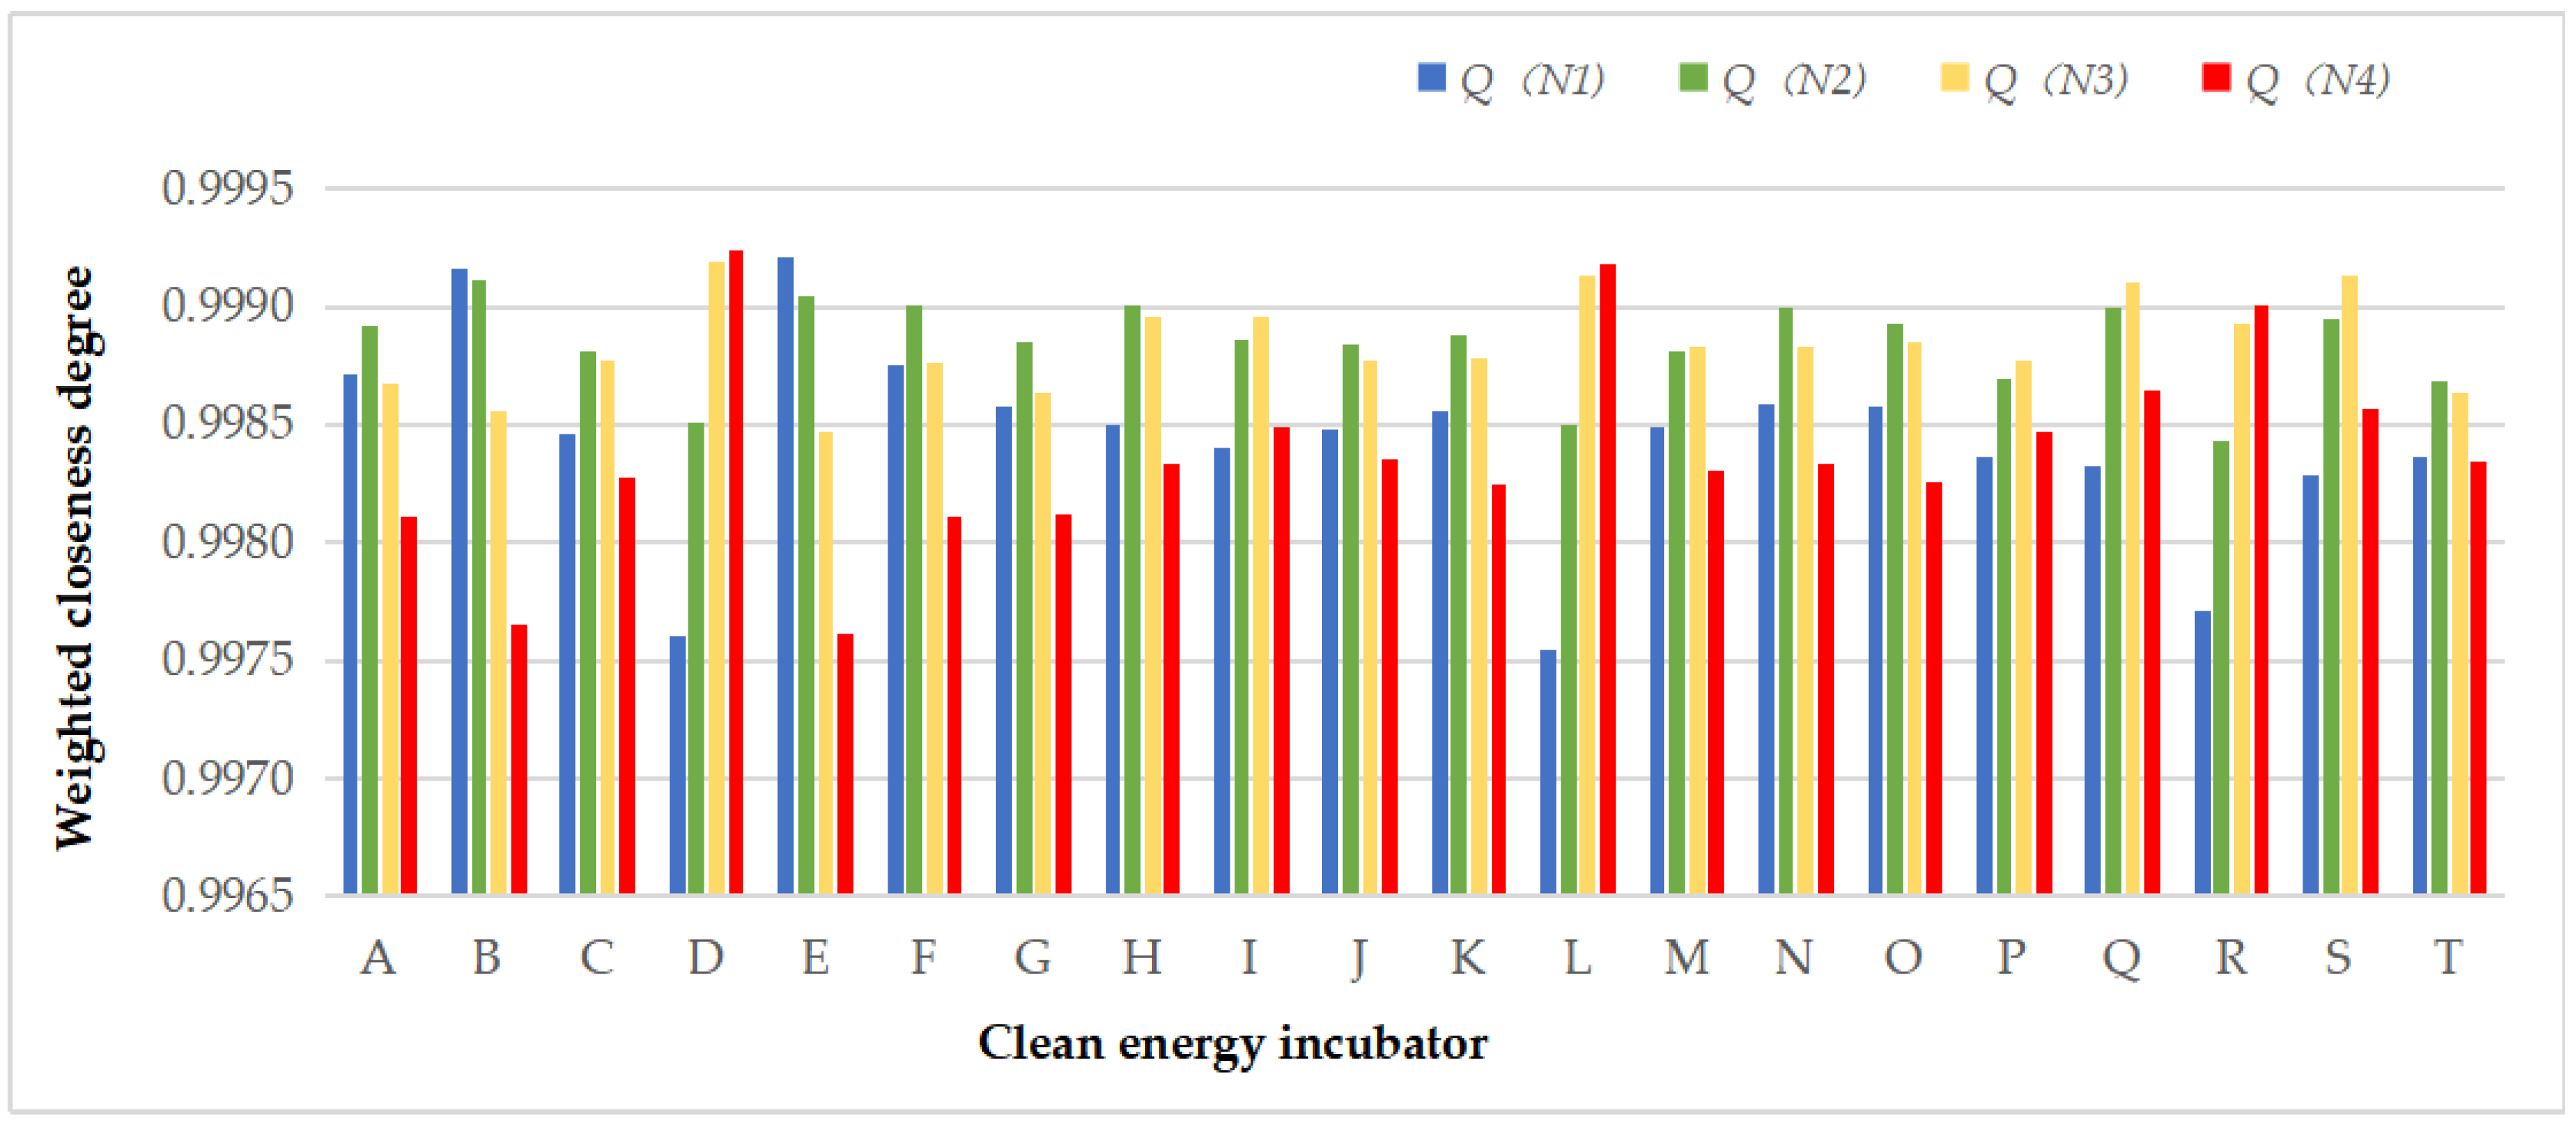
Thus, the weighted closeness degree of each evaluation plan can be further derived:
Q j ( N i ) = 1 j = 1 n w j E ( N i )
(5) Determine the grade of each scheme
The level that the maximum of Q j ( N i ) belongs to can be regarded as the evaluation grade of the scheme.

3.3. KPCA

PCA is able to merge the original features and reduce the dimension to simplify computation, especially aiming at strong linear indicators. However PCA is difficult to grab high-order features, so it ignores nonlinear information during dimension reduction. With consideration of nonlinearity in core competitiveness of clean energy incubators, kernel principal component analysis (KPCA) is taken advantage of to extract key factors in this study [32].
This approach can validly reduce the dimension of the input in condition of retaining main nonlinear information. It is achieved by using nonlinear transformation to map initial input into high-dimensional feature space. Apparently, KPCA is able to compress the information contained in a large number of indexes into some comprehensive indicators. The basic steps are presented as follows:
Set a random vector X = { x 1 , x 2 , , x n } T , x k R N ( k = 1 , 2 , , m ) , m is the number of input, namely the original input can be expressed as M = [ a 1 , a 2 , , a n ] T = [ b 1 , b 2 , , b m ] . The dataset is projected into the space F via nonlinear mapping Φ, M = [ ϕ ( b 1 ) , ϕ ( b 2 ) , , ϕ ( b m ) ] , k = 1 m ϕ ˜ ( b i ) = 0 .
The covariance matrix is shown as follows:
C F = [ C 11 , C 12 , , C 1 n C n 1 , C n 2 , , C n n ]
C = 1 m i m ϕ ( b i ) ϕ ( b i ) T
The eigenvalue and eigenvector can be obtained as Equation (15)
C F W F = λ F W F
where λ F is the eigenvalue, W F = k = 1 M α k ϕ ˜ ( x k ) represents the corresponding eigenvector. The symmetric matrix K is shown in Equation (16):
K ( x k , x j ) = ( ϕ ( x k ) ϕ ( x j ) )
K ˜ can be acquired via matrix centralization:
K ˜ = K I n K K I n + I n K I n
where In is n × n matrix, Ii,j = 1/n, Equation (15) can be simplified as:
m λ F M = K ˜ M
Thus the kernel principal component can be calculated with reference to extraction technique of traditional PCA.

3.4. NGSA-II

NSGA-II optimization algorithm is a novel genetic algorithm on the foundation of NSGA. Despite Pareto optimum can be derived from individual classification in accordance with non dominated sorting via NSGA, it needs complicated calculation and given shared radius value. Therefore, fast non-dominated sorting technique, crowding degree and elite strategy are introduced into NSGA, namely NSGA-II, to promote the robustness and operation speed [33].
The specific procedures of NSGA-II are described as follows:
(1)
Generate initial population Pt and achieve non-dominated sorting as well as given Pareto optimum. The genetic operation Pt is carried out to form the offspring Qt.
(2)
Aamalgamate Pt with Qt to generate the new species Rt. Implement non-dominated ranking on Rt and calculate the crowding degree di of ri.
(3)
A new generation Pt+1 comes into being in line with non-dominated ranking and crowding degree di.
(4)
If t does not reach the maximum number of iteration tmax, t = t + 1 . Otherwise, the calculation will be terminated and the output will be obtained.
The crowding degree (di.) refers to the density of other individuals around each personality in the population. The individual crowding degree at the boundary is defined as infinite, the crowding degree at other positions can be calculated as follows:
d i = j = 1 m | f j , i + 1 f j , i 1 | f j max f j min
where di. represents the crowding degree of i, m equals the number of objective functions, fjmax, fjmin are the maximum and minimum of j-th objective function.

3.5. LSSVM

LSSVM is an extension of SVM. This method makes use of equality constraints to replace the inequality constraints and employs kernel functions to transform prediction into equation problems, which contributes to the improvement of evaluation accuracy and speed [34].
In LSSVM, the sample is set as T = { ( x i , y i ) } i = 1 N , N is the number of samples. The regression model can be established as Equation (20)
y ( x ) = w T · φ ( x ) + b
where φ ( ) maps the training samples into a highly dimensional space. w and b are the weight vector and bias, partly.
The converted optimization problem is shown as follows:
min 1 2 w T w + 1 2 γ i = 1 N ξ i 2
y i = w T ϕ ( x i ) + b + ξ i , i = 1 , 2 , 3 , N
where γ equal the regularization parameter applicable to balance the complexity and accuracy in LSSVM. ξi is the error.
The Lagrange function is defined to address the problem:
L ( w , b , ξ i , α i ) = 1 2 w T w + 1 2 γ i = 1 N ξ i 2 i = 1 N α i [ w T φ ( x i ) + b + ξ i y i ]
where α i is Lagrange multipliers. In the light of the Karush-Kuhn-Tucker (KKT) conditions, Equation (24) is derived:
{ L w = 0 w = i = 1 N α i φ ( x i ) L b = 0 i = 1 N α i = 0 L ξ = 0 α i = γ ξ i L α = 0 w T + b + ξ i y i = 0
The optimization problem is converted into the following matter through eliminating the variables of w and ξi:
[ 0 e n T e n Ω + γ 1 I ] [ b a ] = [ 0 y ]
where
Ω = φ T ( x i ) φ ( x i )
e n = [ 1 , 1 , , 1 ] T
α = [ α 1 , α 2 , , α n ]
y = [ y 1 , y 2 , , y n ] T
The final form of LSSVM is displayed in Equation (30):
y ( x ) = i = 1 N α i K ( x i , x ) + b
where K(xi, x) equals the kernel function that satisfies Mercer’s condition. The paper selects radial basis function (RBF) as the kernel function of LSSVM on account of its wide convergence range and application, as described in Equation (31):
K ( x i , x ) = exp { x x i 2 / 2 σ 2 }
where σ 2 is the width of the kernel width.
Evidently, the performance of LSSVM is chiefly decided by two parameters: kernel parameter γ and regularization parameter σ2.

3.6. Approaches of Matter-Element Extension Combined with TOPSIS and KPCA-NSGA-II-LSSVM

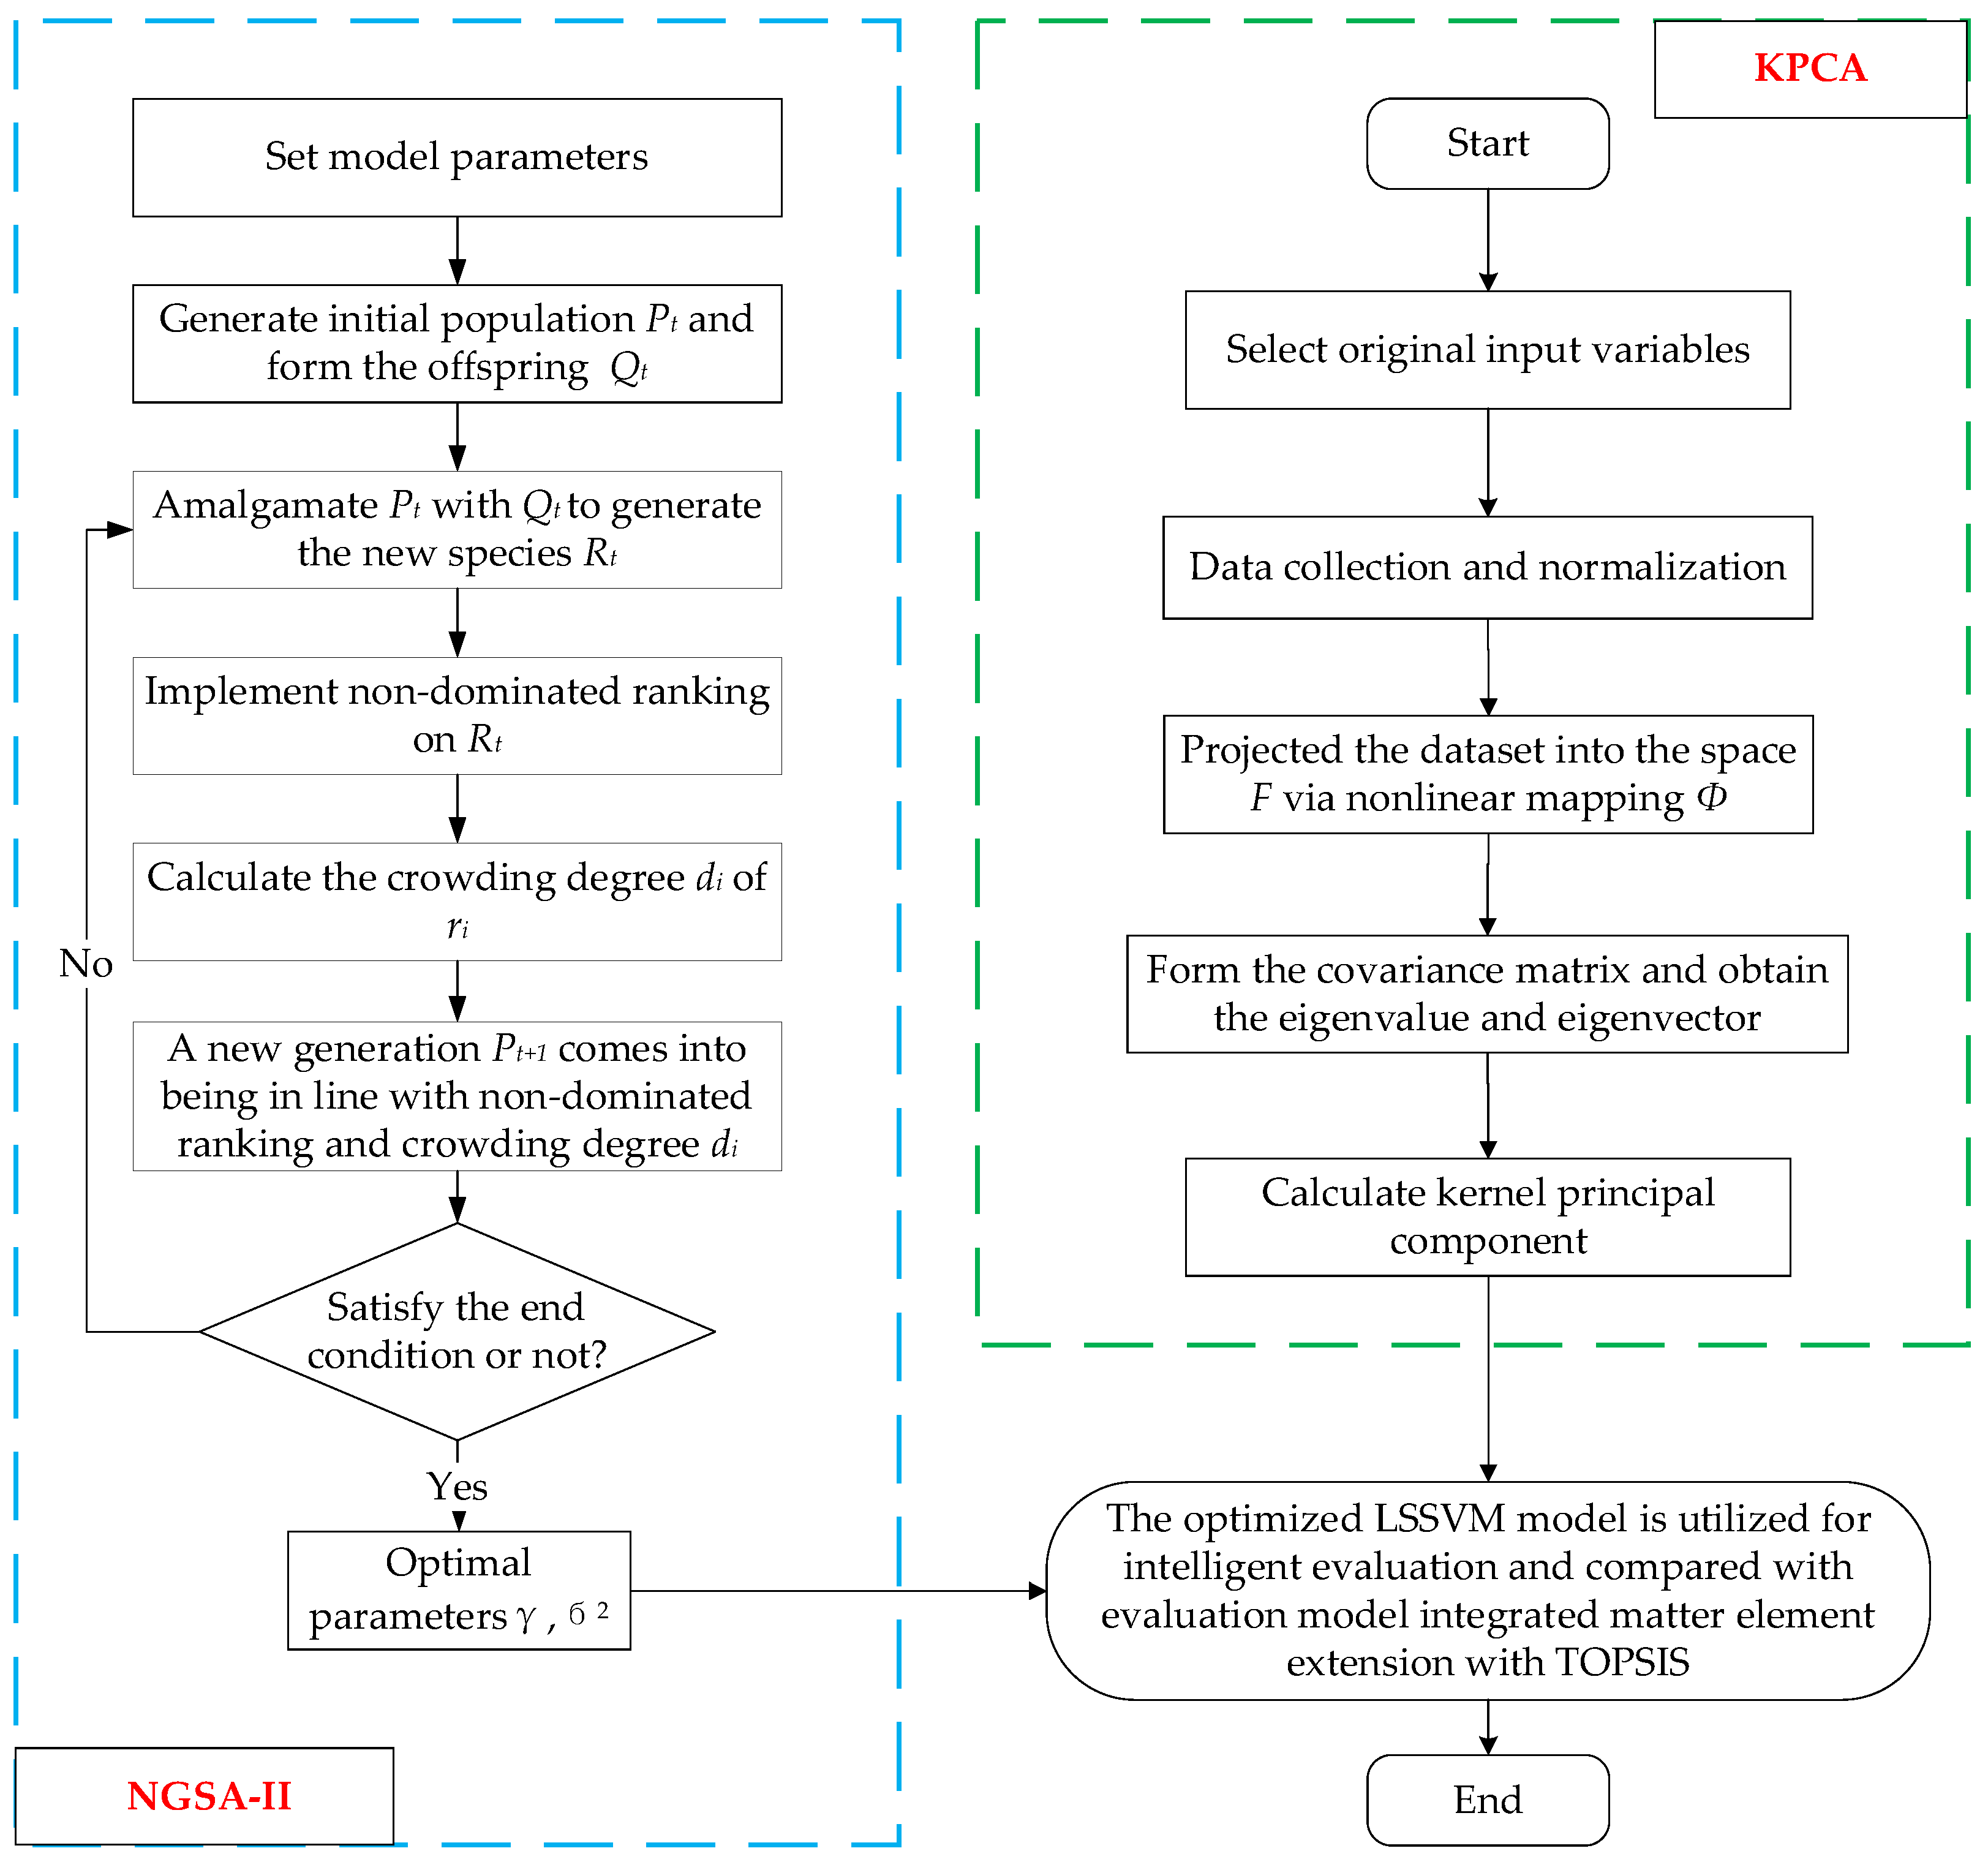
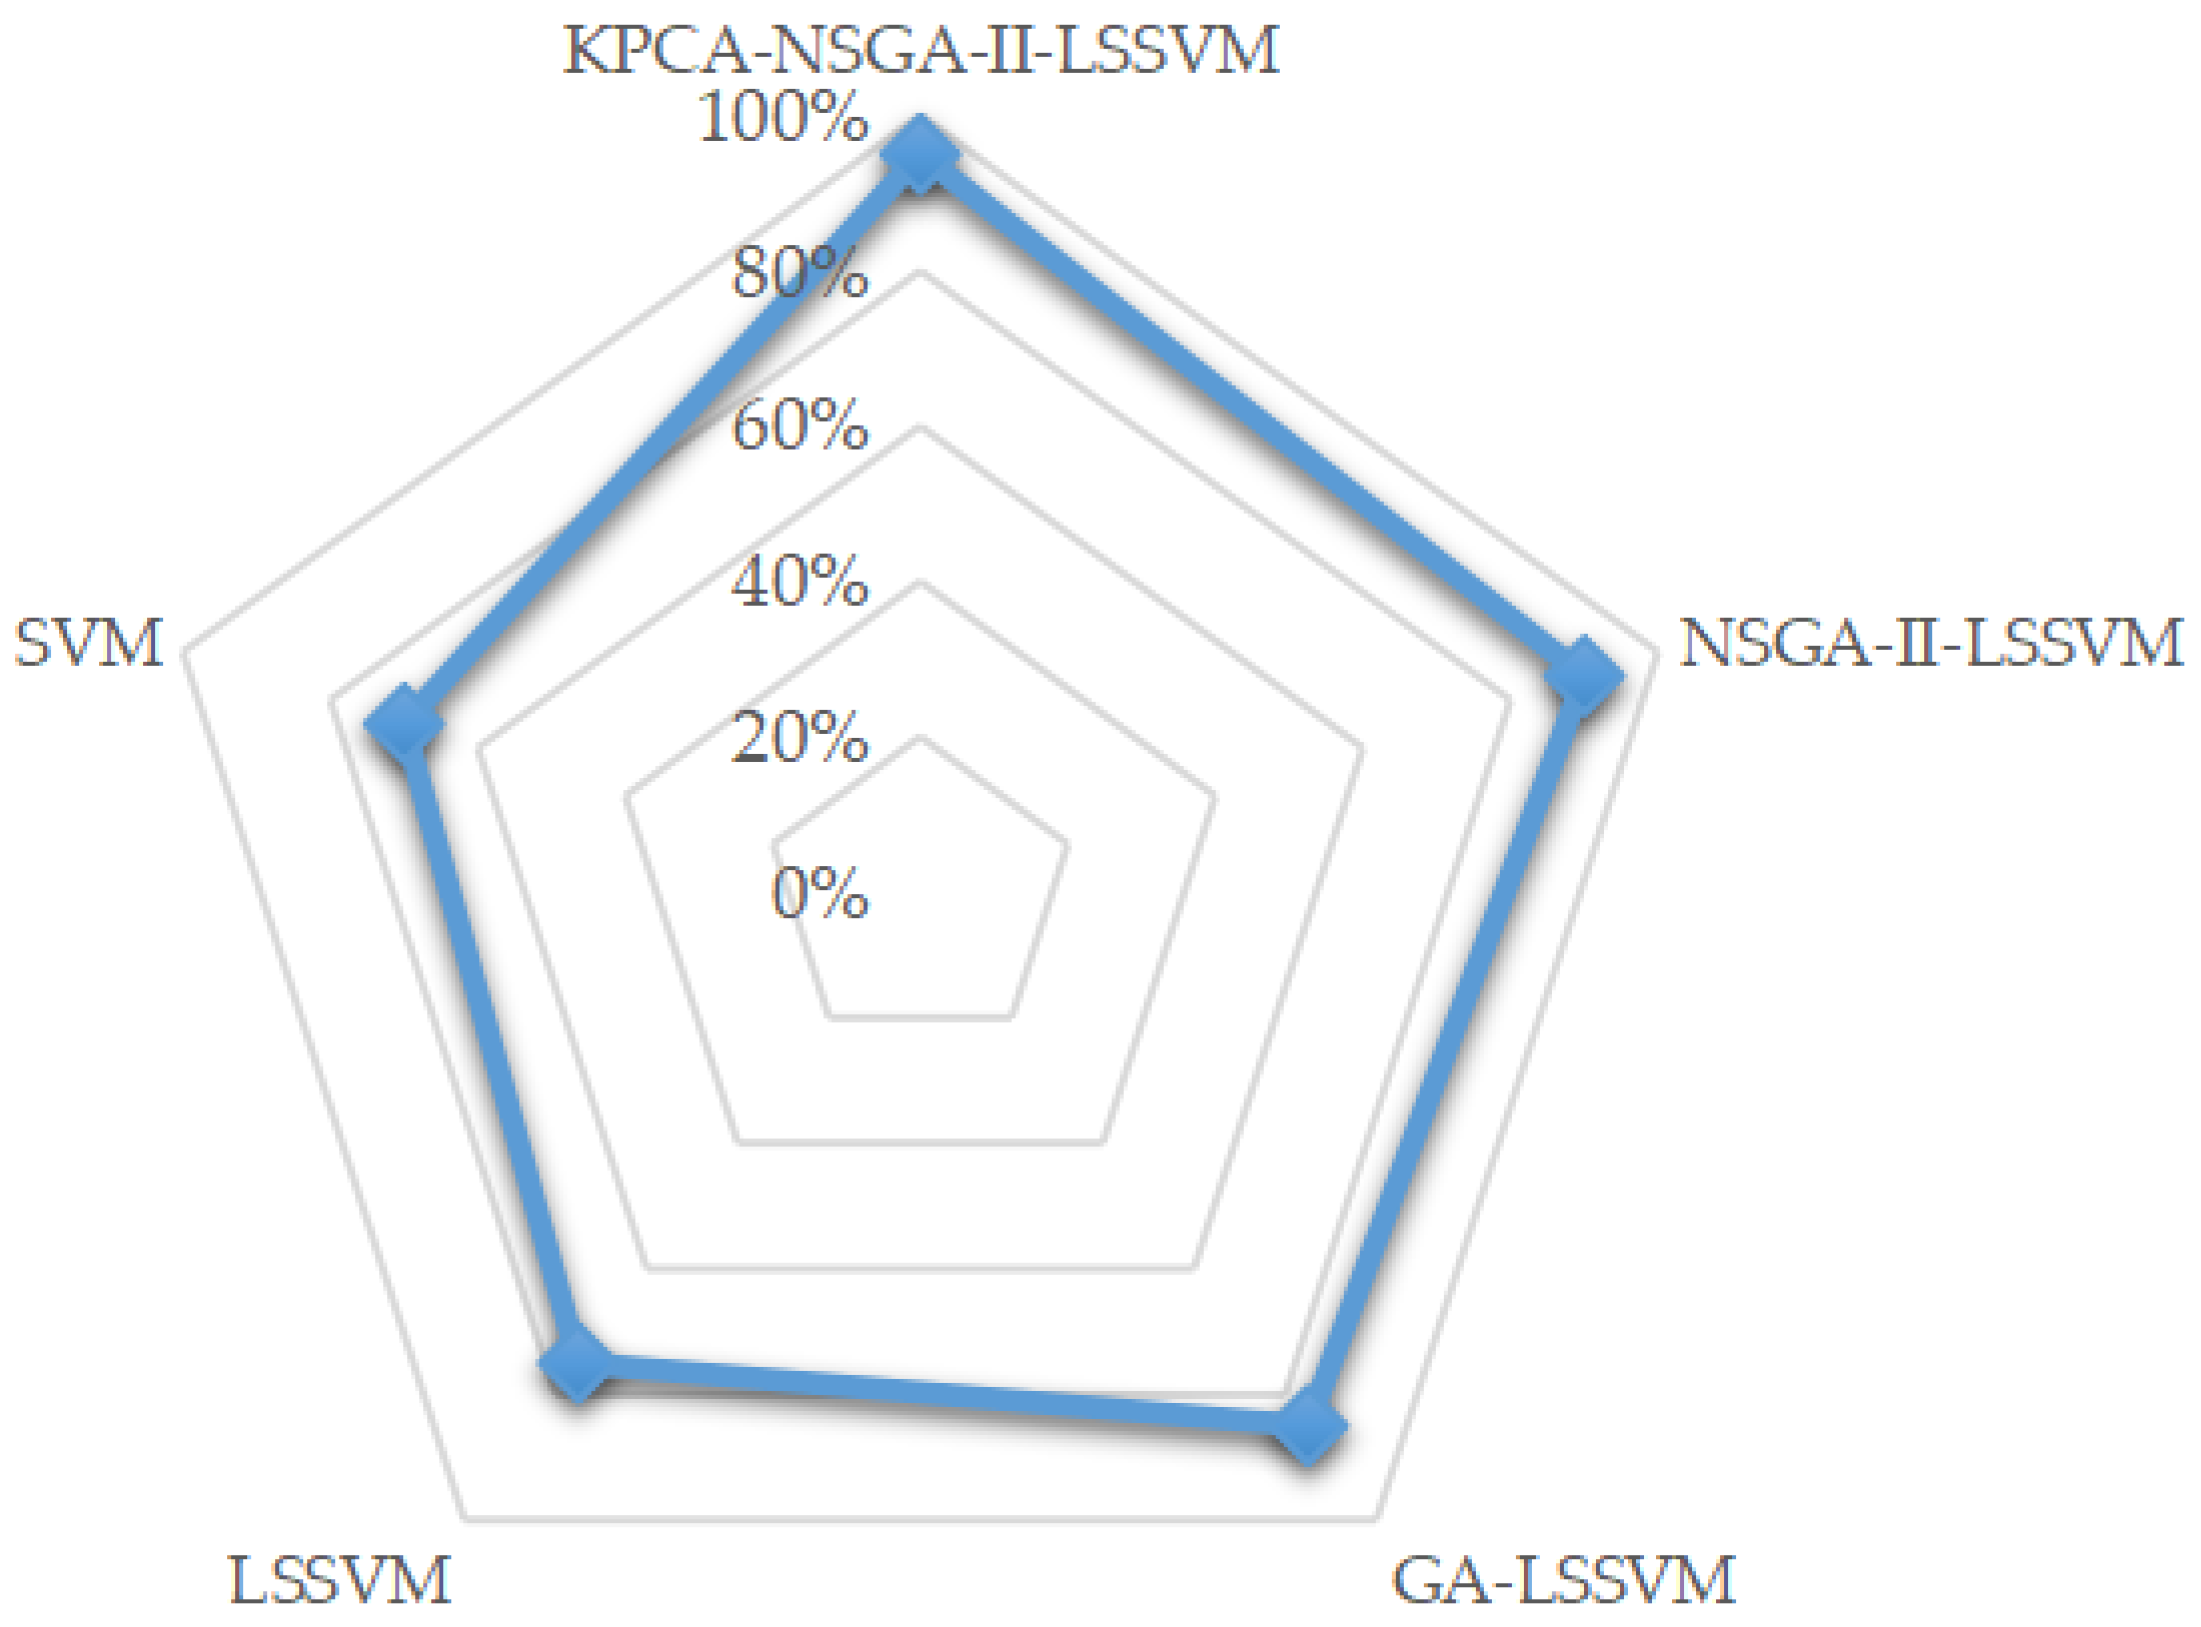
Based on the approach that combines matter-element extension, the core competitiveness evaluation model incorporating KPCA, NSGA-II, and LSSVM is constructed for clean energy incubators where KPCA is utilized for the determination of input and NSGA-II is exploited for parameter optimization in LSSVM. The flowchart of the novel evaluation technique is illustrated in Figure 2.
Step 1: Parameters initialization and data preprocessing. Suppose the input X = { x i ,   i = 1 , 2 , , n } consists of the aforementioned core competitiveness evaluation indexes of clean energy incubators, as Table 1 shows. Consistency and standardized processing are implemented on the original input xi.
Step 2: Weight Determination. The entropy weight method is used here. Besides, evaluation results can be obtained based on matter-element extension integrated with TOPSIS.
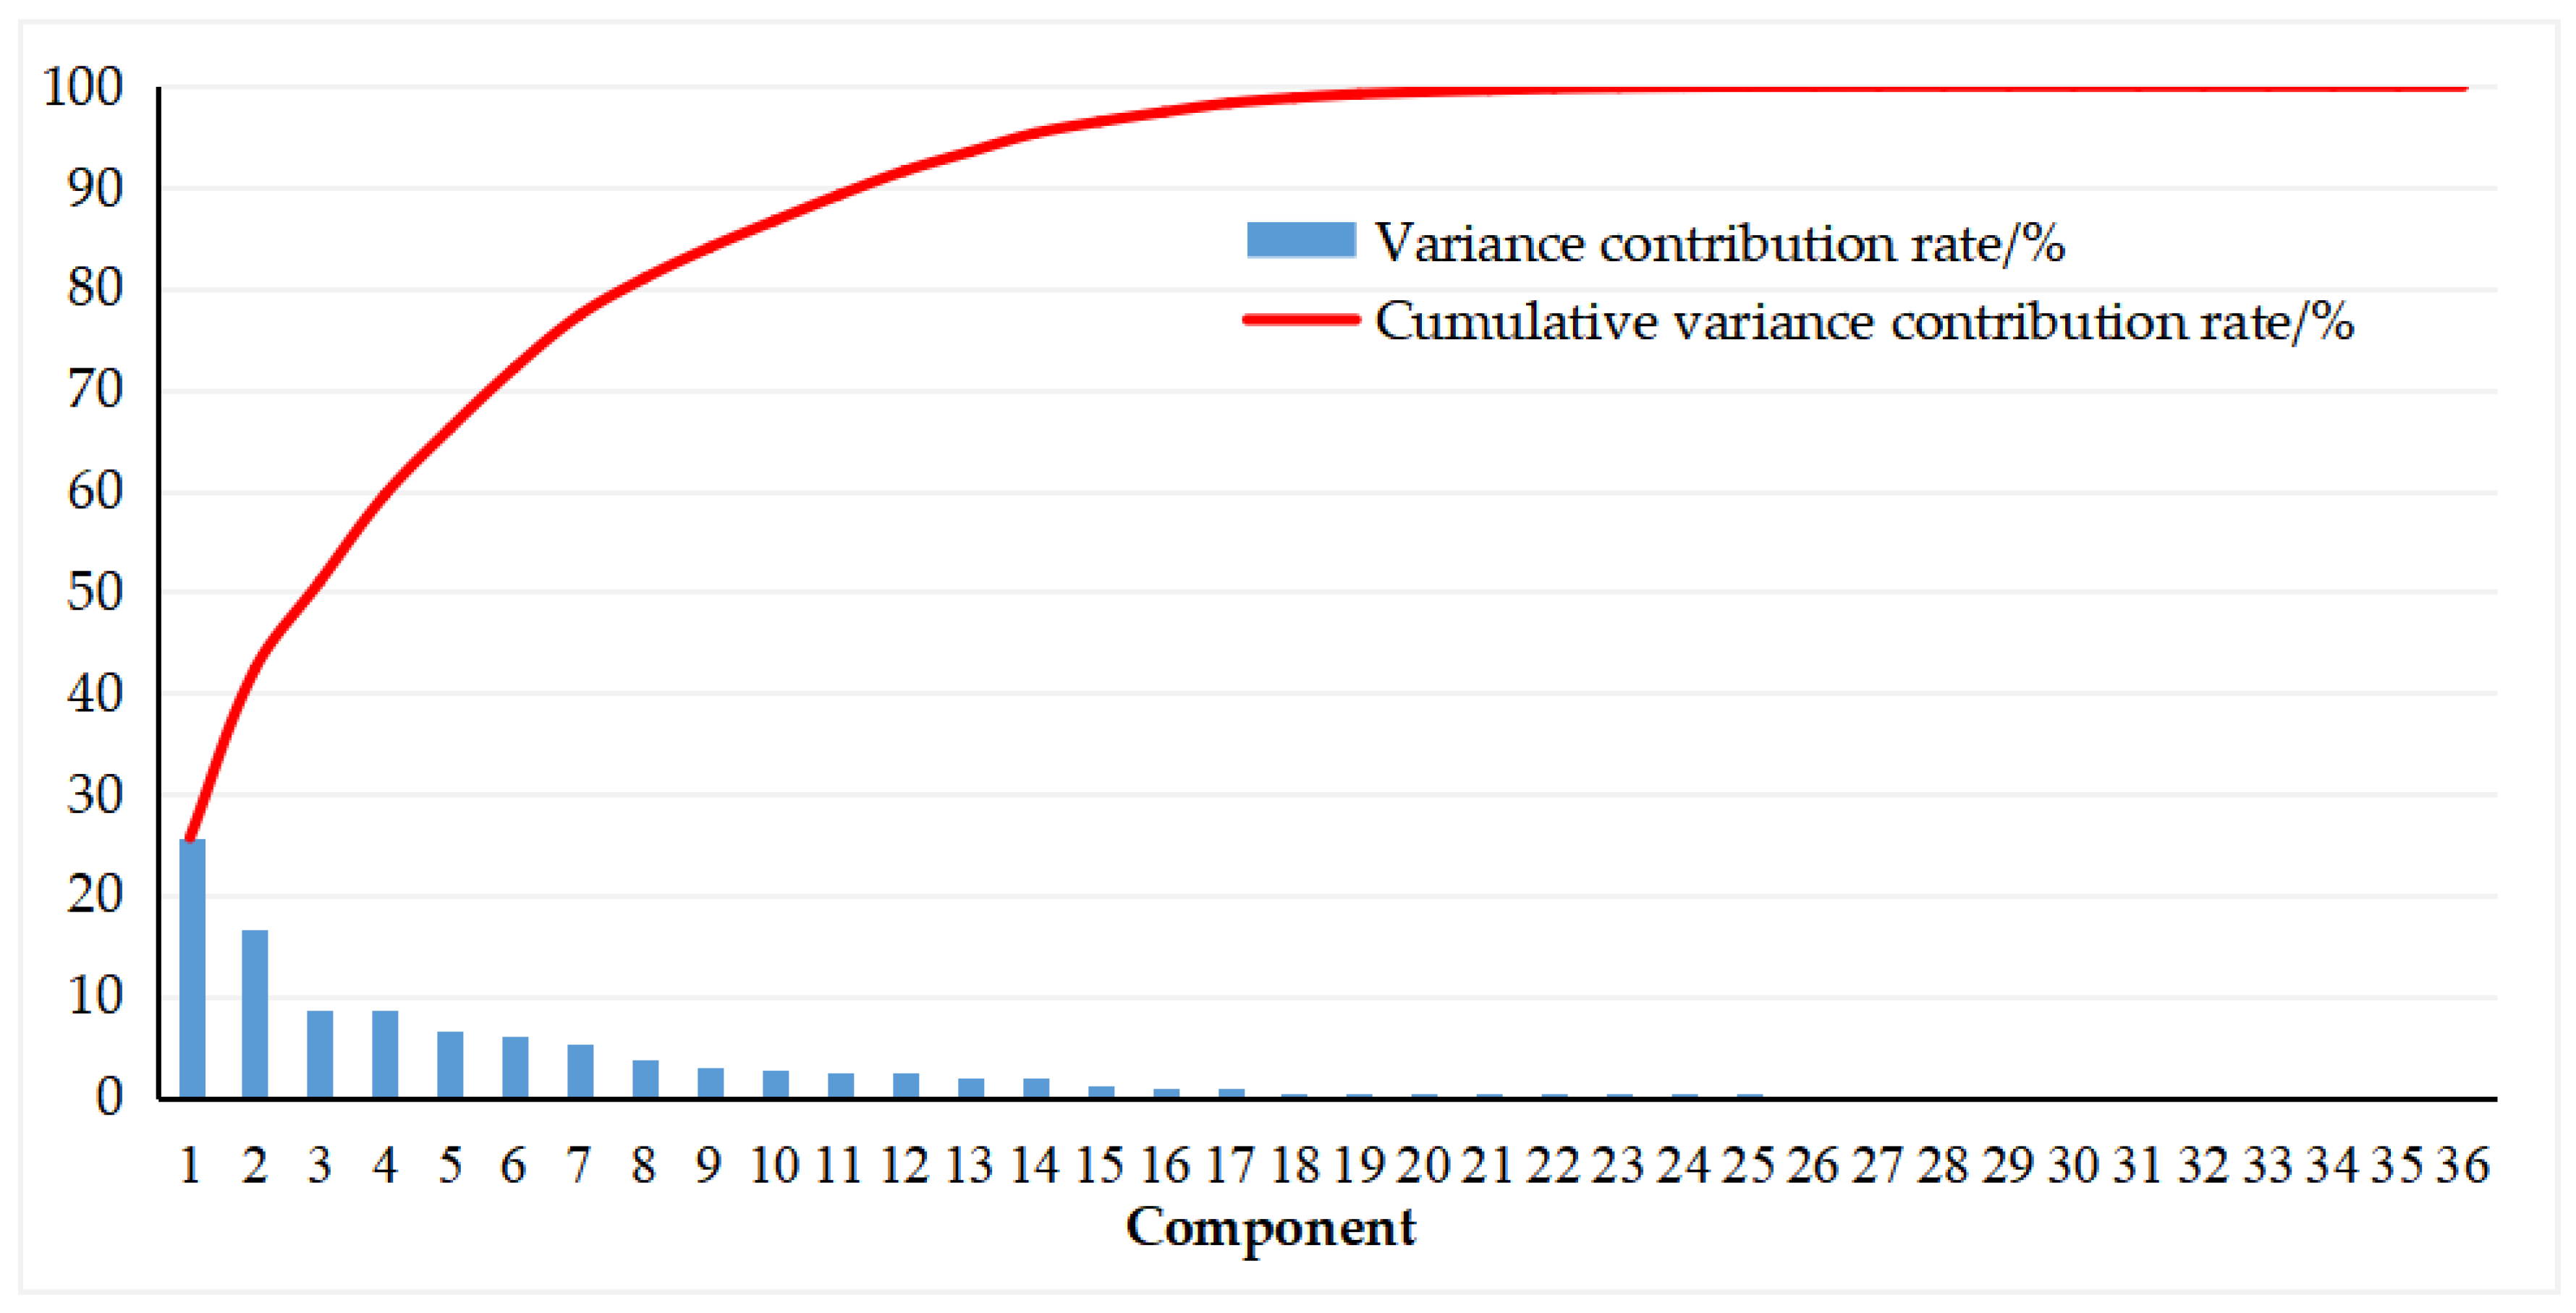
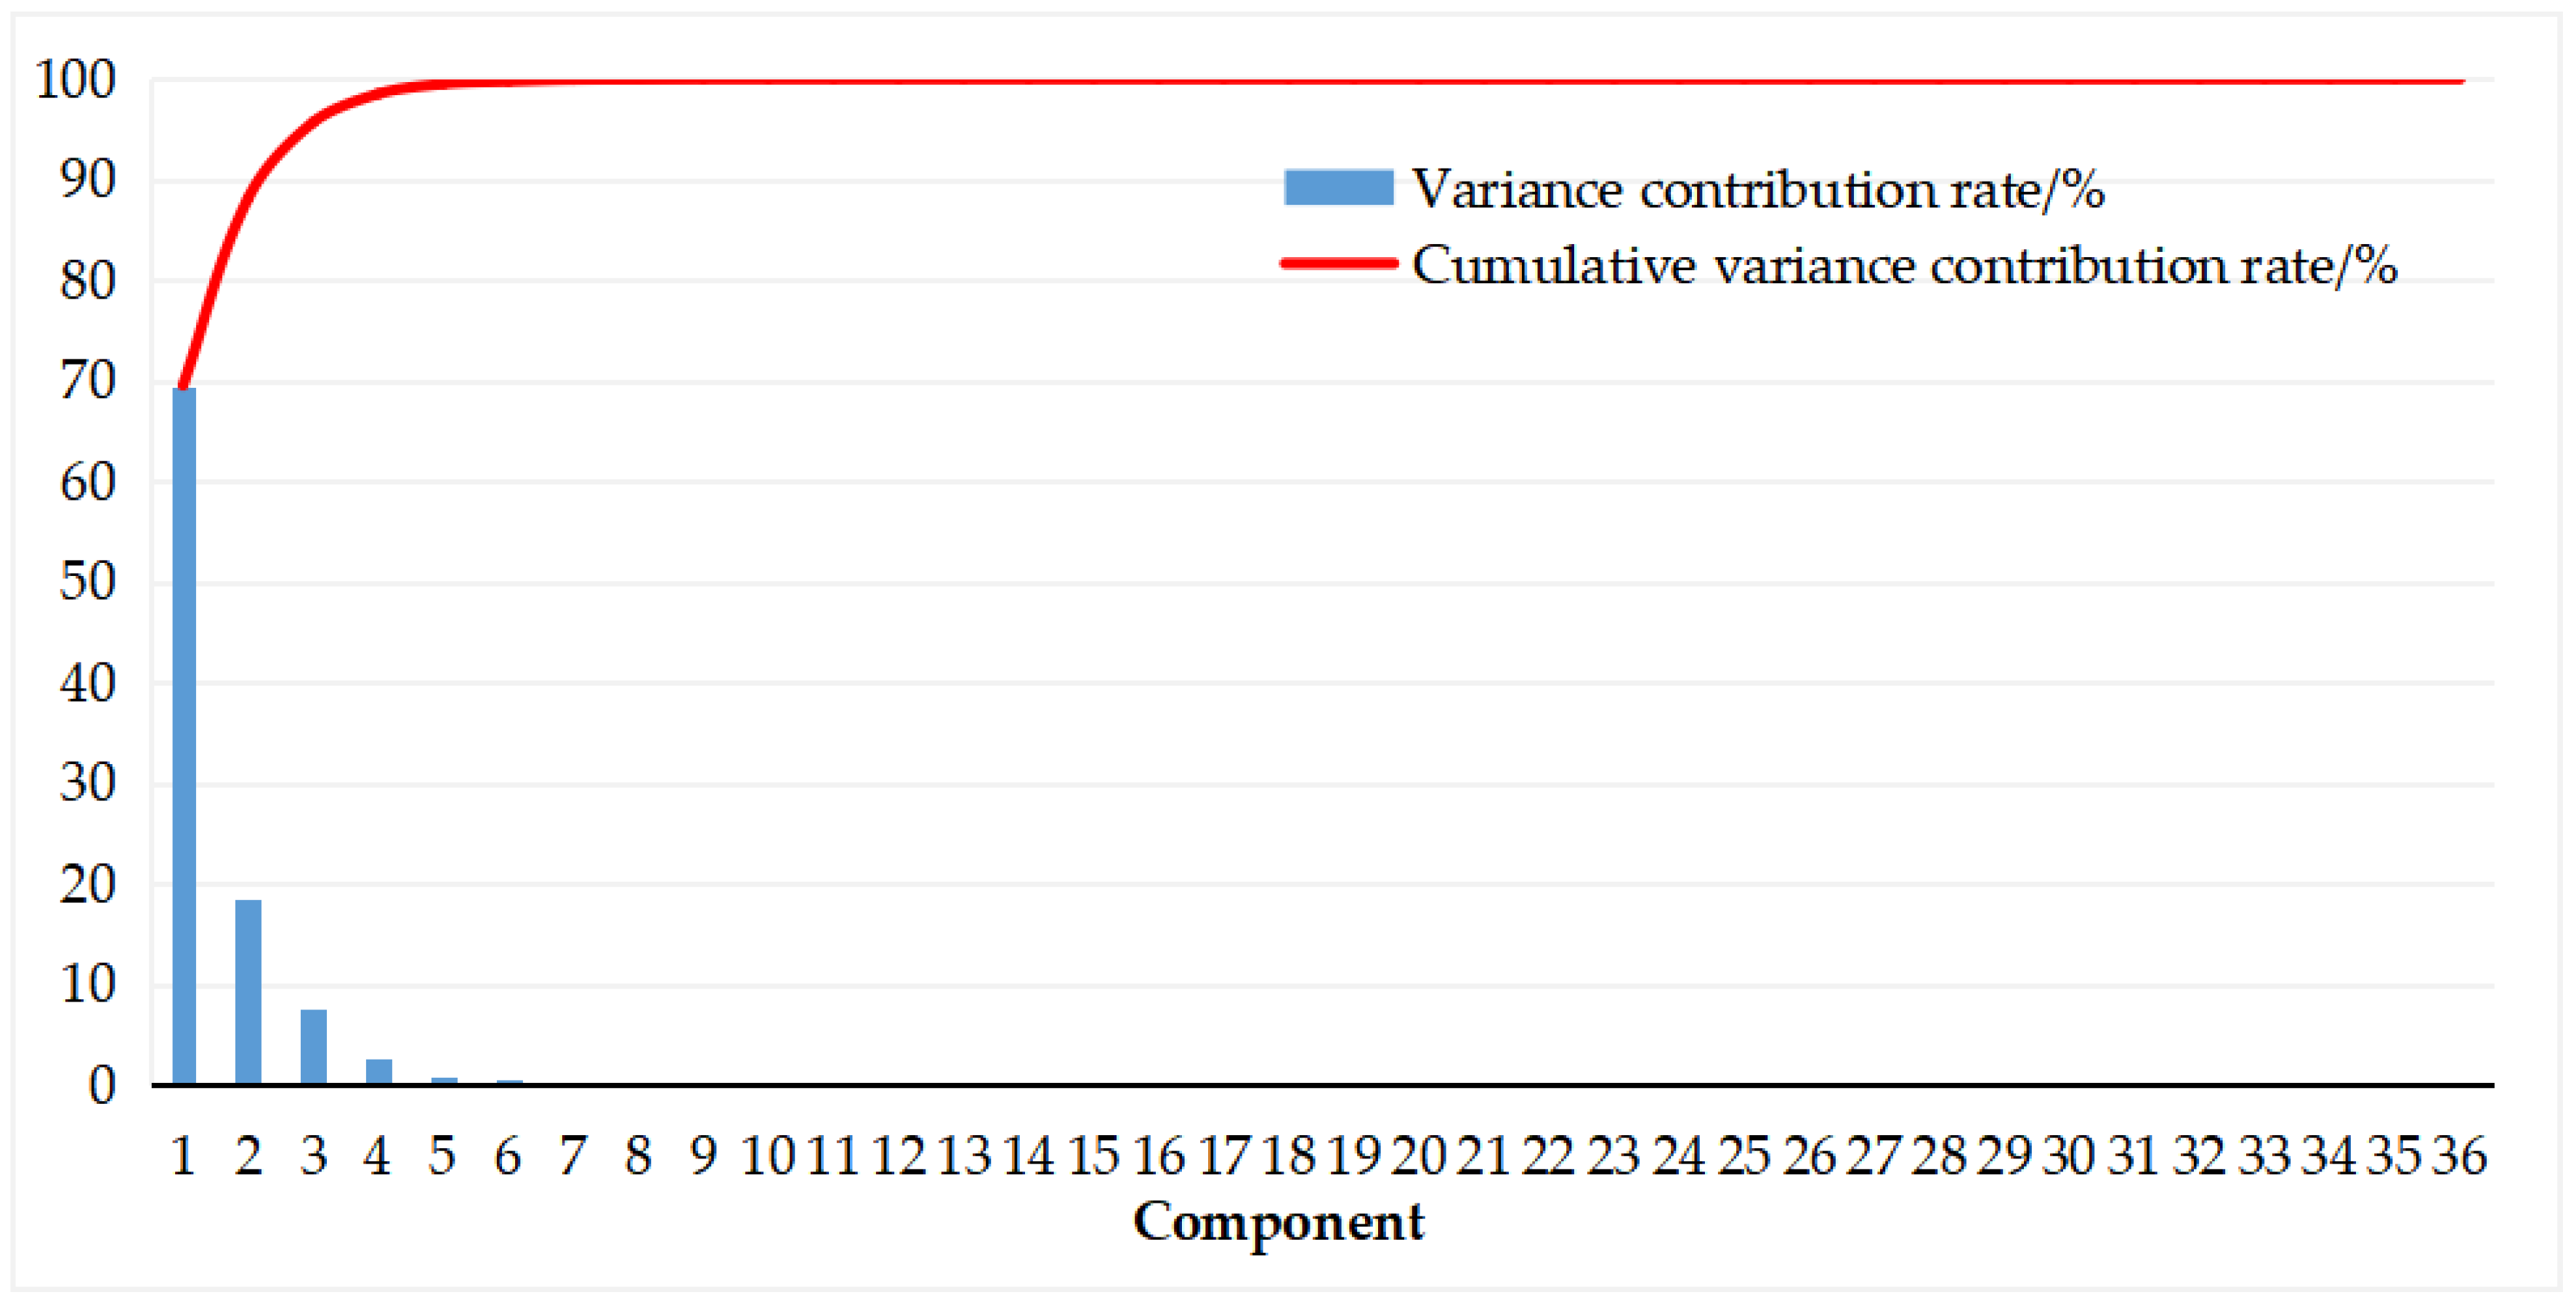
Step 3: Input selection. Crucial factors in original input X are extracted via KPCA. Gaussian kernel function is selected for nonlinear mapping as shown in Equation (32). The kernel principal components whose cumulative variance contribution is higher than 95% form the new input matrix.
k ( x , y ) = exp { x y 2 2 σ 2 }
Step 4: Parameter optimization. Initialize the parameters in LSSVM and NSGA-II. Due to the influence of parameters on training and learning ability in LSSVM, this paper applies NSGA-II to optimize the two parameters, that is, γ and σ 2 . Circulation ends at the maximum number of iteration t max , thus the optimal parameters can be substituted into LSSVM. Through continuous retraining and testing, the two parameters are adjusted again and the optimal core competitiveness evaluation model for clean energy incubator is established.
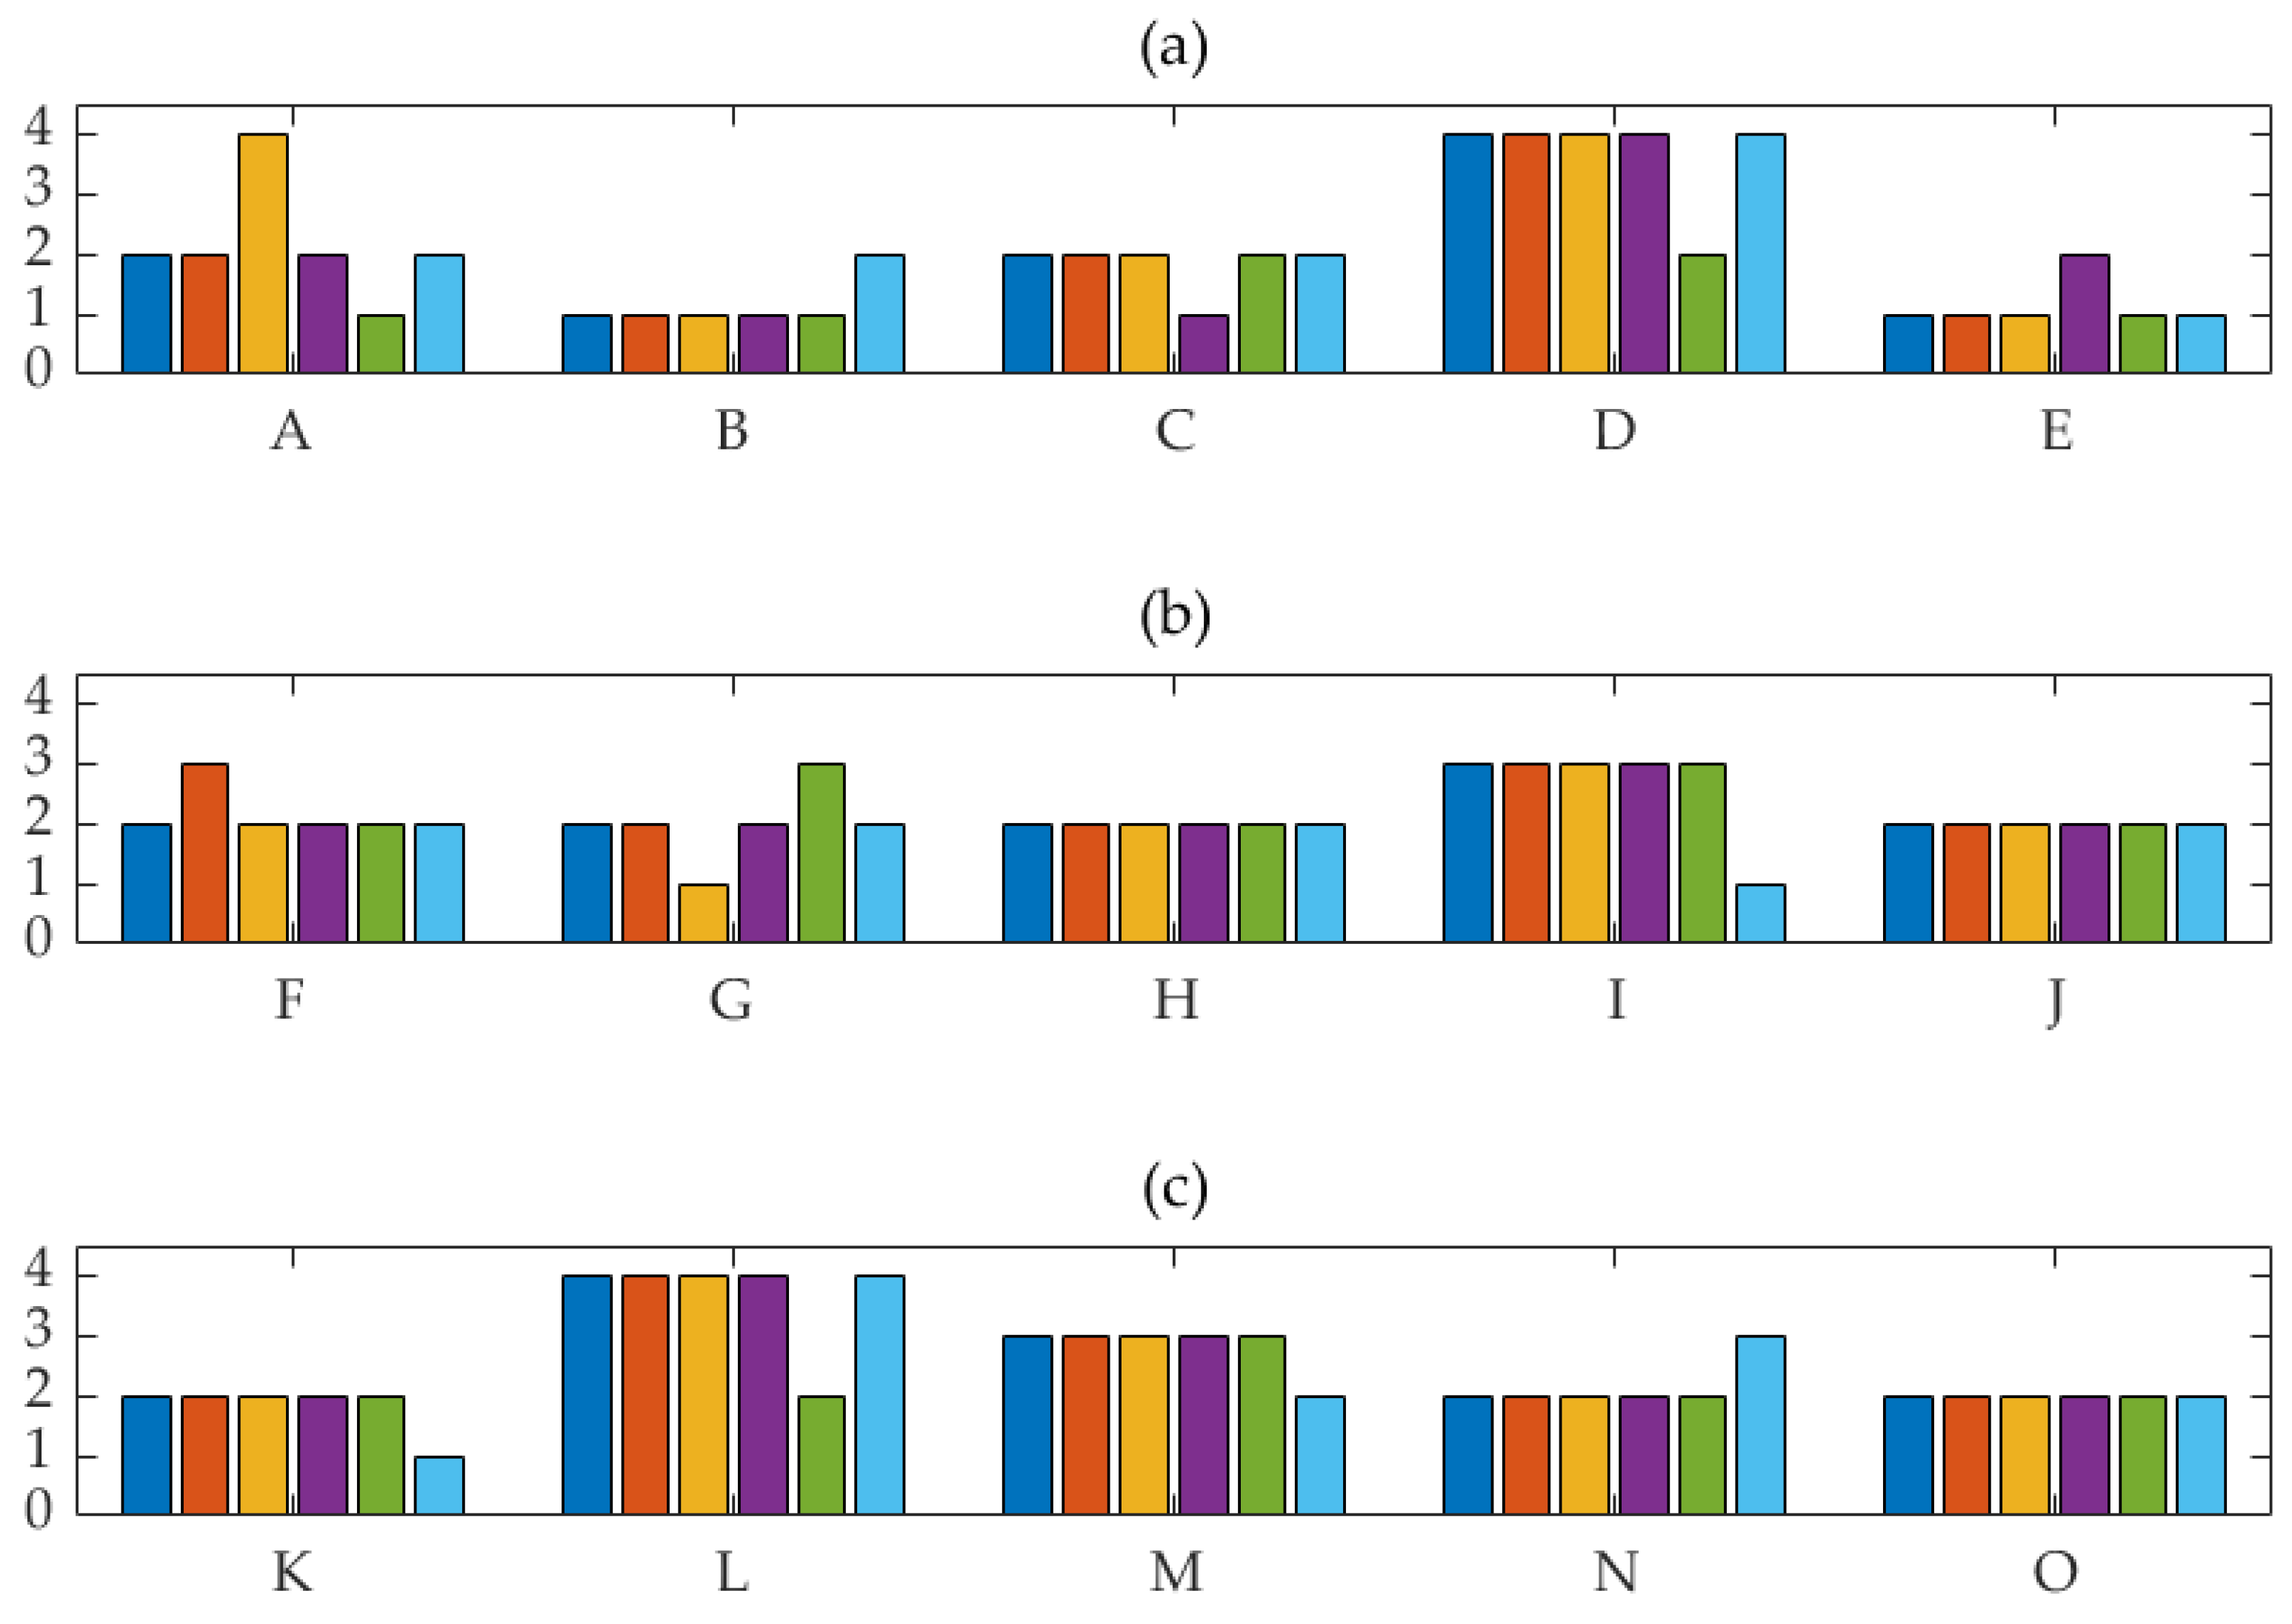
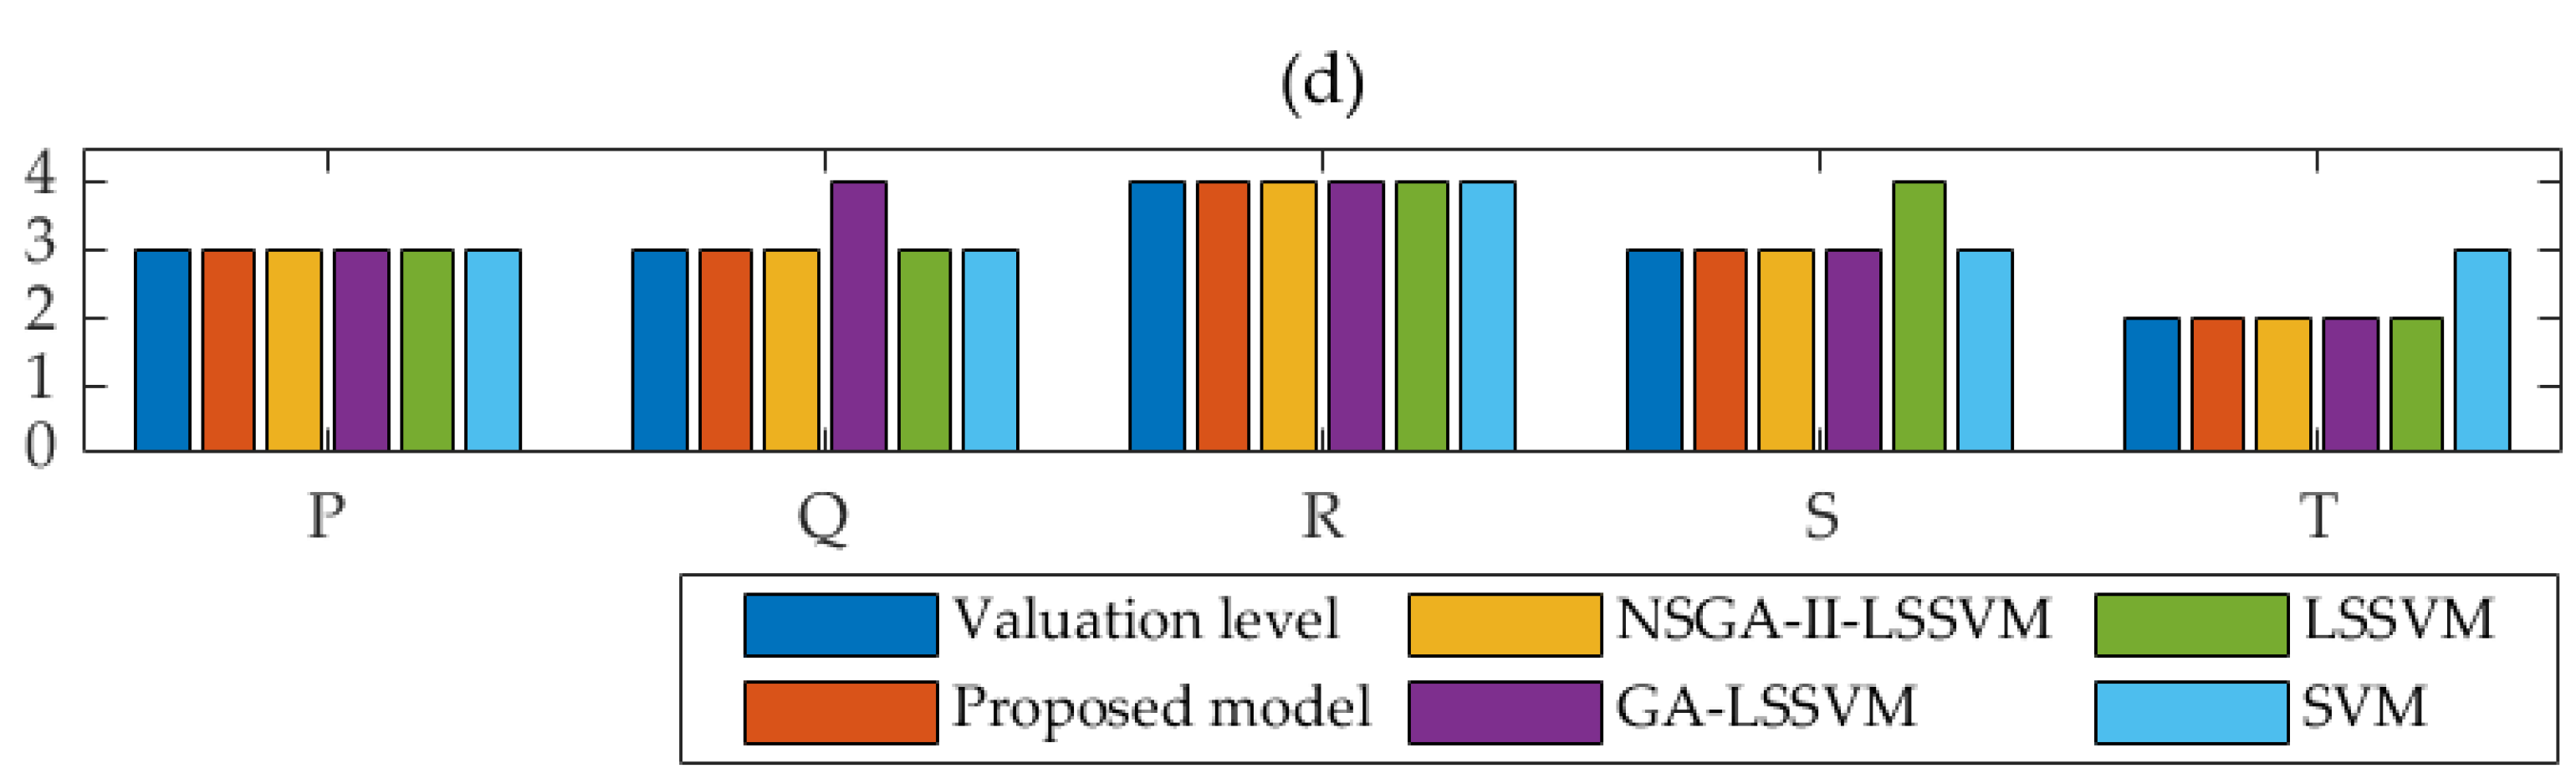
Step 5: Output the evaluation results. According to the characteristics of the core competitiveness level of clean energy incubators, the category labels are set as 1, 2, 3 and 4, that corresponds to the grades of core competitiveness, namely very high, high, general and low, respectively.

4. Experiment Study

4.1. Input Selection and Preprocessing

In order to verify the performance of the established approach, this paper conducts a study on core competitiveness evaluation base on 20 clean energy incubators. The type and representative quantitative index data of 20 incubators are shown in Table 2.
According to the evaluation index system for the core competitiveness of clean energy incubator, Table 3 shows the indicator properties and attributes. Through field investigation and data collection, the relevant data are assembled and sorted out. Simultaneously, 15 experts are invited to score the qualitative indexes in [0, 100]. The corresponding mean value can be considered as the stationary criteria.
In the light of above-mentioned data preprocessing method, the standardized results of the 20 samples are derived as listed in Table 4 and Table 5.

4.2. Evaluation and Analysis of Core Competitiveness of Clean Energy Incubator Based on Matter-Element Extension Model Integrated with TOPSIS

Table 6 presents the indicator weights derived from Equations (2)–(5).
The weighted standardized matrix X can be further obtained as Equation (33):
X = [ 0.0058 0.0087 0.0078 0.0088 0.0027 0.0036 0.0042 0.0036 0.0078 0.0082 0.0048 0.0063 0.0040 0.0053 0.0046 0.0047 ]
Table 7 manifests the positive ideal solution Z + as well as the negative one calculated from Equations (9) and (10). The extremum interval composed of the above results is divided into four levels, namely low, general, high and very high. Here, x1 is taken as an example, the corresponding positive and negative ideal solutions are 0.0088 and 0.0047, respectively. The interval can be expressed as Equation (34). This technique is applicable for other indexes.
H 11 = [ 0.0047 , 0.0058 ] H 12 = [ 0.0058 , 0.0068 ] H 13 = [ 0.0068 , 0.0078 ] H 14 = [ 0.0078 , 0.0088 ]
Furthermore, the closeness degree E(Ni) between each index in standardized decision matrix and four evaluation intervals is computed as Equations (35)–(38).
E ( N 1 ) = [ 0.0001 0.0001 0.0014 0.0036 0.0006 0.0006 0.0008 0.0009 0.0007 0.0003 0.0016 0.0016 0.0023 0.0000 0.0004 0.0004 ]
E ( N 2 ) = [ 0.0009 0.0011 0.0004 0.0026 0.0001 0.0001 0.0003 0.0005 0.0003 0.0007 0.0006 0.0006 0.0015 0.0007 0.0011 0.0004 ]
E ( N 3 ) = [ 0.0019 0.0021 0.0006 0.0015 0.0003 0.0003 0.0001 0.0000 0.0013 0.0016 0.0004 0.0004 0.0008 0.0015 0.0019 0.0011 ]
E ( N 4 ) = [ 0.0030 0.0031 0.0017 0.0005 0.0007 0.0007 0.0005 0.0004 0.0023 0.0026 0.0014 0.0014 0.0000 0.0022 0.0027 0.0019 ]
Figure 3 and Table 8 illustrate the weighted closeness degree of each evaluation scheme. The level of the maximum of Qj(Ni) can be determined as the level of the evaluation object.

4.3. Evaluation and Analysis of Core Competitiveness of Clean Energy Incubator Based on KPCA-NSGA-II-LSSVM

Exact though it is, the aforementioned techniques are not suitable to address massive data for their weakness of complex calculation and low efficiency. Thus, the intelligent evaluation model is proposed in this paper.

4.3.1. Growth Catalytic Ability

In this part, the above 20 clean energy incubators are taken as training sample, and the other 20 incubators are used as testing samples. PCA and KPCA are applied to 36 indicators to attain the variance contribution rates and cumulative variance contribution rate, as shown in Table 9 and Table 10. Figure 4 and Figure 5 exhibit the results more intuitively.
From Table 9 and Table 10, Figure 4 and Figure 5, it can be seen that the first principal component of KPCA explains 69.56% of the factors, while the contribution rate of the first principal component in PCA is only 25.68%. In addition, it needs to extract 14 principal components in PCA or 3 principal components in KPCA to ensure cumulative contribution rate more than 95%, which can retain enough original data information. Therefore, the dimension reduction and simplification of KPCA is superior to PCA.
The selected principal components coefficients are acquired through dividing the principal component load vectors by the arithmetic square root of the eigenvalues. The output component matrix is presented in Table 11.

4.3.2. Result Analysis

This paper performs on Matlab R2014a with Intel Core i5-6300U, 4G memory and 500G hard disk. It should be noted that important parameters of the proposed model are obtained by NSGA algorithm to guarantee the precision. In NSGA-II, the population size is 300, the maximum iteration number equals 200 and crossover and mutation probability is set as 2. In this way, the optimized parameters of LSSVM are γ = 36.6786 and σ 2 = 16.1816 .
The experiment selects several techniques to make comparison so as to examine the performance of the proposed method. The involved approaches include NSGA-II-LSSVM, GA-LSSVM, LSSVM and SVM. In LSSVM, γ and σ2 equal 9.8568 and 16.2657 by cross validation, partly. In SVM, penalty parameter c is 8.659, kernel function parameter g equals 0.299 and loss function parameter p is 2.869.
The three principal components extracted by KPCA are exploited as input samples. The results of the test samples are displayed in Table 12 and Figure 6. In order to show the results clearly, the samples are divided into four groups, which are shown in (a–d) of Figure 6. Here, the relative errors in Table 12 are the results of the test samples and the number 1, 2, 3, 4 in Figure 6 represent the level of very high, high, general and low, respectively. In addition, the accuracy of 5 models is shown in Figure 7.
In terms of method performance, the relative error is minimum, only 5% between KPCA-NSGA-II-LSSVM and matter-element extension model combined with TOPSIS. That is, only one of the 20 clean energy incubators presents diverse level. Whereas, the relative errors of NSGA-II-LSSVM, GA-LSSVM, LSSVM and SVM. In LSSVM are 10%, 20%, 25% and 30%, respectively. As a consequence, the established model in this paper outperforms other approaches with reference to relative error as well as classification accuracy. Compared with NSGA-II-LSSVM, KPCA overcomes the adverse effects of redundant factors on LSSVM training. The GA optimization part is inferior to NSGA-II of the parameters’ setting in LSSVM in aspect of improving its generalization ability and classification precision. In comparison with SVM, the categorization accuracy is enhanced due to the transformation of forecasting problems into equations through kernel function. Overall, the evaluation performance can be ranked from superior to inferior as follows: KPCA-NSGA-II-LSSVM, NSGA-II-LSSVM, GA-LSSVM, LSSVM, SVM. What’s more, we can also observe the advantages of the proposed model through Figure 7, where the accuracy of the proposed model is the highest.
Hence, KPCA-NSGA-II-LSSVM is able to be utilized in the field of core competitiveness of clean energy incubators scientifically and effectively. On the foundation of extension matter-element model integrated with TOPSIS, the introduction of auxiliary intelligent algorithm can achieve fast calculation and support the decision-making of relevant investors.

5. Conclusions

This paper designs an evaluation index system for core competitiveness of clean energy incubators and puts forward an assessment approach based on matter-element extension model integrated with TOPSIS as well as KPCA-NSGA-II-LSSVM. The indicator system is built from five aspects, that is strategic positioning ability, seed selection ability, intelligent transplantation ability, growth catalytic ability and service value-added ability to respect its core competitiveness. The paper takes advantage of extension matter-element model and TOPSIS to weight the selected evaluation indexes objectively and acquires the result from the perspective of traditional approaches. KPCA is manipulated in response to feature dimension so as to extract important information. Then LSSVM optimized by NSGA-II outputs the evaluation level concerning modern intelligence. The case study demonstrates the scientificity and accuracy of the proposed model in this paper, thereinto the traditional technique is able to obtain exact results while the intelligent evaluation methods can achieve fast calculation and decision-making support. Research on the evaluation of the core competitiveness of clean energy incubator will help managers to understand the level and deficiency of their core competitiveness, and then help managers to carry out more targeted work. To sum up, this research is expected to provide decision-making basis for more reasonable operation mode of clean energy incubators. However, more sample data is needed for verification. At the same time, using more intelligent models to evaluate the core competitiveness of clean energy incubators is also our next work.

Author Contributions

Conceptualization, Y.L.; Data curation, G.L. and Y.L.; Funding acquisition, Y.L.; Investigation, G.L. and Y.L.; Methodology, Y.L.; Project administration, D.N. and Y.L.; Resources, Y.L.; Software, G.L.; Supervision, Y.L. and D.N.; Validation, G.L.; Writing—original draft, G.L. and Y.L.; Writing—review & editing, Y.L. All authors have read and agreed to the published version of the manuscript.

Funding

This work is supported by the 2018 Key Projects of Philosophy and Social Sciences Research, Ministry of Education, China (Project No. 18JZD032), Natural Science Foundation of Hebei Province, China (Project No. G2020403008) and Humanities and Social Science Research Project of Hebei Education Department, China (Project No. SQ201097).

Conflicts of Interest

The authors declare no conflict of interest.

References

  1. Mazzoni, S.; Ooi, S.; Nastasi, B.; Romagnoli, A. Energy storage technologies as techno-economic parameters for master-planning and optimal dispatch in smart multi energy systems. Appl. Energy 2019, 254, 113682. [Google Scholar] [CrossRef]
  2. Ullal, H.; Mitchell, R.; Keyes, B.; VanSant, K.; Von Roedern, B.; Symko-Davies, M.; Kane, V. Progress of the PV Technology Incubator project towards an enhanced U.S. manufacturing base. In Proceedings of the 2011 37th IEEE Photovoltaic Specialists Conference, Seattle, WA, USA, 19–24 June 2011; IEEE: Seattle, WA, USA, 2011; pp. 003287–003291. [Google Scholar]
  3. Brun, E.C. Understanding a Business Incubator as a Start-Up Factory: A Value Chain Model Perspective. Int. J. Innov. Technol. Manag. (IJITM) 2019, 16, 1950025. [Google Scholar] [CrossRef]
  4. Wang, Z.; He, Q.; Xia, S.; Sarpong, D.; Xiong, A.; Maas, G. Capacities of business incubator and regional innovation performance. Technol. Forecast. Soc. Chang. 2020, 158, 120125. [Google Scholar] [CrossRef]
  5. Prahalad, C.K.; Hamel, G. The Core Competence of the Corporation. Harv. Bus. Rev. 2010, 68, 275–292. [Google Scholar]
  6. Zhao, X. Evaluation and analysis on core competitiveness of China cotton textile enterprises with intuitionistic fuzzy information. Int. J. Knowl. Based Intell. Eng. Syst. 2019, 23, 9–13. [Google Scholar] [CrossRef]
  7. Wu, Y.; Ke, Y.; Xu, C.; Li, L. An integrated decision-making model for sustainable photovoltaic module supplier selection based on combined weight and cumulative prospect theory. Energy 2019, 181, 1235–1251. [Google Scholar] [CrossRef]
  8. Zhang, T.; Pan, M.Z. Evaluation of core competitiveness of modern circulation industry considering coupling effect. Res. Commer. Econ. 2020, 16, 9–11. [Google Scholar]
  9. Changhong, L. Research on comprehensive competitiveness evaluation of science and technology business incubator in Pearl River Delta. J. Intell. 2010, 29, 147–149. [Google Scholar]
  10. Qiang, M.; Zecong, Y.; Jing, S. Competitive Evaluation of Chain Incubator Based on IPA Analysis. Sci. Technol. Manag. Res. 2019, 11, 78–84. [Google Scholar]
  11. Zhimei, T. Sustainable Development Ability Evaluation Research about Business Incubation Based on Principal Component Analysis and DEA Method. Sci. Technol. Manag. Res. 2016, 36, 88–94. [Google Scholar]
  12. Ning, A.; Chen, G. Knowledge service capacity evaluation of incubators based on satisfaction of incubating startups. Sci. Technol. Manag. 2016, 18, 82–87. [Google Scholar]
  13. Shunyi, H. Construction of social benefit evaluation index system and weight analysis of business incubator. Pioneer. Sci. Technol. Mon. 2016, 29, 75–79. [Google Scholar]
  14. Yang, W.; Xu, K.; Lian, J.; Bin, L.; Ma, C. Multiple flood vulnerability assessment approach based on fuzzy comprehensive evaluation method and coordinated development degree model. J. Environ. Manag. 2018, 213, 440. [Google Scholar] [CrossRef]
  15. Han, H.; Li, H.; Zhang, K. Urban Water Ecosystem Health Evaluation Based on the Improved Fuzzy Matter-Element Extension Assessment Model: Case Study from Zhengzhou City, China. Math. Probl. Eng. 2019, 2019, 7502342. [Google Scholar] [CrossRef]
  16. Niu, D.; Li, Y.; Dai, S.; Kang, H.; Xue, Z.; Jin, X.; Song, Y. Sustainability Evaluation of Power Grid Construction Projects Using Improved TOPSIS and Least Square Support Vector Machine with Modified Fly Optimization Algorithm. Sustainability 2018, 10, 231. [Google Scholar] [CrossRef] [Green Version]
  17. Sun, W.; Xu, Y. Financial security evaluation of the electric power industry in China based on a back propagation neural network optimized by genetic algorithm. Energy 2016, 101, 366–379. [Google Scholar] [CrossRef]
  18. Liu, D.; Liu, C.; Fu, Q.; Li, T.; Imran, K.M.; Cui, S.; Abrar, F.M. ELM evaluation model of regional groundwater quality based on the crow search algorithm. Ecol. Indic. 2017, 81, 302–314. [Google Scholar] [CrossRef]
  19. Ren, D.; Du, J. Marine Foreign Trade Economic Zone Industry Investment Risk Evaluation Model under the Background of the Belt and Road. J. Coast. Res. 2018, 83, 212–216. [Google Scholar] [CrossRef]
  20. Niu, D.; Li, S.; Dai, S. Comprehensive Evaluation for Operating Efficiency of Electricity Retail Companies Based on the Improved TOPSIS Method and LSSVM Optimized by Modified Ant Colony Algorithm from the View of Sustainable Development. Sustainability 2018, 10, 860. [Google Scholar] [CrossRef] [Green Version]
  21. Wu, Q.; Lin, H. Short-Term Wind Speed Forecasting Based on Hybrid Variational Mode Decomposition and Least Squares Support Vector Machine Optimized by Bat Algorithm Model. Sustainability 2019, 11, 652. [Google Scholar] [CrossRef] [Green Version]
  22. Zhang, Y.; Liu, M. Adaptive directed evolved NSGA2 based node placement optimization for wireless sensor networks. Wirel. Netw. 2020, 26, 3539–3552. [Google Scholar] [CrossRef]
  23. Zhou, Y.; Cao, S.; Kosonen, R.; Hamdy, M. Multi-objective optimisation of an interactive buildings-vehicles energy sharing network with high energy flexibility using the Pareto archive NSGA-II algorithm. Energy Convers. Manag. 2020, 218, 113017. [Google Scholar] [CrossRef]
  24. Tsamardinos, I.; Borboudakis, G.; Katsogridakis, P.; Pratikakis, P.; Christophides, V. A greedy feature selection algorithm for Big Data of high dimensionality. Mach. Learn. 2019, 108, 149–202. [Google Scholar] [CrossRef] [Green Version]
  25. Polutchko, S.K.; Stewart, J.J.; Demmig-Adams, B.; Adams, W.W. Evaluating the link between photosynthetic capacity and leaf vascular organization with principal component analysis. Photosynthetica 2018, 56, 1–12. [Google Scholar] [CrossRef]
  26. Papaioannou, A.; Anastasiadis, A.; Kouloumvakos, A.; Paassilta, M.; Vainio, R.; Valtonen, E.; Belov, A.; Eroshenko, E.; Abunina, M.; Abunin, A. Nowcasting Solar Energetic Particle Events Using Principal Component Analysis. Sol. Phys. 2018, 293, 1–23. [Google Scholar] [CrossRef]
  27. Zhou, Z.; Du, N.; Xu, J.; Li, Z.; Wang, P.; Zhang, J. Randomized Kernel Principal Component Analysis for Modeling and Monitoring of Nonlinear Industrial Processes with Massive Data. Ind. Eng. Chem. Res. 2019, 58, 10410–10417. [Google Scholar] [CrossRef]
  28. Bayram, B.Ç. Evaluation of Forest Products Trade Economic Contribution by Entropy-TOPSIS: Case Study of Turkey. Bioresources 2020, 15, 1419–1429. [Google Scholar] [CrossRef]
  29. Tang, H.; Shi, Y.; Dong, P. Public blockchain evaluation using entropy and TOPSIS. Expert Syst. Appl. 2018, 117, 204–210. [Google Scholar] [CrossRef]
  30. Huang, W.; Shuai, B.; Sun, Y.; Wang, Y.; Antwi, E. Using entropy-TOPSIS method to evaluate urban rail transit system operation performance: The China case. Transp. Res. Part A Policy Pract. 2018, 111, 292–303. [Google Scholar] [CrossRef]
  31. Chen, Y. Study on the Risk Evaluation of Government Purchasing Public Service Based on Matter Element Extension Model. Open J. Soc. Sci. 2018, 6, 127–143. [Google Scholar] [CrossRef] [Green Version]
  32. Soh, W.; Kim, H.; Yum, B.-J. Application of kernel principal component analysis to multi-characteristic parameter design problems. Ann. Oper. Res. 2018, 263, 69–91. [Google Scholar] [CrossRef]
  33. Ardakan, M.A.; Rezvan, M.T. Multi-objective optimization of reliability-redundancy allocation problem with cold-standby strategy using NSGA-II. Reliab. Eng. Syst. Saf. 2018, 172, 225–238. [Google Scholar] [CrossRef]
  34. Song, X.; Zhao, J.; Song, J.; Dong, F.; Xu, L.; Zhao, J. Local Demagnetization Fault Recognition of Permanent Magnet Synchronous Linear Motor Based on S-Transform and PSO–LSSVM. IEEE Trans. Power Electron. 2020, 35, 7816–7825. [Google Scholar] [CrossRef]
Figure 1. Core competitiveness evaluation index system of clean energy incubator.
Sustainability 12 09570 g001
Figure 2. The flowchart of the proposed model.
Sustainability 12 09570 g002
Figure 3. The weighted closeness degree of each evaluation scheme.
Sustainability 12 09570 g003
Figure 4. Total variance of PCA.
Sustainability 12 09570 g004
Figure 5. Total variance of KPCA.
Sustainability 12 09570 g005
Figure 6. Results of 5 models in core competitiveness valuation of clean energy incubators. Note: (a) shows the results from sample A to E; (b) shows the results from sample F to J; (c) shows the results from sample K to O; (d) shows the results from sample P to T.
Sustainability 12 09570 g006aSustainability 12 09570 g006b
Figure 7. The accuracy of the proposed model and the comparison models.
Sustainability 12 09570 g007
Table 1. The input of evaluation model.
InputIndexInputIndex
x1Leading industry is in line with the global future energy development directionx19Social network management
x2Leading industry belongs to the global emerging energy industryx20Social responsibility performance
x3Leading industry is attributed to key industries encouraged by the statex21Total incubation fund
x4Leading industry is ascribed to clean energy industryx22Financing service capability
x5Leading energy industry is the focus of regional strategic progressx23Technical standardization degree
x6Leading energy industry possesses growth foundation and supporting systemx24Business process standardization
x7Leading energy industry owns unique resourcesx25Outsourcing
x8Positioning consistency between entrepreneurial team and incubatorx26Cluster development
x9Future five-year planx27Industry brand
x10Future five-year expected venture capital investmentx28Brand extension
x11Innovation resourcesx29Brand feedback
x12Innovative incentivesx30Total investment in innovation test platform
x13Number of management consulting labourx31Number of experts in innovation team
x14Proportion of highly educated employees in management consulting servicex32Number of successful introduction of external scientific payoffs
x15Management communication and sharing levelx33Number of scientific research achievements of incubating enterprises successfully transformed
x16Number of intellectual property applicationsx34Knowledge information service effect
x17Innovative culture constructionx35Number of scientific and technological achievements transferred
x18Stakeholder managementx36Effect of expert service
Table 2. The type and representative quantitative index data of 20 incubators.
Clean Energy IncubatorTypeFuture Five-Year Expected Venture Capital Investment (Million Chinese Yuan)Proportion of Highly Educated Employees in Management Consulting Service (%)Total Incubation Fund (Million Chinese Yuan)
ASolar, hydro, biomass5991111
BSolar796198
CWind, solar, biomass734968
DWind, solar, hydro, biomass889592
ESolar876483
FBiomass7169105
GHydro464770
HWind, Solar, biomass588486
ISolar, biomass818977
JWind, solar, hydro497287
KWind, biomass716374
LWind, solar, hydro, biomass8072103
MWind, solar, biomass1204298
NWind, solar, hydro, biomass567384
OWind, solar597996
PWind, solar8454101
QWind, biomass798069
RWind, solar, hydro, biomass589694
SWind, hydro1657994
TWind, solar, hydro, biomass6957156
Table 3. Evaluation index properties for core competitiveness of clean energy incubator.
IndexIndex Properties
Leading industry is in line with the global future energy development directionqualitative indicator
Leading industry belongs to the global emerging energy industryqualitative indicator
Leading industry is attributed to key industries encouraged by the statequalitative indicator
Leading industry is ascribed to clean energy industryqualitative indicator
Leading energy industry is the focus of regional strategic progressqualitative indicator
Leading energy industry possesses growth foundation and supporting systemqualitative indicator
Leading energy industry owns unique resourcesqualitative indicator
Positioning consistency between entrepreneurial team and incubatorqualitative indicator
Future five-year planqualitative indicator
Future five-year expected venture capital investmentquantitative indicator
Innovation resourcesqualitative indicator
Innovative incentivesqualitative indicator
Number of management consulting labourquantitative indicator
Proportion of highly educated employees in management consulting servicequantitative indicator
Management communication and sharing levelqualitative indicator
Number of intellectual property applicationsquantitative indicator
Innovative culture constructionqualitative indicator
Stakeholder managementqualitative indicator
Social network managementqualitative indicator
Social responsibility performancequalitative indicator
Total incubation fundquantitative indicator
Financing service capabilityqualitative indicator
Technical standardization degreequalitative indicator
Business process standardizationqualitative indicator
Outsourcingqualitative indicator
Cluster developmentqualitative indicator
Industry brandqualitative indicator
Brand extensionqualitative indicator
Brand feedbackqualitative indicator
Total investment in innovation test platformquantitative indicator
Number of experts in innovation teamquantitative indicator
Number of successful introduction of external scientific payoffsquantitative indicator
Number of scientific research achievements of incubating enterprises successfully transformedquantitative indicator
Knowledge information service effectqualitative indicator
Number of scientific and technological achievements transferredquantitative indicator
Effect of expert servicequalitative indicator
Table 4. Data processing results of core competitiveness evaluation indexes for clean energy incubator (A–J).
IndexClean Energy Incubator
ABCDEFGHIJ
x10.17590.16990.21760.26530.15800.16990.15500.21760.16690.2116
x20.21060.21060.22440.24940.24110.22170.16900.25490.25220.1607
x30.19460.18280.22700.28300.23290.22990.23290.22990.15330.2005
x40.16110.18450.25770.21090.23140.16690.19920.25770.18450.1962
x50.25420.16360.19280.25710.14610.18700.23080.27170.27470.1636
x60.23670.20330.22000.21440.13920.19220.18100.17820.23670.2646
x70.17130.21560.16240.15650.14770.28050.21260.15950.25990.1624
x80.19230.23580.22030.26370.18300.19540.25750.28540.20780.2296
x90.27440.15470.24810.25680.16930.20430.18680.24810.17800.1985
x100.15800.25340.21170.26530.27430.22950.15200.18180.22360.1580
x110.18490.23330.19920.25610.14510.21620.21340.27030.25320.2504
x120.21560.19830.25290.26160.16960.24140.22990.19550.24430.2817
x130.15320.17630.27460.26590.17050.25440.28040.23410.25440.1445
x140.26440.19680.17830.28290.20600.19060.15680.24600.26440.2306
x150.19480.17910.27650.19480.18850.21370.17600.21680.26390.1571
x160.24010.20750.25790.25190.18380.18380.15120.23120.25790.2579
x170.19850.14960.14380.27610.16680.26170.20130.21280.18410.2646
x180.27530.16390.22270.26910.16390.15470.16390.19490.20110.2815
x190.21990.17890.27850.21400.15540.23750.26100.21400.26980.2170
x200.18500.15770.23950.24260.19100.23350.19410.15460.24260.2880
x210.27830.24160.15290.22940.19270.26610.15910.21110.17430.2111
x220.16750.17640.16450.28710.18840.16150.21830.24220.23920.1884
x230.19340.18760.18170.27260.16710.17000.25790.18170.26080.2491
x240.15270.23630.23920.27090.22480.21620.27960.17870.22480.1643
x250.16300.26730.28040.24130.19240.17280.28690.16630.16950.2739
x260.23830.20850.15190.22340.17580.18470.28000.29490.16390.1609
x270.26860.16180.27730.21950.25710.22820.23690.21090.18780.2253
x280.15720.16590.16880.26780.17170.28530.19790.24450.21250.2649
x290.20570.22990.25410.28140.24200.25110.16940.26020.29650.1634
x300.25470.21790.20090.21220.16410.14720.19530.24050.23770.2377
x310.16620.15430.14840.24630.17210.20180.29670.20770.21660.2196
x320.20600.17520.20600.23670.15370.17220.23360.19060.25820.2859
x330.29350.15850.15850.26410.17610.18190.17900.16430.24060.2524
x340.21850.17420.28050.29230.20670.18010.15060.19780.17130.2244
x350.22190.18490.19410.24350.27120.16020.24960.22190.21570.1849
x360.27090.17770.16020.28550.25640.21560.20690.27970.25350.2709
Table 5. Data processing results of core competitiveness evaluation indexes for clean energy incubator (K–T).
IndexClean energy Incubator
KLMNOPQRST
x10.19080.28320.25340.26230.24140.24140.22650.28910.19970.2891
x20.17460.23280.27160.23830.20780.17730.21060.26880.21890.2328
x30.28010.29480.17390.15330.22990.16510.19460.28590.22110.2270
x40.14640.29290.15810.15230.24600.27530.26650.28120.21970.2812
x50.26000.23080.24250.24840.17530.18120.18990.26590.23380.2308
x60.21160.26730.25900.16710.18940.27010.21720.20890.27010.2785
x70.25100.25990.24510.21850.28350.23920.23030.27760.27170.1683
x80.23270.19230.20470.18610.18610.20780.24820.17060.27610.2482
x90.28600.29190.21310.22470.17220.29190.18680.16050.24230.1956
x100.21460.25340.28620.18480.18780.25340.22060.17890.29210.2117
x110.16790.24180.27310.23610.15360.18490.17920.27310.18780.2760
x120.23280.24720.20700.22130.16670.14370.17250.28170.24140.2041
x130.25440.21970.28330.26010.15320.15030.24570.24860.17920.1590
x140.17530.23060.15990.20290.24600.17530.27370.29520.24910.1630
x150.17910.28280.20740.17910.21680.26710.27340.25140.23570.2514
x160.21930.25490.18380.17190.17780.19270.23420.15410.29640.2845
x170.19560.25310.16390.25600.21000.27040.23300.17830.28190.2790
x180.21030.30620.24750.20730.19800.19180.17320.30930.25060.1825
x190.20820.21990.19650.26980.24040.16130.26390.17010.17300.2580
x200.23040.29710.16070.17890.17890.28500.22130.28500.24260.1698
x210.17430.26000.24780.19580.23860.25690.15600.23550.23250.2845
x220.24520.20930.15250.24520.24520.26920.20630.26320.23030.2931
x230.26380.25200.14650.20520.25790.24030.25500.21100.22570.2286
x240.15560.19890.22480.27090.27670.14410.17870.26800.19600.2796
x250.26410.29990.18580.22820.22500.18260.21520.20210.16630.1989
x260.14900.22340.24430.28300.21150.24430.19960.28000.19660.2651
x270.24550.27440.16180.18200.17620.26580.24840.21950.17330.1878
x280.20090.18920.23870.22120.26780.19210.25030.22120.28240.2009
x290.24810.22990.19670.17850.15730.18150.26930.22990.19360.1513
x300.26600.26600.24620.17830.27170.24620.20090.21510.24050.1783
x310.17210.22850.28190.28190.24040.18990.25220.22550.23440.2552
x320.28590.26750.21830.19060.19370.27980.18750.23360.18450.2429
x330.16140.23480.23770.18780.28170.25820.27580.26120.24650.1585
x340.25100.26580.17420.19190.15360.25990.29230.26280.23030.2038
x350.16640.29280.25890.20030.26190.22800.21570.27430.16950.1911
x360.16320.21850.18940.21560.20980.17770.23310.25060.17480.1923
Table 6. Indicator weights.
IndexWeightIndexWeight
x10.0306x190.0230
x20.0156x200.0327
x30.0278x210.0262
x40.0364x220.0278
x50.0256x230.0229
x60.0236x240.0327
x70.0353x250.0312
x80.0165x260.0327
x90.0306x270.0224
x100.0285x280.0246
x110.0273x290.0290
x120.0223x300.0195
x130.0401x310.0283
x140.0295x320.0241
x150.0232x330.0354
x160.0280x340.0314
x170.0326x350.0226
x180.0358x360.0243
Table 7. Positive and negative ideal solutions.
IndexPositive Ideal SolutionNegative Ideal SolutionIndexPositive Ideal SolutionNegative Ideal Solution
x10.00880.0047x190.00640.0036
x20.00420.0025x200.00970.0051
x30.00820.0043x210.00750.0040
x40.01070.0053x220.00810.0042
x50.00700.0037x230.00620.0034
x60.00660.0033x240.00910.0047
x70.01000.0052x250.00940.0051
x80.00470.0028x260.00960.0049
x90.00890.0047x270.00620.0036
x100.00830.0043x280.00700.0039
x110.00750.0040x290.00860.0044
x120.00630.0032x300.00530.0029
x130.01140.0058x310.00840.0042
x140.00870.0046x320.00690.0037
x150.00660.0036x330.01040.0056
x160.00830.0042x340.00920.0047
x170.00920.0047x350.00660.0036
x180.01110.0055x360.00690.0039
Table 8. The weighted closeness degree and valuation level of each evaluation scheme.
Clean Energy IncubatorQ(N1)Q(N2)Q(N3)Q(N4)Max ValueValuation Level
A0.99870.99890.99870.99810.9989general
B0.99920.99910.99860.99770.9992low
C0.99850.99880.99880.99830.9988general
D0.99760.99850.99920.99920.9992very high
E0.99920.99900.99850.99760.9992low
F0.99880.99900.99880.99810.9990general
G0.99860.99880.99860.99810.9988general
H0.99850.99900.99900.99830.9990general
I0.99840.99890.99900.99850.9990high
J0.99850.99880.99880.99840.9988general
K0.99860.99890.99880.99830.9989general
L0.99750.99850.99910.99920.9992very high
M0.99850.99880.99880.99830.9988high
N0.99860.99900.99880.99830.9990general
O0.99860.99890.99880.99830.9989general
P0.99840.99870.99880.99850.9988high
Q0.99830.99900.99910.99860.9991high
R0.99770.99840.99890.99900.9990very high
S0.99830.99900.99910.99860.9991high
T0.99840.99870.99860.99830.9987general
Table 9. Variance contribution rates and cumulative variance contribution rate of PCA.
ComponentVariance Contribution Rate/%Cumulative Variance Contribution Rate/%
125.6825.68
216.6742.35
38.6651.01
48.5659.57
56.5666.13
66.0272.15
75.2277.37
83.6581.02
93.0284.04
102.6686.7
112.5689.26
122.3691.62
131.8893.5
141.8395.33
151.1696.49
160.9697.45
170.8898.33
180.5298.85
190.3899.23
200.2299.45
210.1899.63
220.1699.79
230.0999.88
240.0699.94
250.0399.97
260.0199.98
270.0199.99
280.01100
290100
300100
310100
320100
330100
340100
350100
360100
Table 10. Variance contribution rates and cumulative variance contribution rate of KPCA.
ComponentVariance Contribution Rate/%Cumulative Variance Contribution Rate/%
169.5669.56
218.5888.14
37.5695.7
42.8298.52
50.9999.51
60.2699.77
70.1899.95
80.0399.98
90.02100
100100
110100
120100
130100
140100
150100
160100
170100
180100
190100
200100
210100
220100
230100
240100
250100
260100
270100
280100
290100
300100
310100
320100
330100
340100
350100
360100
Table 11. Component matrix of KPCA.
FactorComponent
123
x1−0.903−0.9330.598
x20.267−0.4520.948
x30.4710.7000.352
x40.862−0.5480.821
x5−0.0600.7080.861
x60.673−0.7210.440
x70.443−0.199−0.368
x80.227−0.669−0.607
x90.174−0.6450.547
x10−0.3990.1810.487
x11−0.508−0.8520.475
x12−0.1670.4010.438
x13−0.6900.5480.379
x14−0.3850.568−0.053
x150.750−0.054−0.055
x16−0.125−0.007−0.809
x17−0.4750.3500.336
x180.9580.6960.610
x190.901−0.2480.948
x200.066−0.1820.663
x210.0330.9910.125
x220.1440.006−0.919
x230.3780.4910.527
x240.5180.7840.144
x25−0.5610.9640.333
x26−0.960−0.256−0.828
x270.6590.961−0.572
x28−0.8140.3070.110
x290.7170.8760.236
x30−0.295−0.077−0.607
x310.6000.987−0.400
x320.0290.147−0.289
x330.227−0.4450.886
x340.8670.1050.006
x35−0.025−0.826−0.299
x360.546−0.771−0.841
Table 12. Results of 5 models in core competitiveness valuation of clean energy incubators.
Clean Energy IncubatorValuation LevelKPCA-NSGA-II-LSSVMNSGA-II-LSSVMGA-LSSVMLSSVMSVM
Ageneralgeneralvery highgenerallowgeneral
Blowlowlowlowlowgeneral
Cgeneralgeneralgenerallowgeneralgeneral
Dvery highvery highvery highvery highgeneralvery high
Elowlowlowgenerallowlow
Fgeneralhighgeneralgeneralgeneralgeneral
Ggeneralgenerallowgeneralhighgeneral
Hgeneralgeneralgeneralgeneralgeneralgeneral
Ihighhighhighhighhighlow
Jgeneralgeneralgeneralgeneralgeneralgeneral
Kgeneralgeneralgeneralgeneralgenerallow
Lvery highvery highvery highvery highgeneralvery high
Mhighhighhighhighhighgeneral
Ngeneralgeneralgeneralgeneralgeneralhigh
Ogeneralgeneralgeneralgeneralgeneralgeneral
Phighhighhighhighhighhigh
Qhighhighhighvery highhighhigh
Rvery highvery highvery highvery highvery highvery high
Shighhighhighhighvery highhigh
Tgeneralgeneralgeneralgeneralgeneralhigh
Relative error-5%10%15%25%30%
Publisher’s Note: MDPI stays neutral with regard to jurisdictional claims in published maps and institutional affiliations.

