Article

Application of Hybrid SWARA–BIM in Reducing Reworks of Building Construction Projects from the Perspective of Time

by
Hamidreza Khalesi
1,
Amirhossein Balali
1,
Alireza Valipour
1,*,
Jurgita Antucheviciene
2,
Darius Migilinskas
2 and
Viaceslav Zigmund
2
1
Department of Civil Engineering, Shiraz Branch, Islamic Azad University, Shiraz 5-71993, Iran
2
Department of Construction Management and Real Estate, Vilnius Gediminas Technical University, 10221 Vilnius, Lithuania
*
Author to whom correspondence should be addressed.
Sustainability 2020, 12(21), 8927; https://doi.org/10.3390/su12218927
Submission received: 29 September 2020 / Revised: 23 October 2020 / Accepted: 24 October 2020 / Published: 27 October 2020
(This article belongs to the Special Issue Sustainable Construction Engineering and Management)

Abstract

:
One of the major issues of the construction industry has been the “reworks” that affect the time, quality, and cost of projects. Therefore, reworks and the ineffective use of site resources and materials will always result in significant losses on projects. The development of information technology has led to the widespread use of Building Information Modelling (BIM) to enhance the delivery of more sustainable building construction projects. The purpose of this study is to combine the Step-wise Weight Assessment Ratio Analysis (SWARA) method and BIM technologies to identify and reduce time delays caused by reworks in construction projects. Firstly, 49 rework causes in residential buildings were identified and ranked. Then, BIM was generated and compared to the initial model. It was observed that working hours were reduced by 4.6%. Moreover, using an Earned Value Management (EVM) system, a 0.06 increase in Schedule Performance Index (SPI) factor was illustrated. Results obtained by this study provide an effective step in reducing a project’s time in the construction industry.

1. Introduction

Rework is regarded as a serious issue for construction industry projects [1]. Cost, schedule, performance, and productivity of construction projects are influenced by reworks [2]. Cost and schedule overruns often occur due to rework in construction projects [2,3]. According to previous studies, rework costs range from 5% to 20% in major civil engineering projects [4,5]. To manage rework, its roots and causes must be identified first [1,6]. Many studies have been conducted to identify such causes [1,6,7,8,9,10]. It is essential to reduce rework due to severe potential consequences. Thus, managers are highly recommended to identify factors which result in rework in the planning phase of projects [1].
There have been various definitions of rework given by different researchers. According to Josephson et al. (2002), rework is defined as dispensable output resulting due to mistakes during the construction project [7]. Love (2002) defines rework as an event or process which is caused due to quality accidents, unqualified quality problems, deviations, or faults [11]. Ye et al. (2015) define rework as redoing a process which has already been done, to satisfy the functional requirements of the project [2]. Forcada et al. (2017) mention that any additional work that has resulted from order changes, design errors and scope changes must also be regarded as rework [12]. Many researchers have attempted to identify factors of rework. It is crucial to analyze all factors and to use appropriate decision-making tools for clients and construction project managers. Research has shown strong attention to these complex management issues to improve the productivity of projects in the construction industry. Most of the researchers are focused on the identification of risk processes and factors to support managers and decision-makers in identifying problems for efficient risk management [13].
According to Hwang et al. (2019), these factors in the construction projects can generally be put into six groups including “Contractor”, “Subcontractor”, “Supplier”, “Manufacturer”, “Designer” and “Client” [
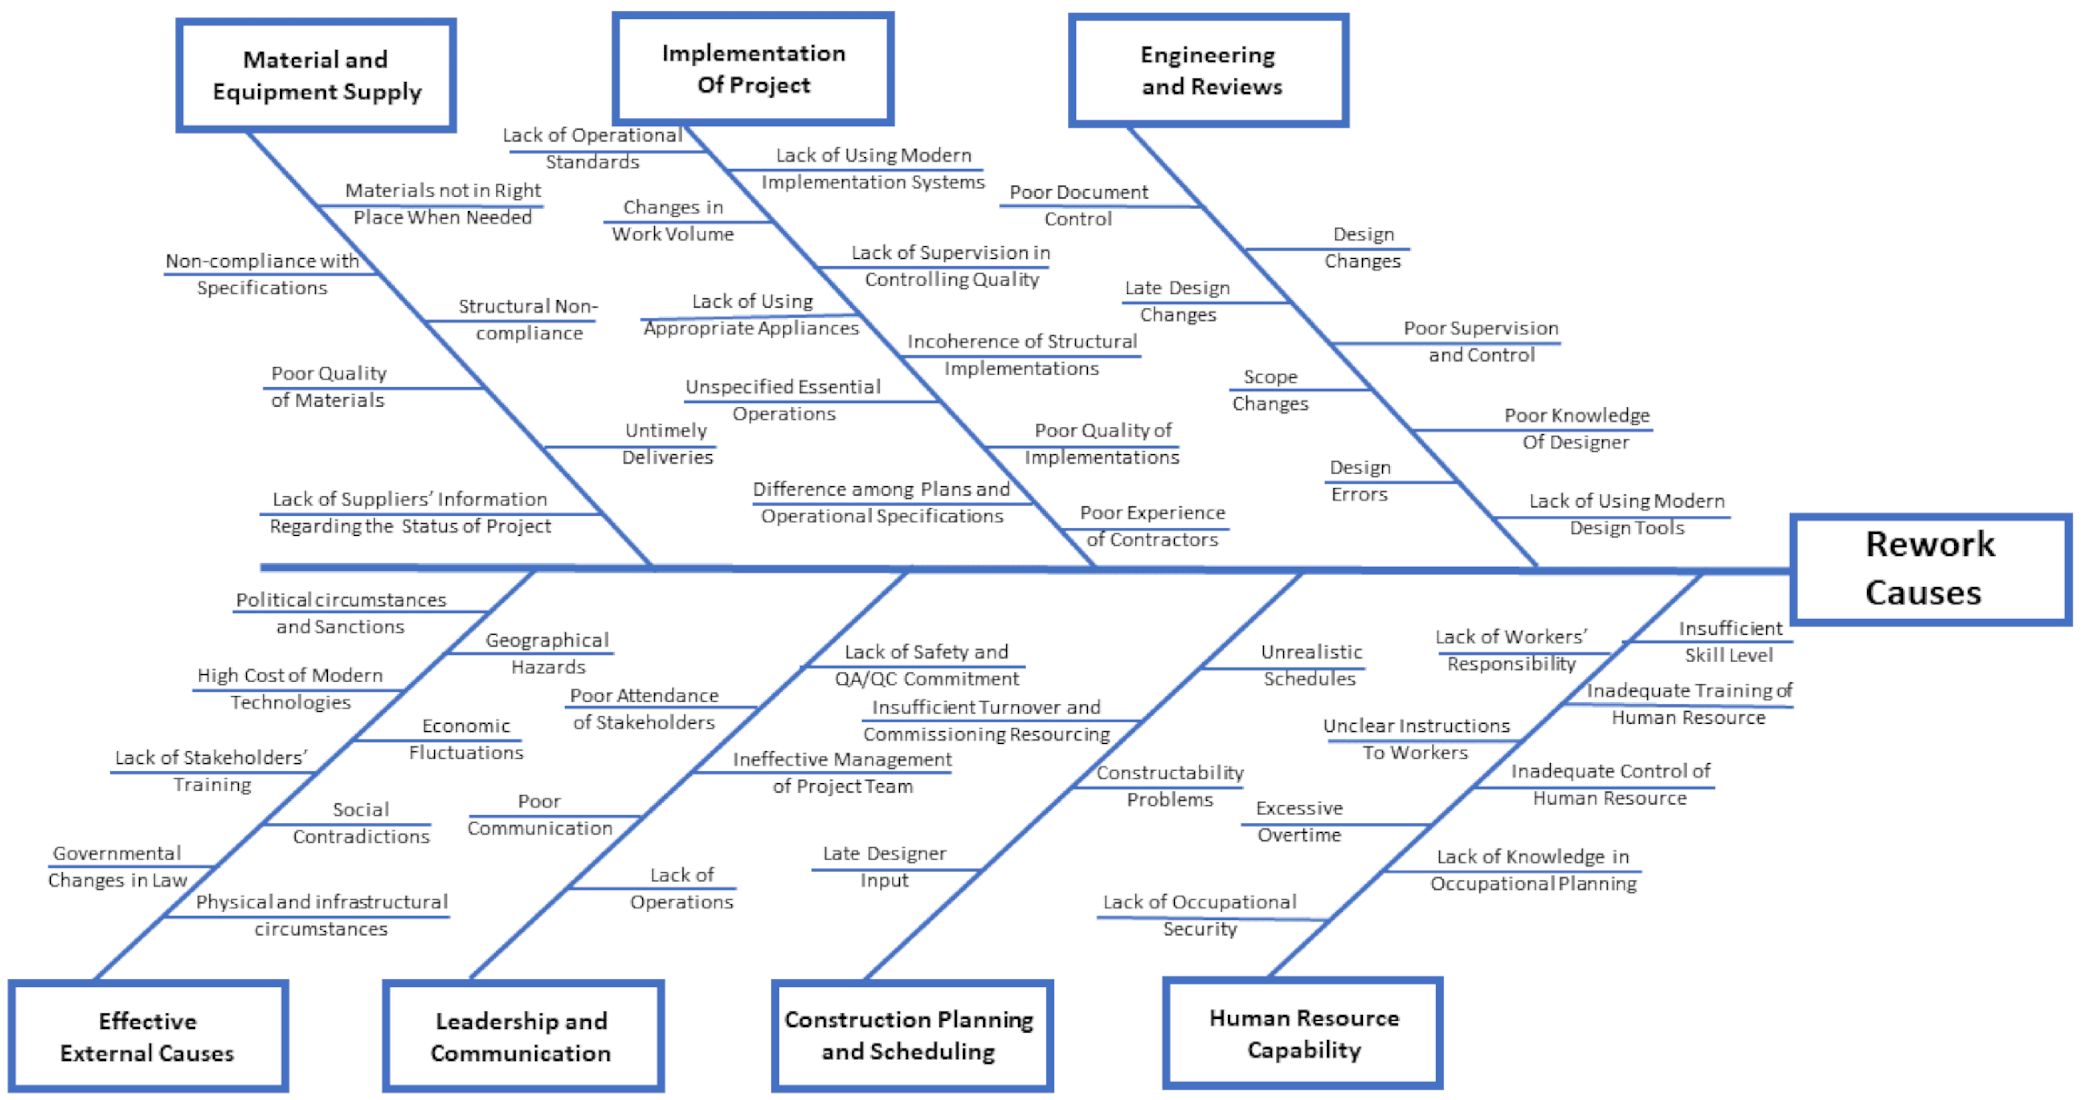
1]. Fayek et al. (2003) developed a fishbone diagram to illustrate the actual and potential causes of rework. They concluded that “Poor workmanship of prefabricated material”, “Lack of inspection”, and “Consistency not insured before issued for construction” are the major reasons for rework [6]. Rework can affect a projects’ performance [1], thus, it seems necessary to identify and prevent them.
There have been various definitions for Building Information Modelling (BIM). For instance, Penttilä (2006) defines BIM as
“A set of interrelating policies, processes and technologies that generate a systematic approach to managing the critical information for building design and project data in digital format throughout the life cycle of a building” [14].
The U.S. National BIM Standard also defines BIM as
“A shared knowledge resource for information about a facility forming a reliable basis for decisions during its life-cycle; defined as existing from earliest conception to demolition” [15].
Most importantly in the use of BIM technologies for construction projects is to have reliable information at any construction project implementation stage and to make correct decisions [16].
There are different dimensions in BIM which are used in construction projects according to the complexity and requirements of such projects. The dimensions in BIM are known as 3D, 4D, 5D, 6D and 7D [17]. The third dimension of BIM (3D) represents the three geographical dimensions of a structure, commonly known as x, y, and z, which stand for length, width, and height of a structure, respectively [13,17,18,19]. The fourth dimension of BIM (4D) adds time and scheduling to the 3D BIM by simulating the construction process, which enables the project to be visualized at any point in time [19]. The fifth dimension of BIM (5D) integrates the 4D BIM and the project costs. This way, changes of the economic situation of a project can be observed at any phase of the construction project, which is a valuable feature, especially for an estimation of the initial budget forecast [20] and for the management of actual expenses. The sixth dimension of BIM (6D) considers sustainability, and more specifically energy, by estimating energy consumption in all phases of the project. The last dimension (7D) adds a facility management feature for a structure including its status, technical specifications, warranty information, and maintenance/operation manuals for owners and managers [17].
Using BIM technologies in construction has numerous positive effects [21]. For example, probable construction clashes can be identified and prevented using the model [22]. According to other studies, the overall performance of a project and project information management can be improved dramatically by using BIM besides other strategic innovations [23,24]. Non-value adding activities and their resulting wastes can be investigated in BIM-based project delivery [25]. The impact of various factors on delays can also be analyzed using BIM [26]. It is necessary to emphasize, that the use of BIM technologies is not limited with the construction of new buildings but can also be used in the reconstruction of heritage buildings. There are different ways of using BIM, and this effective support is not limited to the 3D modelling, but also uses photogrammetry, 3D scanning and other tools for existing buildings [27].
Lu et al. (2018) illustrated that construction errors on site can be decreased by sharing design information with site workers [28]. Decreasing the causes of rework, including design errors and defects, has been an aim for many researchers. For instance, Kwon et al. (2014) explored a defective management system by integrating BIM, image-machining and augmented reality to automatically identify and omit defects [29]. Moreover, according to different research, defect data were proposed to be shared using a BIM-integrated network [30]. Bryde et al. (2013) investigated the advantages and disadvantages of BIM use in projects and concluded that the advantages of using BIM are much greater in comparison to its drawbacks, challenges, and limitations [16,31]. However, the direct use of BIM technologies in reducing rework needs more investigation.
This paper aimed to reduce rework in the construction projects from the perspective of time using Building Information Modelling (BIM). As mentioned in the previous paragraphs, most of the research focuses on investigating the effect of BIM technologies on reducing rework. Thus, the consequences of using BIM technologies in a projects’ schedule is considered as a gap in the body of knowledge. The novelty of this paper is that time effects of reworks are specifically investigated by using BIM technologies. A Step-wise Weight Assessment Ratio Analysis (SWARA) method was employed to weigh and rank the identified rework factors. Autodesk Revit software and Autodesk Navisworks software were used as the BIM tools in order to evaluate the benefits of using BIM in comparison to the traditional method, using the most important identified rework causes that are able to be simulated in BIM. Status-Curves (S-Curves) and an Earned Value Management (EVM) system were also used to calculate factors which illustrated the improvement of using BIM technologies. The findings of this study will illustrate the benefits of combining one of the decision-making tools, the SWARA method, with BIM technologies in order to identify and decrease reworks, and consequently their effects on the construction industry projects, and to ultimately enhance projects’ sustainability.

2. Research Methodology

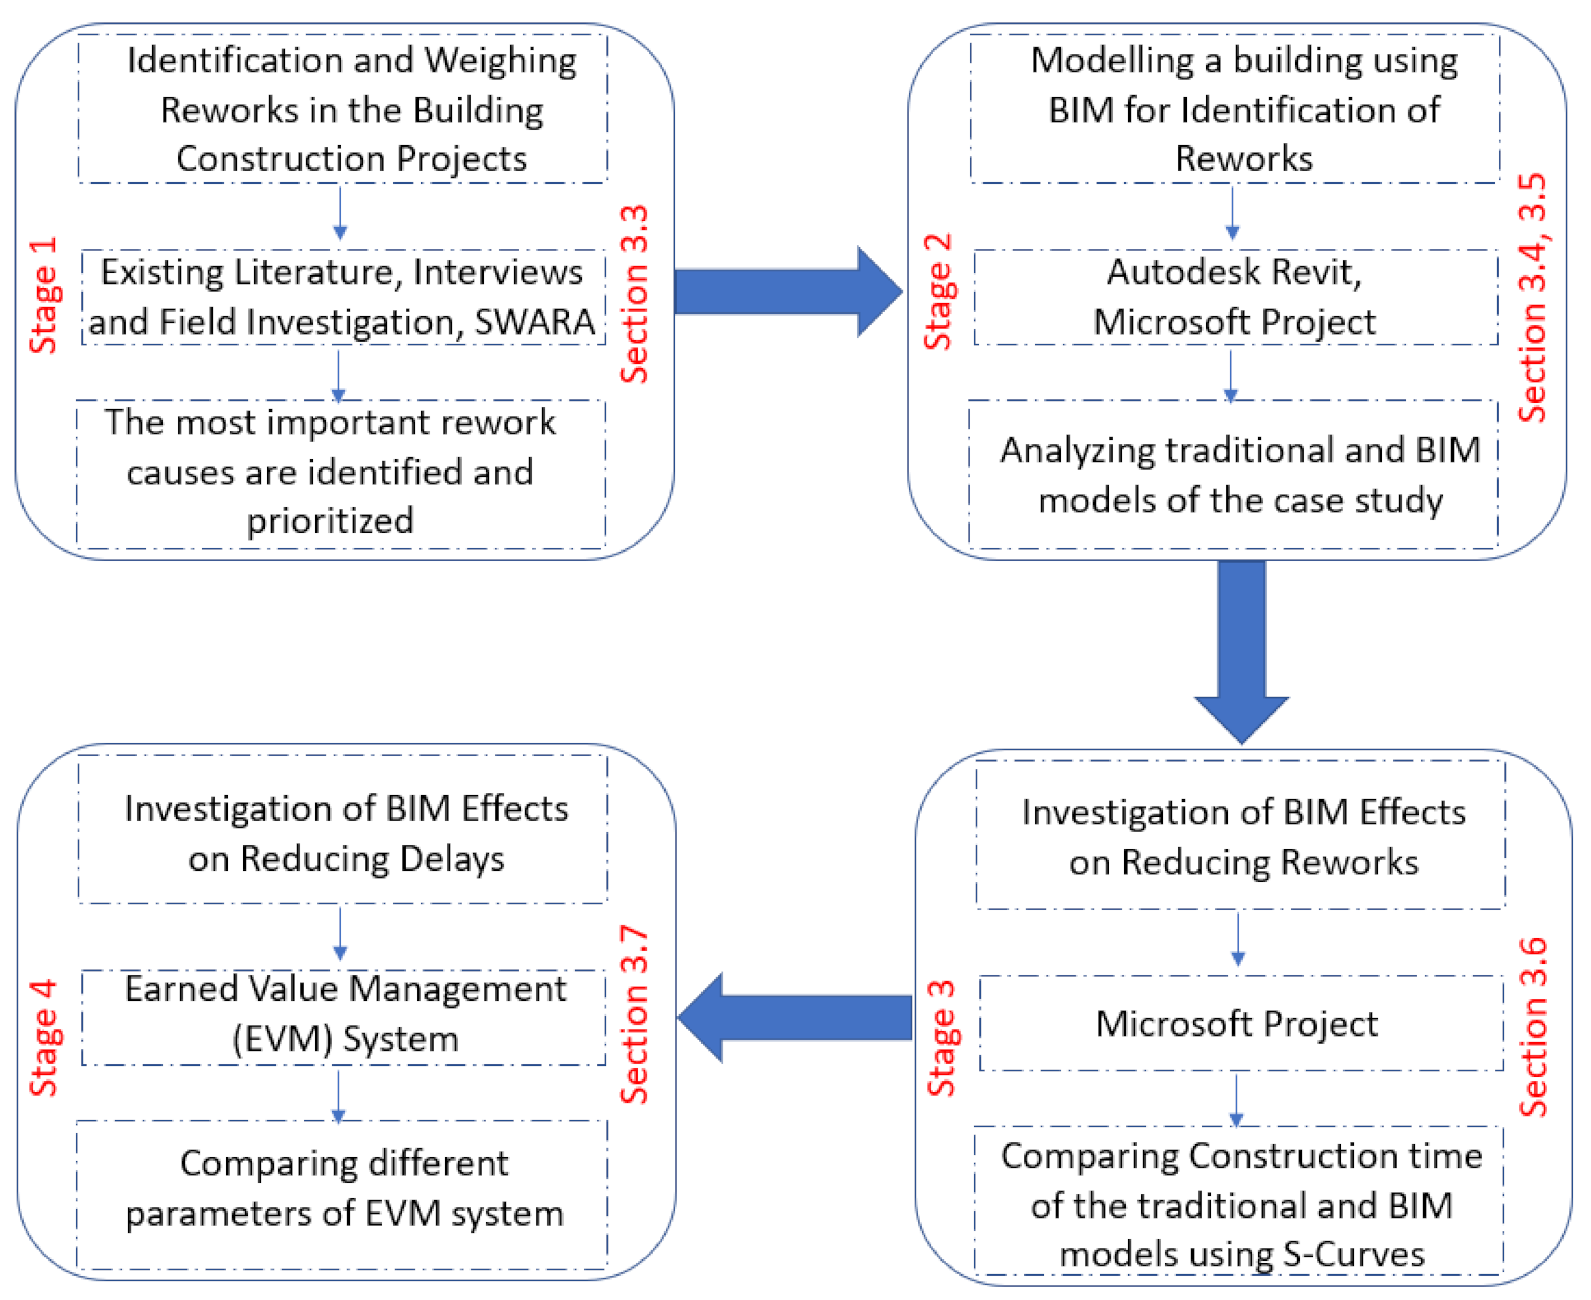
At first, rework causes in building construction projects were identified using literature including books, papers, documents, and online databases, as well as asking expert’s opinions and also conducting field investigations. In this process, factors which had the most effect on increasing the projects’ time (fourth dimension) were identified and ranked by the SWARA method. These causes were then illustrated on a fishbone diagram.
In the second stage, a building was selected as a case study and analyzed in terms of construction time using two different scenarios. The first scenario analyzed the construction process using the traditional system. On the other hand, the second scenario analyzed the abovementioned process according to BIM, in which clashes and therefore reworks could be diagnosed and managed at the beginning of the project.
In the next stage, the effects of utilizing BIM technologies on reducing reworks were investigated by comparing the two abovementioned scenarios in the previous stage. To do so, construction times of both scenarios were analyzed using S-Curves in Microsoft Project Software, and the effects of using BIM on reducing delays in the construction time were investigated.
Finally, the last stage focused on analyzing the benefits of using BIM technologies on reducing delays in the construction project by using the EVM system. These stages are demonstrated in Figure 1.

2.1. Questionnaire

In the current study, a questionnaire was designed to weigh and rank rework causes. Designing the abovementioned questionnaire was conducted carefully, and experts played a significant role in making the final version. The final questionnaire included three sections. In the first section, there were some questions regarding general information such as occupational experience. In the second section, respondents were asked to weigh rework causes by considering the identified selection criteria. To attain this goal, a 5-point Likert scale was used in which 1 was the least importance, while 5 was defined as the most importance. Lastly, in the third part of the questionnaire, respondents were asked to mention any other rework causes or points about the topic. The information gained by this questionnaire was then analyzed by the SWARA method.
Cronbach’s alpha is a coefficient calculated to check internal consistency. Therefore, it was a suitable coefficient to illustrate the reliability of the questionnaires. Cronbach’s alpha values range from 0 to 1, where 0 means that all items are independent, while 1 means that items are perfectly correlated [32]. In this range, in terms of reliability, values above 0.9, 0.8, 0.7, 0.6, 0.5 are considered excellent, good, acceptable, questionable, and poor, respectively. Therefore, values below 0.5 are regarded as unacceptable [33,34]. There are two ways to calculate Cronbach’s alpha. It can be calculated manually, according to the formula below [32]:
α = j j 1 ( 1 S j 2 S 2 )
where the number of items, variance of the j t h criteria and variance of the total score are shown by j, S j 2 and S 2 , respectively. The second way to calculate Cronbach’s alpha is by using software programs such as SPSS. Due to the complexity and difficulty of manual calculations, this way is usually preferred. In this study, Cronbach’s alpha was computed using SPSS software.

2.2. SWARA (Step-Wise Weight Assessment Ratio Analysis) Method

Various Multi-Criteria Decision Making (MCDM) methods can be used in different cases, for example, they can be used for efficient application based on sustainability assessment tool efficiency, cost analysis and renewable energy evaluation [35,36]. Keršuliene et al. introduced the SWARA method in 2010 [37], and, in comparison to the other MCDM methods, SWARA is easier to employ in decision-making problems due to its understandable concept and analysis procedure [38].
The SWARA method is usually used for weighing decision criteria, which are the basis of assessing and prioritizing various alternatives [36]. To do so, knowledge, experience and opinions of experts are considered [39]. SWARA has been used in different topics by numerous researchers. For instance, the SWARA method was selected in an Iranian study to assess selection criteria for choosing the best passive energy reduction measures in Iran [40]. Balki et al. (2020) determined optimal operating parameters in Turkey and criteria were weighed using the SWARA method [38]. Rani et al. (2020) provided Solar Panel Selection [41], while Jafarzadeh Ghoushchi et al. (2020) ranked failures in Solar Panel Systems using the abovementioned method [42]. Akcan et al. (2019) aimed to reduce ecological risk factors by evaluating green suppliers and employed the SWARA method as a part of this evaluation [43]. Zarbakhshnia et al. (2018) evaluated and selected sustainable reverse logistic providers and used the abovementioned method in their analysis [44]. Chalekaee et al. (2019) applied SWARA when analyzing construction delay change response problems [45]. Morkunaite et al. (2019) evaluated the significance of criteria in contractor selections for the refurbishment of heritage buildings [46]. There is a lot more research which has utilized the SWARA method [47,48,49,50,51,52,53,54,55,56,57,58].
In this study, SWARA was used to weigh rework causes using the questionnaire. The procedure of using the SWARA method is illustrated below:
  • Selection criteria are identified and considered.
  • The abovementioned criteria are prioritized using experts’ attitudes and then they are sorted from the most important to the least important.
  • Each criterion is compared to the upper criteria and the comparative average value of importance, s j , is calculated.
  • Comparative importance ( k j ) is computed as follows:
    k j =   1                                       j = 1 s j + 1                     j > 1
  • Recalculated weights ( q j ) are obtained using the formula below:
    q j = 1                                       j = 1 q j 1 k j                     j > 1
  • Final weights ( w j ) are calculated as follows:
    w j = q j m = 1 n q m

2.3. Case Study

Shiraz is one of the cities in Fars province, Iran, which is located in the southwest of the country. It is surrounded by various mountains and has a temperate climate [59]. A building which is located in Shiraz was considered as a case study for this research. The building is a 4-story steel structure in the western section of Shiraz, with an infrastructure area of 1100 square meters.

2.4. Formation of the BIM Output

Three kinds of BIM software were used as the key tools of this study. To model the case study building’s elements, Autodesk Revit software and Autodesk Navisworks software were used. Autodesk Navisworks software and Microsoft Project software were also applied in the time management section of the research. Details about the usage of BIM software are shown in Table 1.

2.4.1. Modelling the Architectural and Structural Information of the Building

Architectural and installation information of the building was modelled as follows:
  • Step 1: Introducing the number of stories, as well as the height of each story according to the architectural plans.
  • Step 2: Introducing and modelling the major elements of the building such as walls, roofs, and stairs.
  • Step 3: Introducing and modelling the minor elements of the building such as doors and windows.
  • Step 4: Adding supplementary details of the building such as stepped ceilings and parapets.
  • Step 5: Modelling the building’s risers and ducts, where installation components are located.
  • Structural information of the building was modelled as follows:
  • Step 1: Introducing the number of stories, as well as the height of each story according to the structural plans.
  • Step 2: Introducing and modelling the major elements of the building such as the foundation, columns, and beams.
  • Step 3: Modelling lateral bracing system.
  • Step 4: Introducing and adding roofs and diaphragms.
  • Step 5: Adding supplementary details such as roofs and connections.

2.4.2. Integrating and Simulating the Construction Process

In this study, Autodesk Revit was used in different parts. Autodesk provides the ability to integrate between the three versions of Revit, including Revit Architecture, Revit Structure and Revit MEP (mechanical, electrical, and plumbing) [60].

2.5. Data Extraction of the Traditional and BIM Methods

2.5.1. Traditional Method

In this part of the study, the abovementioned building case study was considered. All the construction documents of the buildings were investigated carefully to obtain reworks and gain the total construction time of the project.

2.5.2. BIM Method

As mentioned in the previous section, all the elements of the building were modelled in the BIM tools. Thus, all the clashes and reworks were identified and prevented at the beginning. This way, a massive amount of time and budget was saved.

2.6. Investigating the Ability of BIM Tools in the Identification of Clashes and Reworks

2.6.1. Automatic Identification of Errors Within the Process of Modelling

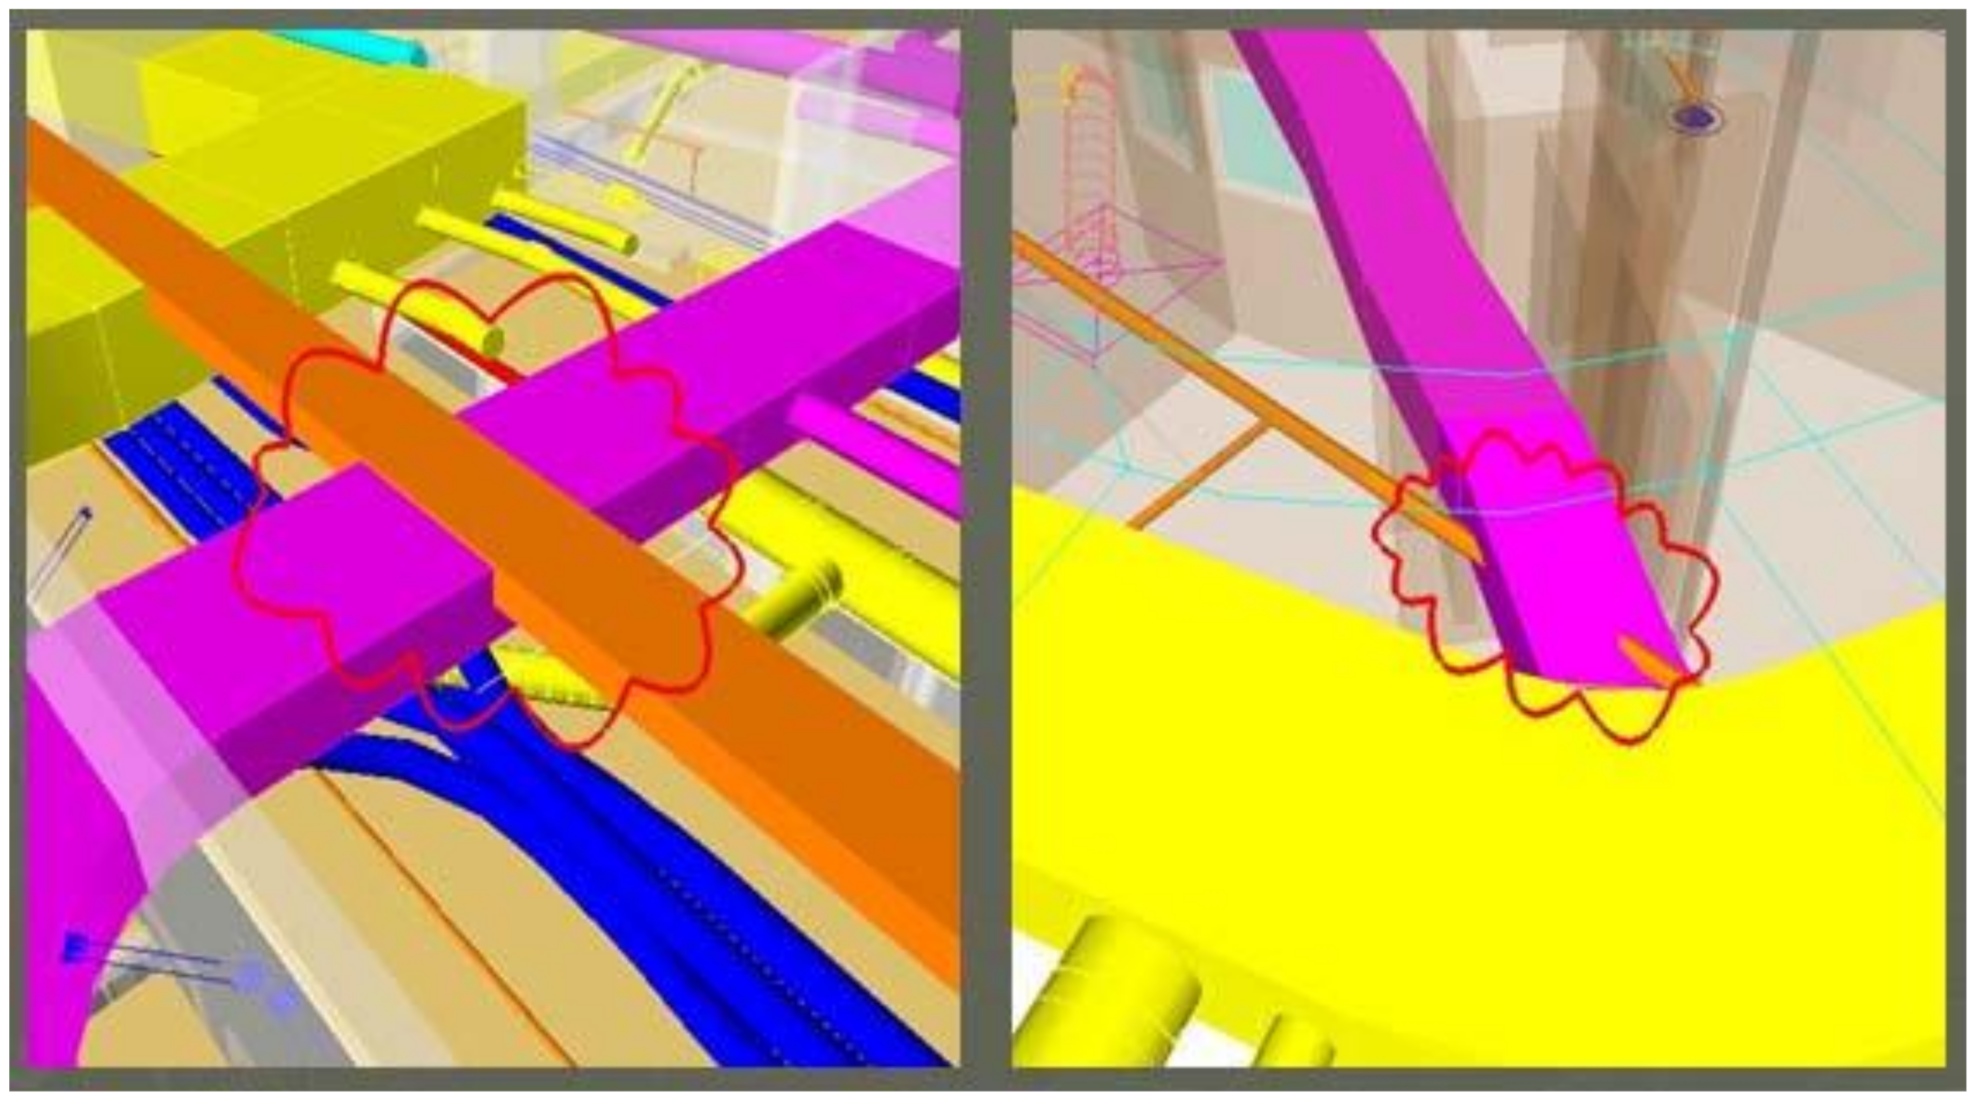
Using Autodesk Revit software, all the errors including clashes between architectural, structural and installation elements of the building were identified automatically, and a solution was given by the software. This feature gives engineers the ability to observe and prevent a large number of clashes and reworks at the initial level. Figure 2 illustrates one of the clashes that was identified by the software.

2.6.2. Identification of Errors after the Process of Modelling

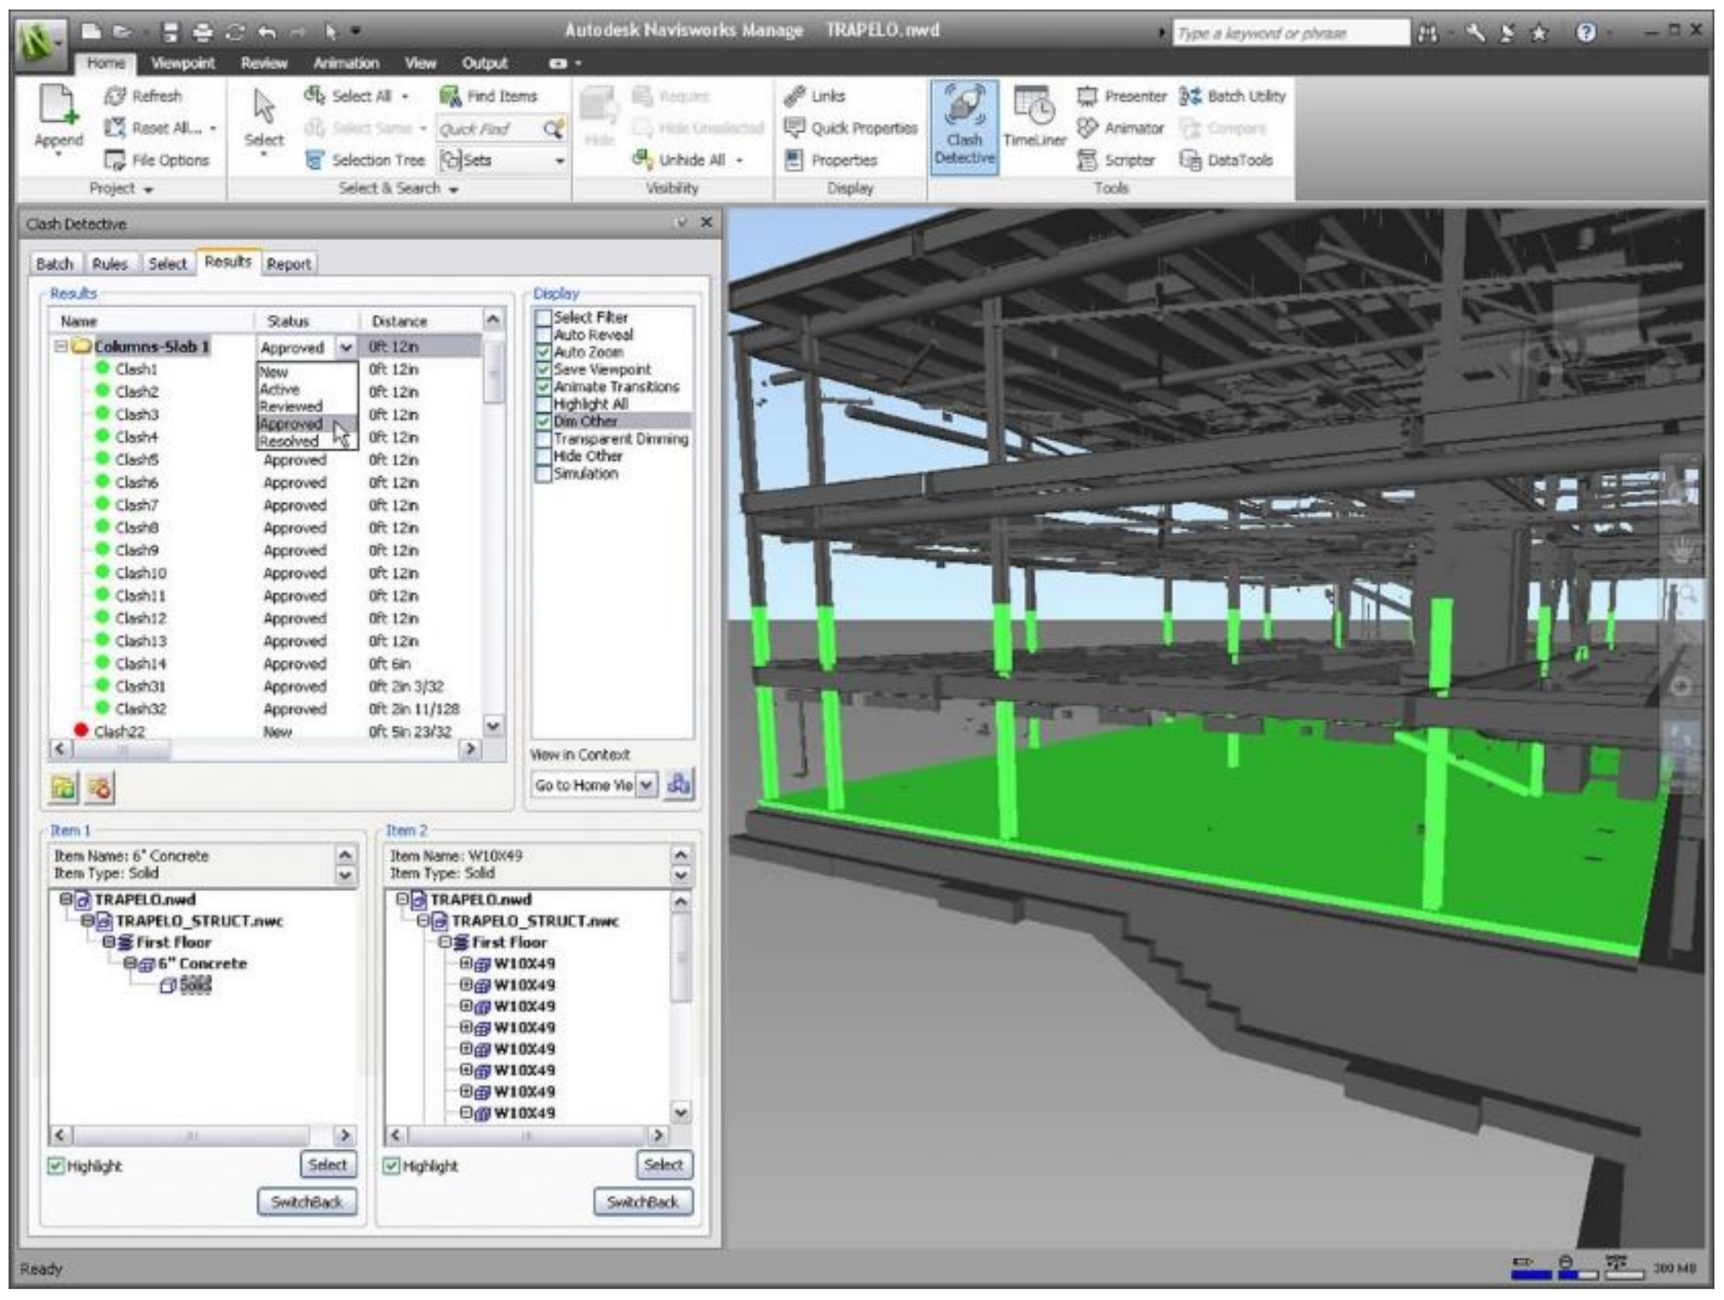
In this stage, BIM outputs and simulations were integrated, and all the clashes and errors were checked again using Autodesk Navisworks software. Data were imported directly from Autodesk Revit to Autodesk Navisworks. After this step, the probability of any clashes occurring during the construction process becomes almost zero. One of the identified clashes after the process of modelling is shown in Figure 3.

2.7. Earned Value Management (EVM)

The Earned Value Management (EVM) method is used to measure time, cost, and scope, for predicting the performance of projects [61,62]. The EVM method can consider the time passed as well as the cost, for calculating the value of work done [63]. In this stage, the aim was to observe the benefits of using BIM technologies in reducing delays in construction of the building. Thus, the procedure of this observation is illustrated as follows:
  • Calculating the Schedule Variance (SV) as follows:
    S V = E V P V
    where EV and PV stand for Earned Value (budgeted cost of work performed) and Actual Cost (actual cost of work performed), respectively.
  • Calculation of Schedule Performance Index (SPI):
    S P I = E V / P V

3. Results and Discussion

3.1. Analyzing the Sample Size

135 experts who have been involved in various sectors of the construction industry, including both private and governmental sectors, were the selected sample size of this study. In order to identify a sufficient number of respondents, Cochran’s sample size formula was used. This formula is shown below [64]:
n = N t 2 p q N d 2 + t 2 p q
where n, N, t, p, q and d stand for the sample size, population, confidence level value, probability of success, probability of failure and acceptable margin of error, respectively. In order to gain the required number of respondents, N, t, p, q and d were considered to be 135, 1.96, 0.5, 0.5 and 0.05, respectively. Therefore, n was computed as follows:
= 135 1.96 2 0.5 0.5 135 0.05 2 + 1.96 2 0.5 0.5 = 99.89 .  
Therefore, at least 100 respondents were needed to fill the questionnaire out. The abovementioned 135 questionnaires were distributed using the Internet (75 questionnaires) and postal system (60 questionnaires). 115 questionnaires were returned, which meant an 85.1% return rate: that was considered to be acceptable. Among the abovementioned returned questionnaires, six of them were unverified. Therefore, 109 questionnaires were analyzed which was more than required. Information regarding the questionnaires is shown in Table 2. Information about the experts who completed the verified questionnaires is illustrated in Table 3.

3.2. Reliability of the Questionnaires

To assess the reliability of the questionnaires, Cronbach’s alpha was calculated. Rework causes were categorized into seven groups according to their properties (Section 3.3). Thus, for each of the questionnaires, Cronbach’s alpha value was computed separately. This value was calculated in order to check the reliability of questionnaires, and ranges from 0 to 1, where 0 and 1 stand for complete independency and complete dependency, respectively [32]. These computed values are demonstrated in Table 4.

3.3. Identification and Prioritization of Rework Causes

The first step in this section was identifying rework causes. A comprehensive investigation took place in various literature resources. Then, experts were interviewed to add any other rework causes to the identified ones. Information regarding the experts is shown in Table 5. 42 of the identified causes were extracted from the literature [1,6] and the other factors were introduced by experts. Table 6 illustrates the final categorization of identified rework causes. Figure 4 also shows the abovementioned causes using a fishbone diagram. In the abovementioned figure, rework causes are separated into seven different groups including Engineering and Reviews (A), Implementation of Project (B), Material and Equipment Supply (C), Human Resource Capability (D), Construction Planning and Scheduling (E), Leadership and Communication (F), Effective External Causes (G). Each category also constitutes several subsections, which are illustrated in Figure 4.
After identifying the causes of rework, the next step focused on weighing the abovementioned causes. To do so, experts’ opinions were extracted using a questionnaire. In the questionnaire, experts were asked to score the importance of causes from 1 to 5, where 1 and 5 meant the least and most effective, respectively. Mean values of the questionnaires were calculated after the questionnaires were returned. Then, using the SWARA method, rework causes were weighed and ranked in their specific groups. As defined above, rework causes were categorized into seven groups. Table 7, Table 8, Table 9, Table 10, Table 11, Table 12 and Table 13 show the results of the SWARA method for each group. The most important rework causes are also demonstrated in Table 14.
As it is clearly illustrated, the most three crucial rework causes are Design Errors (A1), Design Changes (A5), and Difference among Plans and Operational Specifications (B3). By considering the identified rework causes, and specially the most important causes, they will be reduced effectively or even prevented. Therefore, it can be very useful for different parties of the building industry. Then, through BIM, these effects were analyzed for the case study building.

3.4. Investigating the Traditional Method of the Case Study Building’s Construction

As it was mentioned in the previous part of the paper, the case study of this project was a 4-story steel building located in the western section of Shiraz, Iran. Initial documents of the project’s schedule were investigated carefully to find the predicted construction time. Using a Work Breakdown Structure (WBS), the project was divided into 25 levels, and the planned construction time was 348 days. However, after investigating the final documents of project, it was shown that the project had experienced a 176 days delay, and the project was finished after 524 days. Table 15 illustrates the project’s WBS, anticipated, and implemented construction time.

3.5. Investigating BIM Output of the Case Study Building’s Construction

In this stage, BIM was generated using the initial documents of the project, including the most important identified rework causes. Thus, many of the errors and rework causes could have been found and their effects could have been diminished. Various errors were identified during the modelling and a summary of the errors is illustrated in Table 16.

3.6. Investigation and Comparison of Delays between Traditional and BIM Assessments

In this stage, cumulative working times of the project were calculated and S-Curves (Status-Curves) of the project’s anticipated, actual and BIM output were drawn using Microsoft Project software. S-Curves showed that the project’s anticipated, actual and BIM cumulative working times were 4336, 6936 and 6617 h, respectively. Results show that the project’s cumulative working time would have been reduced by 319 h (4.6%) using BIM technologies, which is regarded as a valuable step in reducing projects’ delays. It is necessary to mention that some delay and rework causes were not able to be modelled, such as political sanctions or geographical hazards, as they are not predictable. Figure 5 illustrates the S-Curves of the three abovementioned error circumstances. According to Figure 5, BIM would have reduced the actual time by 319 h, which could be regarded as a great improvement. Therefore, if BIM was used, the project would have been finished in 6617 h as opposed to 6936 h.

3.7. Analyzing Time Using the Earned Value Management (EVM) System

To analyze the earned values and the status changes of this study, the parameters SPI and SV for the actual implementation and BIM output were calculated and are presented in Table 17. As can be seen, the computed values are still different from the actual values of the case study, although the results show the advantages of using BIM in a case study model. Moreover, a reduction in the SV value proves that using BIM would be successful.

4. Conclusions

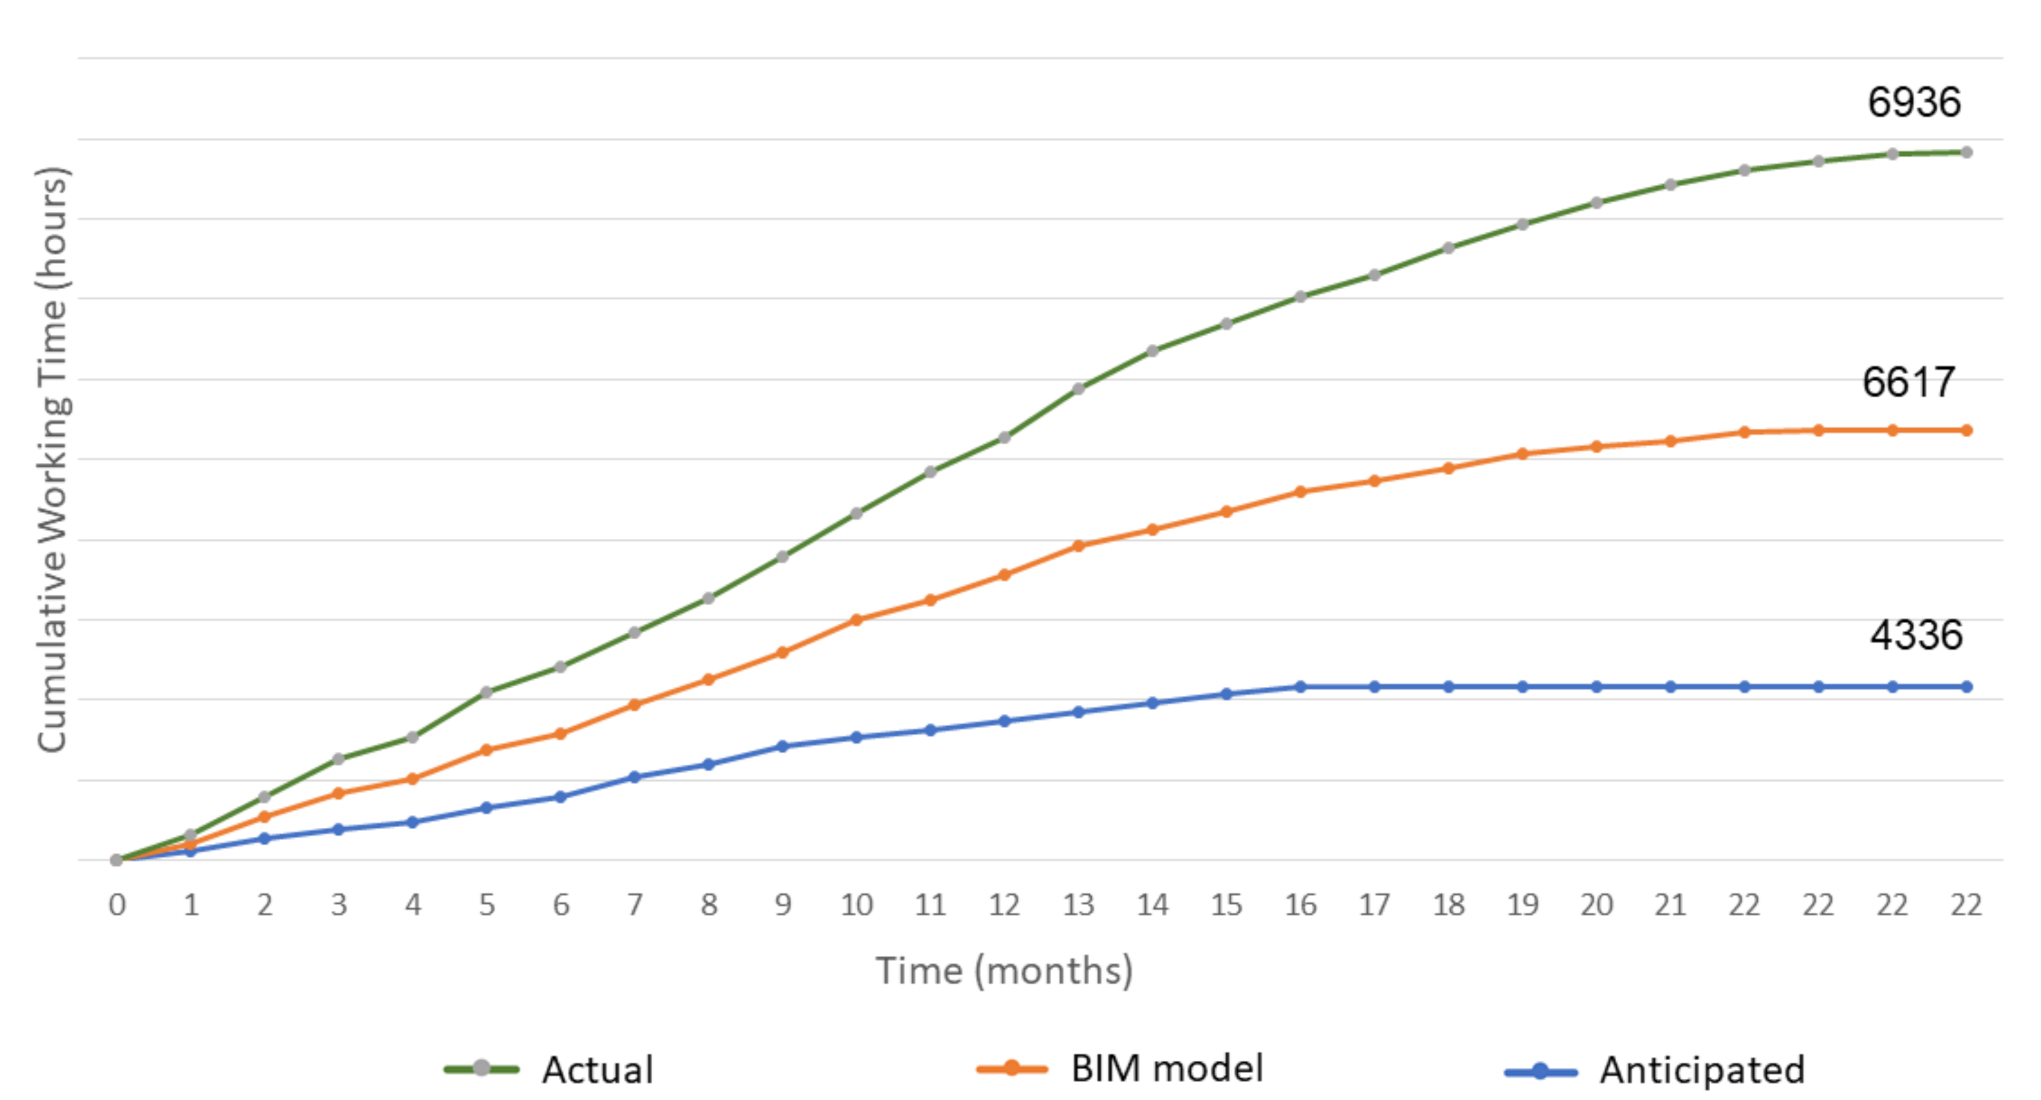
This study was conducted to identify rework causes in building construction projects and to analyze the benefits of using BIM technologies to process and predict them. Firstly, 49 rework causes were identified and categorized into seven groups including “Engineering and Reviews”, “Implementation of Project”, “Material and Equipment Supply”, “Human Resource Capability”, “Construction Planning and Scheduling”, “Leadership and Communication” and “Effective External Causes”. Then, the SWARA method was employed to weigh and rank the abovementioned rework causes into their own groups. Results showed that the most important causes in the abovementioned groups were “Design Errors (A1)”, “Difference among Plans and Operational Specifications (B3)”, “Non-compliance with Specifications (C1)”, “Insufficient Skill Level (D1)”, “Unrealistic Schedules (E1)”, “Poor Communication (F4)” and “Economic Fluctuations (G2)”. This was followed by Building Information Modelling for the selected case study using BIM software. In the next stage, anticipated, actual and BIM cumulative working times were calculated and illustrated using S-Curves. It was shown that BIM resulted in a 4.6% decrease in the working time. Finally, an EVM system was utilized to compute the positive effect of BIM technologies, and showed a 0.06 increase in the SPI value. The obtained results of this study could be very useful for different parties in the building industry who live in similar climatic and economic conditions. This study’s method could be valuable for future studies, and could be very effective in other research as well. One of the limitations of this study was that only residential buildings were investigated. Although these results are highly beneficial for the residential construction sector, it is suggested that other types of buildings should be investigated in further studies. Prospective future researchers are suggested to investigate other dimensions of BIM, such as time. The authors suggest using BIM technologies at any stage of the construction project life cycle, for both new or refurbished buildings, and also recommend its benefits for sustainable construction.

Author Contributions

H.K.: Methodology, Software, Investigation; A.B.: Conceptualization, Methodology, Software, Investigation, Writing—Original draft; A.V.: Methodology, Visualization, Validation, Investigation, Writing—Reviewing and Editing, Supervision; J.A.: Writing-Reviewing and Editing, Supervision; D.M.: Investigation, Writing—Reviewing and Editing, V.Z.: Investigation, Writing—Reviewing and Editing. All authors have read and agreed to the published version of the manuscript.

Funding

This research received no external funding.

Conflicts of Interest

The authors declare no conflict of interest. The funders had no role in the design of the study; in the collection, analyses, or interpretation of data; in the writing of the manuscript; or in the decision to publish the results.

Abbreviations

AbbreviationMeaning
BIMBuilding Information Modelling
SWARAStep-wise Weight Assessment Ratio Analysis
EVMEarned Value Management
SPISchedule Performance Index
S-CurveStatus-Curve
MCDMMulti-Criteria Decision Making
WBSWork Breakdown Structure
SVScheduled Variance

References

  1. Hwang, B.-G.; Thomas, S.R.; Haas, C.T.; Caldas, C.H. Measuring the impact of rework on construction cost performance. J. Constr. Eng. Manag. 2009, 135, 187–198. [Google Scholar] [CrossRef]
  2. Ye, G.; Jin, Z.; Xia, B.; Skitmore, M. Analyzing causes for reworks in construction projects in China. J. Manag. Eng. 2015, 31, 040140972015. [Google Scholar] [CrossRef]
  3. Love, P.E.; Irani, Z.; Edwards, D.J. A rework reduction model for construction projects. IEEE Trans. Eng. Manag. 2004, 51, 426–440. [Google Scholar] [CrossRef] [Green Version]
  4. Burati, J.L., Jr.; Farrington, J.J.; Ledbetter, W.B. Causes of quality deviations in design and construction. J. Constr. Eng. Manag. 1992, 118, 34–49. [Google Scholar] [CrossRef]
  5. Barber, P.; Graves, A.; Hall, M.; Sheath, D.; Tomkins, C. Quality failure costs in civil engineering projects. Int. J. Qual. Reliab. Manag. 2000, 17, 479–492. [Google Scholar] [CrossRef]
  6. Fayek, A.R.; Dissanayake, M.; Campero, O.; Construction Owners Association of Alberta (COAA). Measuring and classifying construction field rework: A pilot study. Res. Rep. 2003. Available online: https://www.coaa.ab.ca/ (accessed on 22 July 2020).
  7. Josephson, P.-E.; Larsson, B.; Li, H. Illustrative benchmarking rework and rework costs in Swedish construction industry. J. Manag. Eng. 2002, 18, 76–83. [Google Scholar] [CrossRef]
  8. Mastenbroek, Y. Reducing Rework Costs in Construction Projects. Bachelor’s Thesis, University of Twente, Enschede, The Netherlands, 2010. [Google Scholar]
  9. Palaneeswaran, E.; Love, P.E.; Kumaraswamy, M.M.; Ng, T.S. Mapping rework causes and effects using artificial neural networks. Build. Res. Inf. 2008, 36, 450–465. [Google Scholar] [CrossRef]
  10. Love, P.E.; Edwards, D.J.; Watson, H.; Davis, P. Rework in civil infrastructure projects: Determination of cost predictors. J. Constr. Eng. Manag. 2010, 136, 275–282. [Google Scholar] [CrossRef]
  11. Love, P.E. Influence of project type and procurement method on rework costs in building construction projects. J. Constr. Eng. Manag. 2002, 128, 18–29. [Google Scholar] [CrossRef] [Green Version]
  12. Forcada, N.; Gangolells, M.; Casals, M.; Macarulla, M. Factors affecting rework costs in construction. J. Constr. Eng. Manag. 2017, 143, 040170322017. [Google Scholar] [CrossRef] [Green Version]
  13. Migilinskas, D.; Ustinovičius, L. Methodology of risk and uncertainty management in construction’s technological and economical problems. In Proceedings of the 25th International Symposium on Automation and Robotics in Construction, Vilnius, Lithuania, 26–29 June 2008; pp. 789–795. [Google Scholar]
  14. Penttilä, H. Describing the changes in architectural information technology to understand design complexity and free-form architectural expression. J. Inf. Technol. Constr. 2006, 11, 395–408. [Google Scholar]
  15. National Institute of Building Science. National BIM Standard-United States. Available online: https://www.nationalbimstandard.org/faqs#faq1 (accessed on 3 January 2020).
  16. Pavlovskis, M.; Antucheviciene, J.; Migilinskas, D. Assessment of buildings redevelopment possibilities using MCDM and BIM techniques. Procedia Eng. 2017, 172, 846–850. [Google Scholar] [CrossRef]
  17. United BIM. What are BIM Dimensions. Available online: https://www.united-bim.com/what-are-bim-dimensions-3d-4d-5d-6d-7d-bim-explained-definition-benefits/ (accessed on 28 May 2020).
  18. Tarar, M.; Dang, D.T.P. Impact of 4D Modeling on Construction Planning Process. Master’s Thesis, Chalmers University of Technology, Göteborg, Sweden, 2012. [Google Scholar]
  19. Eastman, C.M.; Eastman, C.; Teicholz, P.; Sacks, R.; Liston, K. BIM Handbook: A Guide to Building Information Modeling for Owners, Managers, Designers, Engineers and Contractors; John Wiley & Sons: Hoboken, NJ, USA, 2011. [Google Scholar]
  20. Kymmell, W. Building Information Modeling: Planning and Managing Construction Projects with 4D CAD and Simulations; The McGraw-Hill Companies, Inc.: New York, NY, USA, 2008. [Google Scholar]
  21. Ham, N.; Moon, S.; Kim, J.-H.; Kim, J.-J. Economic analysis of design errors in BIM-based high-rise construction projects: Case study of Haeundae L project. J. Constr. Eng. Manag. 2018, 144, 05018006. [Google Scholar] [CrossRef]
  22. Chau, K.; Anson, M.; Zhang, J. Four-dimensional visualization of construction scheduling and site utilization. J. Constr. Eng. Manag. 2004, 130, 598–606. [Google Scholar] [CrossRef] [Green Version]
  23. Love, P.E.; Edwards, D.J.; Han, S.; Goh, Y.M. Design error reduction: Toward the effective utilization of building information modeling. Res. Eng. Des. 2011, 22, 173–187. [Google Scholar] [CrossRef]
  24. Olawumi, T.O.; Chan, D.W. Building information modelling and project information management framework for construction projects. J. Civ. Eng. Manag. 2019, 25, 53–75. [Google Scholar] [CrossRef] [Green Version]
  25. Liao, L.; Teo, E.A.L.; Chang, R.; Li, L. Investigating critical non-value adding activities and their resulting wastes in BIM-based project delivery. Sustainability 2020, 12, 355. [Google Scholar] [CrossRef] [Green Version]
  26. Jang, S.; Lee, G. Impact of organizational factors on delays in BIM-based coordination from a decision-making view: A case study. J. Civ. Eng. Manag. 2018, 24, 19–30. [Google Scholar] [CrossRef] [Green Version]
  27. Pavlovskis, M.; Migilinskas, D.; Antucheviciene, J.; Kutut, V. Ranking of heritage building conversion alternatives by applying BIM and MCDM: A case of Sapieha Palace in Vilnius. Symmetry 2019, 11, 973. [Google Scholar] [CrossRef] [Green Version]
  28. Lu, Q.; Chen, L.; Lee, S.; Zhao, X. Activity theory-based analysis of BIM implementation in building O&M and first response. Autom. Constr. 2018, 85, 317–332. [Google Scholar]
  29. Kwon, O.-S.; Park, C.-S.; Lim, C.-R. A defect management system for reinforced concrete work utilizing BIM, image-matching and augmented reality. Autom. Constr. 2014, 46, 74–81. [Google Scholar] [CrossRef]
  30. Lee, D.-Y.; Chi, H.-l.; Wang, J.; Wang, X.; Park, C.-S. A linked data system framework for sharing construction defect information using ontologies and BIM environments. Autom. Constr. 2016, 68, 102–113. [Google Scholar] [CrossRef]
  31. Bryde, D.; Broquetas, M.; Volm, J.M. The project benefits of building information modelling (BIM). Int. J. Proj. Manag. 2013, 31, 971–980. [Google Scholar] [CrossRef]
  32. Bland, J.M.; Altman, D.G. Statistics notes: Cronbach’s alpha. BMJ 1997, 314, 572. [Google Scholar] [CrossRef] [Green Version]
  33. George, D. SPSS for Windows Step by Step: A Simple Study Guide and Reference, 17th ed.; Pearson Education India: New Delhi, India, 2011. [Google Scholar]
  34. Balali, A.; Valipour, A. Identification and selection of building façade’s smart materials according to sustainable development goals. Sustain. Mater. Technol. 2020, 26, e00213. [Google Scholar]
  35. Vilutienė, T.; Migilinskas, D.; Bružas, A. Holistic approach to assess the sustainability and utility of refurbishment measures. Procedia Eng. 2015, 122, 137–142. [Google Scholar] [CrossRef] [Green Version]
  36. Ghenai, C.; Albawab, M.; Bettayeb, M. Sustainability indicators for renewable energy systems using multi-criteria decision-making model and extended SWARA/ARAS hybrid method. Renew. Energy 2020, 146, 580–597. [Google Scholar] [CrossRef]
  37. Keršuliene, V.; Zavadskas, E.K.; Turskis, Z. Selection of rational dispute resolution method by applying new step-wise weight assessment ratio analysis (SWARA). J. Bus. Econ. Manag. 2010, 11, 243–258. [Google Scholar] [CrossRef]
  38. Mardani, A.; Nilashi, M.; Zakuan, N.; Loganathan, N.; Soheilirad, S.; Saman, M.Z.M.; Ibrahim, O. A systematic review and meta-analysis of SWARA and WASPAS methods: Theory and applications with recent fuzzy developments. Appl. Soft Comput. 2017, 57, 265–292. [Google Scholar] [CrossRef] [Green Version]
  39. Balki, M.K.; Erdoğan, S.; Aydın, S.; Sayin, C. The optimization of engine operating parameters via SWARA and ARAS hybrid method in a small SI engine using alternative fuels. J. Clean. Prod. 2020, 258, 120685. [Google Scholar]
  40. Balali, A.; Hakimelahi, A.; Valipour, A. Identification and prioritization of passive energy consumption optimization measures in the building industry: An Iranian case study. J. Build. Eng. 2020, 30, 101239. [Google Scholar] [CrossRef]
  41. Rani, P.; Mishra, A.R.; Mardani, A.; Cavallaro, F.; Štreimikienė, D.; Khan, S.A.R. Pythagorean Fuzzy SWARA–VIKOR Framework for Performance Evaluation of Solar Panel Selection. Sustainability 2020, 12, 4278. [Google Scholar]
  42. Jafarzadeh Ghoushchi, S.; Ab Rahman, M.N.; Raeisi, D.; Osgooei, E.; Jafarzadeh Ghoushji, M. Integrated Decision-Making Approach Based on SWARA and GRA Methods for the Prioritization of Failures in Solar Panel Systems under Z-Information. Symmetry 2020, 12, 310. [Google Scholar] [CrossRef] [Green Version]
  43. Akcan, S.; Taş, M.A. Green supplier evaluation with SWARA-TOPSIS integrated method to reduce ecological risk factors. Environ. Monit. Assess. 2019, 191, 736. [Google Scholar] [CrossRef]
  44. Zarbakhshnia, N.; Soleimani, H.; Ghaderi, H. Sustainable third-party reverse logistics provider evaluation and selection using fuzzy SWARA and developed fuzzy COPRAS in the presence of risk criteria. Appl. Soft Comput. 2018, 65, 307–319. [Google Scholar]
  45. Chalekaee, A.; Turskis, Z.; Khanzadi, M.; Ghodrati Amiri, G.; Keršulienė, V. A new hybrid MCDM model with grey numbers for the construction delay change response problem. Sustainability 2019, 11, 776. [Google Scholar] [CrossRef] [Green Version]
  46. Morkunaite, Z.; Bausys, R.; Zavadskas, E.K. Contractor Selection for Sgraffito Decoration of Cultural Heritage Buildings Using the WASPAS-SVNS Method. Sustainability 2019, 11, 6444. [Google Scholar] [CrossRef] [Green Version]
  47. Akhanova, G.; Nadeem, A.; Kim, J.R.; Azhar, S. A multi-criteria decision-making framework for building sustainability assessment in Kazakhstan. Sustain. Cities Soc. 2020, 52, 101842. [Google Scholar] [CrossRef]
  48. Prajapati, H.; Kant, R.; Shankar, R. Prioritizing the solutions of reverse logistics implementation to mitigate its barriers: A hybrid modified SWARA and WASPAS approach. J. Clean. Prod. 2019, 240, 118219. [Google Scholar] [CrossRef]
  49. Valipour, A.; Yahaya, N.; Md Noor, N.; Antuchevičienė, J.; Tamošaitienė, J. Hybrid SWARA-COPRAS method for risk assessment in deep foundation excavation project: An Iranian case study. J. Civ. Eng. Manag. 2017, 23, 524–532. [Google Scholar] [CrossRef] [Green Version]
  50. Maghsoodi, A.I.; Maghsoodi, A.I.; Poursoltan, P.; Antucheviciene, J.; Turskis, Z. Dam construction material selection by implementing the integrated SWARA–CODAS approach with target-based attributes. Arch. Civ. Mech. Eng. 2019, 19, 1194–1210. [Google Scholar] [CrossRef]
  51. Jaber, A.Z. Assessment Risk in Construction Projects in Iraq Using COPRAS-SWARA Combined Method. J. Southwest Jiaotong Univ. 2019, 54. [Google Scholar] [CrossRef]
  52. Alimardani, M.; Hashemkhani Zolfani, S.; Aghdaie, M.H.; Tamošaitienė, J. A novel hybrid SWARA and VIKOR methodology for supplier selection in an agile environment. Technol. Econ. Dev. Econ. 2013, 19, 533–548. [Google Scholar] [CrossRef]
  53. Keshavarz Ghorabaee, M.; Amiri, M.; Zavadskas, E.K.; Antucheviciene, J. A new hybrid fuzzy MCDM approach for evaluation of construction equipment with sustainability considerations. Arch. Civ. Mech. Eng. 2018, 18, 32–49. [Google Scholar] [CrossRef]
  54. Karabasevic, D.; Stanujkic, D.; Urosevic, S.; Maksimovic, M. Selection of candidates in the mining industry based on the application of the SWARA and the MULTIMOORA methods. Acta Montan. Slovaca 2015, 20, 116–124. [Google Scholar]
  55. Hashemkhani Zolfani, S.; Pourhossein, M.; Yazdani, M.; Zavadskas, E.K. Evaluating construction projects of hotels based on environmental sustainability with MCDM framework. Alex. Eng. J. 2018, 57, 357–365. [Google Scholar] [CrossRef]
  56. Hashemkhani Zolfani, S.; Chatterjee, P. Comparative evaluation of sustainable design based on Step-wise Weight Assessment Ratio Analysis (SWARA) and best worst method (BWM) methods: A perspective on household furnishing materials. Symmetry 2019, 11, 74. [Google Scholar] [CrossRef] [Green Version]
  57. Valipour, A.; Yahaya, N.; Noor, N.M.; Valipour, I.; Tamošaitienė, J. A SWARA-COPRAS approach to the allocation of risk in water and sewerage public–private partnership projects in Malaysia. Int. J. Strateg. Prop. Manag. 2019, 23, 269–283. [Google Scholar] [CrossRef] [Green Version]
  58. Balali, A.; Moehler, R.C.; Valipour, A. Ranking cost overrun factors in the mega hospital construction projects using Delphi-SWARA method: An Iranian case study. Int. J. Constr. Manag. 2020, 1–9. [Google Scholar] [CrossRef]
  59. Mohebbi, M.R.; Jashni, A.K.; Dehghani, M.; Hadad, K. Short-Term Prediction of Carbon Monoxide Concentration Using Artificial Neural Network (NARX) Without Traffic Data: Case Study: Shiraz City. Iran. J. Sci. Technol. Trans. Civ. Eng. 2019, 43, 533–540. [Google Scholar] [CrossRef]
  60. Stine, D.J.; Hanson, J. Autodesk Revit 2019 Architectural Command Reference; SDC Publications: Mission, KS, USA, 2018. [Google Scholar]
  61. Koke, B.; Moehler, R.C. Earned Green Value Management for Project Management: A systematic review. J. Clean. Prod. 2019, 230, 180–197. [Google Scholar] [CrossRef]
  62. Bryde, D.; Unterhitzenberger, C.; Joby, R. Conditions of success for earned value analysis in projects. Int. J. Proj. Manag. 2018, 36, 474–484. [Google Scholar] [CrossRef]
  63. Fleming, Q.W.; Koppelman, J.M. What’s your project’s real price tag? Harv. Bus. Rev. 2003, 81, 20. [Google Scholar]
  64. Cochran, W.G. Sampling Techniques; John Wiley & Sons: Hoboken, NJ, USA, 2007. [Google Scholar]
Figure 1. Research methodology.
Sustainability 12 08927 g001
Figure 2. Automatic identification of errors within the modelling process.
Sustainability 12 08927 g002
Figure 3. Identification of errors after the modelling process.
Sustainability 12 08927 g003
Figure 4. Fishbone diagram of rework causes.
Sustainability 12 08927 g004
Figure 5. Status-Curves of the anticipated, actual and BIM cumulative working time.
Sustainability 12 08927 g005
Table 1. Building Information Modelling (BIM) software used in the process of modelling.
StageBIM Software
Initial idea modellingAutodesk Revit Architecture
Identifying the ability to build the ideaAutodesk Navisworks Manage
Modelling of the structureAutodesk Revit Structure
Modelling the electrical and mechanical installationAutodesk Revit MEP (Mechanical, Electrical, and Plumbing)
Identifying architectural and structural clashesAutodesk Navisworks Manage
Identifying the change of resultsAutodesk Revit Architecture and Structure
Identifying the construction scheduleAutodesk Navisworks Manage and Microsoft Project
Table 2. Questionnaires return rate.
QuestionnaireNumberPercentage
Total distributed135100%
Total Returned11585.1%
Unreturned2014.8%
Unverified returned64.4%
Verified returned10980.7%
Table 3. Information about the respondents.
ClassificationClassificationNumberPercentage
Working backgroundConstruction Engineer2926.6%
Technical director4339.4%
Project manager1211%
Installation engineer1513.8%
Employer109.2%
QualificationBachelor5045.9%
Master3633%
PhD2321.1%
Working ExperienceLess than 10 years2724.8%
Between 10 and 20 years3229.3%
More than 20 years5045.9%
Table 4. Values of Cronbach’s alpha.
QuestionnaireCategorization of Rework CausesNumber of Rework CausesCronbach’s Alpha
AEngineering and Reviews80.783
BImplementation of Project100.803
CMaterial and Equipment Supply60.776
DHuman Resource Capability80.803
EConstruction Planning and Scheduling40.735
FLeadership and Communication50.721
GEffective External Causes80.758
Table 5. Information regarding experts.
CategoryClassificationNumber
OccupationAcademia8
Manager9
Contractor8
Technical expert12
SexMale20
Female17
Experience
(years)
<57
5–109
10–1510
>1511
Table 6. Categorization of rework causes.
Categorization of Rework CausesRework CausesSign
Engineering and ReviewsDesign ErrorsA1
Scope ChangesA2
Late Design ChangesA3
Poor Document ControlA4
Design ChangesA5
Poor Supervision and ControlA6
Poor Knowledge of DesignerA7
Lack of Using Modern Design ToolsA8
Implementation of ProjectLack of Using Modern Implementation SystemsB1
Changes in Work VolumeB2
Difference among Plans and Operational SpecificationsB3
Incoherence of Structural ImplementationsB4
Unspecified Essential OperationsB5
Lack of Operational StandardsB6
Lack of Using Appropriate AppliancesB7
Lack of Supervision in Controlling QualityB8
Poor Experience of ContractorsB9
Poor Quality of ImplementationsB10
Material and Equipment SupplyNon-compliance with SpecificationsC1
Materials not in the Right Place When NeededC2
Untimely DeliveriesC3
Structural Non-complianceC4
Poor Quality of MaterialsC5
Lack of Suppliers’ Information Regarding the Status of ProjectC6
Human Resource CapabilityInsufficient Skill LevelD1
Lack of Knowledge in Occupational PlanningD2
Unclear Instructions to WorkersD3
Excessive OvertimeD4
Lack of Occupational SecurityD5
Inadequate Control of Human ResourceD6
Lack of Workers’ ResponsibilityD7
Inadequate Training of Human ResourceD8
Construction Planning and SchedulingUnrealistic SchedulesE1
Insufficient Turnover and Commissioning ResourcingE2
Late Designer InputE3
Constructability ProblemsE4
Leadership and CommunicationIneffective Management of Project TeamF1
Lack of OperationsF2
Lack of Safety and QA/QC CommitmentF3
Poor CommunicationF4
Poor Attendance of StakeholdersF5
Effective External CausesGovernmental Changes in LawG1
Economic FluctuationsG2
Social ContradictionsG3
High Cost of Modern TechnologiesG4
Lack of Stakeholders’ TrainingG5
Physical and Infrastructural CircumstancesG6
Geographical HazardsG7
Political Circumstances and SanctionsG8
Table 7. Weights of rework causes categorized in the “Engineering and Reviews” group.
Rework Cause S j K j = s j + 1 q j w j Rank
A1---110.489251
A50.9021.9020.525760.257232
A30.8851.8850.278920.136463
A80.8311.8310.152330.074534
A20.7521.7520.086950.042545
A60.7121.7120.050790.024856
A70.611.610.031540.015437
A40.5851.5850.019900.009748
Table 8. Weights of rework causes categorized in the “Implementation of Project” group.
Rework Cause S j K j = s j + 1 q j w j Rank
B3---110.482501
B100.8961.8960.527430.254482
B10.8651.8650.282800.136453
B50.7121.7120.165190.079704
B70.7011.7010.097110.046865
B80.6181.6180.060020.028966
B20.5831.5830.037920.018297
B60.5241.5240.024880.0120008
B40.5121.5120.016450.007949
B90.4931.4930.011020.0053210
Table 9. Weights of rework causes categorized in the “Material and Equipment Supply” group.
Rework Cause S j K j = s j + 1 q j w j Rank
C1---110.482991
C50.8841.8840.530790.256362
C60.8421.8420.288160.139183
C20.8211.8210.158240.076434
C40.6971.6970.093250.045045
C30.6581.6580.056240.027166
Table 10. Weights of rework causes categorized in the “Human Resource Capability” group.
Rework Cause S j K j = s j + 1 q j w j Rank
D1---110.483641
D30.8931.8930.528260.255492
D40.8231.8230.289780.140153
D70.8081.8080.160270.077524
D50.7941.7940.089390.043215
D80.7691.7690.050500.024436
D20.7421.7420.028990.014027
D60.7171.7170.016880.008178
Table 11. Weights of rework causes categorized in the “Construction Planning and Scheduling” group.
Rework Cause S j K j = s j + 1 q j w j Rank
E1---110.4939601
E20.9461.9460.513870.253832
E30.8731.8730.274360.135523
E40.8291.8290.150000.074104
Table 12. Weights of rework causes categorized in the “Leadership and Communication” group.
Rework Cause S j K j = s j + 1 q j w j Rank
F4---110.477211
F50.8641.8640.536480.256022
F10.8221.8220.294450.140513
F20.7541.7540.167870.080114
F30.7361.7360.096700.46155
Table 13. Weights of rework causes categorized in the “Effective External Causes” group.
Rework Cause S j K j = s j + 1 q j w j Rank
G2---110469001
G80.8321.8320.545850.256002
G40.7681.7680.308740.144803
G60.7591.7590.175520.082324
G10.7191.7190.102110.047895
G30.6241.6240.628700.029496
G50.6071.6070.039120.018357
G70.5731.5730.024840.011678
Table 14. The most important rework causes.
SignRework Cause
A1Design Errors
A5Design Changes
B3Difference among Plans and Operational Specifications
B10Poor Quality of Implementations
C1Non-compliance with Specifications
C5Poor Quality of Materials
D1Insufficient Skill Level
D3Unclear Instructions to Workers
E1Unrealistic Schedules
E2Insufficient Turnover and Commissioning Resourcing
F4Poor Communication
F5Poor Attendance of Stakeholders
G2Economic Fluctuations
G8Political Circumstances and Sanctions
Table 15. The case study building’s Work Breakdown Structure (WBS), anticipated, and implemented construction time.
No.WBS LevelAnticipated Time (Days)Implemented Time (Days)
1Delivery of Site11
2Site Preparation1219
3Implementation of Foundation2642
4Implementation of Building’s Structure4399
5Initial Flooring46107
6Implementation of Stairs’ Foundation59
7Implementation of Roofs and Internal Walls8499
8Implementation of Stories’ Foundation3338
9Implementation of External Walls911
10Moving Frames and Doors to their Places12
11Implementation of Windows1824
12Implementation of Stairs22
13Flooring the Stories3345
14Moving Electrical Appliances to their Places23
15Installation1634
16Installation of Frames1332
17Implementing Toilets15
18Initial Joinery of the Floors1936
19Final Flooring2436
20Installation of Cornices612
21Final Joinery of the Floors3044
22Installation of Floors’ Appliances612
23Implementation of Facade1843
24Painting2033
25Delivery of Project47
Total Time348524
Table 16. Summary of the identified errors and their effects on schedule.
No.ErrorDelay (Days)Time Saved Using BIM (Days)
1Interference among Structural and Architectural Elements1610
2Designing Errors3720
3Interference among Structural Elements, Openings, and Installation139
Table 17. Earned values for the case study building’s actual implementation and BIM prediction.
No.ModeSVSPI
1Actual Implementation−0.180.83
2BIM−0.110.89
Publisher’s Note: MDPI stays neutral with regard to jurisdictional claims in published maps and institutional affiliations.

