Article

Supporting the Sustainability of Natural Fiber-Based Value Chains of SMEs through Digitalization

Faculty of Electrical Engineering and Computer Science, University of Maribor, Koroška Cesta 46, 2000 Maribor, Slovenia
*
Author to whom correspondence should be addressed.
Sustainability 2020, 12(19), 8121; https://doi.org/10.3390/su12198121
Submission received: 25 August 2020 / Revised: 27 September 2020 / Accepted: 29 September 2020 / Published: 1 October 2020
(This article belongs to the Collection Digitalization and Sustainable Development)

Abstract

:
SMEs represent a significant share of business companies in Europe. Their limitations might be overcome by using value chains, resulting in successful development and growth also within traditionally low-digitalized, natural fiber-based domains. Reaching a sustainable competitive advantage for natural fiber-based value chains is possible by boosting the digitalization of the included SMEs. The digitalization level can be improved by properly addressing the detected digitalization issues and challenges. This paper aims at proposing a novel comprehensive approach for assessing the digitalization level of natural fiber-based value chains and the respective SMEs. Using the proposed dimensions, indicators, and corresponding measurement instruments, the digitalization level of a particular SME, as well as of the entire value chain of SMEs can be assessed. The paper additionally depicts a practical demonstration for applying the proposed approach within two case studies. The proposed approach favors low-digitalized SMEs to enter and benefit from the digitalized value chains, as well as provides the benefits and facilitates the growth and sustainability of the existing natural fiber-based value chains.

1. Introduction

The revolution we are witnessing through the digitalization of manufacturing is known as Industry 4.0 [1,2]. Due to extensive ICT usage, a significant transformation of the production process is being facilitated. The growing influence of Industry 4.0 is observed in SMEs (Small and Medium-Sized Enterprises) [3], as well as within the natural fiber domains (e.g., wood [4]). In the EU, ninety-nine percent of all businesses are SMEs, and they employ a total of two out of three employees [5]. Furthermore, micro-companies (i.e., companies with less than ten employees) constitute nine out of ten SMEs [5]. SMEs are technologically diverse. On the one hand, there are high-tech industries that manufacture computer, electronic, and optical products, while on the other hand, there are low-tech industries covering a variety of natural fiber sectors, such as manufacturers of wood, textiles, paper, leather, etc. [5].
Understanding digitalization’s role, as well as the current resources and capabilities of SMEs is playing a crucial role in achieving competitive advantages [6]. Reaching a sustainable competitive advantage for SMEs, especially for micro-sized and low-tech companies, is foreseeable when operating within value chains. Their focus is on value creation, value activities, and linkage identification and managing in order to provide collaboration along the value chain through coordination, trust building, and relationships [7]. Unlike conventional linear value chains, circular value chains ensure social and environmental benefits, as well as sustainability, in addition to organizational benefits [8]. A sustainable value chain consists of product development and the supply chain through all lifecycle stages, from the concept and raw material, across production and distribution, towards end customers, closing the cycle when the product goes into biological or technical waste, representing an input into a new recycling value chain [8,9]. Among the most important barriers that enterprises face when moving towards a circular economy is the lack of an incorporated digital technology [10]. The benefits of digitalization for SMEs are foreseen in the development of new processes, products, and business models, whilst taking into account the SMEs’ limited resources for research, development, investments, and personnel skills [11]. Thus, being aware of the current state of a company’s digitalization level is essential in order to adequately address existing obstacles and move towards sustainable development.
Several indexes, models, and scores are available to measure the digitalization level [12,13,14,15,16,17,18,19]. They consist of dimensions and corresponding indicators, which aim at measuring different aspects of the digitalization, also focusing on SMEs. Consequently, measurements performed from the SMEs’ perspective possibly contribute to a country’s global index score. Nevertheless, there is a lack of adjusted indicators that would adequately assess the digitalization level of SMEs within the natural fiber domain. It is necessary to adjust, combine, derive, and revise existing indicators in order to obtain comprehensive information about the digitalization level of SMEs within the natural fiber domain. Initial studies [20,21] indicated a low digitalization level of SMEs within this domain. Therefore, special attention needs to be paid to the adjustments and selection of indicators that would appropriately address issues and reflect the actual current situation. In order to address the existing research gap, we formed the following research questions:
RQ1
Is there a standardized set of dimensions and indicators used for measuring the digitalization level of SMEs?
RQ2
Which indicators are adequate and relevant for measuring the digitalization level of SMEs and the value chains of SMEs within the natural fiber-based domain?
RQ3
How can the digitalization level of SMEs and the value chains of SMEs be assessed within the natural fiber-based domain?
The following research methodology is employed in order to answer the research questions: (1) a review of the scientific and professional literature, (2) the analysis of identified dimensions and existing indexes, (3) the selection of indicators relevant to the natural fiber-based domain, (4) the proposal of a final set of adjusted and newly added indicators and corresponding measurement instruments, (5) the specification of the steps for assessing the digitalization level of natural fiber-based value chains and the respective SMEs, and (6) the analysis of selected case studies.
The main contribution of this paper is that it provides a novel comprehensive approach for assessing the digitalization level of natural fiber-based value chains and the respective SMEs.
It will be reached through partial contributions: (1) analyzing the state-of-the-art of existing mechanisms used for measuring the digitalization level of SMEs; (2) providing a set of indicators for SMEs and the value chains of SMEs within the natural fiber domain, based on the adjustments, combinations, derivations, and revisions of existing indicators; (3) proposing steps for assessing the digitalization level of specific natural fiber-based SMEs, as well as the corresponding value chain. Describing and analyzing the case studies demonstrate the assessment procedure.
Consequently, value chains and SMEs using the proposed approach will receive the necessary information and knowledge on how to digitalize their business, as well as to optimize their operations quickly and efficiently by knowing which segments require additional attention. On the one hand, this approach facilitates low-digitalized SMEs to enter and benefit from the digitalized value chains, pursuing technological advancements and digital transformations. On the other hand, the proposed approach will provide benefits for the existing natural fiber-based value chains, facilitating a circular economy, resulting in sustainable SMEs and the corresponding value chains.
The rest of the paper is organized as follows. Section 2 provides the theoretical background on the natural fiber-based value chains, the indexes used for measuring digitalization, as well as the analyzed related work on measuring digitalization. Section 3 deals with our proposal for measuring the digitalization level of natural fiber-based SMEs. The practical demonstration of the proposed approach is depicted in Section 4, wherein Section 4.1 presents a case study measuring the digitalization level of an individual SME, while Section 4.2 offers to a case study measuring the digitalization level of a value chain of SMEs. The discussion Section 5 brings the elaboration of the obtained results with regard to the research questions. Finally, the conclusions and future work are presented in Section 6.

2. Theoretical Background

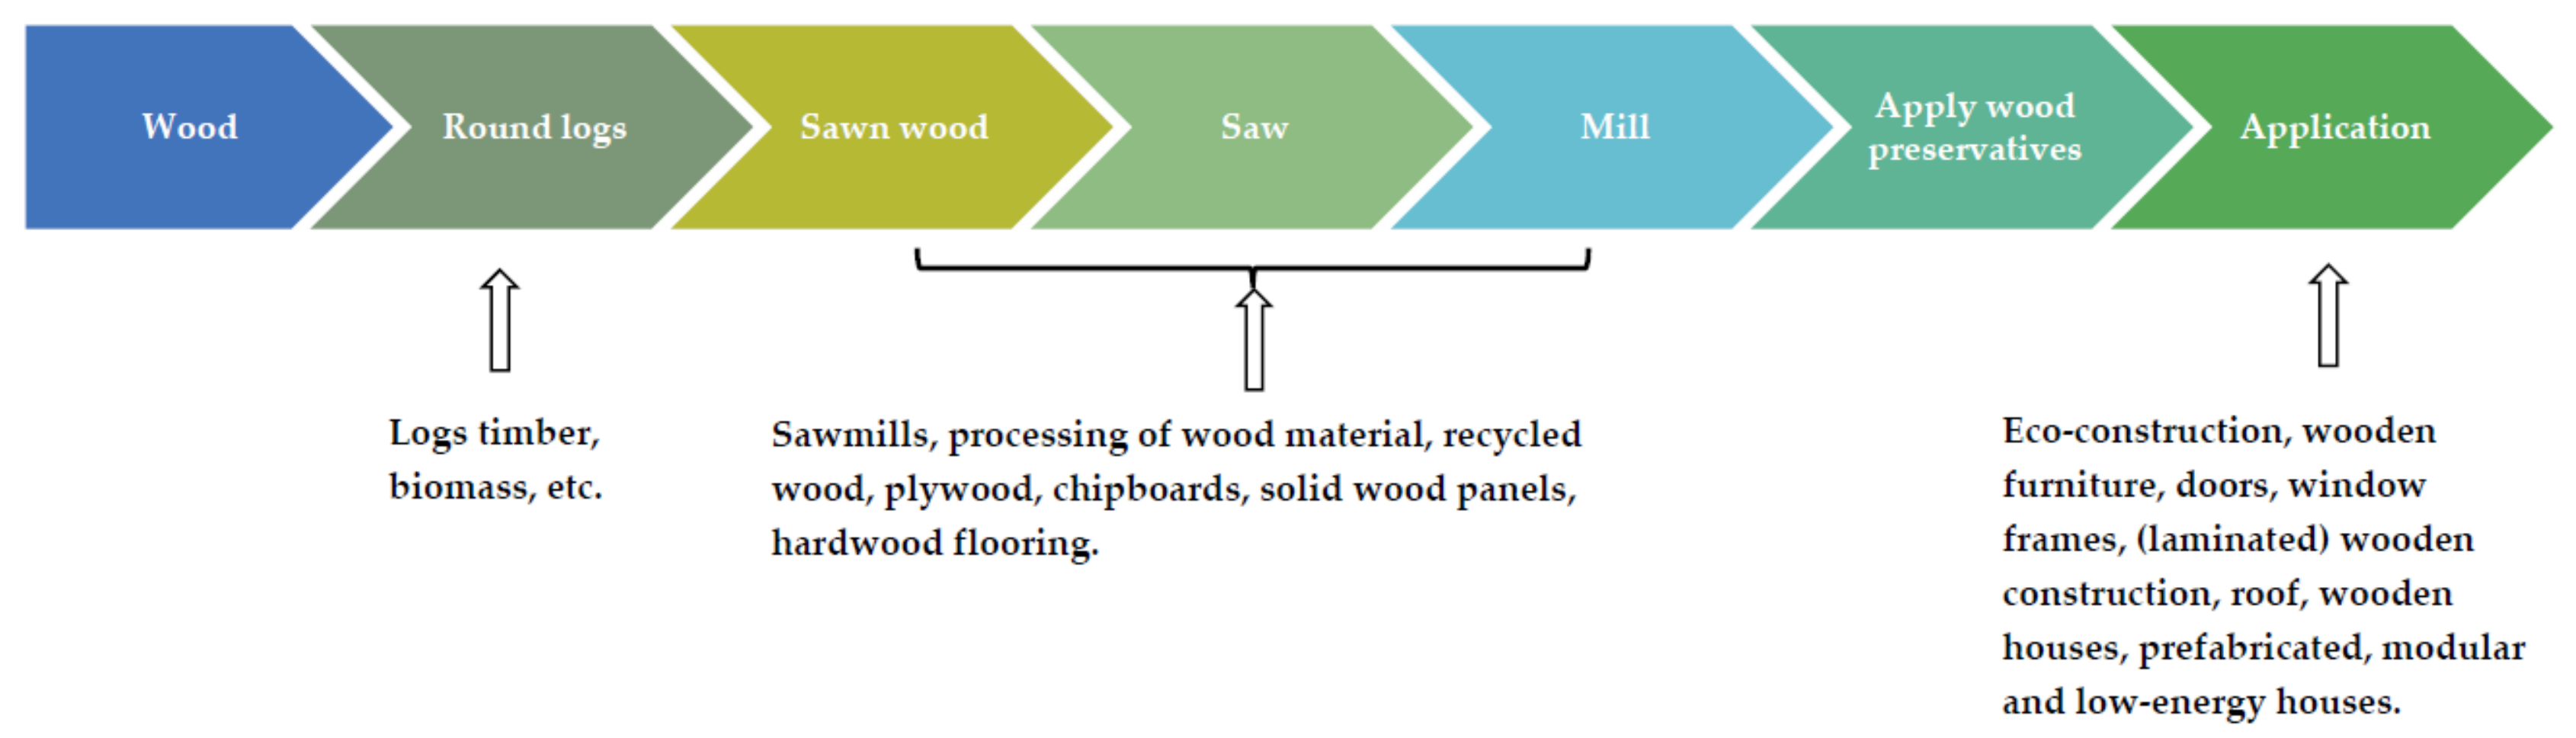
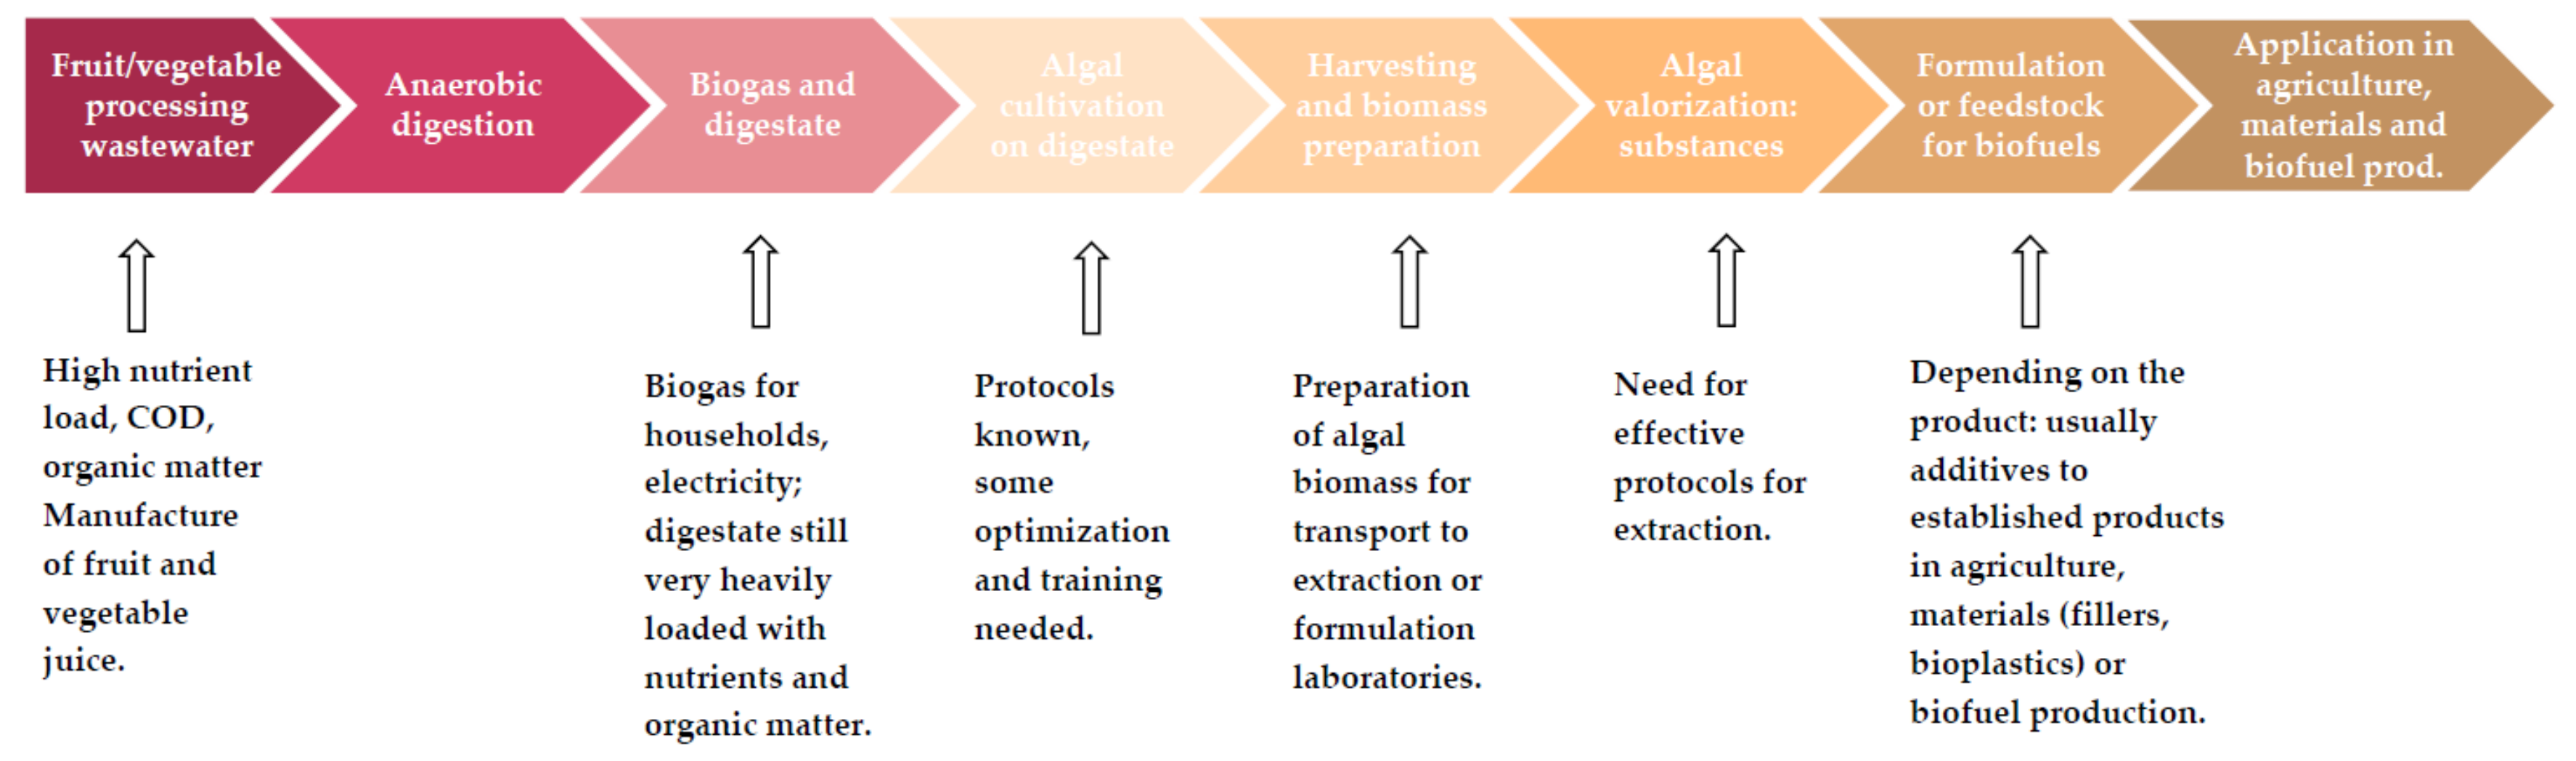
2.1. Natural Fiber-Based Value Chains of SMEs

The concept of a value chain was first introduced by Porter in 1985 [22]. A value chain consists of various activities performed to transform raw material into a final product or service, which is to be delivered to customers [23,24]. Value chains are important for the development and successful growth of SMEs in several natural fiber-based domains, such as textile, wood, and agriculture with more traditional fibers (e.g., maize, apples) or more trendy ones (e.g., hemp and algae). We detected [25] two types of value chains, the first starting with the cultivation of a plant up to the manifold products (see Figure 1) and the second starting with the recycled biological waste (see Figure 2). Digitalization enables advancements in all segments of the value chains. For instance, wood value chains can benefit from the optimization of wood harvesting and extraction processes, support for the transport and logistics, management of the quality control process, etc. [4].
Figure 1 presents the eco-construction value chain that covers seven segments from wood harvesting and round log handling (wood processing) to surface finishing, advance wood composite manufacturing, as well as semi- and end-products (e.g., houses, furniture, construction elements).
Figure 2 depicts a recycling value chain of algae production from waste water received as a by-product of food production (e.g., fruit residue) or water from cooking vegetables. Users of algae and algae raw materials (lipids, proteins, pigments) include the food processing industry, juice producers, salt pans (include spirulina in their products), as well as dairy, pet, and livestock products.
Since forests cover 43% of the EU’s land area, the manufacturing of wood products has been growing continuously in the EU for the last decade [26]. In 2020, wood-based industries covered 20% of the total EU manufacturing sector and 10% of the total workforce in manufacturing and generated an annual turnover of 3% of the EU’s GDP [27].

2.2. Indexes Measuring Digitalization

Digitalization represents the use and integration of digital technologies within an organization in order to upgrade the business processes, reorganize work within the company, and consequently, change the organization’s business model [28,29]. In general, the digitalization level of a country is measured by several available indexes and scores that will be presented further on.
The Digital Economy and Society Index (DESI) [12] was developed by the European Commission to measure each country’s digital competitiveness through a predefined set of indicators. It monitors the digital performance and tracks the digital competitiveness of countries [30]. It is calculated as the weighted average of its dimensions: connectivity, human capital, use of Internet services, integration of digital technology, and digital public services [30]. Additionally, the European Commission launched the Digital Transformation Monitor (DTM) [31] with the aim of monitoring the digital transformation of existing industries and businesses [21]. Within the project, the Digital Transformation Scoreboard (DTS) [13] data analysis was introduced, consisting of seven dimensions divided into two categories called enablers and outputs. The enablers are the digital infrastructure, investments, and access to finance, supply, and demand of digital skills, e-leadership, and entrepreneurial culture and are measured by the Digital Transformation Enablers’ Index (DTEI) [21]. On the other hand, the outputs are the integration of digital technology and changes in the ICT start-up environment, which are measured by the Digital Technology Integration Index (DTII) and the ICT Start-up Evolution Index, respectively [21]. The DTS and DESI are closely related; moreover, an overlap can be detected between their common dimension of the integration of digital technology [13,21].
A regional extension of the European Innovation Scoreboard (EIS) [14] is called the Regional Innovation Scoreboard (RIS) [15]. It is used for a comparative analysis of the innovation performance of European regions, using 18 out of the 27 indicators used within the EIS, which comprises ten dimensions: human resources, attractive research systems, innovation-friendly environment, finance and support, firm investments, innovators, linkages, intellectual assets, employment impacts, and sales impacts. Detailed information on the indicators used within EIS and RIS and the differences between them is available in the Report on Regional Innovation Scoreboard 2019 [32].
Going Digital [33] is a project established by the OECD (Organization for Economic Co-operation and Development) that provides the Going Digital Toolkit, a visual interface that assists countries in evaluating the state of their digital development. It formulates policies, strategies, and approaches in response to a specific assessment of a country. The main advantage of the toolkit is an adequate data visualization and exploration. The indicators used within the tool are grouped into seven dimensions: access, use, innovation, jobs, society, trust, and market openness, which together support growth and improve well-being [16].
In addition to the above-mentioned indexes, some countries developed custom mechanisms to measure the success of their digitalization efforts (e.g., the DIGITALEconomy Index in Germany, the Digital Intensity Index in Slovenia, and the Digital Maturity Index in Italy). The DIGITAL Economy Index [34], published by the Federal Ministry for Economic Affairs and Energy, is used to assess the degree of digitalization within the German economy. The index focuses on three themes: the usage of digital devices and infrastructures, the digital development of enterprises, and the business success through digitalization. The Digital Intensity Index [35] consists of 12 specific indicators, which monitor the use of ICT in enterprises with at least ten employees. The data are gathered for a given year by the Statistical Office of the Republic of Slovenia. The Digital Maturity Index [36], published by the scientific-technological university Politecnico di Milano, provides SMEs with an assessment of their digital maturity by analyzing their business processes in design and engineering, maintenance, human resources, production, supply chain, quality, logistics, marketing, sales, and customer service, as well as monitoring and control.

2.3. Related Work on Measuring Digitalization

Rauch et al. [3] developed an assessment model and tool to facilitate the adoption of Industry 4.0 concepts in manufacturing SMEs. The work includes a catalog of four dimensions, including 42 concepts, whereby one dimension deals with technology. Kilimis et al. [37] conducted a survey on German SMEs regarding the implementation of digitalization technologies in order to identify potential benefits and barriers that appear throughout the process. Dossou [38] proposed a framework that includes building a reference model that can help accelerate the integration of Industry 4.0 concepts in metallurgic SMEs. Hamidi et al. [39] adopted the Industry 4.0-readiness maturity model (Impuls) and used it to assess Malaysian SMEs’ readiness towards digital transformation. Lucato et al. [40] proposed a model to measure the readiness of industries for the implementation of Industry 4.0 concepts. Nevertheless, the above-mentioned studies cover advanced technological concepts typical for Industry 4.0 that are rather applicable for highly digitalized domains than the natural fiber-based domains.
Given that the structure of any value chain is defined strongly by the underlying business models of participating SMEs, it is necessary to assess the impact of digitalization on the business models [41]. These aspects were addressed by Nwaiwu et al. [42] and Muller et al. [43]. The first study proposed a qualitative and quantitative approach that can be used to identify enabling factors for the implementation of Industry 4.0 for a process management model in manufacturing SMEs. The latter studied the SMEs’ awareness of Industry 4.0 concepts, as well as how those concepts influence the innovation of SMEs’ business models.
Engländer et al. [44] developed an approach connecting the business model with the Industry 4.0 Maturity Index. Georgieva et al. [45] analyzed the current degree of digitalization of Bulgarian forest sector enterprises using selected Eurostat indicators.
Several indexes and models are proposed in the scientific and professional literature. Bogovac et al. [17] proposed a digitalization index called IDSMEthat aims at examining the current situation of SMEs’ digitalization. IDSME includes four dimensions: connection to the Internet, digital skills, integration of digital technologies, and Internet usage. Pham [18] proposed a model for measuring the ICT maturity of SMEs. It consists of four factors: ICT infrastructure, ICT application, human resource, and ICT policy. Ramantoko et al. [19] developed a digital capability model for SMEs in order to investigate the digital transformation maturity of SMEs. The model consists of nine dimensions: organization or company presence, store presence, support, knowledge management and decision making, marketing and sales, customer relationship, internal communication, ecosystem management, and digital revenue. The above approaches were developed for measuring the digitalization level of SMEs. However, certain refinements are needed in order to apply them directly to low-digitalized SMEs such as those within the natural fiber domain.

3. Measuring the Digitalization Level of Natural Fiber-Based SMEs

There are plenty of indicators used for assessing several dimensions of digital maturity, such as DESI measuring digital competitiveness, EIS evaluating innovation performance, DTM monitoring the level of digital transformation, etc. In addition to many general indicators, more focused indicators addressing SMEs are available. Nevertheless, when applying existing indicators to low-digitalized business domains, many challenges arise. For example, during the assessment of the digital maturity of natural fiber-based SMEs, only a few indicators might be directly applied, while several indicators must be adjusted to the needs of a specific domain. Additionally, new indicators should also be introduced in order to perform a comprehensive assessment of digital maturity.
In order to provide an exhaustive list of indicators for SMEs operating within the natural fiber-based domain, we performed a review of existing indexes in Europe, such as DESI [12], DTS [13], RIS [15], and OECD Going Digital [16], as well as indexes proposed within the scientific and professional literature [17,18,19]. Table 1 presents an intersection matrix between the detected dimensions within existing indexes for measuring the digitalization level. Please note that the dimensions with similar names and scopes proposed by different sources were considered as one. Only indexes with clearly specified dimensions (indicators excluded) were analyzed, i.e., the DESI, DTS, RIS, and OECD Going Digital indexes, which were supplemented with indexes proposed in the literature [17,18,19]).
The performed analysis indicates significant variations in the understanding of certain dimensions in different indexes. There is no unified set of dimensions and indicators for SMEs in the natural fiber-based domain. Some indexes focus more on measuring the digitalization level of entire countries or regions, while others pay more attention to specifying indicators and dimensions more relevant for individual SMEs. Furthermore, different interpretations of dimensions between indexes can lead to possibly different categorizations of indicators and, consequently, to large variations in the intersection matrix. For instance, the existence of electronic information sharing through specialized software (e.g., ERP) is included as an indicator within the digital infrastructure dimension in the DTS index, whereas the same is measured within the integration of digital technology dimension in the DESI index or the ICT application dimension in the index proposed by Pham et al. To circumvent these variations in the categorization of indicators by different authors, we decided to study the intersection between different indexes on the level of dimensions by only analyzing their overlaps at the general level (naming variations included) without taking into account the included indicators.
Since the results of our analysis showed little intersection in dimensions between existing indicators, we extracted individual indicators appropriate for measuring the digitalization of SMEs, forming a base of all available knowledge on measuring the digitalization level. Some of these indicators were already proposed by existing indexes, while others that could be applied to SMEs were accordingly adapted. Finally, we selected only those indicators suitable for the natural fiber-based value chains. The indicators can be adapted and used to gain a detailed insight into the level of digitalization of SMEs in these value chains. Our proposal includes 54 indicators categorized into eight dimensions: (1) connectivity, (2) online presence, (3) online activity, (4) ICT infrastructure, (5) ICT policy, (6) ICT usage, (7) human resources, and (8) R&D infrastructure. When relevant, the dimensions are broken down into further sub-dimensions.
The first dimension, connectivity, foresees Internet usage for SMEs’ business activities. Natural fiber-based SMEs are not commonly situated in urban areas, where the Internet coverage and connectivity are unquestionable. Therefore, it is important to be able to assess their connectivity quality, which is a fundamental part in the natural fiber-based SMEs’ digital transformation, as well as the following two dimensions: online presence and online activities. The online presence dimension covers SMEs’ presence on the Internet in the form of a functional website, social media, and e-marketing activities, as well as all the activities related to online trading. On the other hand, the online activity dimension covers SMEs’ core business and administrative activities, such as e-banking, e-government, and interactions with suppliers. Those two dimensions are particularly important for SMEs in order to develop and increase the market and solicit new customers.
ICT infrastructure is the fourth dimension where the usage of the fundamental ICT elements is assessed, as well as the usage of advanced technologies such as Big Data and cloud services. Additionally, a peculiarity of a majority of natural fiber-based SMEs is the existence of a production line. Therefore, the assessment of the usage of production technologies is crucial, since they essentially benefit from the digital transformation of the SMEs. Currently, awareness of security issues and data protection is on the rise regardless of the company’s size. Therefore, the context of the ICT policy dimension is important for the long-term strategic development of SMEs. Closely related to this dimension is ICT usage, which represents one of the important foundations within the process of digitalization. The dimension measures the share of employees using computer or mobile devices, the Internet, applications, and communication tools.
The seventh dimension focuses on human resources, whereby special emphasis is placed on continuous investment into employees’ knowledge and digital skills. Reaching a satisfactory level of digitalization without STEM and ICT educated employees is very challenging. Therefore, the assessment of those aspects within SMEs is important. Companies not investing in knowledge and technological development will have difficulties remaining competitive, to cooperate within the specific value chain, which consequently leads to their unsustainability. According to the R&D intensity score [5], many SMEs within the natural fiber domain (e.g., furniture, paper, wood) scored low. The well-developed R&D infrastructure is naturally reserved for SMEs with sufficient human and financial resources. Nevertheless, the measurements in this dimension are important in order to efficiently address existing issues by knowing what requires attention. SMEs with well-established R&D departments might impact and elevate the entire value chain, facilitating the processes along the production line and supply chain.
The obtained list of proposed dimensions and indicators is presented in Table 2. It represents a comprehensive overview of all relevant facets when it comes to measuring the level of digitalization in SMEs in the natural fiber-based value chains. In order to assess the digitalization level of SMEs, we developed a measurement instrument for each indicator, which consists of the measurement question and its corresponding scale. The measurement instruments are presented in Appendix A.

4. Case Studies

The assessment of the digitalization level of a particular SME or value chain is achieved following several steps: (1) prepare the SME and the domain contextualization; (2) select adequate dimensions considering monitored digitalization aspects; (3) within the selected dimensions, extract those indicators that determine the scope addressed; and (4) design a questionnaire comprised of collected measurement instruments.
To demonstrate this process, two case studies are provided in the following subsections. The first one, presented in Section 4.1, demonstrates how to use the proposed approach in order to measure the digital maturity level of SMEs operating within the natural fiber-based domain (specifically, the wood domain). Section 4.2 captures the second case study describing the procedure of using the proposed approach when measuring the digital maturity level of the natural fiber-based value chain of SMEs.
The analysis is based on the data collected through the survey and companies’ websites. The identities of the companies remain undisclosed and, therefore, are presented descriptively according to their business activity.

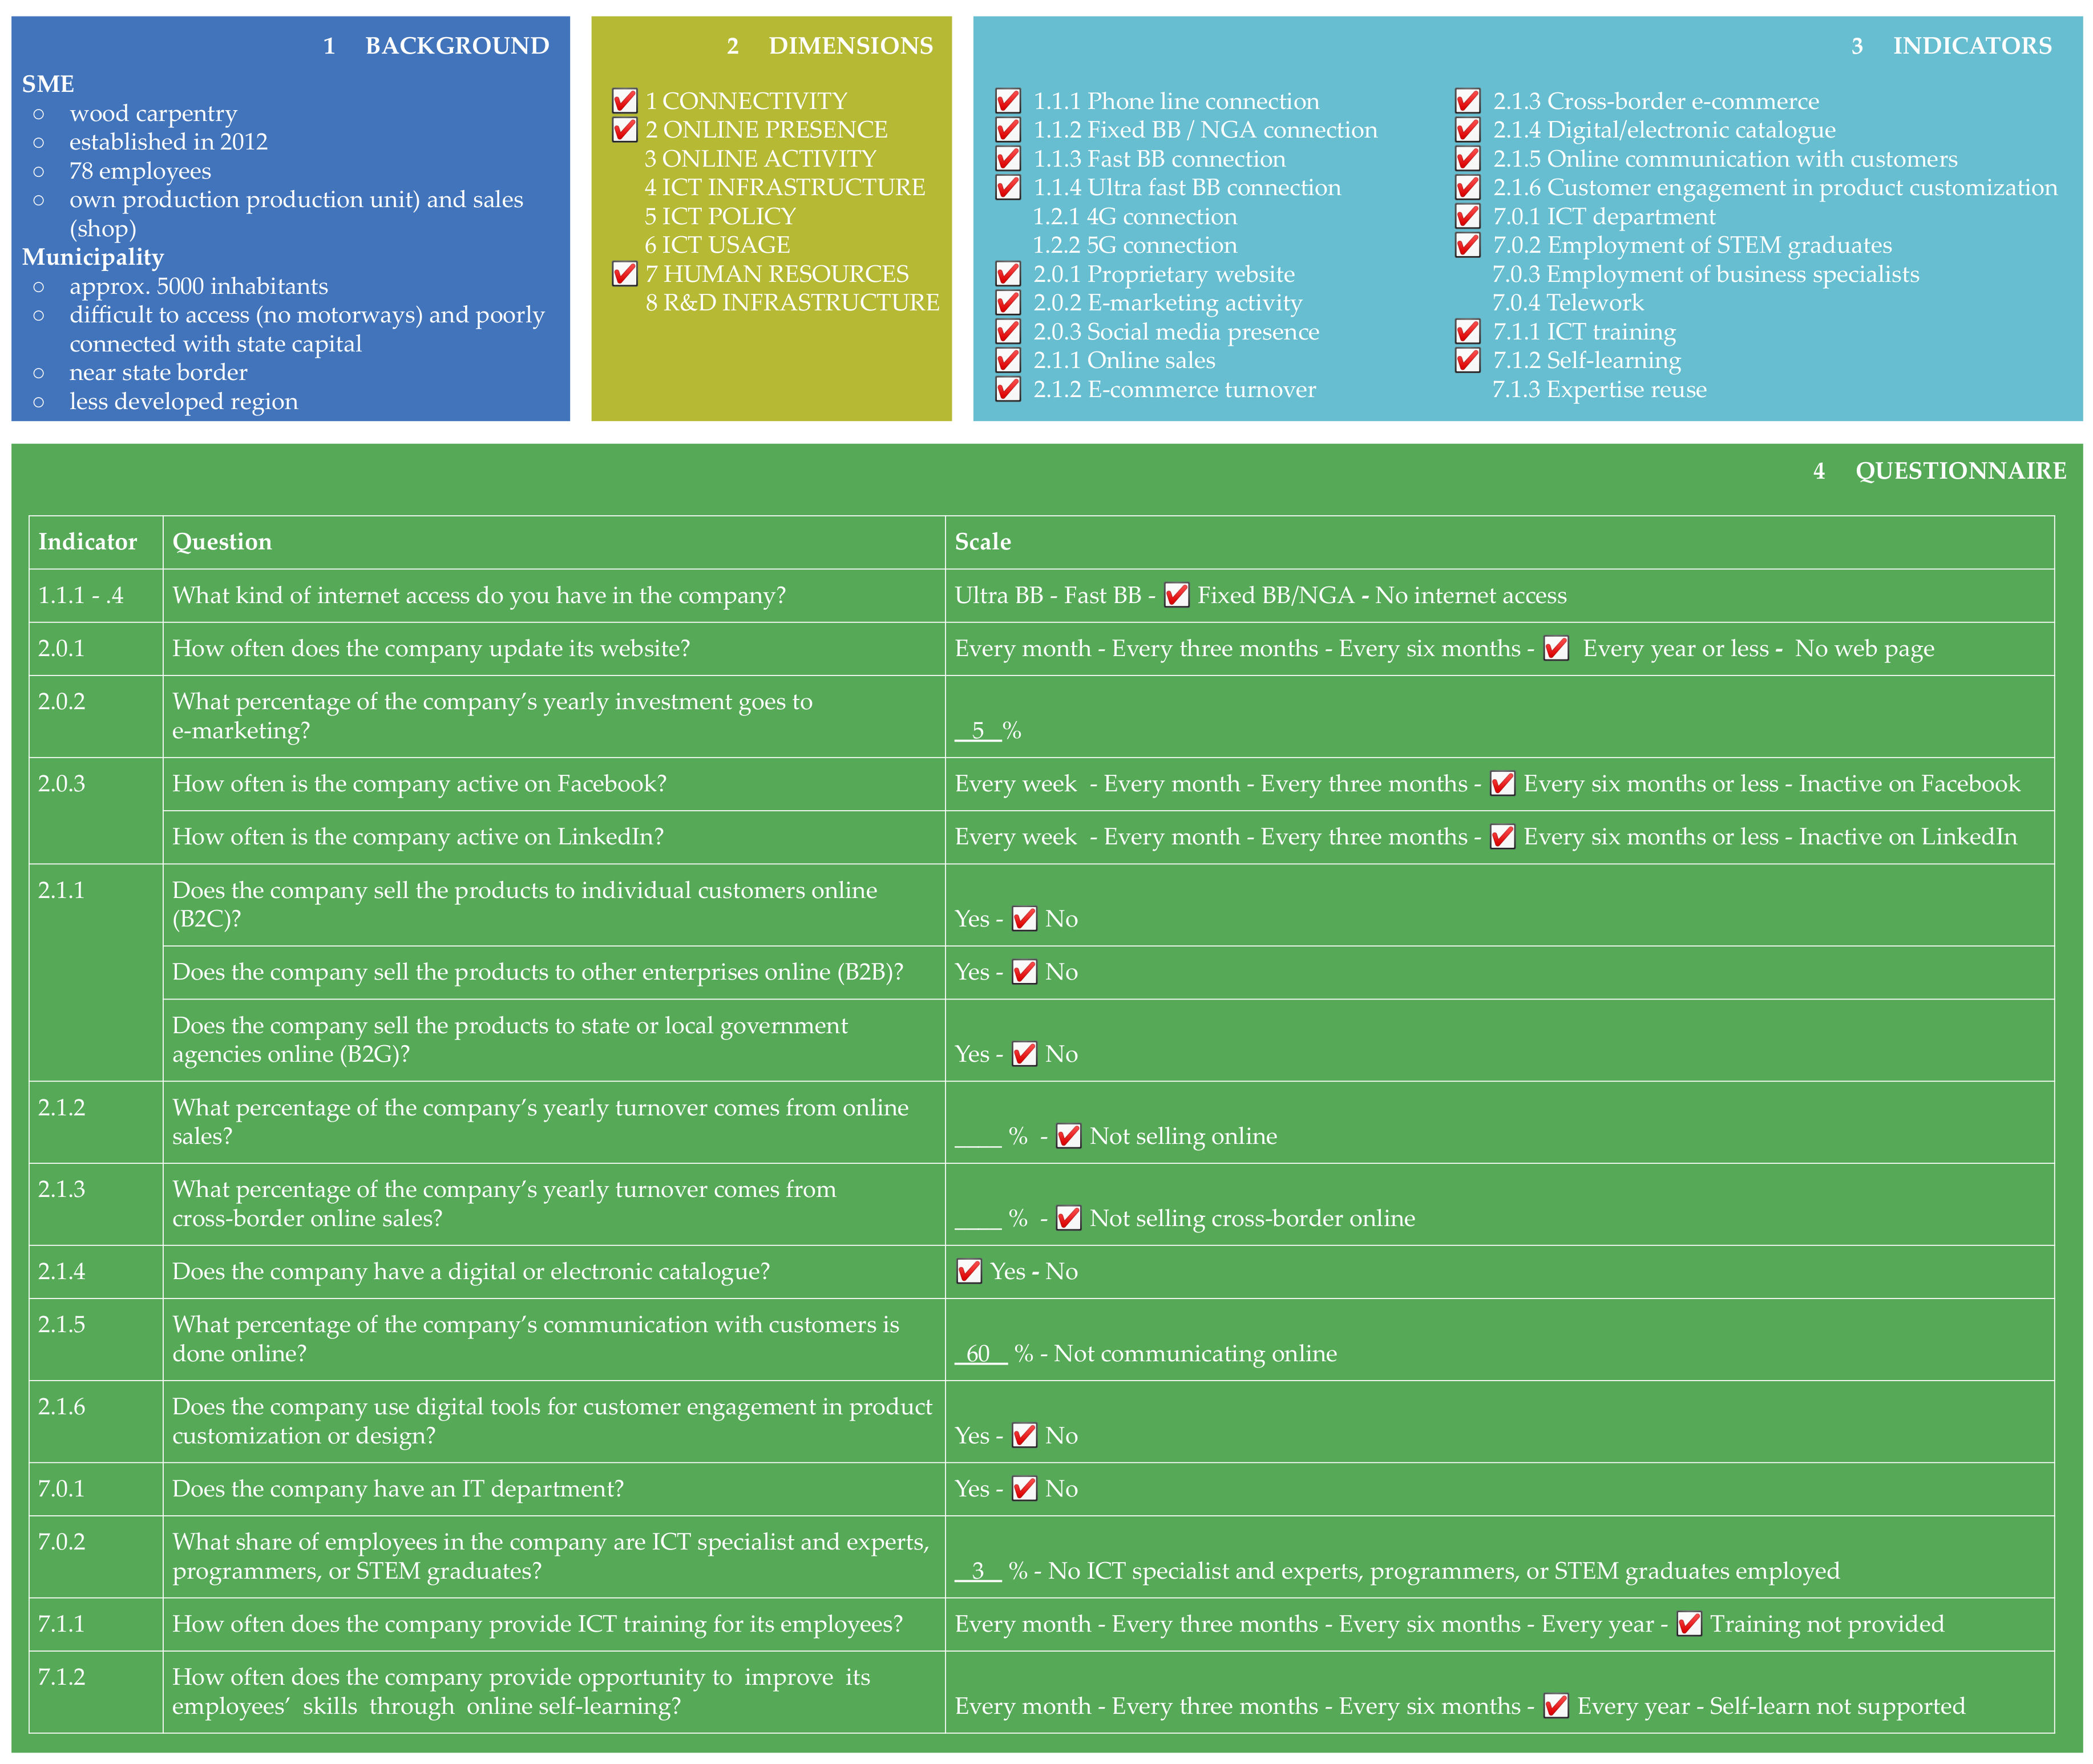
4.1. CS1: Measuring the Digital Level of Wood SMEs

A wood carpentry SME decided to assess their digital level using the proposed approach (see Figure 3). The first step (1 Background) envisages a contextualization that focuses on the characteristics of SMEs, their business domain, as well as the characteristics of the region in which the SME operates. This involves answering questions such as: How many employees does the company have? In which business domain does the company operate? Which business activities does the company perform? How many inhabitants does the region have? What are the region’s transportation characteristics?
The next step (2 Dimensions) provides the selection of the digital dimensions that the company will address while measuring its digitalization level. The example presented in Figure 3 shows that the wood carpentry SME decided to address the first, second, and seventh dimension, since it is in their interest to increase market share by improving their online presence.
The third step (3 Indicators) includes selecting the dimensions’ indicators that are appropriate and relevant considering the prepared contextualization and the pursued goal of the SME. The following step (4 Questionnaire) consists of creating a questionnaire that includes existing measurement instruments. The prepared and filled out questionnaire is presented in Figure 3. Based on the selected indicators, the questionnaire consists of 16 questions, which reveal the digitalization aspects that require the SME’s attention. Addressing those aspects will facilitate the optimization of business processes and reaching the digital transformation objectives. As observed in Figure 3, the SME has a dearth of online sales (Indicator 2.1.2), which is important for reaching their goal to increase market share by using their online presence. This objective is directly related to the fixed-line broadband dimension (Indicators 1.1.1–1.1.4), as well as the human resources dimension (especially Indicator 7.0.2). Therefore, it needs better connectivity to the Internet and more ICT specialists employed in order to successfully implement online sales. Nevertheless, this process is highly anticipated since already 60% of all communication with customers is done online (Indicator 2.1.5).

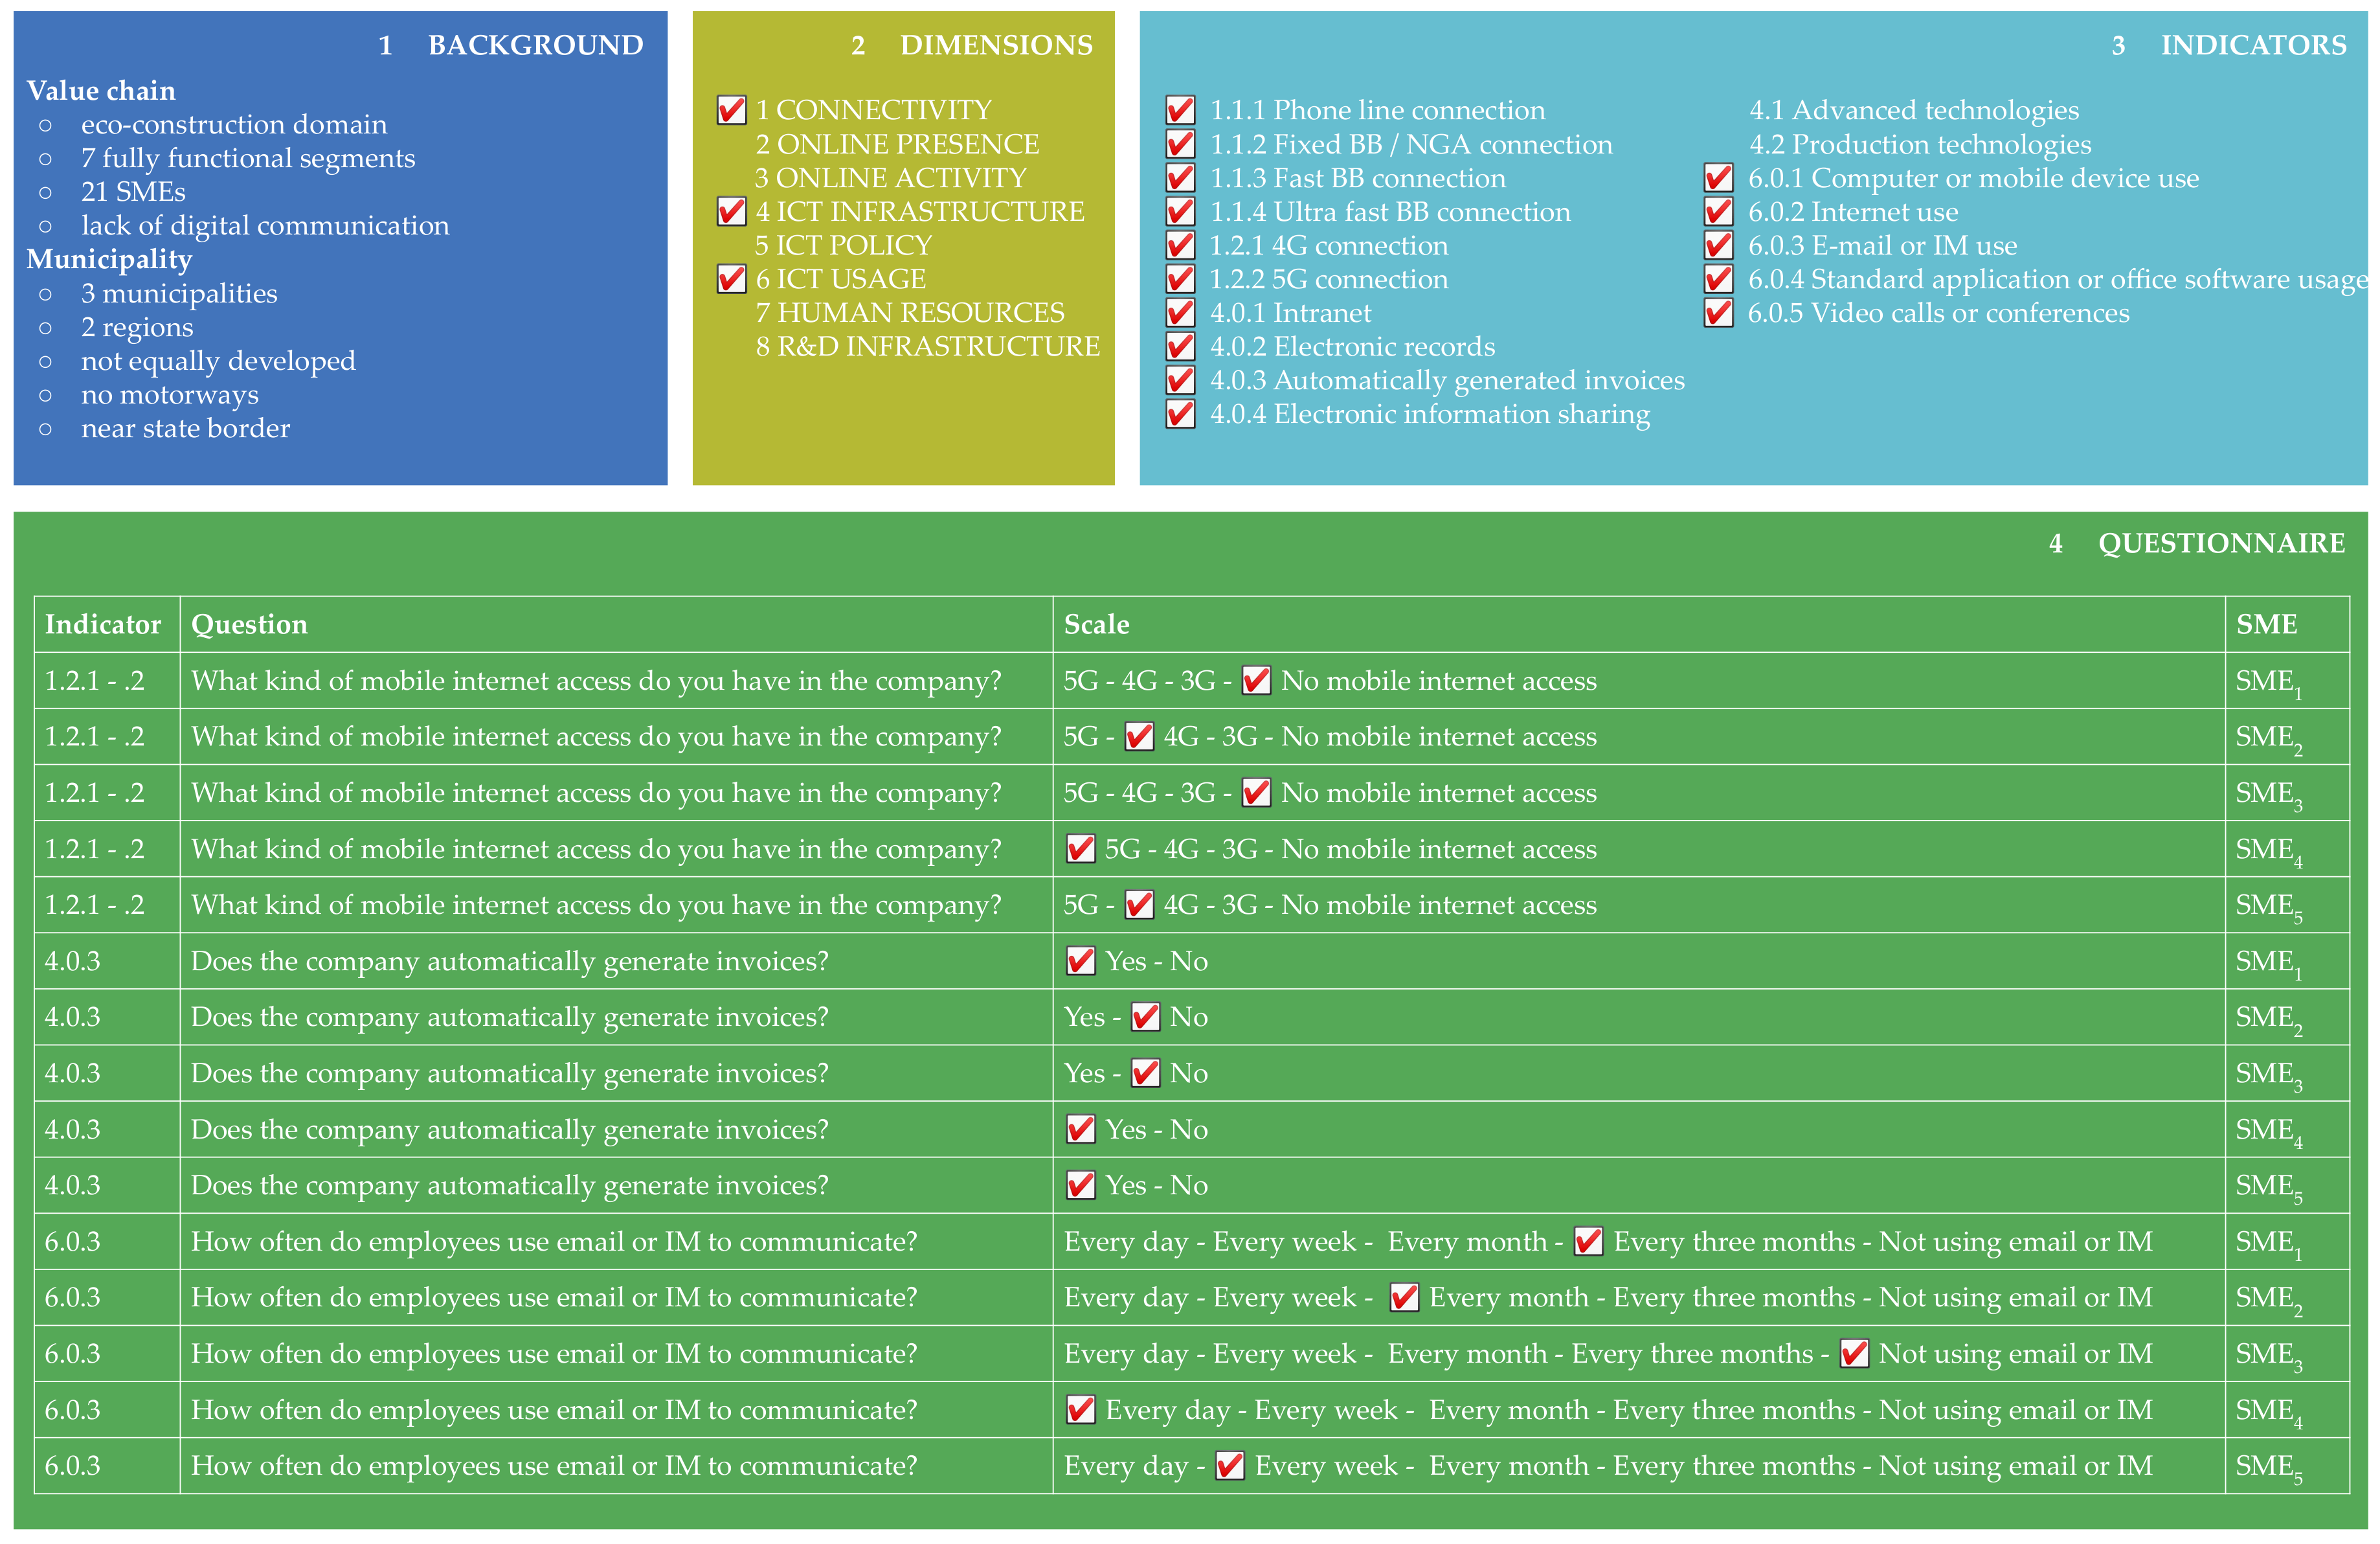
4.2. CS2: Measuring the Digitalization Level of the Wood Value Chain of SMEs

SMEs in the eco-construction value chain (see Figure 1) perceived the need for the assessment of the entire value chain digitalization level (see Figure 4). By following the proposed approach, the first step (1 Background) resulted in preparing a contextual background of the selected value chain and corresponding SMEs. This involves answering questions such as: What are the sizes (in terms of the number of employees) of SMEs? Which domain does the value chain cover? Which business activities do SMEs within the value chain perform? Which region and municipalities are covered by the value chain? What are the region’s transportation characteristics?
In the second step (2 Dimensions), selecting the proposed digital dimensions that the value chain will address when measuring the digitalization level is provided. The example presented in Figure 4 depicts the dimensions (the first, the fourth, and the sixth) that will be assessed by the SMEs involved in this value chain, since they perceived a shortage in digital communication and digital business processes between members of the value chain. The following step (3 Indicators) includes selecting the indicators that are relevant considering the prepared contextualization and the pursued goal of the value chain. Finally, in the fourth step (4 Questionnaire), a questionnaire with the proposed measurement instruments is created.
Figure 4 illustrates a subset of responses to three questions obtained from five SMEs. The full questionnaire consists of 11 questions that are answered by all SMEs pertaining to the eco-construction value chain (21 SMEs in total). Significant differences in responses can be observed. For example, SME 4 uses email and Instant Messaging (IM) on an everyday basis (Indicator 6.0.3), while SME 3 has no mobile Internet access at all. First, it is fundamental to evaluate fixed-line broadband connections (Indicators 1.1.1–1.1.4). However, since the majority of SMEs are located in remote areas with less developed infrastructure, mobile Internet access (Indicators 1.2.1–1.2.2) might play an important role. Therefore, it is important to measure those indicators. In order to achieve digital communications and digital business process improvements at the level of the entire value chain, it is required to enhance the digitalization level of individual SMEs within the given value chain. The proposed approach leads to the detection of digitalization challenges and issues.

5. Discussion

In order to answer RQ1, we performed a comprehensive review of existing scientific and professional literature related to measuring the digitalization level of SMEs. We analyzed the available indexes, corresponding dimensions, and indicators. The analysis revealed significant variations in the understanding of the dimensions within available indexes. Therefore, we concluded that there is no standardized set of dimensions and indicators that can be used for measuring the digitalization level of SMEs.
Furthermore, there is no unified set of dimensions and indicators for SMEs in the natural fiber-based domain. In order to answer RQ2, we extracted the indicators from the available indexes and combined them into meaningful dimensions. Table 2 presents the provided set of indicators, obtained through adjustments, combinations, derivations, and revisions of existing indicators that are presented within the established indexes, as well as within the literature on assessing the digitalization level of SMEs. The proposed set of indicators is combined into eight dimensions, as well as grouped within sub-dimensions where appropriate. For each indicator, a measurement instrument is formed consisting of a question and a corresponding scale. While basic digitalization aspects (e.g., connectivity, using email, employee skills, etc.) are assessed using a frequency scale, only the existence of more advanced facets is assessed (e.g., Big Data, decision support tool, 3D printing, etc.). The complete list of measurement instruments is available in Appendix A.
We tackled RQ3 by proposing several steps (Section 4) that constitute a comprehensive approach for assessing the digitalization level of a particular SME or value chain. The approach is demonstrated by case studies presented in Section 4.1 and Section 4.2. The suitability of the proposed approach for measuring the digitalization level of an individual SME is presented with Case Study 1 (CS1) (Section 4.1). According to the selected digitalization aspects, the appropriate dimensions and corresponding indicators were combined into a questionnaire. Since the usage of a complete list of indicators cannot be foreseen, the questionnaires can be adapted according to the needs of a particular SME. Therefore, this results in a manageable questionnaire that is not time consuming. The case study CS2 (Section 4.2) demonstrates the use of the approach for measuring the digitalization level of a natural fiber-based value chain. Following the proposed steps, the questionnaire is designed according to the existing goals of the value chain. In order to obtain the valuable content, all value chain segments should be represented.
The obtained results give SMEs an insight into their digitalization level, which helps optimize their operations quickly and efficiently by knowing which segments require additional attention. Achieving the appropriate digitalization level facilitates low-digitalized SMEs by the successful inclusion into digitalized value chains pursuing technological advancements and digital transformation. By raising the digitalization level of an individual SME, also the digitalization level of the respective natural fiber-based value chain increases. Addressing the obtained results will facilitate the transformation into competitive and sustainable SMEs and corresponding value chains, which will, consequently, boost the circular economy significantly.
In addition to the mentioned direct positive effect on individual SMEs and/or value chains, the proposed approach also benefits by providing valuable insights to other stakeholders. Policy makers receive relevant information on digital maturity, which reveals challenges and issues that should be addressed. This can help develop adequate policies and adjust the mechanisms, which will reduce the gap between policy makers and SMEs, as well as facilitate the successful digital transformation. On the other hand, the obtained results open unaddressed research opportunities whereby findings can bring an added value in the digitalization process of SMEs, as well as useful information for decision makers.
In addition to the highlighted contributions of the proposed approach, special attention should be given to several aspects that could lead to biased assessments. Since the questionnaire is designed and filled in directly by SMEs, a certain level of subjectivity might be expected. For example, inadequate indicators could be selected that would lead to the misinterpretation of the results. When assessing the digitalization level of the value chain of SMEs, the questionnaire has to be answered by all value chain members in order to identify all digitalization bottlenecks accurately. Additionally, the collected results should be processed adequately and interpreted to avoid incorrect conclusions.

6. Conclusions

The paper offers a novel comprehensive approach for assessing the digitalization level of natural fiber-based value chains and the respective SMEs. Following the research methodology, we provided the answers to the defined research questions. Our research findings significantly improve the state-of-the-art in the field of assessing the digitalization level of natural fiber-based SMEs. The proposed approach brings benefits to various stakeholders (SMEs, policy makers, research institutions) and reduces the information gap among them.
Since the digitalization level of an SME is linked strongly to the usage of tools digitalizing the business processes, our future work will provide the preparation of a knowledge base for tools that can be used within different business sectors. The knowledge base will be offered in the form of a web portal, which will facilitate SMEs to find the appropriate tools needed for their digital transformation.

Author Contributions

The authors contributed equally to this work. Conceptualization, A.K., M.Š., and T.B.; investigation, A.K., M.Š., and T.B.; methodology, A.K., M.Š., and T.B.; writing, original draft, A.K., M.Š., and T.B.; writing, review and editing, A.K., M.Š., and T.B. All authors read and agreed to the published version of the manuscript.

Funding

The research was developed within the Smart SME’s Project, co-financed by the European Parliament through the Alpine Region Preparatory Action Fund (ARPAF II) (2019–2021).

Acknowledgments

The authors would like to express their appreciation to the project partners (Schweizerische Arbeitsgemeinschaft für die Berggebiete (SAB), BIOPRO Baden-Württemberg GmbH, Department for Economic Development, Research and Labour of the Autonomous Province of Trento, Hub Innovazione Trentino, Ecoplus, The Business Agency of Lower Austria, and Anteja ECG) for their valuable contribution. The authors also acknowledge financial support from the Slovenian Research Agency (Research Core Funding No. P2-0057).

Conflicts of Interest

The authors declare no conflict of interest.

Appendix A

Table A1. Proposed Measurement Instruments.
IndicatorQuestionScale
1.1.1Phone line connectionWhat kind of fix-line broadband do you have in the company?Ultrafast BBFast BBFixed BB/NGANo Internet access
1.1.2Fixed BB/NGA connection
1.1.3Fast BB connection
1.1.4Ultra fast BB connection
1.2.14G connectionWhat kind of mobile broadband do you have in the company?5G4G3GNo mobile Internet access
1.2.25G connection
2.0.1Proprietary websiteHow often does the company update its website?Every monthEvery three monthsEvery six monthsEvery year or lessNo web page
2.0.2E-marketing activityWhat percentage of the company’s yearly investments goes to e-marketing?Percentage
2.0.3Social media presenceHow often is the company active on (add social media)?Every weekEvery monthEvery three monthsEvery six months or lessInactive on (insert social media)
2.1.1Online salesDoes the company sell products to individual customers online (B2C)?YesNo
Does the company sell products to other companies online (B2B)?
Does the company sell products to state or local government agencies online (B2G)?
2.1.2E-commerce turnoverWhat percentage of the company’s yearly turnover comes from online sales?PercentageNot selling online
2.1.3Cross-border e-commerceWhat percentage of the company’s yearly turnover comes from cross-border online sales?PercentageNot selling cross-border online
2.1.4Digital/electronic catalogDoes the company have a digital or electronic catalog?YesNo
2.1.5Online communication with customersWhat percentage of the company’s communication with customers is done online?PercentageNot communicating online
2.1.6Customer engagement in product customizationDoes the company use digital tools for customer engagement in product customization or design?YesNo
3.0.1B2B e-business activityHow often does the company use digital channels to communicate and collaborate with other companies?Every dayEvery weekEvery monthEvery three months or lessNot having e-business activity
3.0.2B2G e-business activityHow often does the company use e-government services?Every weekEvery monthEvery three monthsEvery six months or lessNot using e-government services
3.0.3E-bankingHow often does the company use e-banking?Every dayEvery weekEvery monthEvery three months or lessNot using e-banking
3.0.4Online purchasesHow often does the company buy products or services from other enterprises online?Every weekEvery monthEvery three monthsEvery six months or lessNot buying online
4.0.1IntranetDoes the company have/use intranet?YesNo
4.0.2Electronic recordsDoes the company keep electronic records?YesNo
4.0.3Automatically generated invoicesDoes the company automatically generate invoices?YesNo
4.0.4Electronic information sharingDoes the company have electronic information sharing?YesNo
4.1.1Big dataDoes the company collect and use big data?YesNo
4.1.2Cloud servicesDoes the company use cloud computing services (e.g., The use of servers, storage, databases, software, analytic, etc., over the Internet)?YesNo
4.1.3Integrated or specialized systems or toolsDoes the company use integrated or specialized information systems or tools (such as ERP, SCM, CRM, MES, andon, CAD, etc.)?YesNo
In which departments does the company use integrated or specialized information systems?Department
4.1.4Business intelligence or knowledge baseDoes the company use business intelligence software or knowledge base (e.g., QLIK)?YesNo
4.1.5Decision support toolDoes the company use any decision support tool?YesNo
4.2.1Robots and 3D printingDoes the company use robots or 3D printing?YesNo
4.2.2AutomationDoes the company use automation?YesNo
4.2.3Product identification throughout the supply chain (unique, automated)Does the company use unique and automated product identification throughout the supply chain (e.g., RFID technology)?YesNo
4.2.4Digital supply chain management and supplier relationshipsDoes the company have digital supply chain management or supplier relationship management?YesNo
5.0.1Security policyDoes the company have an ICT security policy?YesNo
5.0.2Data protection policyDoes the company have data protection policy?YesNo
5.0.3Regulatory qualityDoes the company have a regulatory quality policy?YesNo
5.0.4Assessment effectivenessDoes the company have a policy for assessing effectiveness?YesNo
5.0.5Software or hardware upgradesHow often does the company upgrade or update software and hardware?Every three monthsEvery six monthsEvery yearEvery two years or lessNot updating
What share of yearly investments does the company invest in improving or upgrading the ICT infrastructure?PercentageNot investing
6.0.1Computer or a mobile device useWhat share of employees in the company uses a computer or a mobile device for their work?PercentageNot using computer or mobile devices
6.0.2Internet useWhat share of employees in the company uses Internet for their work?PercentageNot using Internet
6.0.3E-mail or IM useHow often do employees use e-mail or instant messaging to communicate?Every dayEvery weekEvery monthEvery three monthsNot using e-mail or IM
6.0.4Standard application or office software usageWhat share of employees in the company use a standard application or office software (e.g., Microsoft Office)?PercentageNot using standard application or office software
6.0.5Video calls or conferencesHow often do employees in the company use video calls or video conferences to communicate?Every dayEvery weekEvery monthEvery three monthsNot using video calls
7.0.1ICT departmentDoes the company have an IT department?YesNo
7.0.2Employment of STEM graduatesWhat share of employees in the company are ICT specialists and experts, programmers, or STEM graduates?PercentageNo ICT specialists and experts, programmers, or STEM graduates employed
7.0.3Employment of business specialistsWhat share of employees in the company are business specialists?PercentageNo business specialists employed
7.0.4TeleworkHow often does the company provide the option of telework?Three days per week or moreOne day per weekFew days per monthFew days per yearTelework not possible
7.1.1ICT trainingHow often does the company provide ICT training for its employees?Every monthEvery three monthsEvery six monthsEvery yearTraining not provided
7.1.2Self-learningHow often does the company provide opportunity to improve its employees’ skills through online self-learning?Every monthEvery three monthsEvery six monthsEvery yearSelf-learning not supported
7.1.3Expertise reuseHow often do you reuse expertise and knowledge?Every monthEvery three monthsEvery six monthsEvery yearNot reusing expertise
8.0.1R&D departmentDoes the company have a research & development department?YesNo
8.0.2ICT investment in R&DWhat percentage of the company’s yearly investment is reserved for R&D?PercentageNot investing
8.0.3Patents or trademarksDoes the company apply for patents or trademarks?YesNo
8.0.4In-house innovation capacityHow would you rate the innovation capacity of the company?Very goodGoodAverageBadVery bad
8.0.5Innovative collaborationDoes the company’s cooperation with other enterprises result in innovative products and services?YesNo

References

  1. Santos, C.; Mehrsai, A.; Barros, A.; Araújo, M.; Ares, E. Towards Industry 4.0: An overview of European strategic roadmaps. Procedia Manuf. 2017, 13, 972–979. [Google Scholar] [CrossRef]
  2. Ghobakhloo, M. Industry 4.0, digitization, and opportunities for sustainability. J. Clean. Prod. 2020, 252, 119869. [Google Scholar] [CrossRef]
  3. Rauch, E.; Unterhofer, M.; Rojas, R.A.; Gualtieri, L.; Woschank, M.; Matt, D.T. A Maturity Level-Based Assessment Tool to Enhance the Implementation of Industry 4.0 in Small and Medium-Sized Enterprises. Sustainability 2020, 12, 3559. [Google Scholar] [CrossRef]
  4. Müller, F.; Jaeger, D.; Hanewinkel, M. Digitization in wood supply–A review on how Industry 4.0 will change the forest value chain. Comput. Electron. Agric. 2019, 162, 206–218. [Google Scholar] [CrossRef]
  5. European Commission. Annual Report on European SMEs—2018/2019; Technical Report; European Commission: Brussels, Belgium, 2019. [Google Scholar]
  6. Lee, Y.Y.; Falahat, M. The Impact of Digitalization and Resources on Gaining Competitive Advantage in International Markets: Mediating Role of Marketing, Innovation and Learning Capabilities. Technol. Innov. Manag. Rev. 2019, 9, 26–38. [Google Scholar] [CrossRef]
  7. Sultan, A.; Srivastava, S. Achieving Sustainable Development through Value Chain. Int. J. Manag. Value Supply Chain. 2013, 4, 39–46. [Google Scholar] [CrossRef]
  8. Pavel, S. Circular Economy: The Beauty of Circularity in Value Chain. J. Econ. Bus. 2018, 1, 584–598. [Google Scholar] [CrossRef] [Green Version]
  9. D’heur, M. Sustainable Value Chain Management: Delivering Sustainability through the Core Business; Springer: Munich, Germany, 2015. [Google Scholar]
  10. Pham, T.T.; Kuo, T.C.; Tseng, M.L.; Tan, R.R.; Tan, K.; Ika, D.S.; Lin, C.J. Industry 4.0 to Accelerate the Circular Economy: A Case Study of Electric Scooter Sharing. Sustainability 2019, 11, 6661. [Google Scholar] [CrossRef] [Green Version]
  11. Müller, E.; Hopf, H. Competence Center for the Digital Transformation in Small and Medium-Sized Enterprises. Procedia Manuf. 2017, 11, 1495–1500. [Google Scholar] [CrossRef]
  12. European Commission. The Digital Economy and Society Index (DESI). 2020. Available online: https://ec.europa.eu/digital-single-market/en/desi (accessed on 5 August 2020).
  13. European Commission. Digital Transformation Scoreboard. 2018. Available online: https://ec.europa.eu/growth/tools-databases/dem/monitor/scoreboard (accessed on 4 August 2020).
  14. European Commission. European Innovation Scoreboard. 2020. Available online: https://ec.europa.eu/growth/industry/policy/innovation/scoreboards_en (accessed on 6 August 2020).
  15. European Commission. Regional Innovation Scoreboard (RIS). 2020. Available online: https://ec.europa.eu/growth/industry/policy/innovation/regional_en (accessed on 5 August 2020).
  16. OECD. Going Digital Toolkit: Policy Dimensions. 2020. Available online: https://goingdigital.oecd.org/en/dimensions/ (accessed on 11 August 2020).
  17. Bogavac, M.; Čekerevac, Z. IDSME index—New method for evaluation of SMEs digitalization. MEST J. 2019, 2, 9–20. [Google Scholar] [CrossRef]
  18. Pham, Q.T. Measuring the ICT maturity of SMEs. J. Knowl. Manag. Pract. 2010, 11, 1–14. [Google Scholar]
  19. Ramantoko, G.; Fatimah, L.V.; Pratiwi, S.C.; Kinasih, K. Measuring Digital Capability Maturity: Case of Small-Medium Kampong-Digital Companies in Bandung. J. Soc. Sci. Hum. 2018, 26, 215–230. [Google Scholar]
  20. Beranič, T.; Šestak, M.; Kerman, K.; Pečnik, Š.; Kamišalič, A. Digitalization Rate of SMEs Involved in the Wood Fibers Value Chains in the Alpine Region. In Proceedings of the 2020 Society of Wood Science and Technology International Convention “Renewable Resources for a Sustainable and Healthy Future”, Portorož, Slovenia, 12–15 July 2020; LeVan-Green, S., Ed.; Society for Wood Science and Technology: Monona, WI, USA, 2020; pp. 166–173. [Google Scholar]
  21. European Commission. Digital Transformation Scoreboard 2018—EU Businesses Go Digital: Opportunities, Outcomes and Uptake; Technical Report; European Commission: Brussels, Belgium, 2018. [Google Scholar]
  22. Porter, M.E. Competitive Advantage: Creating and Sustaining Superior Performance; Free Press: New York, NY, USA, 1985; p. 557. [Google Scholar]
  23. Kaplinsky, R.; Morris, M. A Handbook for Value Chain Research; University of Sussex, Institute of Development Studies Brighton: Brighton, UK, 2000; Volume 113. [Google Scholar]
  24. Robert, N.; Jonsson, R.; Chudy, R.; Camia, A. The EU Bioeconomy: Supporting an Employment Shift Downstream in the Wood-Based Value Chains? Sustainability 2020, 12, 758. [Google Scholar] [CrossRef] [Green Version]
  25. Boyarintseva, O.; Hartmann, J. Mapping of Actual State of Play and Needs—Synthesis Report; Technical Report; BIOPRO Baden-Württemberg GmbH: Stuttgart, Germany, 2020. [Google Scholar]
  26. Eurostat. Agriculture, Forestry and Fishery Statistics 2019; Technical Report; European Commission: Brussels, Belgium, 2019. [Google Scholar]
  27. EUSTAFOR. The European Forest-Based Industries Ecosystem Calls to Be Elligible for Support by the European Recovery Plan and Industrial Strategy. 2020. Available online: https://eustafor.eu/the-european-forest-based-ecosystem-calls-to-be-eligible-for-support-by-the-european-recovery-plan-and-industrial-strategy/ (accessed on 17 September 2020).
  28. Gartner Inc. Digitalization. 2020. Available online: https://www.gartner.com/en/information-technology/glossary/digitalization (accessed on 5 May 2020).
  29. IGI Global. What Is Digitalization. 2020. Available online: https://www.igi-global.com/dictionary/it-strategy-follows-digitalization/7748 (accessed on 5 May 2020).
  30. European Commission. Digital Economy and Society Index (DESI) 2020—Thematic Chapters, Technical Report. 2020. Available online: https://ec.europa.eu/newsroom/dae/document.cfm?doc_id=67086 (accessed on 5 August 2020).
  31. European Commission. Digital Transformation Monitor. 2018. Available online: https://ec.europa.eu/growth/tools-databases/dem/monitor/ (accessed on 4 August 2020).
  32. European Commission. Region Innovation Scoreboard 2019; Technical Report; European Commission: Brussels, Belgium, 2019. [Google Scholar]
  33. OECD. Going Digital. 2020. Available online: http://www.oecd.org/going-digital (accessed on 4 August 2020).
  34. Federal Ministry for Economic Affairs and Energy. DIGITAL Economy Monitoring Report. 2018. Available online: https://www.bmwi.de/Redaktion/EN/Publikationen/monitoring-report-digital-economy-2018.pdf?__blob=publicationFile&v=4 (accessed on 5 August 2020).
  35. Zupan, G. The Rate of Digitization of Enterprises with at Least 10 Persons Employed in 2018. 2018. Available online: https://www.stat.si/StatWeb/en/News/Index/7812 (accessed on 5 August 2020).
  36. Manufacturing Group, Politecnico di Milano. Industry 4.0—Towards Digitalization. 2017. Available online: https://www.testindustria4-0.com (accessed on 5 August 2020).
  37. Kilimis, P.; Zou, W.; Lehmann, M.; Berger, U. A Survey on Digitalization for SMEs in Brandenburg, Germany. IFAC-PapersOnLine 2019, 52, 2140–2145. [Google Scholar] [CrossRef]
  38. Dossou, P.E. Impact of Sustainability on the supply chain 4.0 performance. Procedia Manuf. 2018, 17, 452–459. [Google Scholar] [CrossRef]
  39. Hamidi, S.R.; Aziz, A.A.; Shuhidan, S.M.; Aziz, A.A.; Mokhsin, M. SMEs maturity model assessment of IR4.0 digital transformation. In Proceedings of the International Conference on Kansei Engineering & Emotion Research, Kuching, Sarawak, Malaysia, 19–22 March 2018; Springer: Berlin/Heidelberg, Germany, 2018; pp. 721–732. [Google Scholar]
  40. Lucato, W.C.; Pacchini, A.P.T.; Facchini, F.; Mummolo, G. Model to evaluate the Industry 4.0 readiness degree in Industrial Companies. IFAC-PapersOnLine 2019, 52, 1808–1813. [Google Scholar] [CrossRef]
  41. Chesbrough, H. Business model innovation: Opportunities and barriers. Long Range Plan. 2010, 43, 354–363. [Google Scholar] [CrossRef]
  42. Nwaiwu, F.; Duduci, M.; Chromjakova, F.; Otekhile, C.A.F. Industry 4.0 concepts within the Czech SME manufacturing sector: An empirical assessment of critical success factors. Bus. Theory Pract. 2020, 21, 58–70. [Google Scholar] [CrossRef]
  43. Müller, J.M.; Buliga, O.; Voigt, K.I. Fortune favors the prepared: How SMEs approach business model innovations in Industry 4.0. Technol. Forecast. Soc. Change 2018, 132, 2–17. [Google Scholar] [CrossRef]
  44. Engländer, J.; Bleider, M.; Hoffmann, J. Methodology to Identify the Most Relevant Information Management Principles for Manufacturing Companies Based on their Business Model. In Proceedings of the 5th International Conference on e-Society, e-Learning and e-Technologies, Laxenburg, Austria, 10–12 January 2019; pp. 116–121. [Google Scholar]
  45. Georgieva, D.; Popova, R. Digitisation in forest industry in Bulgaria—State and perspectives. In Proceedings of the Scientific Papers, Digitalisation and Circular Economy: Forestry and Forestry Based Industry Implications, Varna, Bulgaria, 11–13 September 2019; Chobanova, R., Ed.; USB & WoodEMA: Sofia, Bulgaria, 2019; pp. 181–186. [Google Scholar]
  46. Directorate-General for Communication Networks, Content and Technology. Monitoring the Digital Economy & Society 2016–2021; Technical Report; European Commission: Brussels, Belgium, 2015. [Google Scholar]
Figure 1. An example of a natural fiber-based value chain starting with the cultivation [25].
Sustainability 12 08121 g001
Figure 2. An example of a natural fiber-based value chain starting with the recycled biological waste [25].
Sustainability 12 08121 g002
Figure 3. Case-study: digitalization assessment of a wood carpentry SME.
Sustainability 12 08121 g003
Figure 4. Case-study: digitalization assessment of the wood value chain of SMEs.
Sustainability 12 08121 g004
Table 1. The intersection between the dimensions and existing indexes for measuring the digitalization level of SMEs. DESI, Digital Economy and Society Index; DTS, Digital Transformation Scoreboard; RIS, Regional Innovation Scoreboard.
DimensionDESI
[12]
DTS
[21]
RIS
[32]
OECD
[16]
IDSME
[17]
Pham
[18]
Ramantoko
[19]
Attractive research systems
Connectivity
Customer relationship
Digital infrastructure
Digital public services
Digital revenue
Ecosystem management
e-leadership/internal communication
Employment impacts
Entrepreneurial culture/company
Finance and support
Growth and well-being
Human capital/digital skills
ICT policy
ICT start-ups
Innovators
Integration of digital technology/e-commerce
Intellectual assets
Investments and access to finance/R&D
Knowledge development and decision-making
Linkages
Market openness
Society
Store presence
Supply and demand of digital skills
Support
Trust
Use of Internet services/online activity
Table 2. Proposed dimensions, sub-dimensions, and corresponding indicators.
DimensionIndicatorSource
1 Connectivity1.1 Fixed-line broaadband1.1.1Phone line connection[17]
1.1.2Fixed BB/NGAconnection[12,13,17,46]
1.1.3Fast BB connection[12,13,16,17]
1.1.4Ultra-fast BB connection[12,13]
1.2 Mobile broadband1.2.14G connection[12,17]
1.2.25G connection[12,17]
2 Online presence 2.0.1Proprietary website[17,18,19,46]
2.0.2E-marketing activity[17,19]
2.0.3Social media presence[12,13,17,18,46]
2.1 E-commerce2.1.1Online sales[13,16,17,18,19,46]
2.1.2E-commerce turnover[12,13,17,46]
2.1.3Cross-border e-commerce[12,13,16,17]
2.1.4Digital/electronic catalog[19]
2.1.5Online communication with customers[19]
2.1.6Customer engagement in product customization(self-developed indicator)
3 Online activity 3.0.1B2B e-business activity[17]
3.0.2B2G e-business activity[17]
3.0.3e-banking[12,17,46]
3.0.4Online purchases[12,16,17,18,46]
4 ICT infrastructure 4.0.1Intranet[17,19]
4.0.2Electronic records[17]
4.0.3Automatically generated invoices[13,46]
4.0.4Electronic information sharing[12,46]
4.1 Advanced technologies4.1.1Big Data[12,16,46]
4.1.2Cloud services[12,13,16,17,46]
4.1.3Integrated or specialized systems or tools[13,18,19,46]
4.1.4Business intelligence or knowledge base[18]
4.1.5Decision support tool[17]
4.2 Production technologies4.2.1Robots and 3D printing[16,46]
4.2.2Automation[17,46]
4.2.3Product identification throughout the supply chain (unique, automated)[13,17,46]
4.2.4Digital supply chain management and supplier relationships[46]
5 ICT policy 5.0.1Security policy[16,18,46]
5.0.2Data protection policy[16,18]
5.0.3Regulatory quality[18]
5.0.4Assessment effectiveness[18]
5.0.5Software or hardware upgrades[18]
6 ICT usage 6.0.1Computer or mobile device use[13,18,46]
6.0.2Internet use[12,16,17,18,46]
6.0.3E-mail or IM use[17,18,46]
6.0.4Standard application or office software usage[17,18]
6.0.5Video calls or conferences[12,17,18,46]
7 Human resources 7.0.1ICT department[12,15,16,17,18,31,46]
7.0.2Employment of STEM graduates[17]
7.0.3Employment of business specialists[18]
7.0.4Telework[16,17]
7.1 Employee skills7.1.1ICT training[18,46]
7.1.2Self-learning[18,46]
7.1.3Expertise reuse[18,46]
8 R&D infrastructure 8.0.1R&D department[16]
8.0.2ICT investment in R&D[13,15,18,19]
8.0.3Patents or trademarks[15,16,18]
8.0.4In-house innovation capacity[13,15,18]
8.0.5Innovative collaboration[15]

