In the first part of this section we have undertaken the research using Canonical Correlation Analysis (CCA). Based on the results obtained and the indicators in the databases, we developed a composite index called the Index of Digitization and Labor Force (DLFI). With its help we determined the impact of digitalization on labor force productivity in the 19 states included in our analysis. Data have been collected from the World Bank [
32] and World Economic Forum [
33] and the latest available were for the years 2018–2019. The 19 states included in this research are Argentina, Australia, Brazil, Canada, China, France, Germany, India, Indonesia, Italy, Japan, Mexico, Russia, Saudi Arabia, South Africa, South Korea, Turkey, Great Britain and USA.
3.1. Canonical Correlation Analysis
Canonical Correlation Analysis was introduced by Hotelling [
34] as a modelling method to identify and analyze the associations between two sets of variables, an independent one and a dependent one. CCA is useful when there are multiple correlations between outcome variables. Pairs of canonical variates are built as orthogonal linear combinations of the variables in the two initial sets, that explain best the inter- and intra-set variability [
35]. The number of dimensions is equal to the number of elements in the smaller set. The first canonical correlation has the highest importance in interpretation between any predictor and any outcome variable. The structure coefficients are significant when their absolute values are above 0.45.
CCA was applied on the set of 19 OECD countries and 10 indicators following the line of Georgescu and Kinnunen [
36]. As it can be seen in
Table 1, the digitalization indicators (
V1–
V5) represent the independent set and the labor force indicators (
V6–
V10) represent the dependent set.
The goal of CCA is to predict five variables: Total labor force, GDP per capita (PPP current international USD), GINI index, Total unemployment, Net foreign direct investment, based on five independent variables: Individuals using the Internet, Research and development expenditure, Human Capital Index, Secure Internet servers per million people, and Mobile cellular subscriptions. We used the data collected from the World Bank and World Economic Forum for the years 2018–2019. We work with standardized variables.
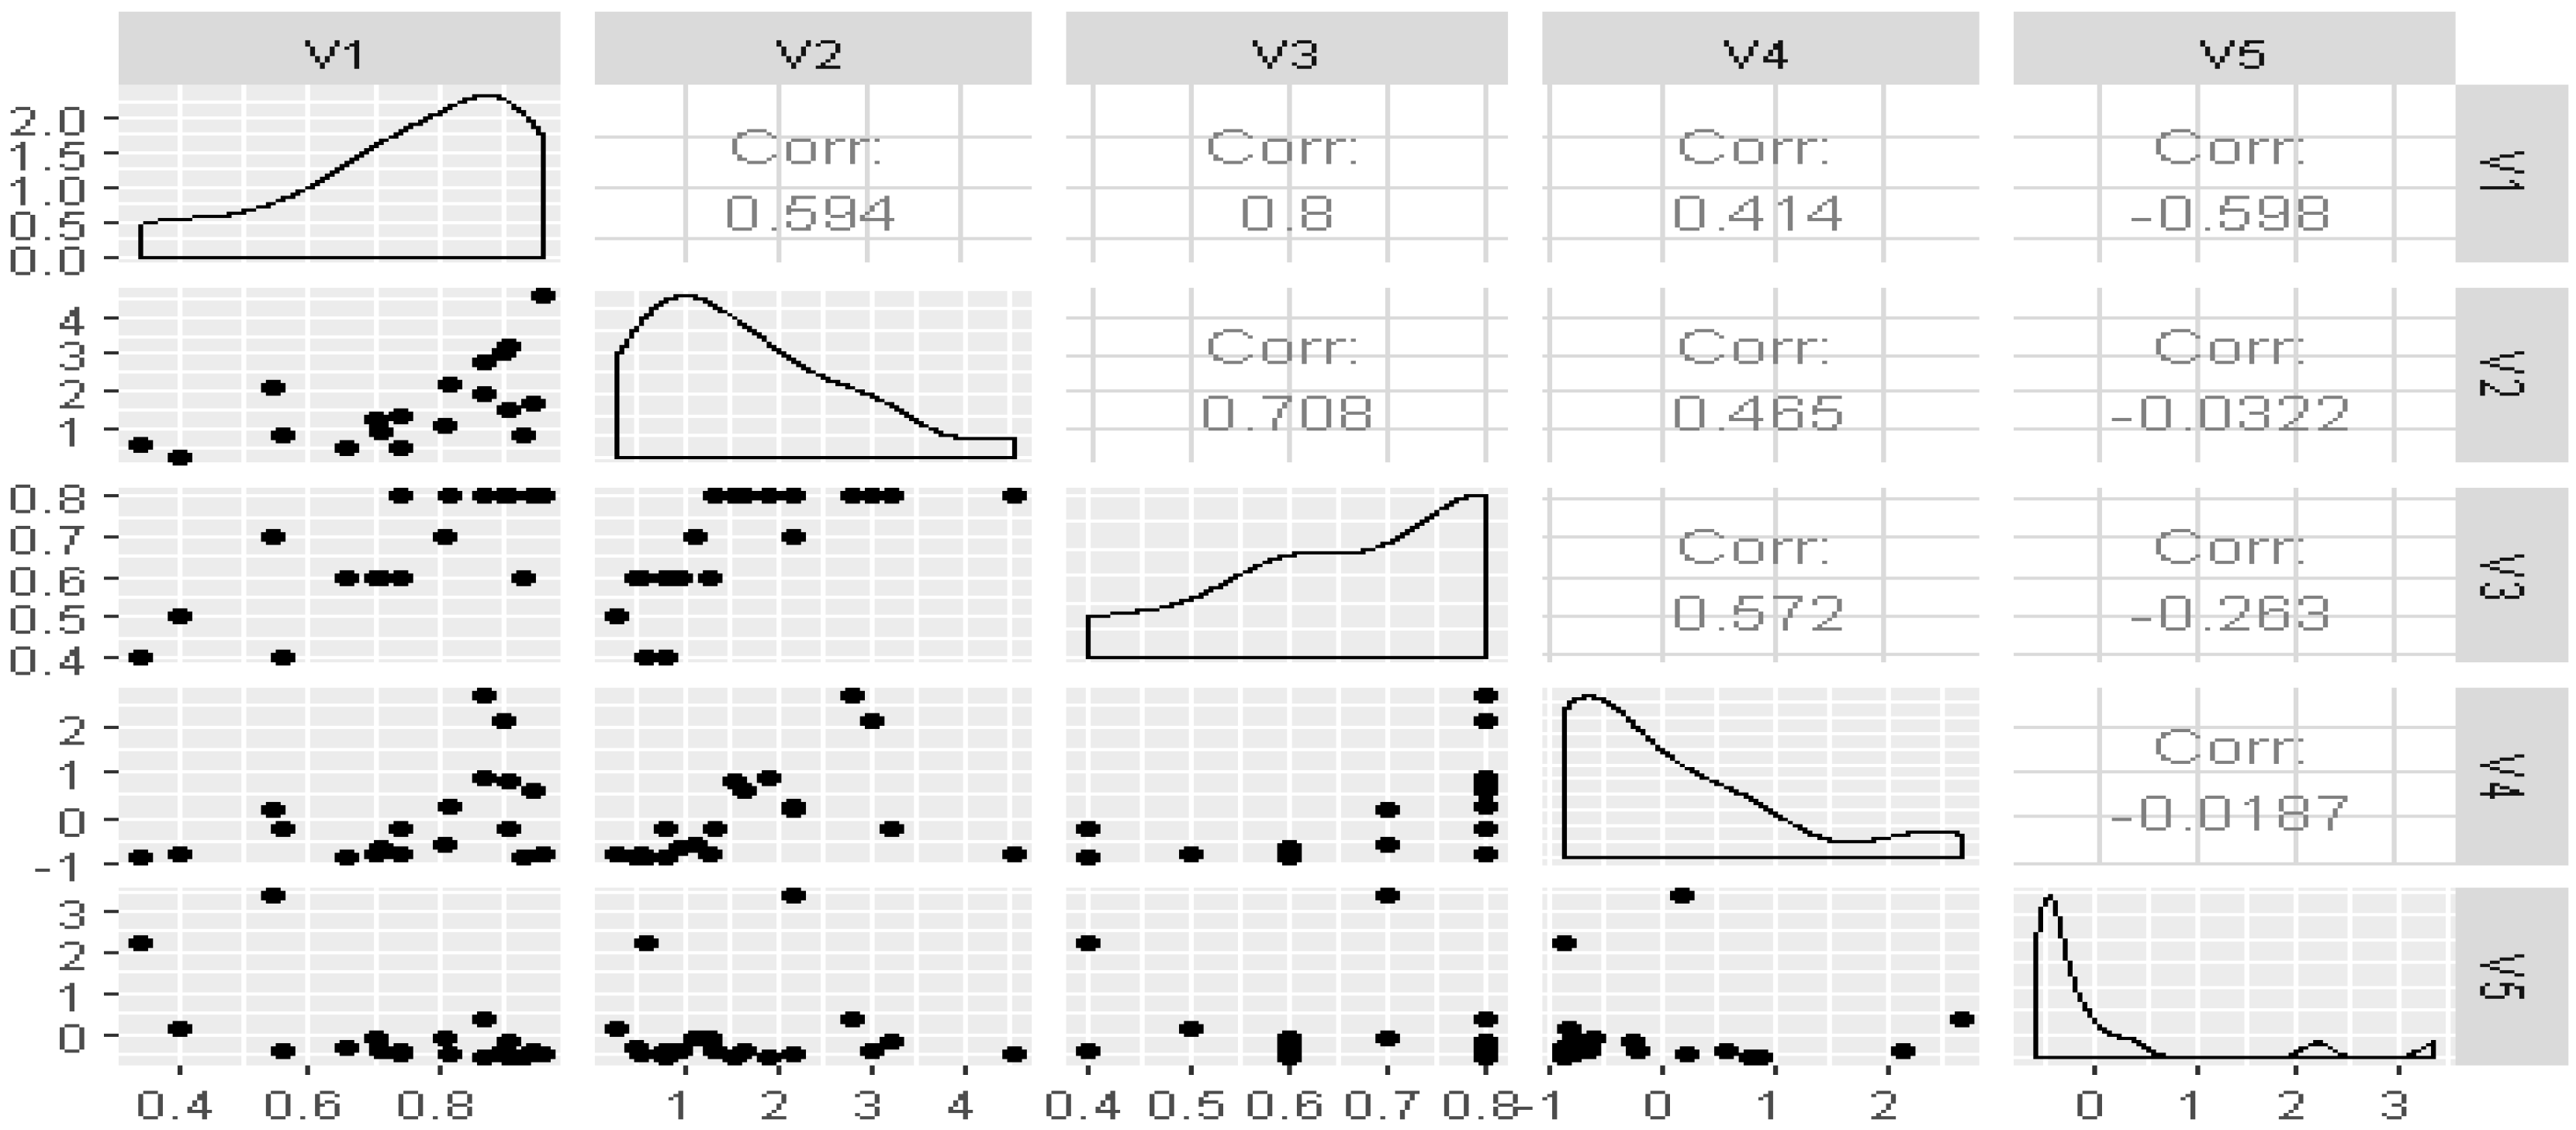
Figure 1 describes the distributions of digitalization indicators from set 1 and the correlations within set 1. The within-correlations range from −0.598 (
V1 Individuals using the Internet vs.
V5 Mobile cellular subscriptions) to 0.8 (
V1 Individuals using the Internet vs.
V3 Human Capital Index).
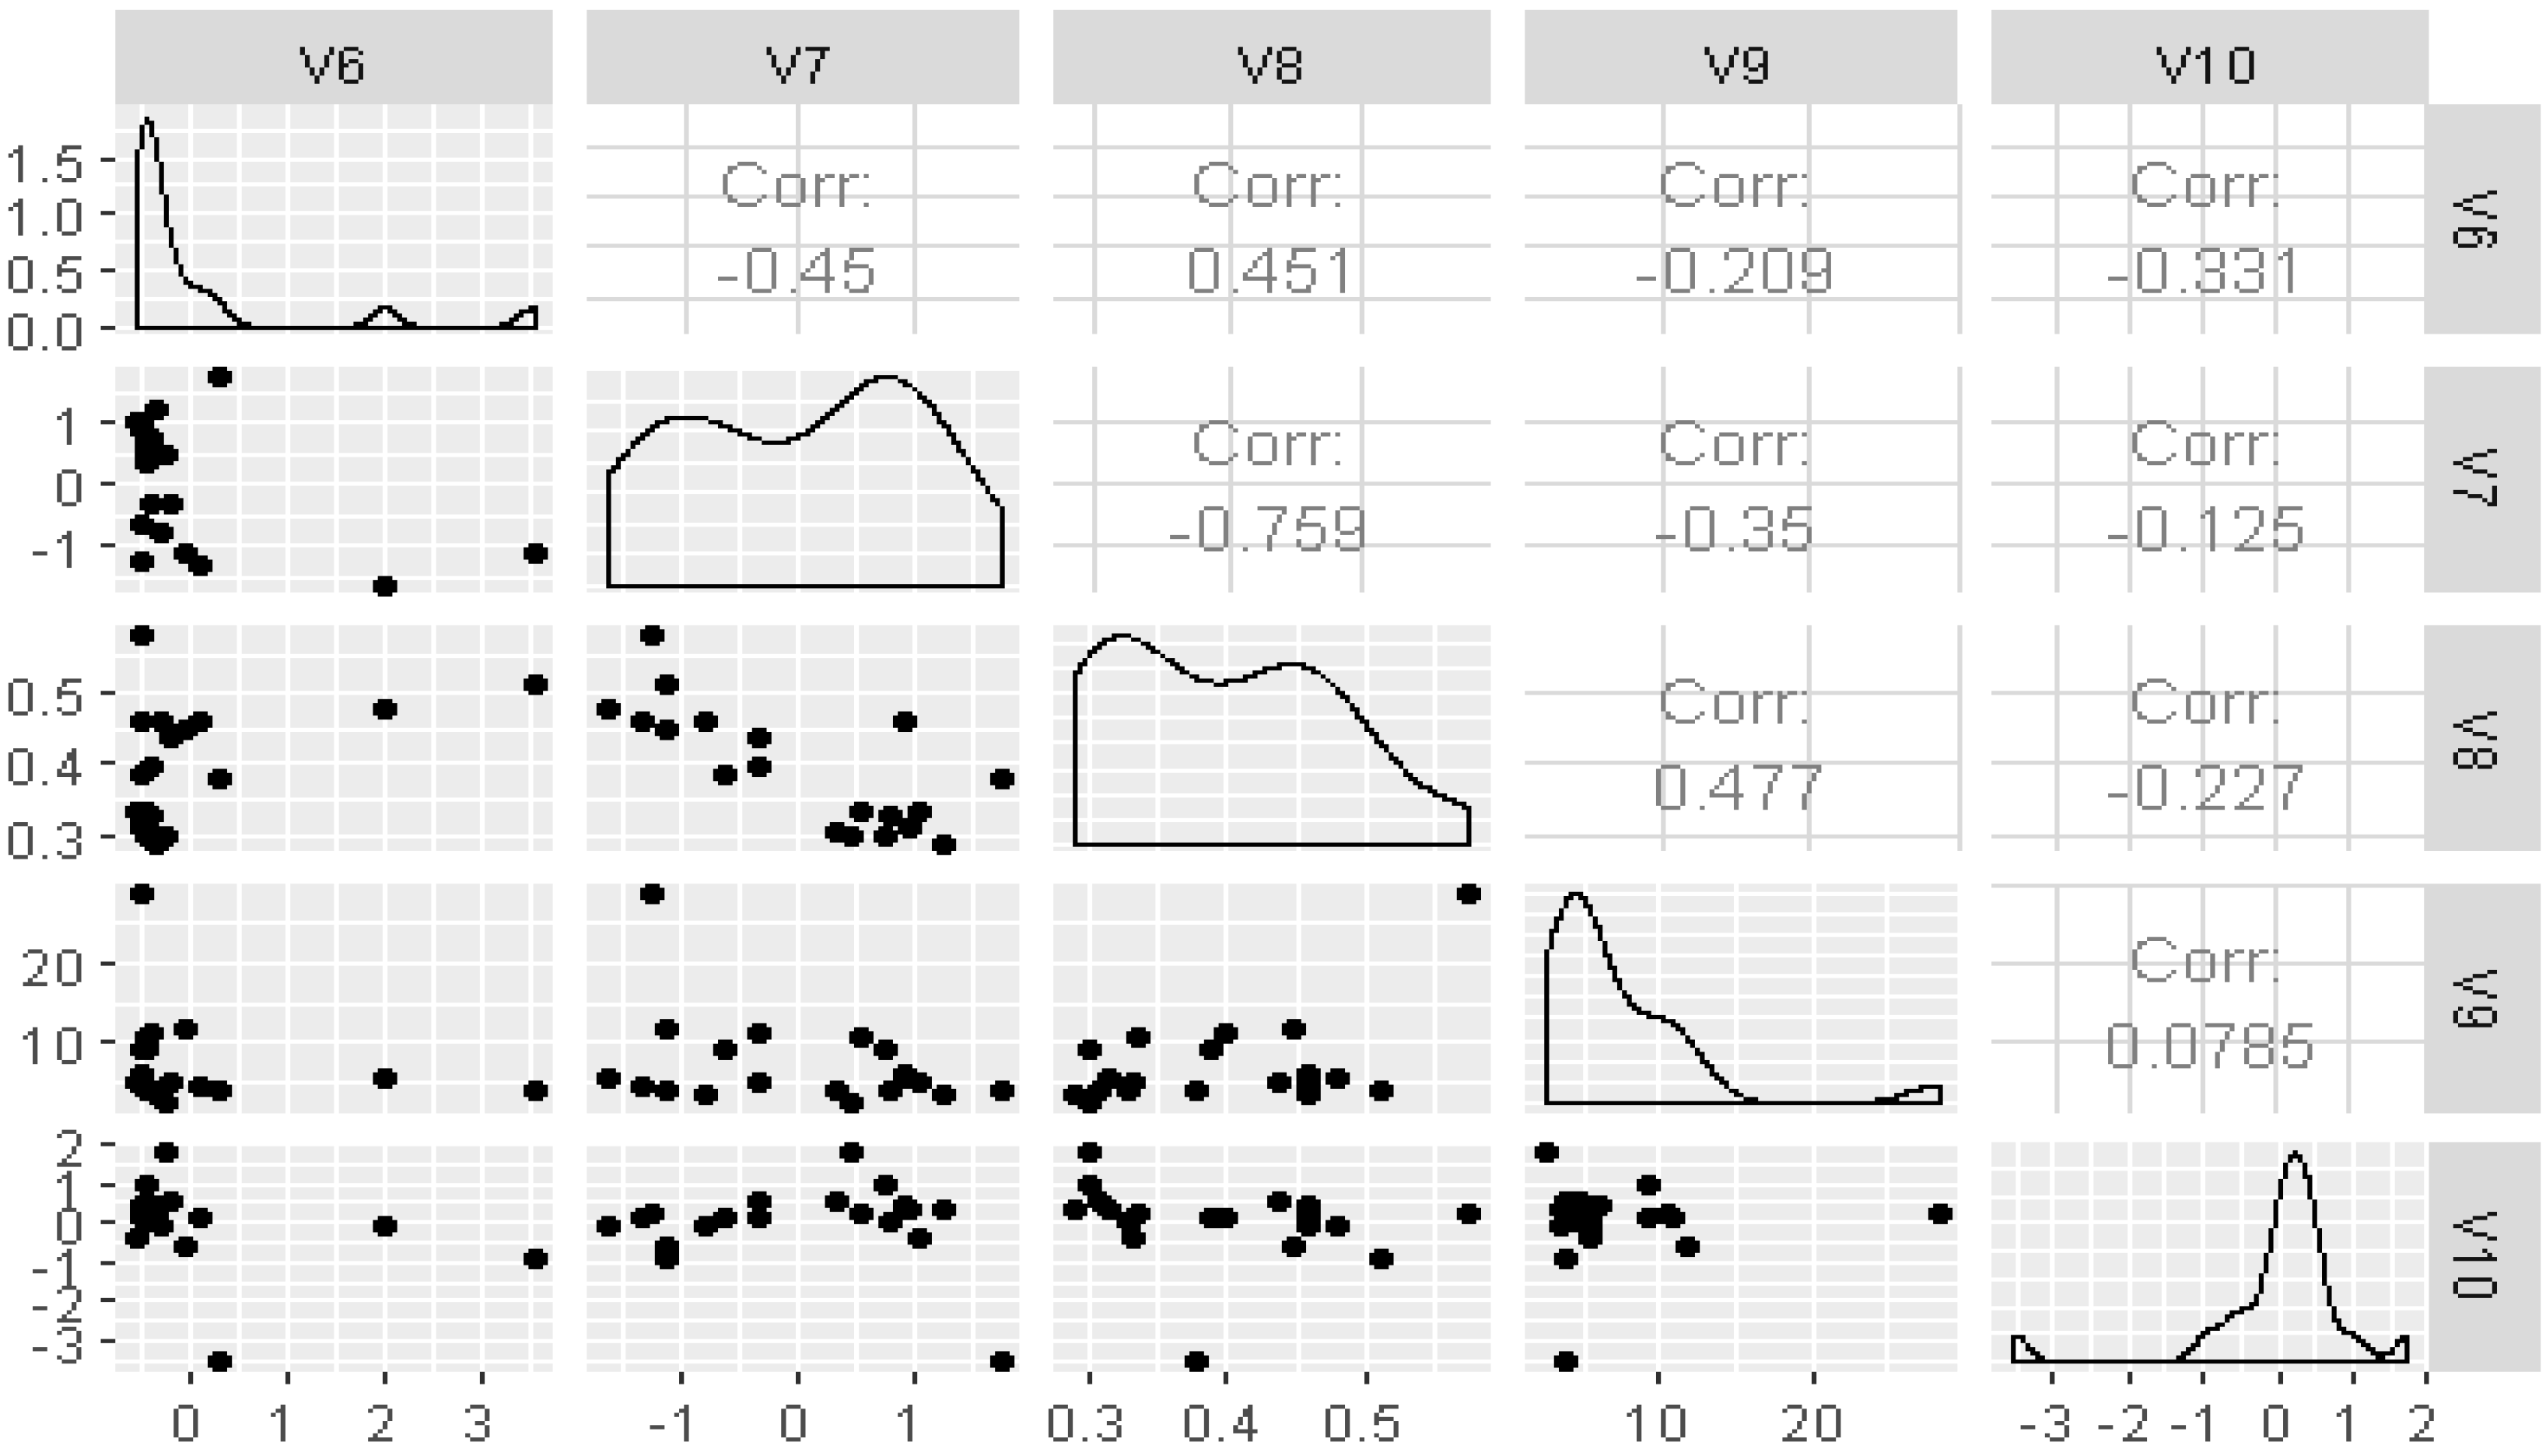
Figure 2 describes the distributions of labor force indicators from set 2 and the correlations within set 2. The within-correlations range from −0.759 (
V7 GDP per capita vs.
V8 Gini index) to 0.477 (
V8 Gini index vs.
V9 Total unemployment).
The positive correlation between GINI index and total unemployment is consistent with economic theory since when unemployment rate decreases, GINI index will also decrease. Penha Cysne in 2009 [
37] gives a theoretical proof (Proposition 3) of the positive relation between unemployment and GINI index of income distribution. The authors prove that both indicators are increasing functions of the probability of lay-off and the probability that a worker does not get a job offer; accordingly, when any of these probabilities increases, there is a positive relation between unemployment rate and GINI index. Several studies on CCA have been conducted by Dattalo [
38] and Gonzales et al. [
39]. By applying CCA, we determined the number of canonical variables significant in explaining the dependence between the two sets, digitalization and labor force indicators.
3.2. CCA Model
We denote here the independent set
and the dependent set
. There are the five pairs of canonical variates of the model below.
can be written as a linear combination of the elements of set
X and
as a linear combination of elements of set
Y as follows:
The canonical correlation for the ith canonical pair is the correlation between and : , .
The aim of CCA is to find the linear combination that maximizes the canonical correlation for the canonical pairs .
The main steps of CCA are:
- (i)
To determine if there is any relationship between the two sets of variables. By Wilks lambda, we reject the null hypothesis that there is no relationship between the two sets and conclude that they are dependent;
- (ii)
The null hypothesis from above is equivalent to the null hypothesis that all five canonical variate pairs are not correlated: . Wilks lambda is significant and the canonical correlations are in a decreasing order, therefore we conclude that at least . Successively we find that the first two canonical pairs are correlated and the other three are not;
- (iii)
To interpret each canonical variable, we compute the correlation between each variable and the corresponding canonical variate;
- (iv)
Finally we find the best predictors for each variable in the dependent set.
The first step of CCA is to discover whether there is any relationship between the two sets
X and
Y. For this one considers a multivariate multiple regression model, where one predicts the labor force indicators (set
Y) from the digitalization indicators (set
X). We have five multiple regression equations, each one predicting one of
Y variables from the five variables in set X:
We test the null hypothesis that the regression coefficients from above are equal to 0, which is equivalent to testing that the two sets of indicators X and Y are independent.
Pillai’s trace test, Hotelling’s trace test, and Wilk’s lambda multivariate criteria are significant, with
p < 0.05. All tests in
Table 2 prove that there is a statistically significant and positive linear relationship between the dimensions of digital competitiveness and labor force indicators.
The CCA analysis generated five roots, as they can be seen in
Table 3. The roots rank the eigenvalues in a decreasing order.
The eigenvalue can be computed as the ratio between the corresponding squared correlation and one minus the squared correlation, for example the largest eigenvalue 223.64 can be computed as 223.64 =
. Canonical correlations represent Pearson correlations of the pairs of canonical variates. The first canonical correlation, 0.99777 represents the correlation coefficient between the first pair of canonical variates. Squared canonical correlations of the canonical variate pairs are interpreted as
from linear regression. Namely, 99.55% of the variation in
is explained by the variation in
; 89.75% of the variation in
is explained by the variation in
etc. These values are very high, suggesting that the first two canonical correlations are the most significant. In
Table 4, we test the null hypothesis that all correlations associated with the roots are equal to 0. The above hypothesis
is equivalent to the null hypothesis that all pairs of canonical variates are not correlated:
Since Wilks lambda is significant and the canonical correlations are decreasingly ordered, we can say that at least
. Next, we test the hypothesis that the remaining pairs of canonical variates are correlated:
Since p < 0.05, we conclude that the second canonical variate pair is correlated, .
The last three tests are not significant, since p > 0.05.
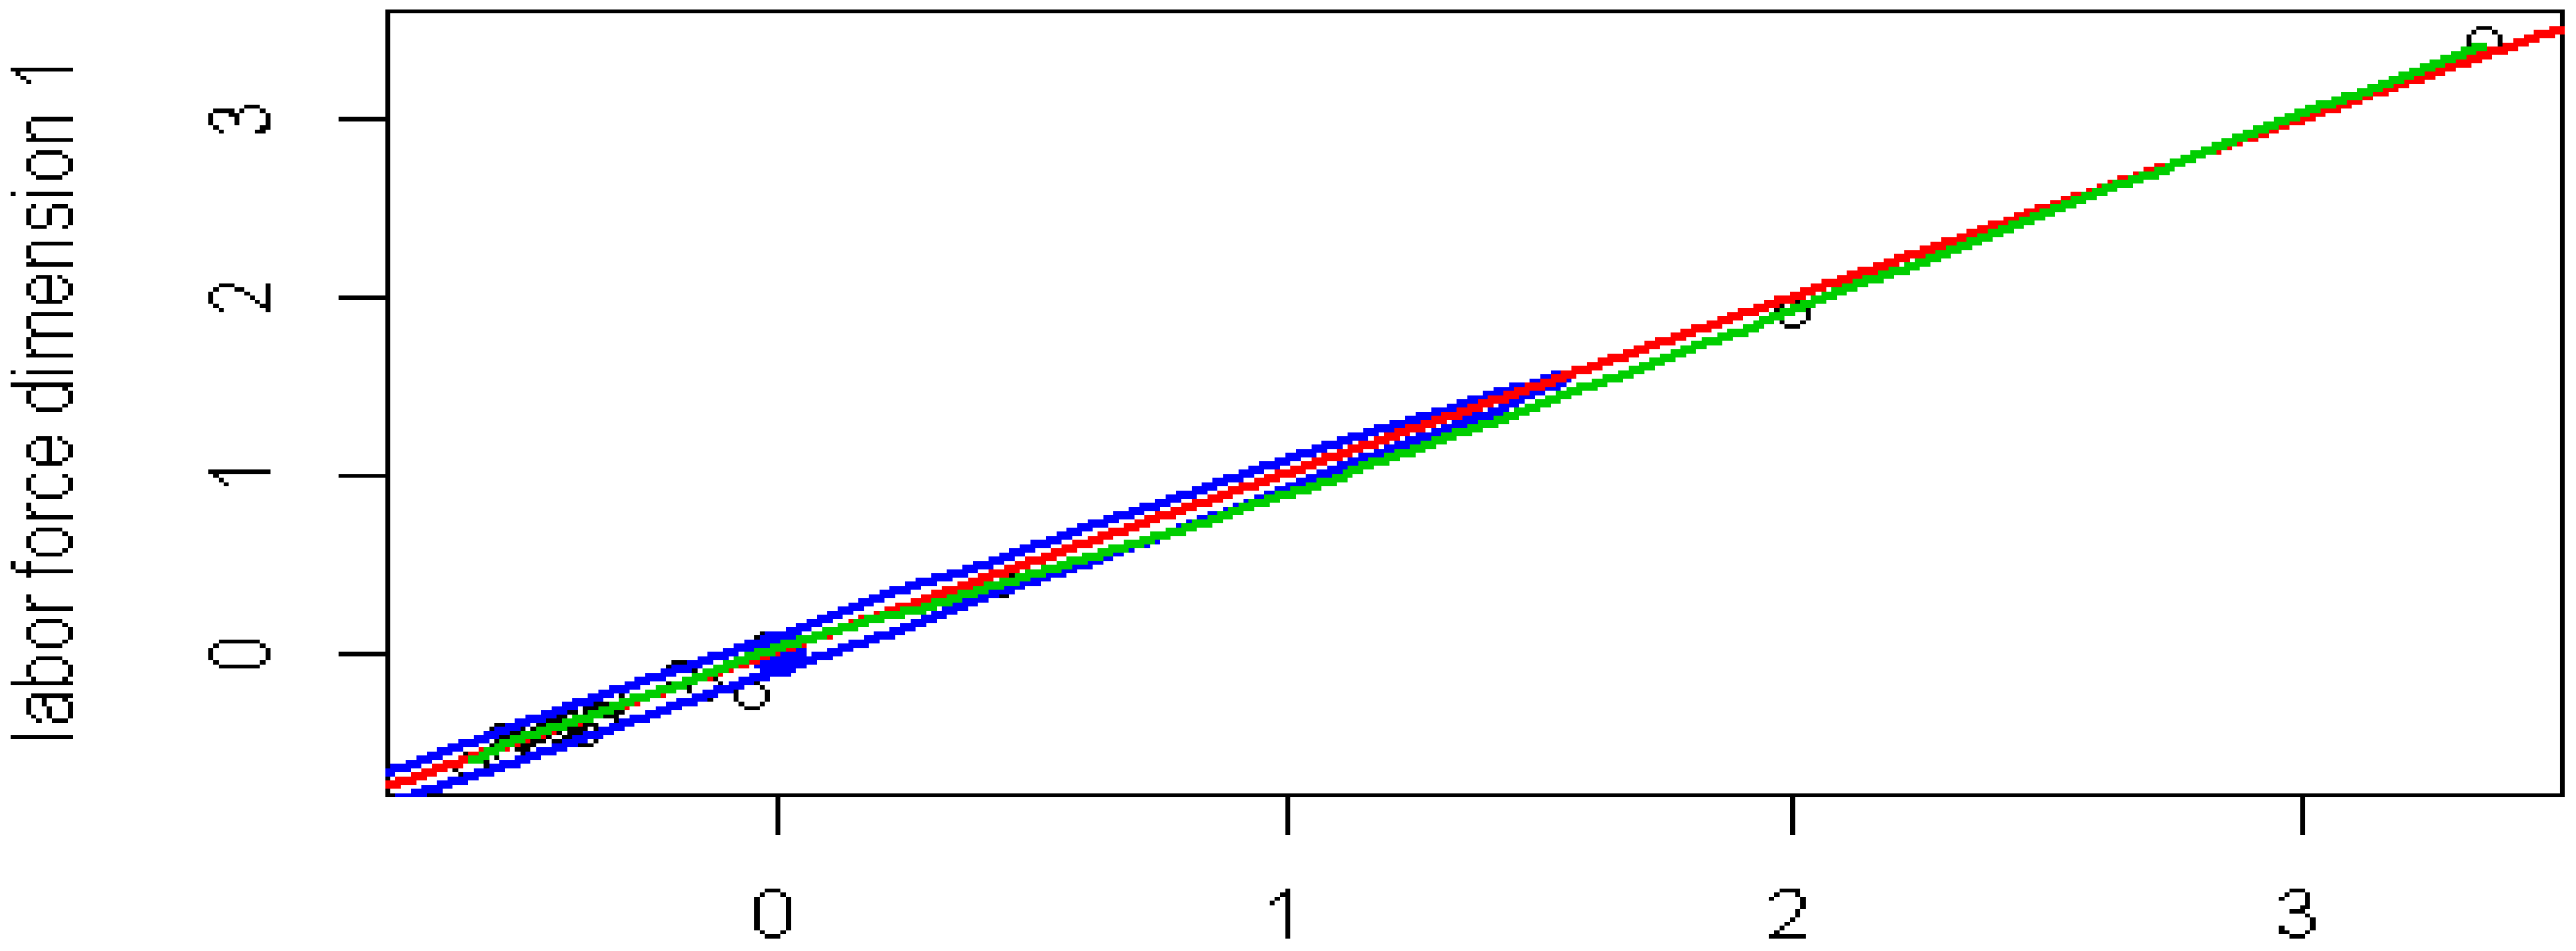
As it can be seen in
Figure 3, the first canonical variate for labor force is plotted against the first canonical variate for digitalization. The regression line shows a good fit of the model.
Next we have determined the raw and standardized canonical coefficients for the dependent variables in
Table 5 and
Table 6.
The raw canonical coefficients are interpreted as in the linear regression models, considering the canonical variates as outcome variables. For example, a one-unit augmentation in variable
V6 total labor force leads to a 0.997 increase in the first variate of labor force measurement (
Table 5). The standardized canonical coefficients are analyzed with respect to scaled variables with mean zero and standard deviation 1. For example, an increase in one standard deviation in variable
V6 (total labor force) leads to a 1.02437 standard deviation increase in the first variate of labor force measurement (
Table 6).
Using the coefficient values in the first column of
Table 5, the first canonical variable for labor force can be written:
In the above interpretation, the magnitude of the coefficients gives the contribution of the variables to the canonical variable. The magnitude also depends on the variances of the variables; the data standardization (
Table 6) has no impact on the canonical correlation.
Looking at the first canonical variable for labor force (
Table 7) we can see it is strongly dominated by
V6 total labor force, with a Pearson correlation coefficient 0.99775. The second canonical variable for labor force is strongly negatively dominated by
V7 GDP per capita with a Pearson correlation coefficient −0.90355. For the remaining canonical variables for labor force, none of the correlations are sufficiently large, therefore, these canonical variables yield little information about the data. The correlations below are significant when their absolute values are above 0.45.
In
Table 8, 29.886% of the variance among a dependent set labor force is explained by the first dependent canonical variate, while 29.75% is explained by the first covariate canonical variate. Similarly, 33.47% of the variance among labor force is explained by the second dependent canonical variate, while 30.04% is explained by the second covariate canonical variable.
Next we have determined the raw and standardized canonical coefficients for the covariates in
Table 9 and
Table 10.
A one-unit increase in variable
V1 (Individuals using the Internet) leads to a 0.2255 augmentation in the first variate of digitalization measurements (
Table 9). An increase of one standard deviation in variable
V1 (Individuals using the internet) leads to a 0.04153 standard deviation increase in the first variate of digitalization measurements (
Table 10). The first canonical variable for digitalization can be written:
The correlations from
Table 11 show the relative contribution of each covariate to each canonical variable.
Looking at the first canonical variable for digitization (
Table 11) we can see it is strongly dominated by
V5 (Mobile cellular subscriptions) with a Pearson correlation coefficient 0.99632. The second canonical variable for digitization is strongly negatively dominated by
V1 (Individuals using the Internet),
V2 (Research and development expenditure),
V3 (Human Capital Index) and
V4 (Secure Internet servers). For the remaining canonical variables for digitization, none of the correlations are sufficiently large, therefore, these canonical variables yield little information about the data. The correlations are significant when their absolute values are above 0.45.
In
Table 12, 26.11% of the variance among the covariate set digitalization is explained by the first dependent canonical variate, while 26.23% of the variance is explained by the first covariate canonical variate.
Similarly, 45.37% of the variance among digitalization is explained by the second dependent canonical variate, while 50.55% is explained by the second covariate canonical variate.
In
Table 13, one can see the regression analysis results of the effect of the digitalization indicators on each work force indicator. Beta value measures the importance of each covariate.
Based on the calculations above, we reach the following conclusions:
The effect of V5 (Mobile cellular subscriptions) is more important than the effect of V3 (Human Capital Index) when predicting V6 (Total labor force).
The effect of V1 (Individuals using the Internet) is more important than the effect of V4 (Secure Internet servers) when predicting V7 (GDP per capita).
The effect of V3 (Human Capital Index) is more important in absolute value than the effect of V5 (Mobile cellular subscriptions) when predicting V8 (GINI index).
The effect of V3 (Human Capital Index) is more important in absolute value than the effect of V5 (Mobile cellular subscriptions) when predicting V9 (Total unemployment).
The effect of V4 (Secure Internet servers) is more important in absolute value than the effect of V5 (Mobile cellular subscriptions) when predicting V10 (Net foreign direct investment).
3.3. A New Composite Index Named Digital and Labor Force Index for Measuring the Correlation between Labor Force and Digitalization
Following OECD methodology [
40,
41] and Georgescu and Kinnunen [
36] we will build a composite indicator containing the two datasets, digitalization and work force indicators. The purpose of the composite indicator is to make simpler comparisons of the 19 countries in order to illustrate complex problems such as the impact of digitalization on labor force. First we apply principal component analysis (PCA), according to Jolliffe [
42] and retain a number of principal components according to a specific criterion. Kaiser–Meyer–Olkin test has the value 0.703 > 0.5, meaning that PCA is suitable for this dataset. Bartlett’s test of sphericity has the value 0 (less than 0.05) indicating that a factor analysis is suitable.
According to
Table 14, to obtain a good representation of the original data, we apply the variance-explained criterion and we retain three principal components which explain 85.245% of the total variance.
Then, we build a compound index denoted by PC whose coefficients are computed as the ratios between the proportion of the variance explained by each component and their total explained variance:
The elements of the PC vector are computed as the ratios above multiplied by the loadings corresponding to each variable found in the component matrix (
Table 14). For example, the coefficient of PC representing
V1 (Individuals using the Internet) is calculated as:
The composite index denoted here by DLFI will have the form:
DLFI = 0.174438 × Individuals using the Internet + 0.404986 × Research and development expenditure + 0.396978 × Human Capital Index + 0.351864 × Secure Internet servers per million people + 0.293551 × Mobile cellular subscriptions + 0.299775 × Total labor force + 0.27658 × GDP per capita + (−0.23196) × GINI index + (−0.4516) × Total unemployment + (−0.21909) × Net foreign direct investments.
The composite index DLFI is built with standardized data. Its values will be rescaled to the interval (0–100) by using the min-max normalization formula [
43,
44]:
where
and
is the
ith normalized data.
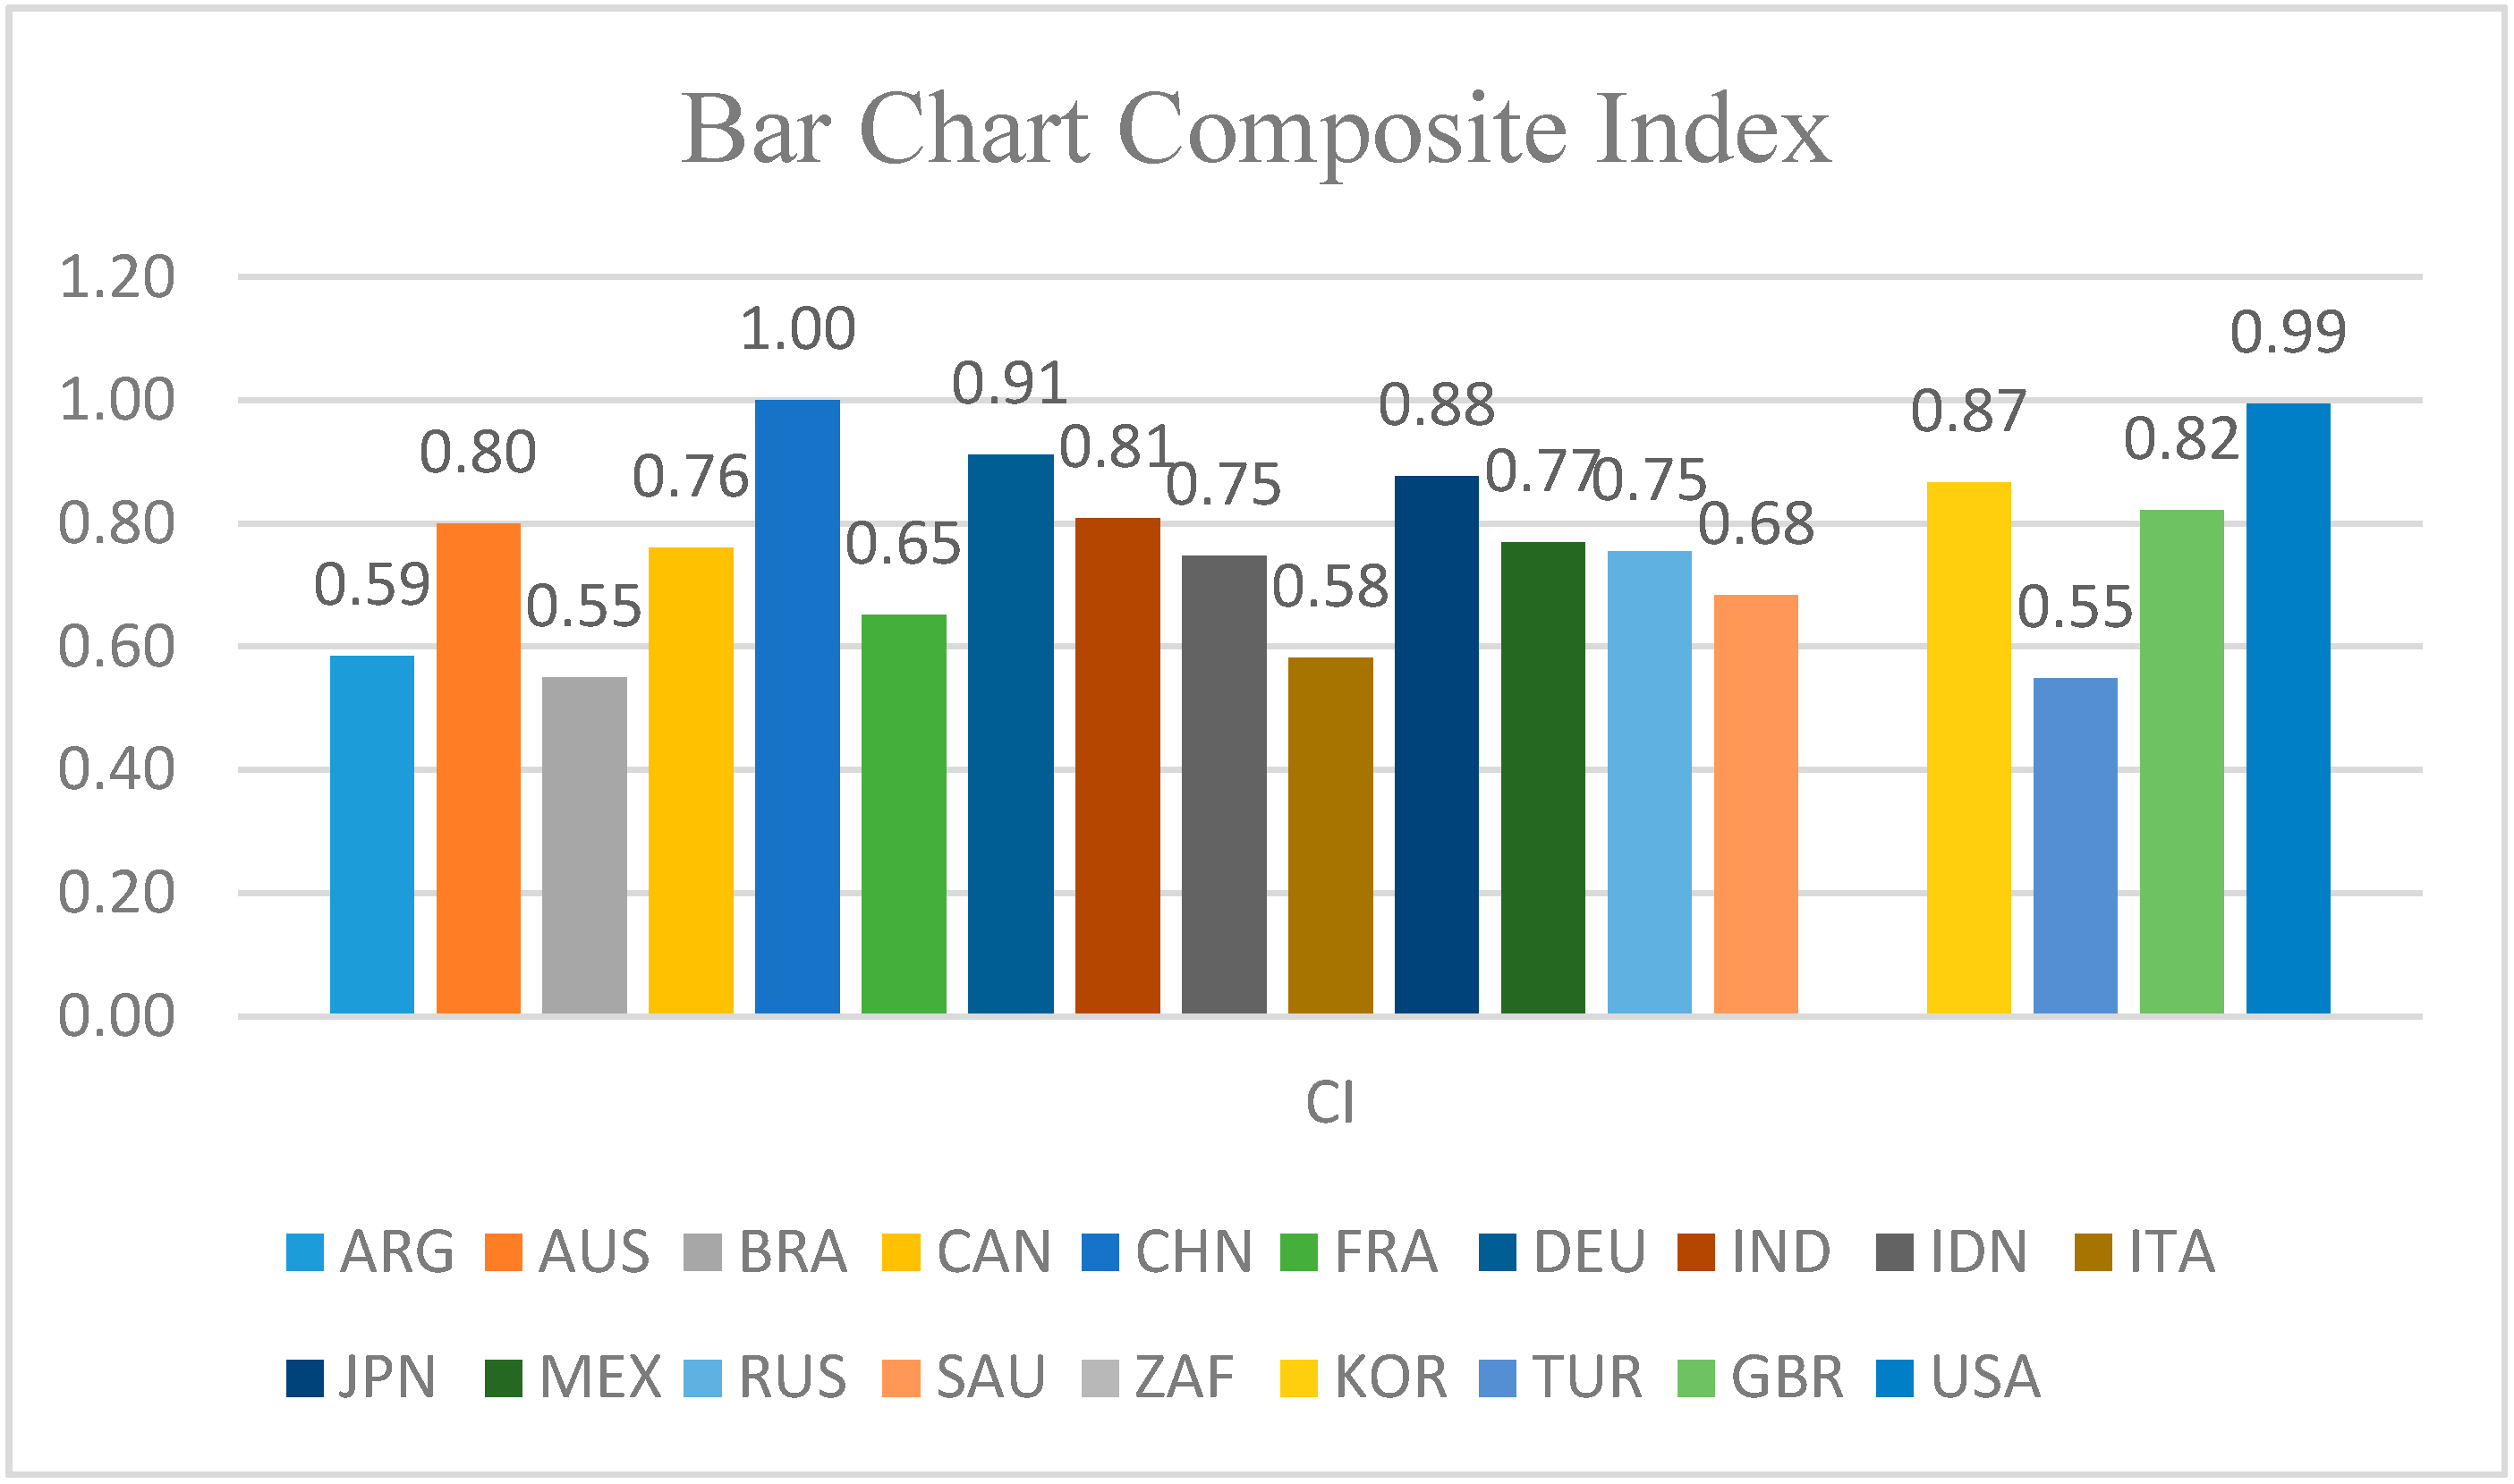
In
Figure 4, the Bar Chart Composite Index for the 19 countries is presented.
In the group of 19 developed countries, China takes the first place (DLFI = 1), followed by United States (DLFI = 0.99) and Germany (DLFI = 0.91). China’s top position in this ranking is due to its being among the global leaders in some key digital industries. According to [
45], some of these key digital industries are e-commerce, where China holds over 40% of global transactions, penetrating into US market by 10%, followed by fintech. China’s consumption relative to mobile payments by individuals amounts to 790 billion USD in 2016 [
46], 11 times more than US. A report of the European Investment Bank from 2020 [
45] shows that many digital technology companies are located in China or US. In EU, digital adoption rate is smaller than in US; the same report [
45] shows that 66% of the manufacturing companies from EU and 78% of the US companies have adopted at least one technology. Germany ranks third because the adoption rate for German robotics, 3D and virtual reality technologies is above EU and US average [
46]. For the manufacturing companies, Germany is above EU average in adopting digital technology. In this ranking, South Africa occupies the last position because manufacturing companies lack advanced factory automation and high connectivity. According to Harvard Business Review [
47], six countries from different African regions distinguish themselves with respect to how digital technology drives economic development: Egypt, Ethiopia, Kenya, Rwanda, Nigeria and South Africa. South Africa is seen as the regional leader in digital jobs creation, having a favorable environment and regulations that encourage digital business. According to Chakravorti and Chaturvedi (2019) South Africa has 64% internet penetration and internet and mobile speed below the global median [
47].
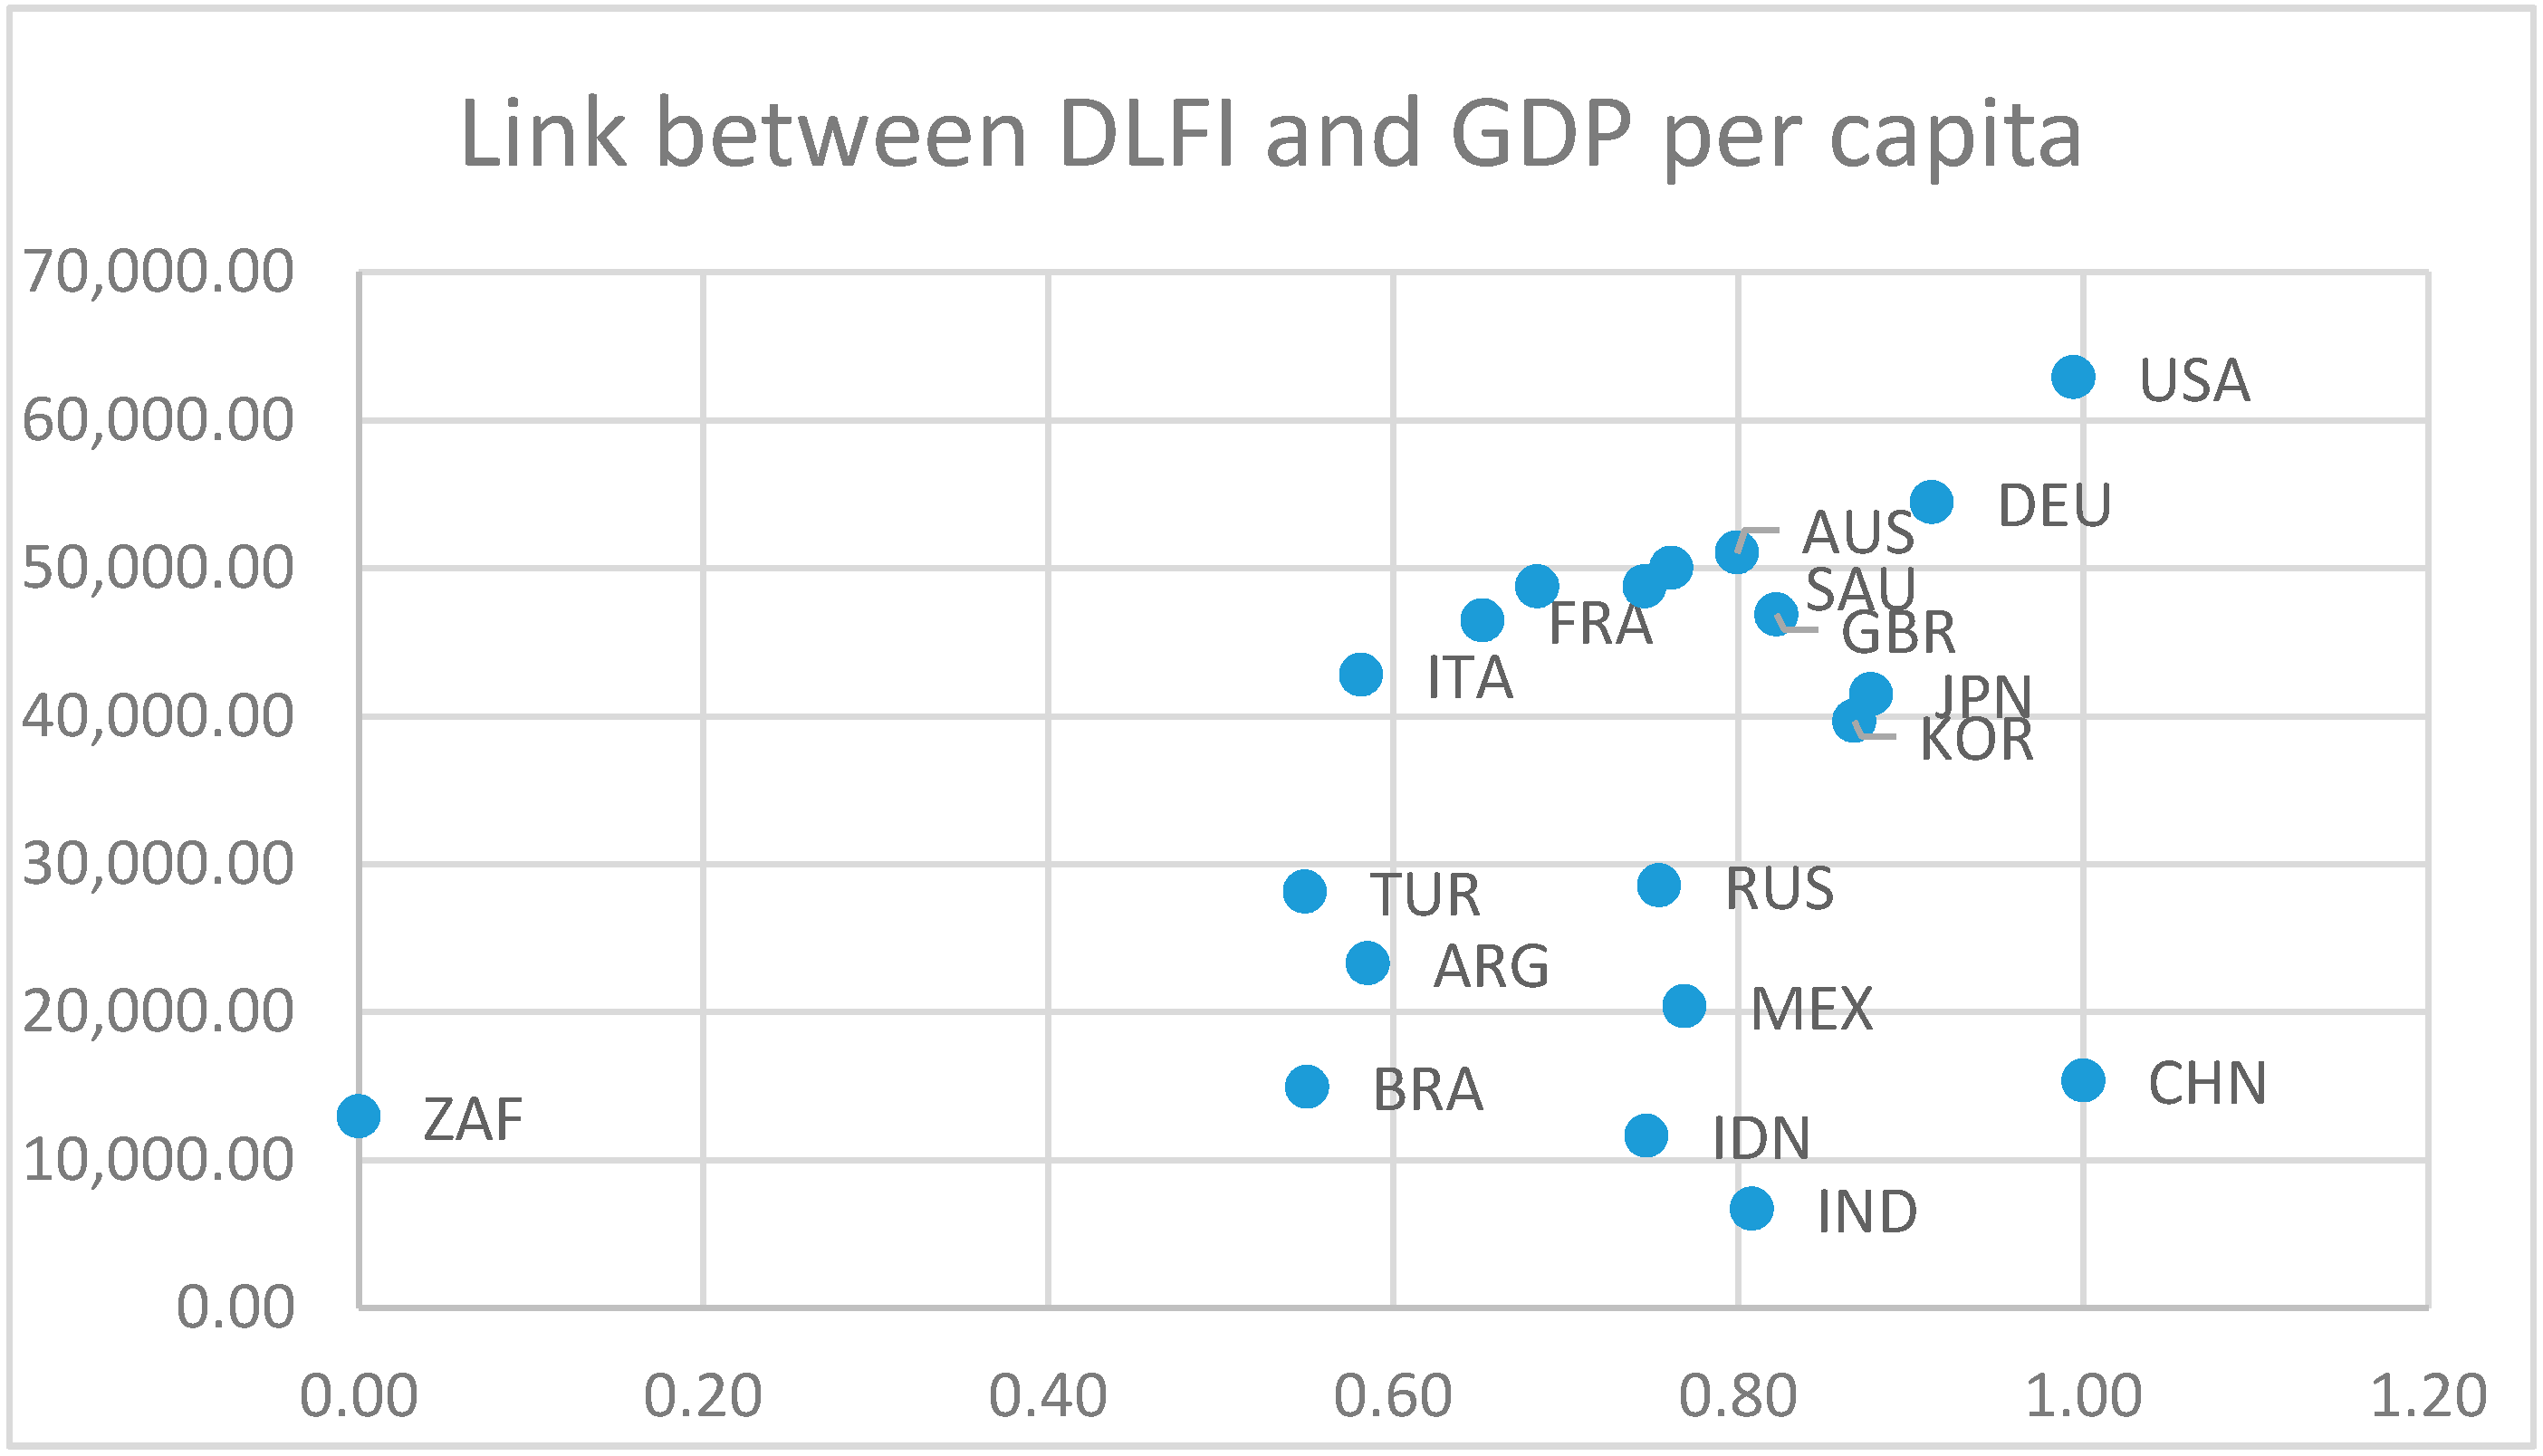
Usually composite indicators are measured with productivity growth, here described by GDP per capita. This composite indicator representation by means of GDP per capita helps assess the positions of countries with respect to labor force and digitalization competitiveness (
Figure 5).
As we can see, the high digitalized countries are expected to have high GDP per capita. South Africa is an outlier, having the smallest value of DLFI and a GDP per capita of USD 12,938.40. On the same map, USA and Germany are in a close position due to their similarities pointed out above.


 ,
, 


