Article

Globalization and Regionalization: Empirical Evidence from Itinerary Structure and Port Organization of World Cruise of Cunard

1
Key Laboratory of Regional Sustainable Development Modeling, Institute of Geographic Sciences and Natural Resources Research, Chinese Academy of Sciences, Beijing 100101, China
2
College of Resource and Environment, University of Chinese Academy of Sciences, Beijing 100049, China
3
French National Centre for Scientific Research (CNRS), UMR 8504 Géographie-cités, 13 rue du Four, F-75006 Paris, France
*
Authors to whom correspondence should be addressed.
Sustainability 2020, 12(19), 7893; https://doi.org/10.3390/su12197893
Submission received: 1 August 2020 / Revised: 14 September 2020 / Accepted: 21 September 2020 / Published: 24 September 2020
(This article belongs to the Collection Sustainable Maritime Policy and Management)

Abstract

:
Cruise tourism is an obviously global industry in different dimensions. From a geographical perspective, cruise ships are mobile and capable of being repositioned at a company’s notice, which forms the inherent basis for its global spatial layout. As a branch of the cruise industry, the world cruise is clearly globalizing in geographical space by offering long itinerary, even round-the-world trips, for everyone. Using the schedule data from 2018 to 2019, this paper analyzes the spatial characteristics of the itinerary and port organization of Cunard, a world cruise company. We find that the itinerary distribution and port organization of Cunard are both globalization and regionalization, and the latter is the core and main component of the former. Under the influence of the COVID-19 epidemic, the global mobility of cruises has ground to a halt, while local mobility offers the possibility of its resumption as soon as possible. Turning to the regional voyage with the shorter and simple itinerary is feasible for Cunard and other world cruises, which is conducive to the realization of the resuming voyage as soon as possible. Moreover, strict boarding and safety onboard are essential.

Graphical Abstract

1. Introduction

Worldwide, the ocean cruise industry has an annual passenger compound annual growth rate of 6.63% from 1990 to 2020 [1], and it has become one of the most dynamic and fastest-growing industries in international tourism [2]. In recent decades, with the rapid growth of the cruise market, cruise ships have spread all over the world, in many geographical areas, from the Caribbean Sea, the Mediterranean Sea, Alaska to Asia [3,4,5,6,7]. This leads to obvious geographical differences of cruise ships, such as navigation areas and port of call, and provides passengers with various choices related to durations and itinerary [8]. In most cases, itineraries typically last from 3 days up to 12 days, with the average cruise lasting 7.2 days [9]. These types of itineraries are usually provided by Royal Caribbean International Cruises or Carnival Cruises [10,11]. However, there are still some longer journeys, even lasting for four months. They are usually called world cruises or round-the-world cruises [8,12]. Compared with other types of cruise ships, their main customers are the elderly, and their service quality is higher [13,14]. Despite the importance of the cruise industry and the increasing amount of scholarly literature that analyzes the main features and trends of the cruise economy [15,16], traffic [5,12,17], or tourism [18,19], the world cruise is an under-researched, even neglected area of research within the literature in geography for a long time [8].
The cruise experience is a personal, highly emotional, memorable event that is created on the cruise ship and visited ports of call during the multi-sensory high-quality service interactions between service providers and guests [20]. Cruise passengers’ experience on different cruise ships and itineraries is differentiated. During the last century, world cruise has become the ultimate travel experience [8], because of its special itinerary and the spatial mode of destination ports [8]. According to Ward (1995) [21], the first official world cruise was pioneered by the Cunard Line in 1922, providing an itinerary that included many ports of call, and it is still welcomed by the world cruise passengers today. Pallis (2015) [9] found that these world cruises usually belong to luxury cruises, including Cunard Line, Seabourn, Regent Seven Seas Cruises, and Crystal Cruises, with a market share of only 1.9%, and Cunard accounted for 1.1% in 2013. No other company carries more cruise passengers on world voyages than Cunard. Therefore, it can be said that the Cunard cruise is the pioneer and even the leader of the world cruise. As a pioneer of cruise ships in the world, Cunard has nearly 180 years of experience in world navigation since its establishment in 1840. According to the official website of Cunard (see http://www.cunardline.cn/), all Cunard liners operate in the world cruises, including RMS Queen Mary 2, Queen Victoria, and MS Queen Elizabeth. In 2018–2019, they implemented 274 itineraries and involved 194 ports. Cunard ships cruise to almost all most popular shipped to travel destinations in the world, including the Caribbean, Mexico, Panama Canal, South America, Alaska, Africa, Europe (Mediterranean and Baltic/Scandinavia and Russia), North America east coast (New England and Canada), Asia, Australia, and New Zealand. Besides, cruise ships are often mixed with destinations in the Caribbean, British Isles, Norwegian Fjord, Canada, Canary Islands, Mediterranean, and Baltic.
As formerly mentioned, Cunard has held a very important position in the world cruise industry for a long time, and can be seen as the representative of the world cruise part. However, since the COVID-19 outbreak on cruise ships in February 2020, the entire cruise industry has been badly affected. From the current situation, a few cruises with short itineraries (up to 4 days) and even long itineraries (7 or 14 days) start sailing again in a region, but world cruises (more than 2 weeks up to 1–2 months) choose to extend its pause in operations, because of the global travel ban and the closed cruise ports. Given the current uncertainty, cruise lines decide to extend the resuming schedule for keeping safety and reputation, but it will further increase the financial burden. Cunard extends its pause in operations from November 2020 until 25 March 2021, for its ship Queen Elizabeth; until 18 April 2021, for Queen Mary 2 and until 16 May 2021, for Queen Victoria, while Costa and MSC, etc. have tried to resume some of their cruises [22]. There is no doubt that this is a huge challenge for Cunard.
In this context, we take the Cunard cruise as a case, and want to make it clear that the general geographical characteristics of the world cruises by analyzing the itinerary structure and port organization in the global space. Furthermore, this helps one to understand the current options and future resumption arrangements of Cunard under the influence of COVID-19, from a geographical perspective.
The organization of the rest of this paper is as follows. Section 2 reviews the literature concerning itinerary, cruise port, and cruise risk. Section 3 introduces data and research methods in this study. Section 4 analyzes the case of Cunard. The last section presents the conclusions and discussion.

2. Literature Review

2.1. Itinerary and Cruise Ports

Geographically, the cruise industry sells itineraries, not destinations [10], and the itinerary is the core element of cruise traffic [23,24]. As far as cruise ships are concerned, the itinerary of cruise ships does have a great influence on the occupancy rate of cruise ships [25]. Cruise companies need to innovate their itineraries in different areas to attract tourists, which are usually chosen by world cruise companies [26]. Furthermore, it significantly determines the differentiation and profitability of a cruise company [27]. The design of cruise itineraries is an issue of critical strategic and operational importance to cruise companies, because it is found to be a critical factor influencing customers’ selection of a cruise [28]. Cruise itinerary diversity allows cruise companies to target and appeal to different market segments and achieve high profitability by spreading operations, but the duration of the journey has to match the time availability and holiday patterns of the demand [27]. However, there is very little literature about cruise lines or cruise itineraries [29]. The itineraries of world cruise are more diversified and the time is longer, and ships can visit more cruise ports and regions [8]. World cruise ships are different from ordinary offshore cruise ships, which make full use of more and more ports of call and transit, and provide customers with excellent experiences in ports and destinations [30]. Mccalla and Charlier (2006) [31] found that a geographically long voyage will be divided into several short parts. This feature is considered as the common feature of the world cruise ships.
Actually, the design of a cruise itinerary is not a simple process, but a multi-criterion decision. A cruise itinerary includes cruise port (homeport, port of call), the itinerary planning and scheduling (duration, sailing time, the selection, time at ports) [27]. Among them, the cruise ports and the geographical distribution of cruise ports are an important factor [32]. The layout of cruise ports in different regions helps cruise ships navigate in different regions. However, some studies have investigated that the cruise hub port is determined by cruise itineraries [33], and port of call plays an important role in the cruise organization and the success of the itinerary [11]. Therefore, a single cruise port is meaningless on cruise itinerary or cruise networks. It must be a group of ports, similar to those in a global shipping network [34,35,36,37,38]. According to some literature, scholars have analyzed the cruise port system [11], cruise ports hierarchy [23], and cruise port centrality [26]. These studies not only provided a variety of empirical cases that facilitate theoretical advances of cruise geography, but also offered research methods to study the cruise port pattern of world cruises.

2.2. COVID-19 Risks to Cruise

The health and wellbeing of passengers and crew are an essential priority for the cruise [39], but the cruise industry is a crisis-prone industry [40]. Specifically, the norovirus (Nov) and influenza outbreaks have been the major public health challenges for the cruise industry for a long time [41]. However, the novel coronavirus (COVID-19) has been challenging the world since 2020. Starting with the Diamond Princess on 1 February 2020, at least 25 cruise ships had confirmed COVID-19 infections by 26 March 2020, and at the end of March, ten ships remained at sea, unable to find a port that would allow them to dock [42]. With no vaccine and limited medical capacity to treat the disease, the unprecedented health-related risk it is causing has evolved into a large-scale cruise crisis [43,44]. After more than five months without cruising, some cruise lines tried to restart operations [45], but for most cruises, return to operations is still very much unclear, especially with world cruises, and Cunard have stopped their operations until March 2021 [22].

3. Data and Methodology

3.1. Data

The data used in this study are mainly obtained from the schedule published on the official website of Cunard from 2018 to 2019 (http://www.cunardline.cn/). As the schedule published on the official website is earlier than the actual sailing time of cruise ships, there may be some changes in the berthing port during the actual sailing. The scheduled cruise ship on the website of the third-party travel platform can also be accessed to ensure the reliability and authenticity of the research data. This includes the Global Cruise Network (http://www.qyoulun.com/), the Most Cruise (http://www.zyoulun.com/), and other websites, which publish the revised individual itineraries.

3.2. Methodology

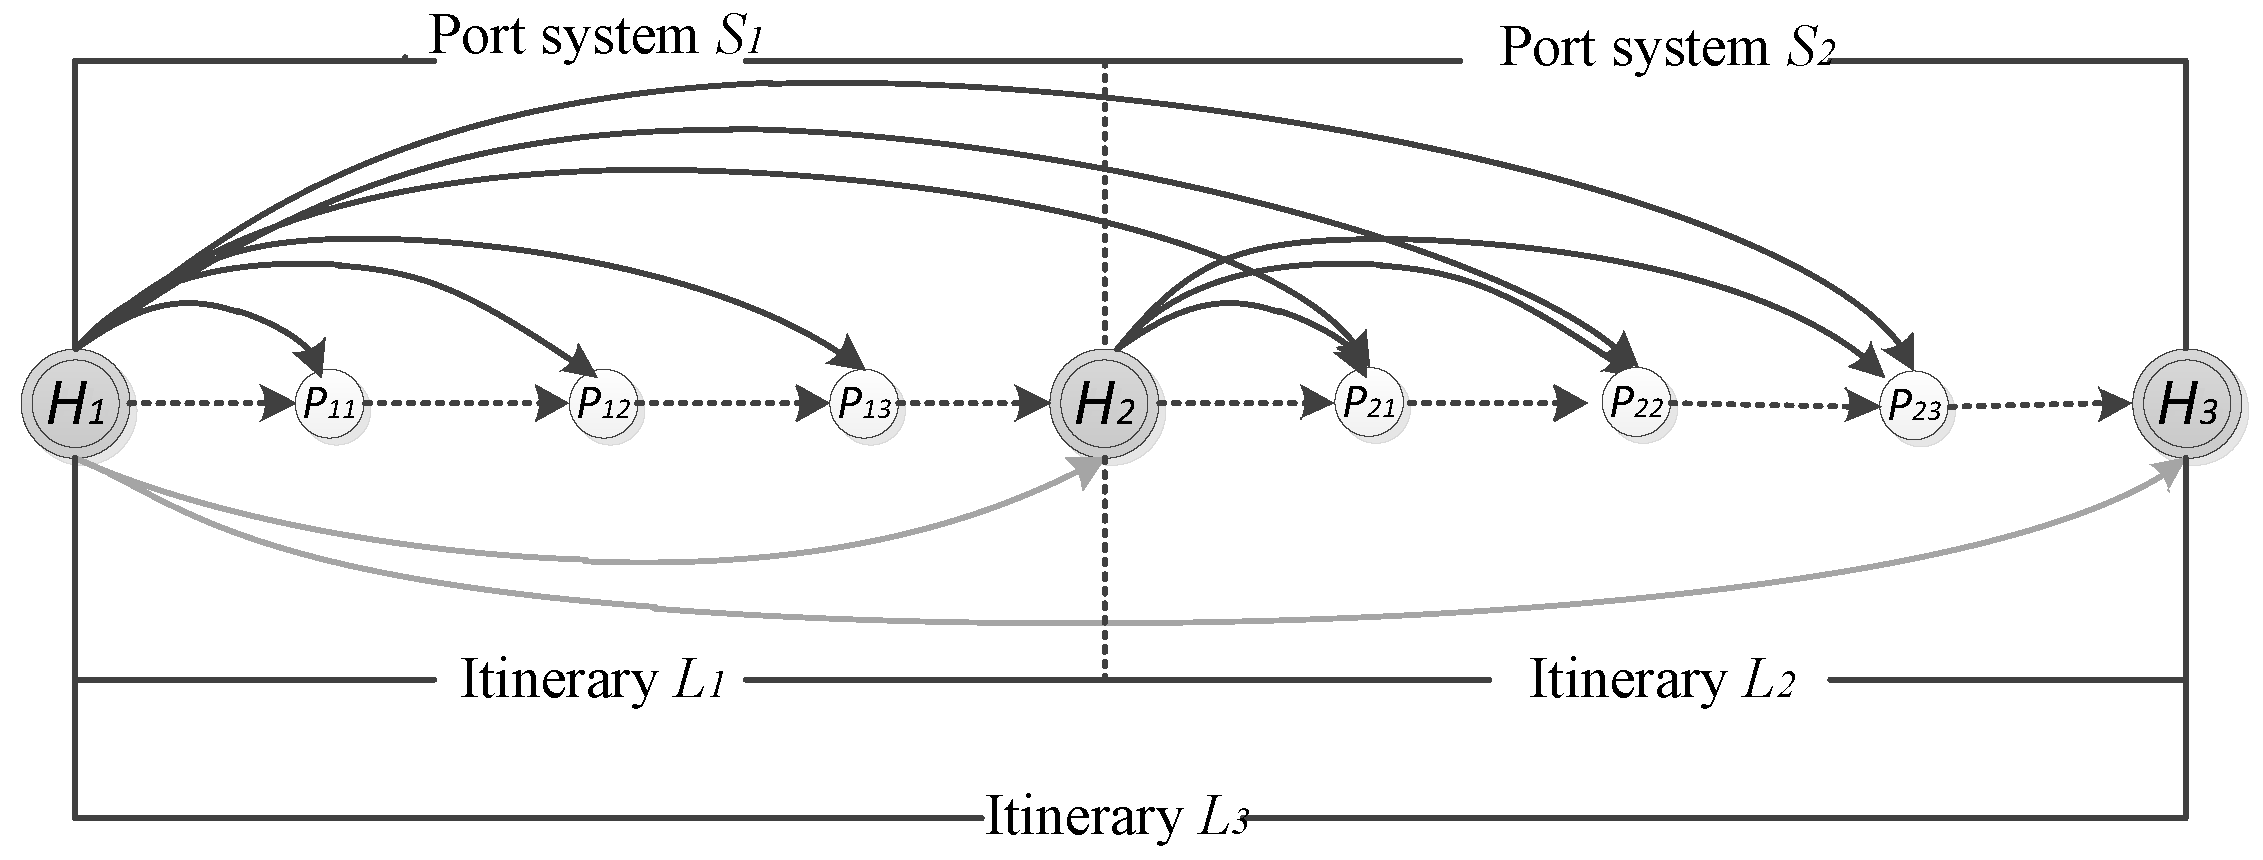
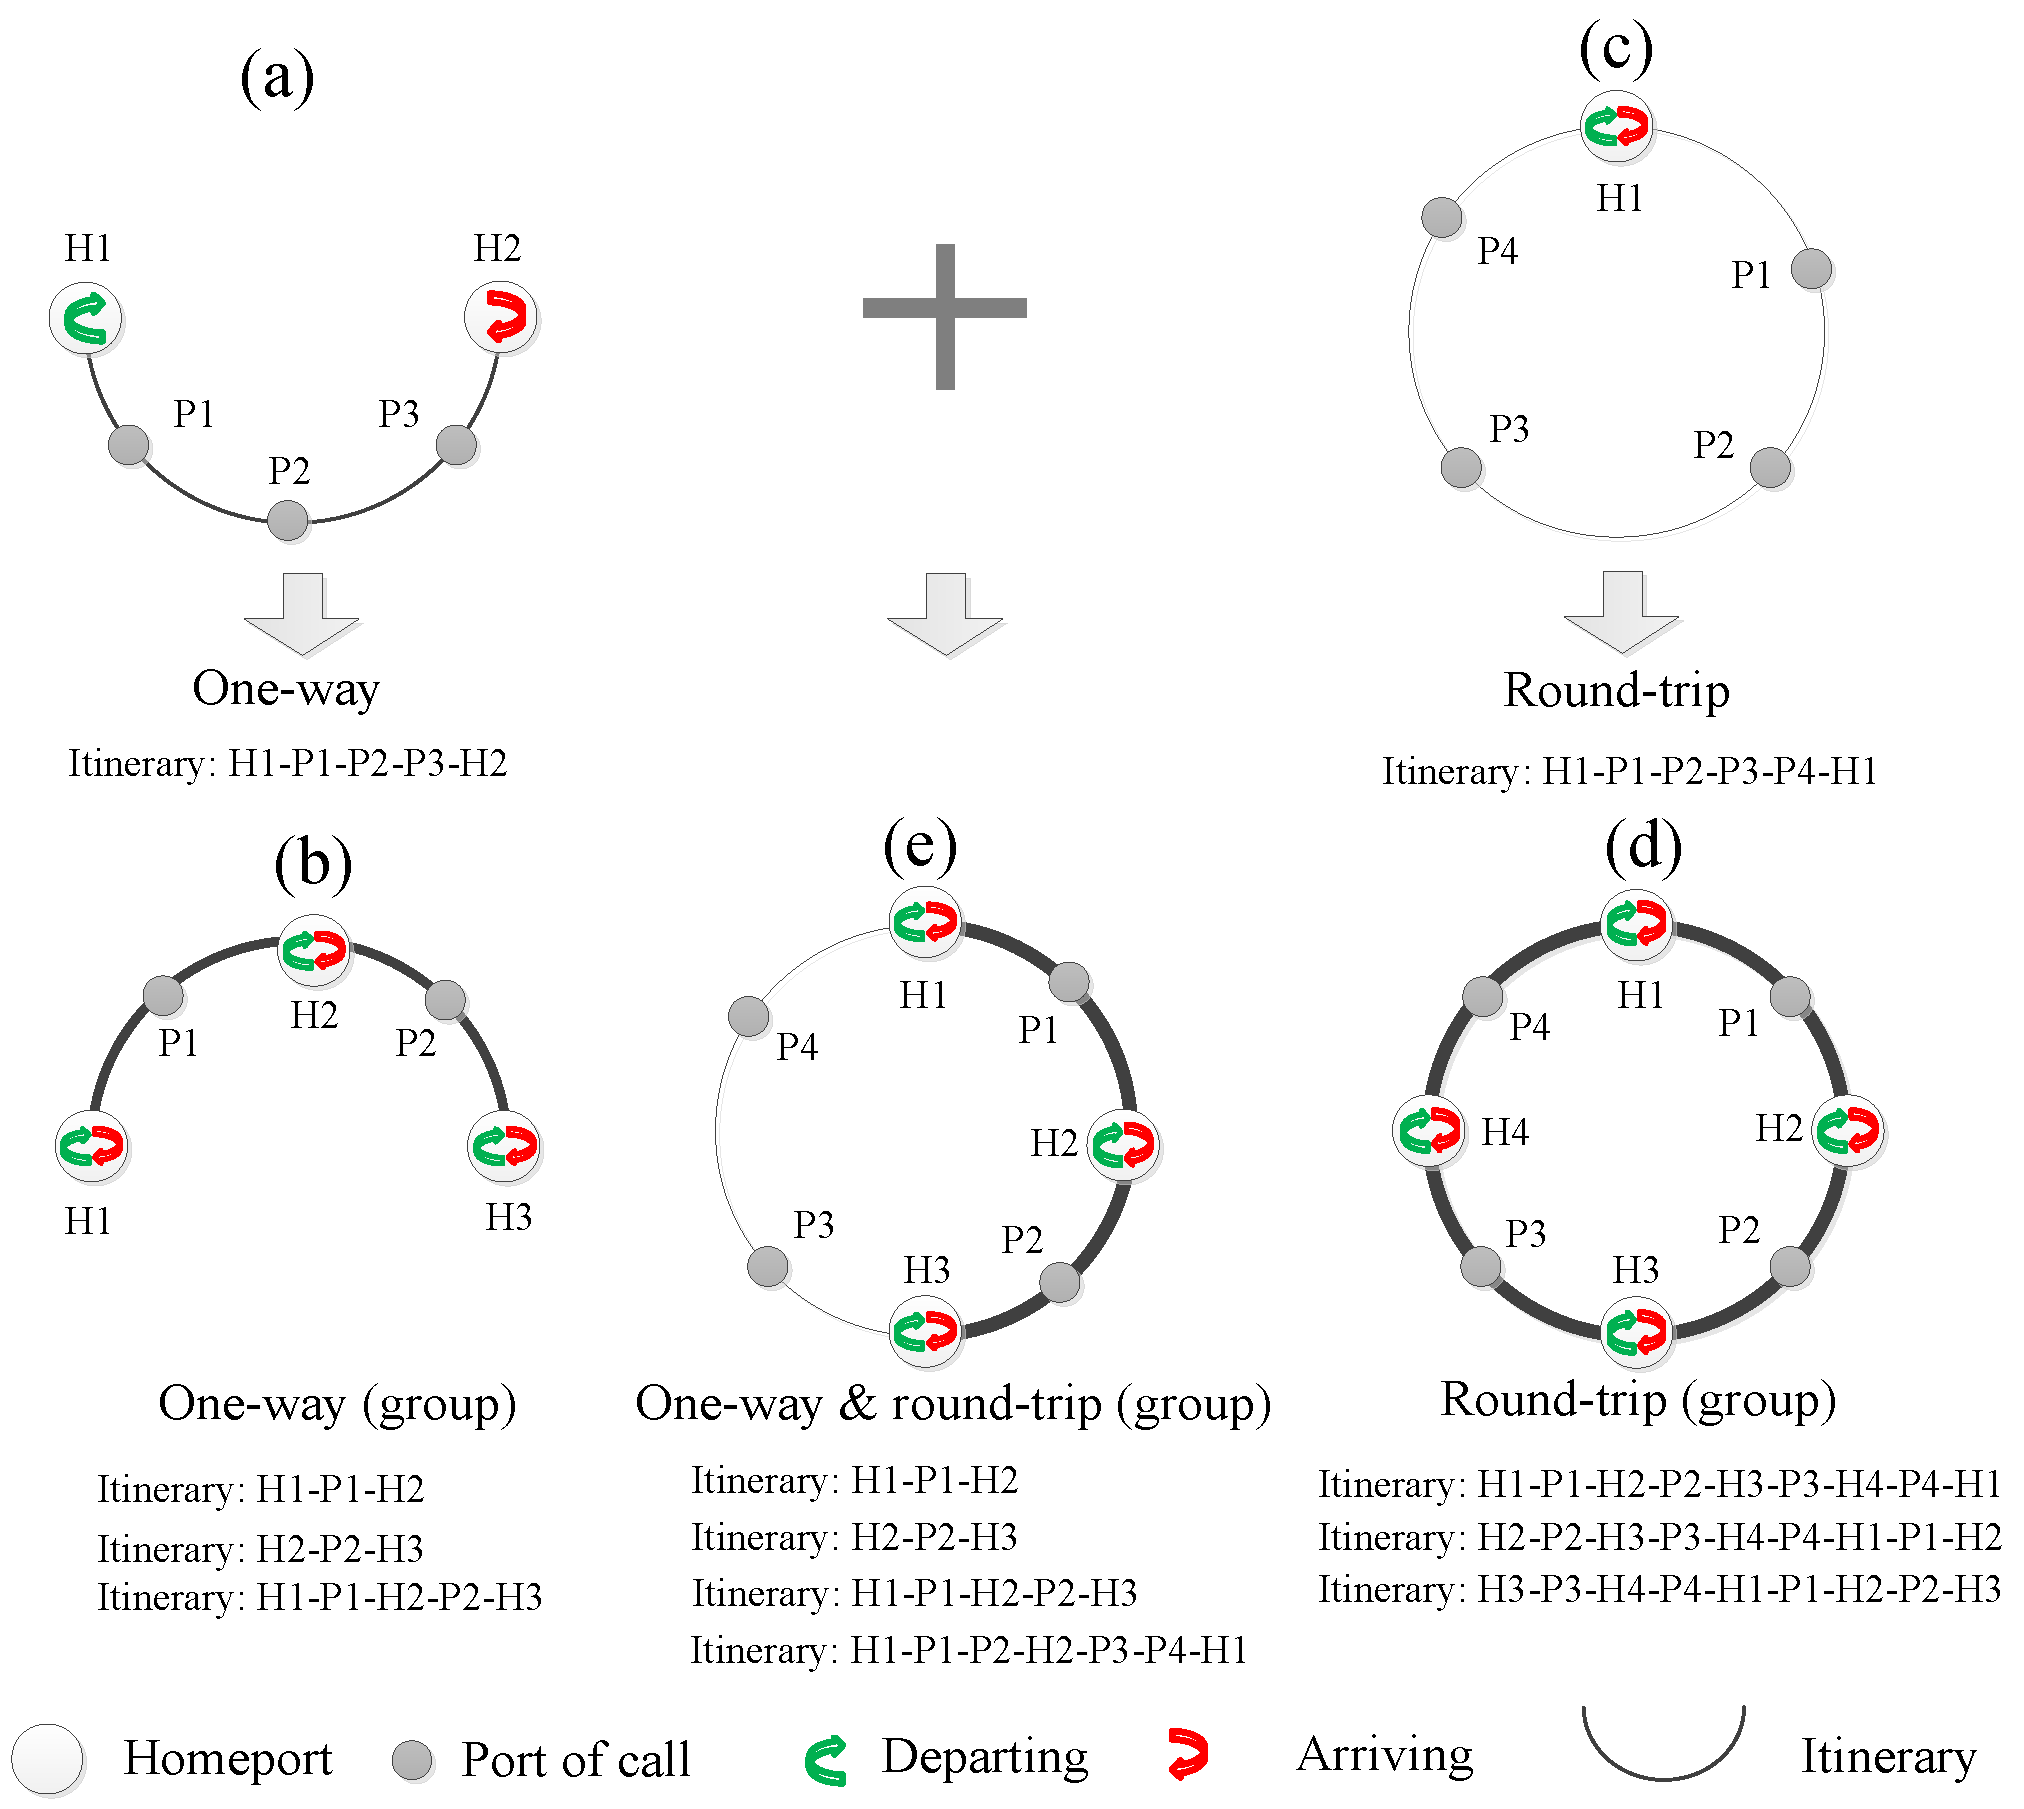
3.2.1. Cruise Homeport and Port of Call

To analyze the spatial characteristics of the itinerary, we need to distinguish the functions of the ports. Generally speaking, in an itinerary, there are mainly two types of functions: homeport and port of call. Pallis (2015) [9] believed that the cruise homeport was very important, and pointed out that it must have three main attributes: (1) adequate port infrastructure; (2) extensive and effective services provided to cruise ships, passengers, and crew; and (3) good connections with other modes of transport. Lekakou et al. (2009) [46] and Bayazit et al. (2016) [47] assumed that ports need to fulfill the requirements of cruise lines if they were to be attractive homeports.
A cruise homeport is a comprehensive concept, which involves multi-dimensional and multi-factor content. For the itinerary, we believe that the cruise homeport is different from the port of call. It should have the following two characteristics: (1) as the embarkation port of a cruise itinerary, it undertakes the gathering of the cruise tourism flow; and (2) as the debarkation port of a cruise itinerary, it undertakes the allocation of the cruise tourism flow. Ports of call refer to those ports that do not belong to the cruise homeports during the journey, including tourist destinations.

3.2.2. Port Differentiation and Port System

To describe the differences and connection between cruise ports affected by cruise itineraries, we built the origin–destination matrix M, as used by Notteboom (2006) [35], Cullinane and Khanna (2000) [48], Veenstra (2005) [49] and Wang (2008) [50].
L = I = 1 n L I J = I = 1 n i = 1 m 1 l i + I = 1 n i = 1 m 1 j = 1 k 1 l i j + I = 1 n j = 1 k 1 i = 1 m 1 l j i
M = [ R i j ] 194 × 194
First, we assume that l represents the itinerary between two ports, where Li→j is a set of directed routes from port i and port j. Li←j is a set of directed routes from port j and port i. Li represents the set of all routes passing through port i. LIJ is a set of two-way routes from port i and port j, and L is a set of different vector itineraries. The higher the value of L, the stronger the itinerary organization’s ability of the cruise ports. To further analyze the connection of cruise ports, we constructed a complete contact matrix M for the cruise ports.
R i = O i + D j = j = 1 n 1 ( R i j + R j i ) = i = 1 , j = 1 n 1 H i P i j + i = 1 , j = 1 n 1 H i H j
According to the matrix M, we defined the cruise route connection from port i to port j as Oij, the cruise route connection from port j to port i is Dij, and Rij is the sum of all two-way links between port i and port j, which mainly includes two types of relationships. (1) The relationship between the cruise homeport and the port of call is defined as HP. (2) The relationship between cruise homeports is defined as HH.
To study the relationship between cruise ports in the cruise port network, we used the homeport-port of call linkage degree, defined as Lk. The specific formula is as follows, where Hi and Hj refer to two homeports with a direct link (Figure 1):
L k = H i P i j + H i H j ( H i H j   or   H i H j )

4. The Cunard Case Study

4.1. Itinerary Characteristics and Geographic Feature

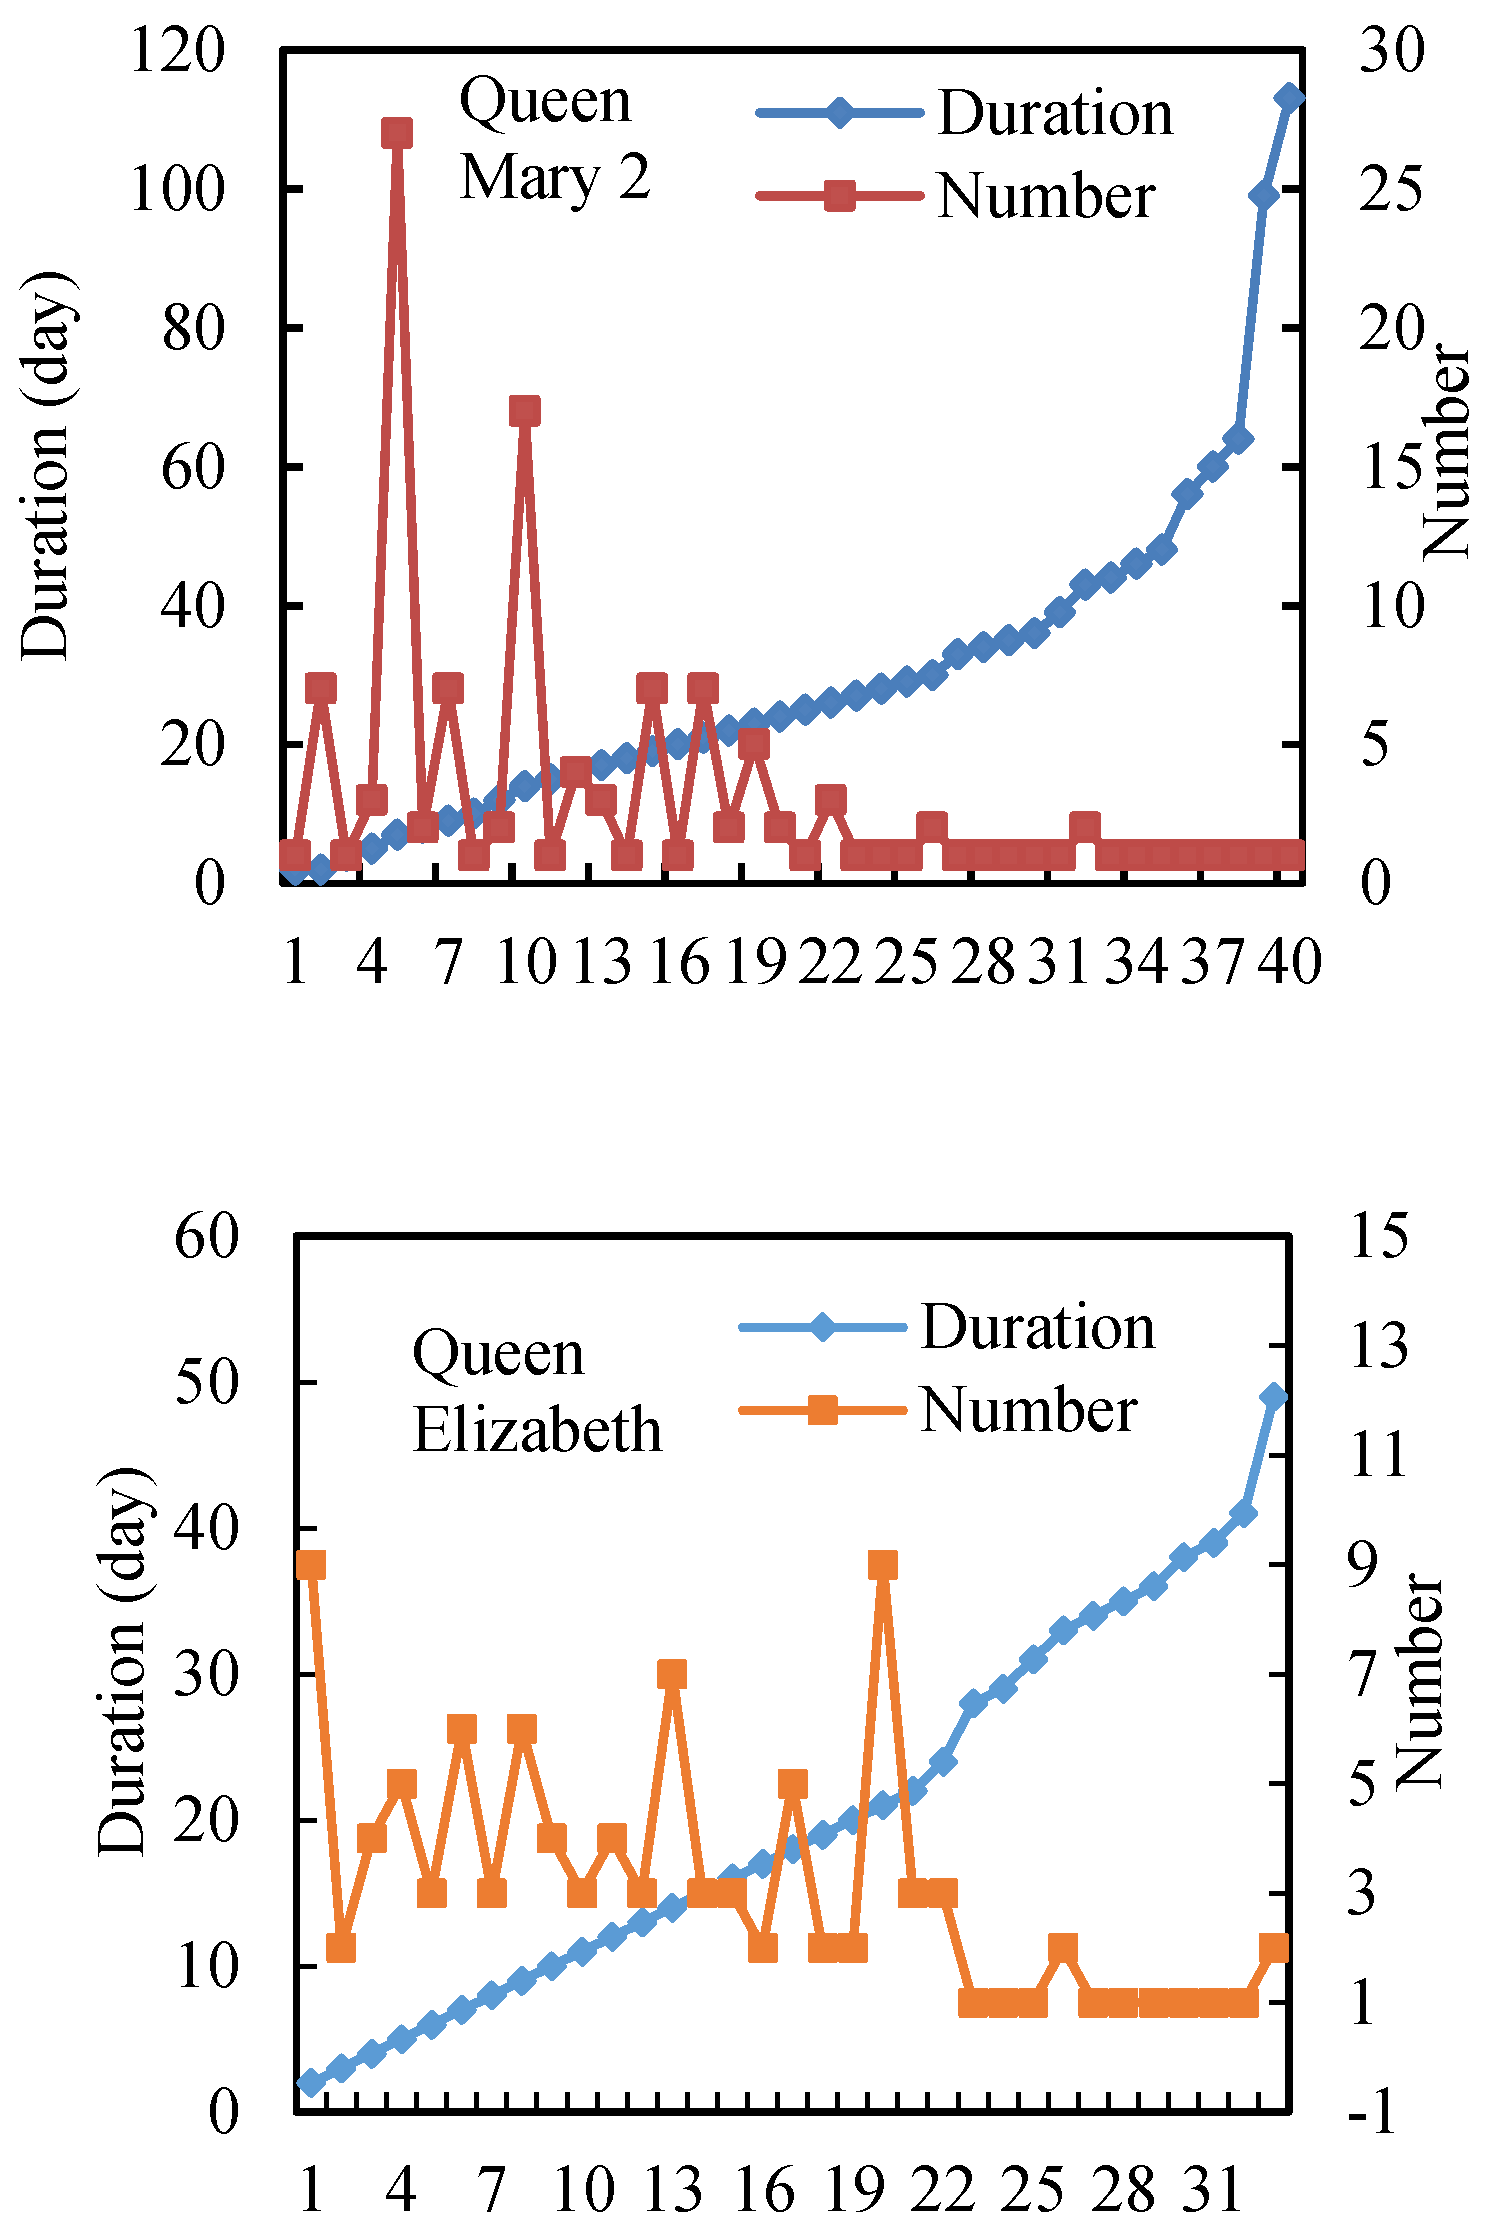
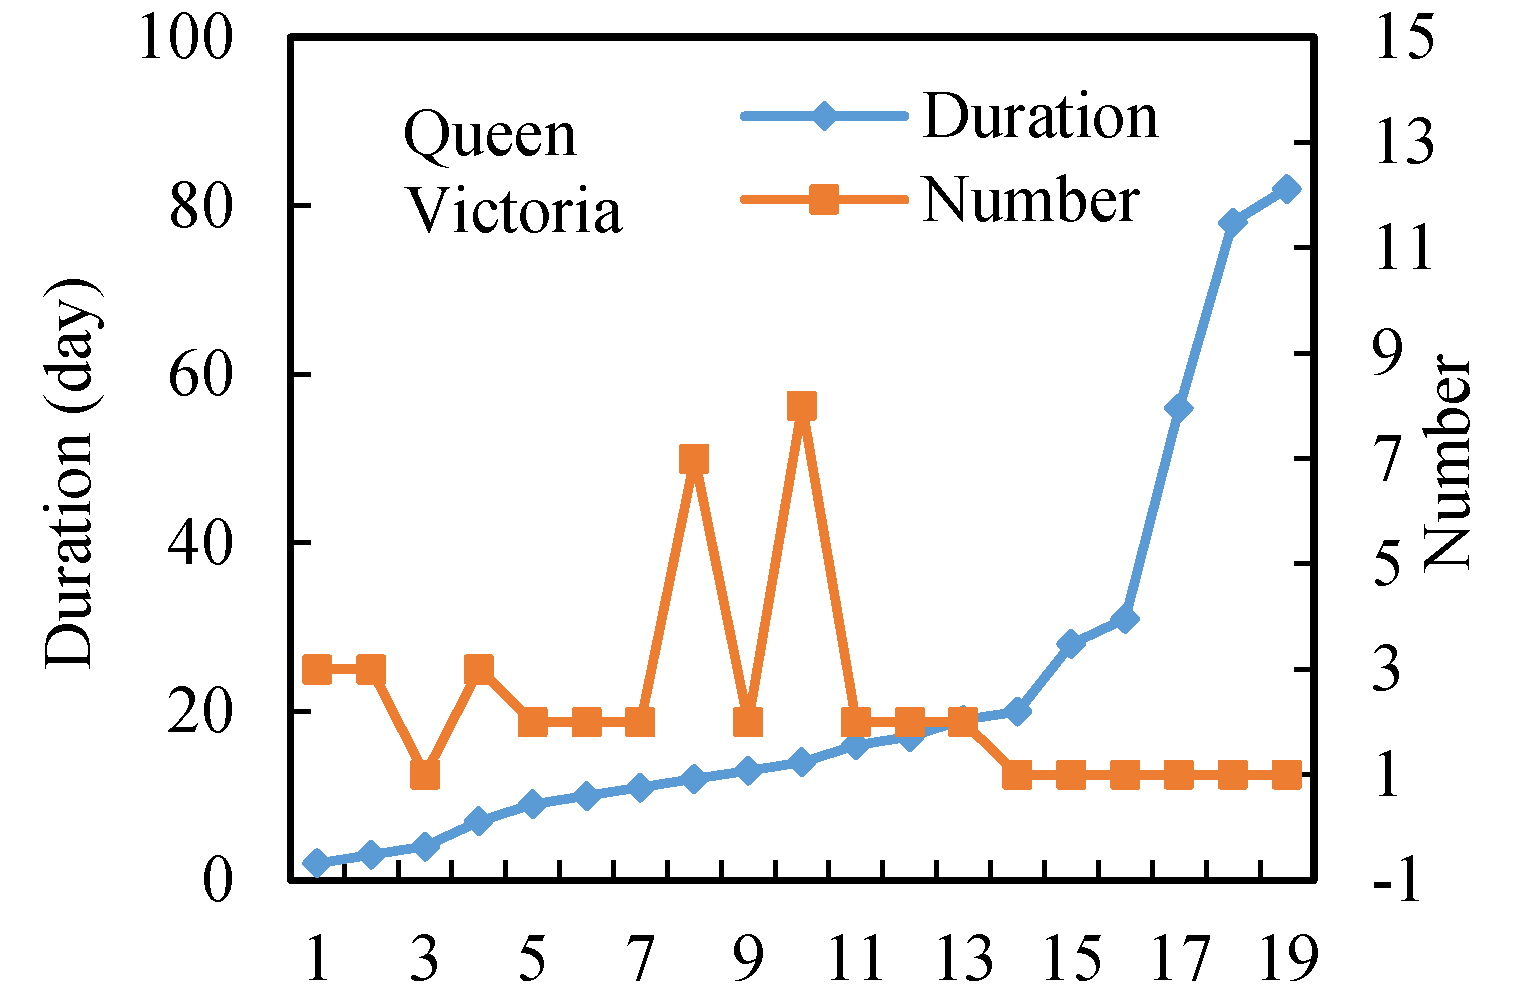
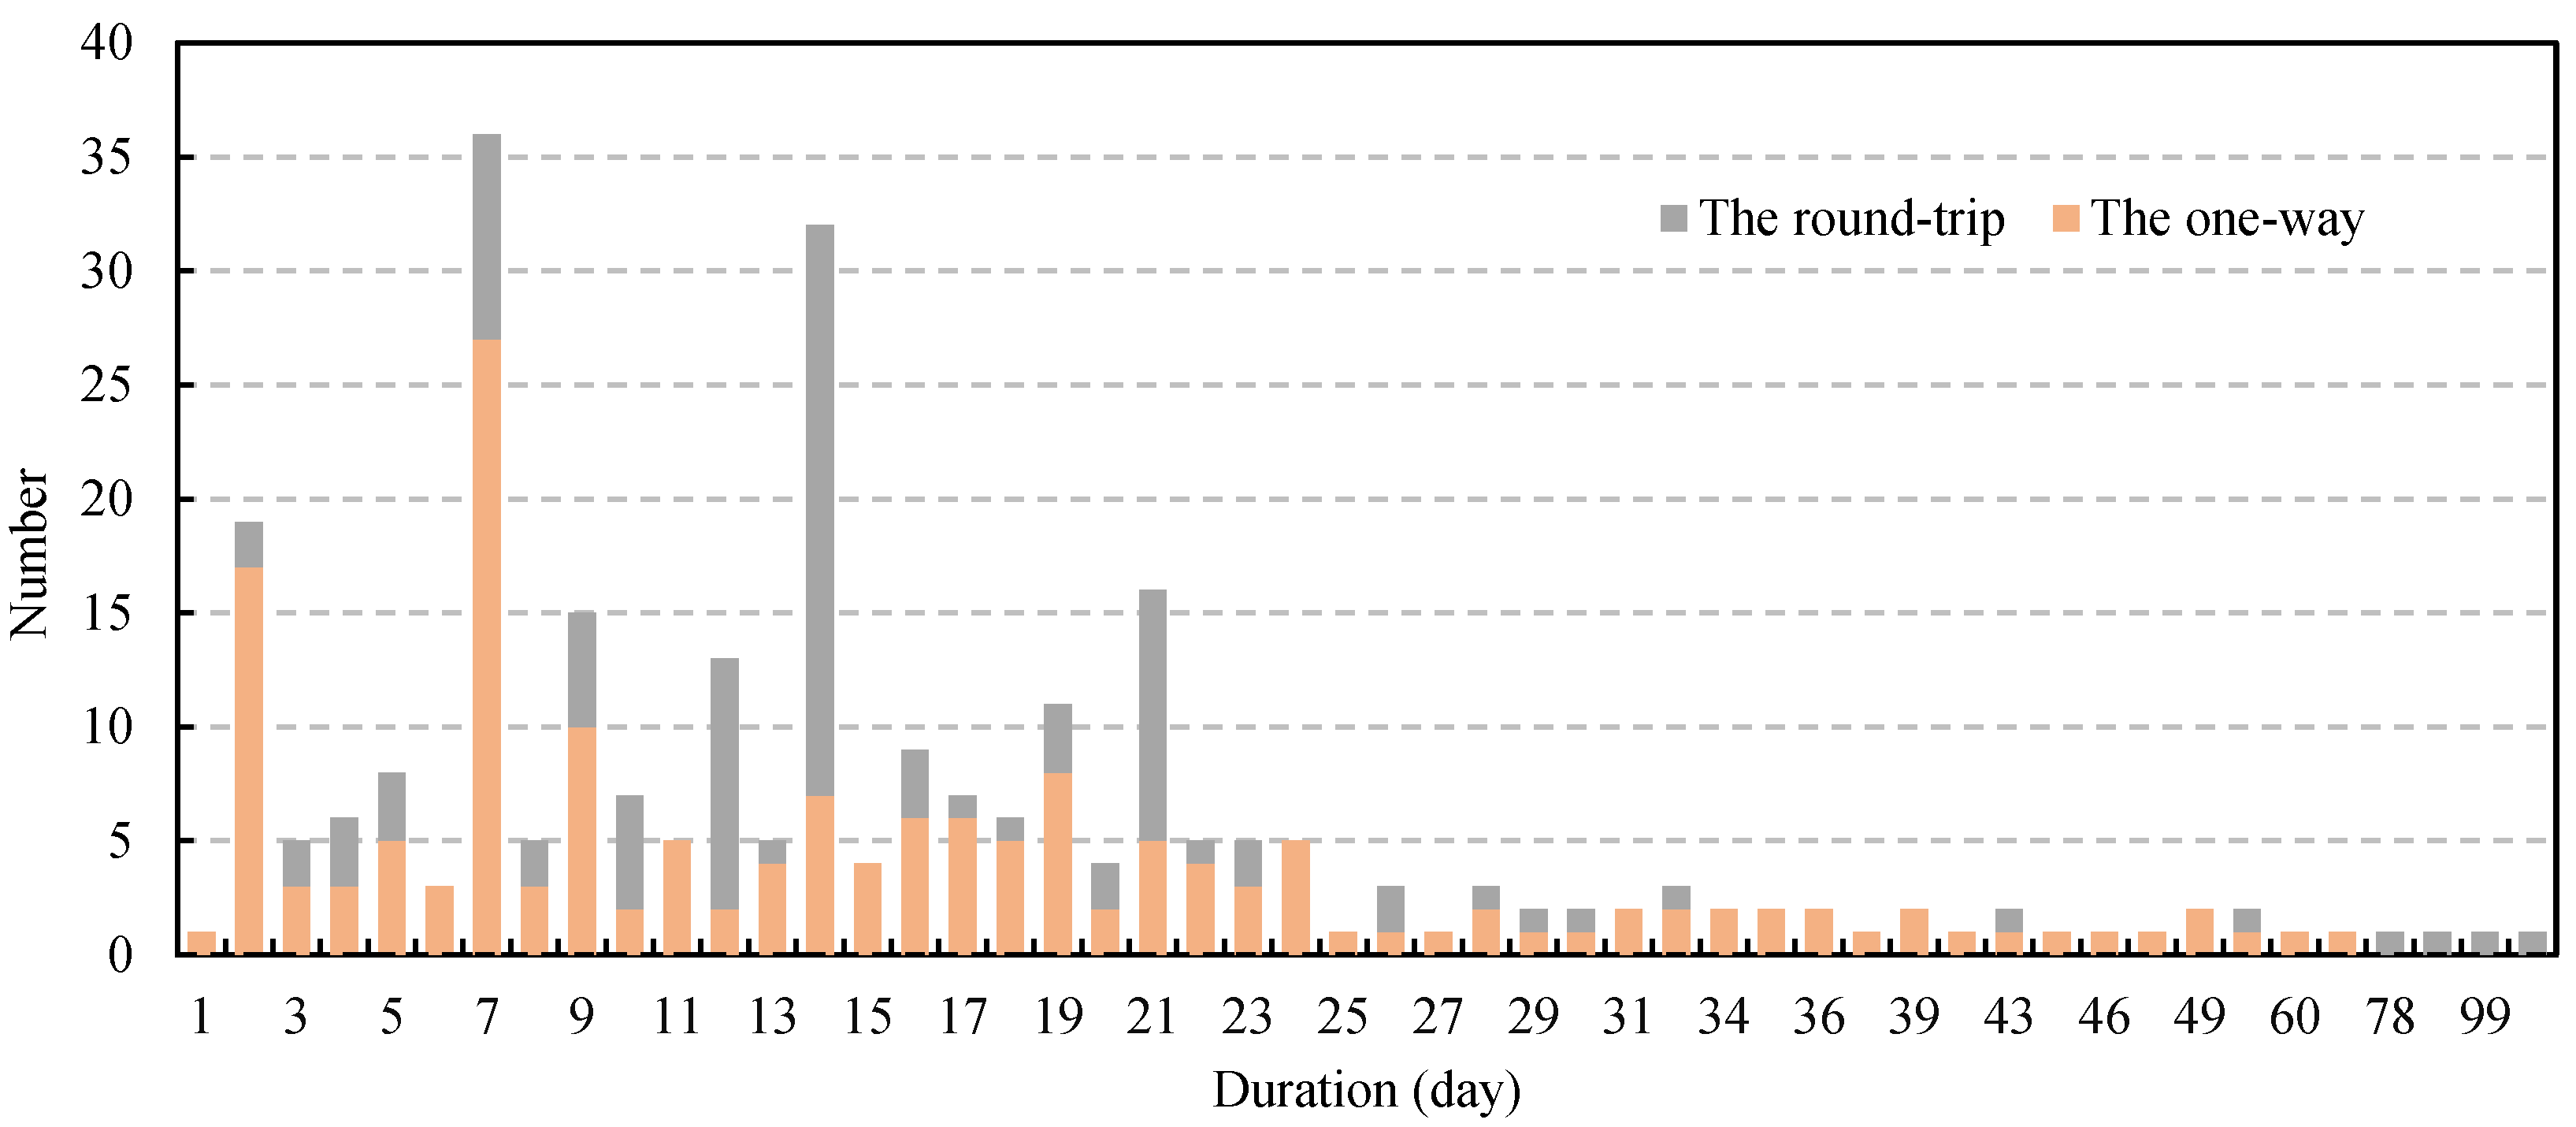
4.1.1. Duration of the Cunard Cruise Itinerary

Cunard belongs to the world cruise which is characterized by the long itineraries, but also offers short itineraries. Two hundred and seventy-four cruise itineraries are offered by Cunard Lines. They can be divided into 50 different kinds of time lengths (Figure 2). The shortest is only two days and the longest lasts 113 days. The number of itineraries that are completed within 25 days is 233, accounting for 85% of the total. In particular, the 7-day and 14-day itineraries account for 24.5%. These three cruise ships have different itineraries. Queen Mary 2 has the most itineraries, with 125 itineraries. The number of 5-day itineraries accounts for 21.5%, followed by 17-day itineraries. The maximum duration is 113 days. There are 103 itineraries for Queen Elizabeth, and the longest one is 49 days. The 20-day itineraries are more numerous. Queen Victoria offers only 45 itineraries. There are more itineraries in 12 days and 14 days, and the longest itinerary is 82 days.

4.1.2. Type of the Cunard Cruise Itinerary

Cruise itinerary can be divided into the one-way and round-trip [8,9]. A one-way itinerary has different embarkation and debarkation ports, such as the Vancouver (embarkation), San Francisco, Los Angeles (debarkation) itinerary of Queen Elizabeth. Round-trip itineraries differ from one-way itineraries, because the embarkation and debarkation ports for the former are the same, such as the Melbourne (embarkation), Adelaide, Hobart, Alberni, Melbourne (debarkation) itinerary of Queen Elizabeth. There are 170 one-way itineraries and 104 round-trip itineraries operated by Cunard, with a ratio of 1.6:1. As shown in Figure 3, the duration of the Cunard cruise itinerary further indicates the structure between these two types of cruise itineraries. Round-trip itineraries are more common on 7-day, 12-day, 14-day, and 21-day itineraries. On the contrary, one-way itineraries are widely distributed in different times of voyage. This indicates that the cruise itinerary of Cunard is mainly open.

4.1.3. Structure Characteristics of the Cunard Cruise Itinerary

After a period of analysis, it can be known that Cunard is a type of world cruise, which is characterized by long and global itineraries, but it also provides short itineraries. As a matter of fact, for Cunard cruise, the short itinerary maybe just a supplement to the long itinerary, because it is attached to the interior of the long itinerary, and can be regarded as a segmentation of the long itinerary [21]. However, this division of long itineraries is not as simple as “one plus one equals two”, instead of “one plus one is greater than two”. More open itineraries are formed through the division of long itineraries. Just like riding on a bus, passengers can choose the same or different embarkation and debarkation ports than the original one long itinerary, only embarking and debarking at the same time. In such an itinerary structure, different itineraries have the same embarkation port and form a set of itineraries. We call them “itinerary group”, as shown in Figure 4. Ordinarily, the duration of cruise itineraries, no matter how long, can be divided into two categories, one-way and round-trip. The standard cruise, Carnival, Royal Caribbean, Costa Cruises usually offer simple itineraries (Figure 4a,c). However, in some regions, some itineraries of cruises also show the characteristics of the itinerary group, such as the itineraries of the MSC Seaview, the Costa Fascosa, etc., in the Mediterranean Sea (Figure 4d) [10,11]. For Cunard, both one-way and round-trip itineraries have the characteristics of the itinerary group (Figure 4b,d,e). The connections between different itinerary groups are seamless. This has increased the diversity of itineraries under normal circumstances.

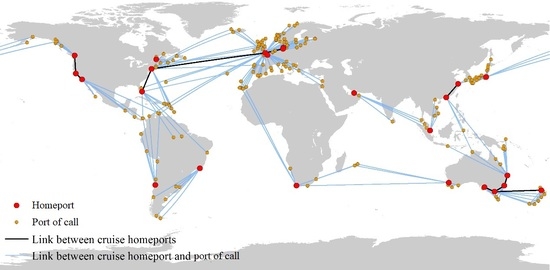
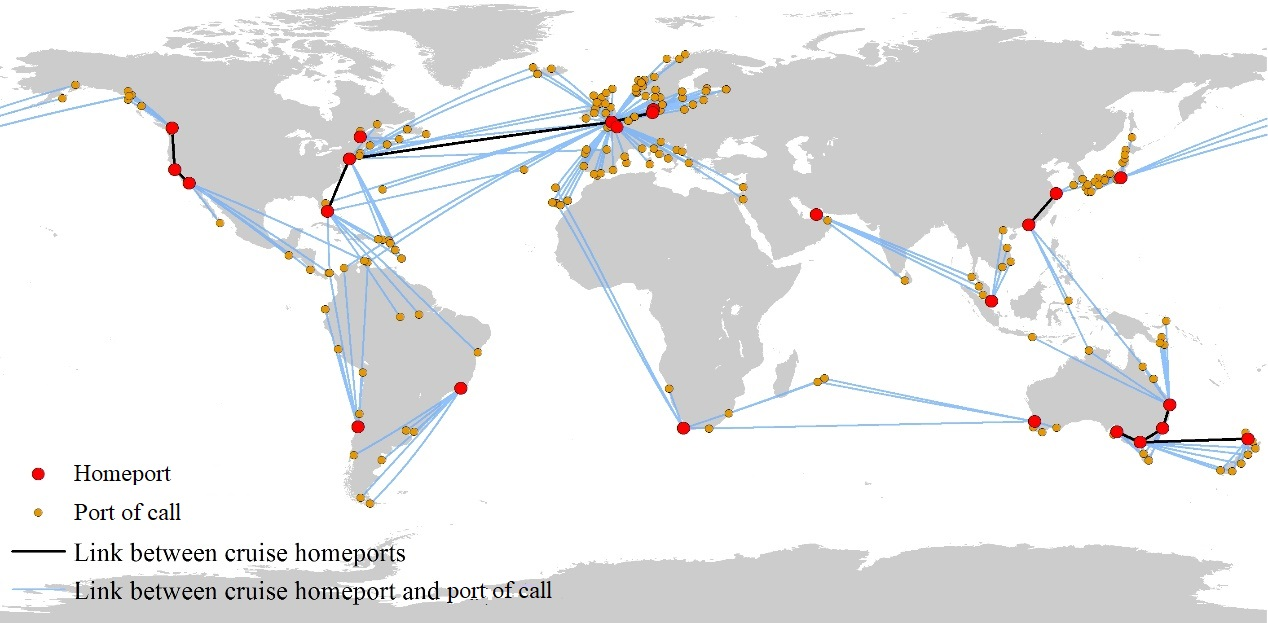
4.2. Spatial Organization of Cruise Ports

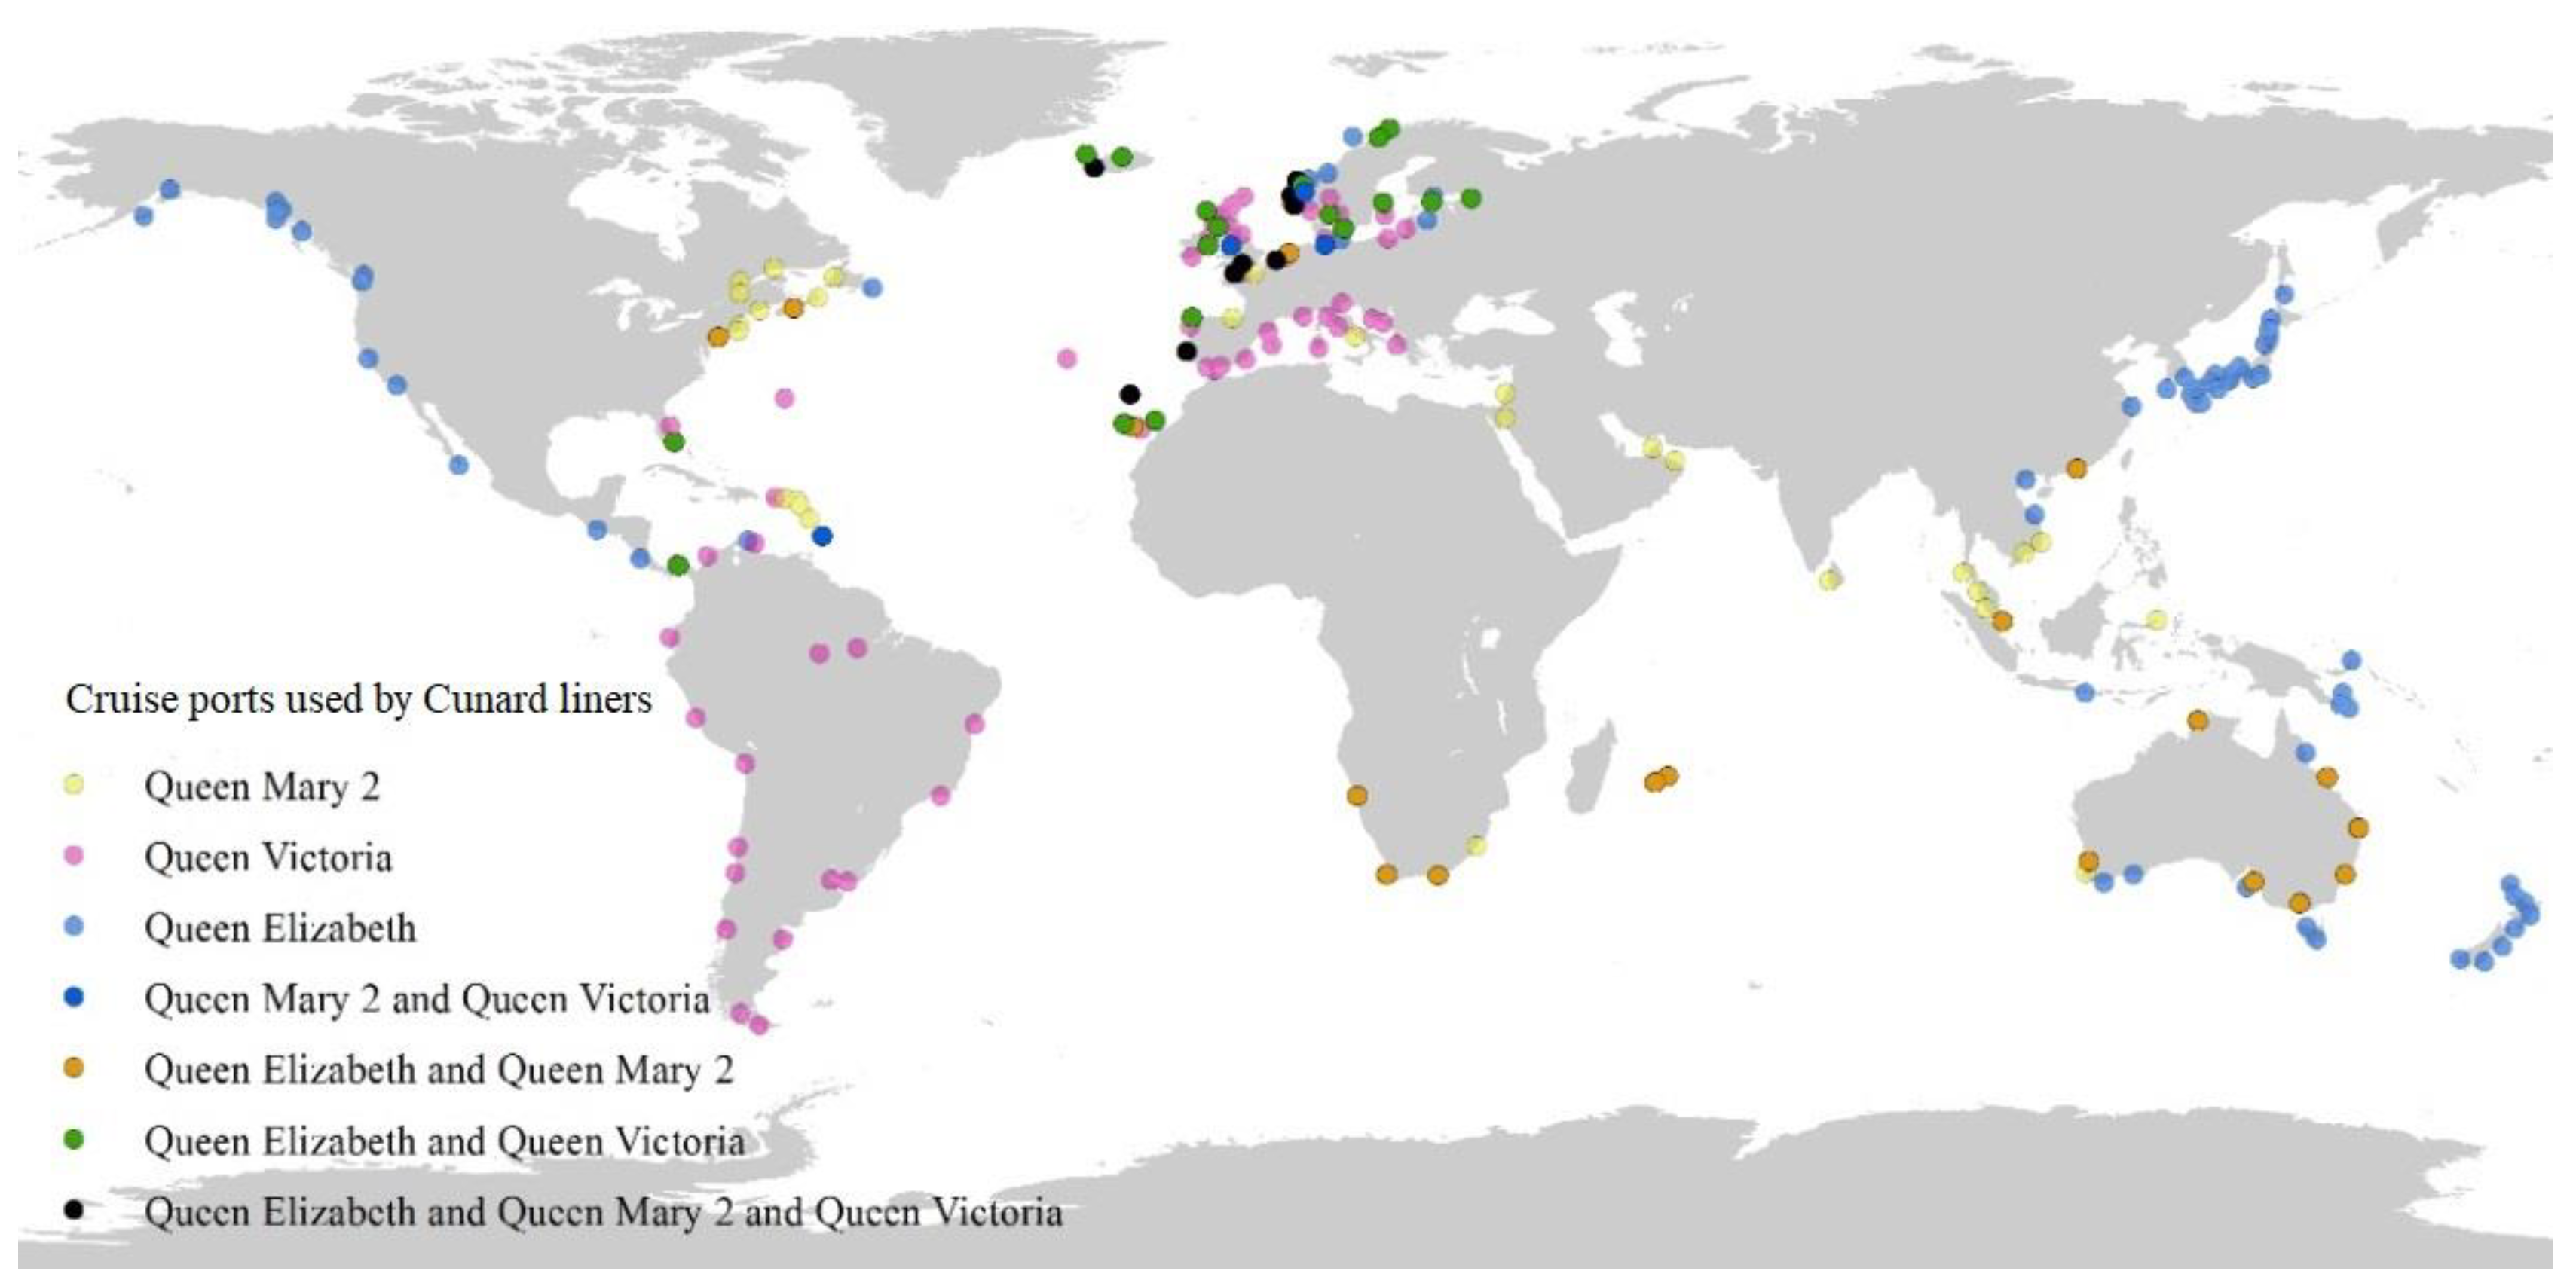
4.2.1. Distribution of Cruise Ports

To offer long itineraries and circumnavigation, it is necessary to mobilize the cruise ports in different regions of the world. The study found that the number of cruise ports covered by the itineraries of Cunard cruise ships is 194 (Figure 5). These cruise ports are distributed in coastal areas of all continents except Antarctica, mainly in Europe, North America, South America, Australia, New Zealand, Northeast Asia, and Southeast Asia, which account for 43.3%, 12.9%, 10.8%, 11.3%, 10.8%, and 7.2% of the total number of cruise ports, respectively.
As shown in Figure 5, the spatial distribution of the ports used by the cruise ships is different, which indicates the different cruise itineraries of cruise ships. Queen Mary 2 uses 59 cruise ports, which are mainly distributed in Southeast Asia, Western Europe (including the Nordic countries), Australia and New Zealand, South Asia, Central Asia, eastern North America, and the Caribbean. There are 87 ports used by Queen Victoria. These ports are mainly distributed in Western Europe (including the Nordic countries), the Mediterranean, North America, and East and South America. Queen Elizabeth uses 109 registered ports, which are located in Western Europe (including the Nordic countries), Alaska, China, the United States, South Africa, Australia, New Zealand, Southeast Asia, and Northeast Asia, respectively. At the national level, the cruise ports used by Cunard cruises are distributed in more than 60 countries and regions around the world, especially Japan (16 ports), the United States (14 ports), Australia (14 ports), Norway (13 ports), Britain (12 ports), Spain (11 ports), and Canada (10 ports). The number of ports in these countries accounts for 46.4% of the total usage of Cunard.
However, different cruises will use the same port at different times. From the perspective of the economy, there is a charge for using the port. It is irrational for world cruise to use completely different ports to provide differentiated cruise itineraries. By adjusting the time and space layout of the itineraries, Cunard has greatly improved the utilization rate of the cruise ports on the premise of ensuring the diversity of the itineraries. The ports used by all three cruise ships are located in Western Europe (including the Nordic countries) shipping area, including Southampton, Tenerife, Lisbon, Stavanger, Bergen, and Olsson. There are 43 ports used by any two cruise ships, which are mainly concentrated in Western Europe (including the Nordic countries), North America, East, Southeast Asia, Australia, and South Africa. There are 147 ports used by a single cruise ship, which are located in Western Europe (including the Nordic countries), the Caribbean Sea, the Mediterranean Sea, Central Asia, South Asia, Southeast Asia, and Northeast Asia.

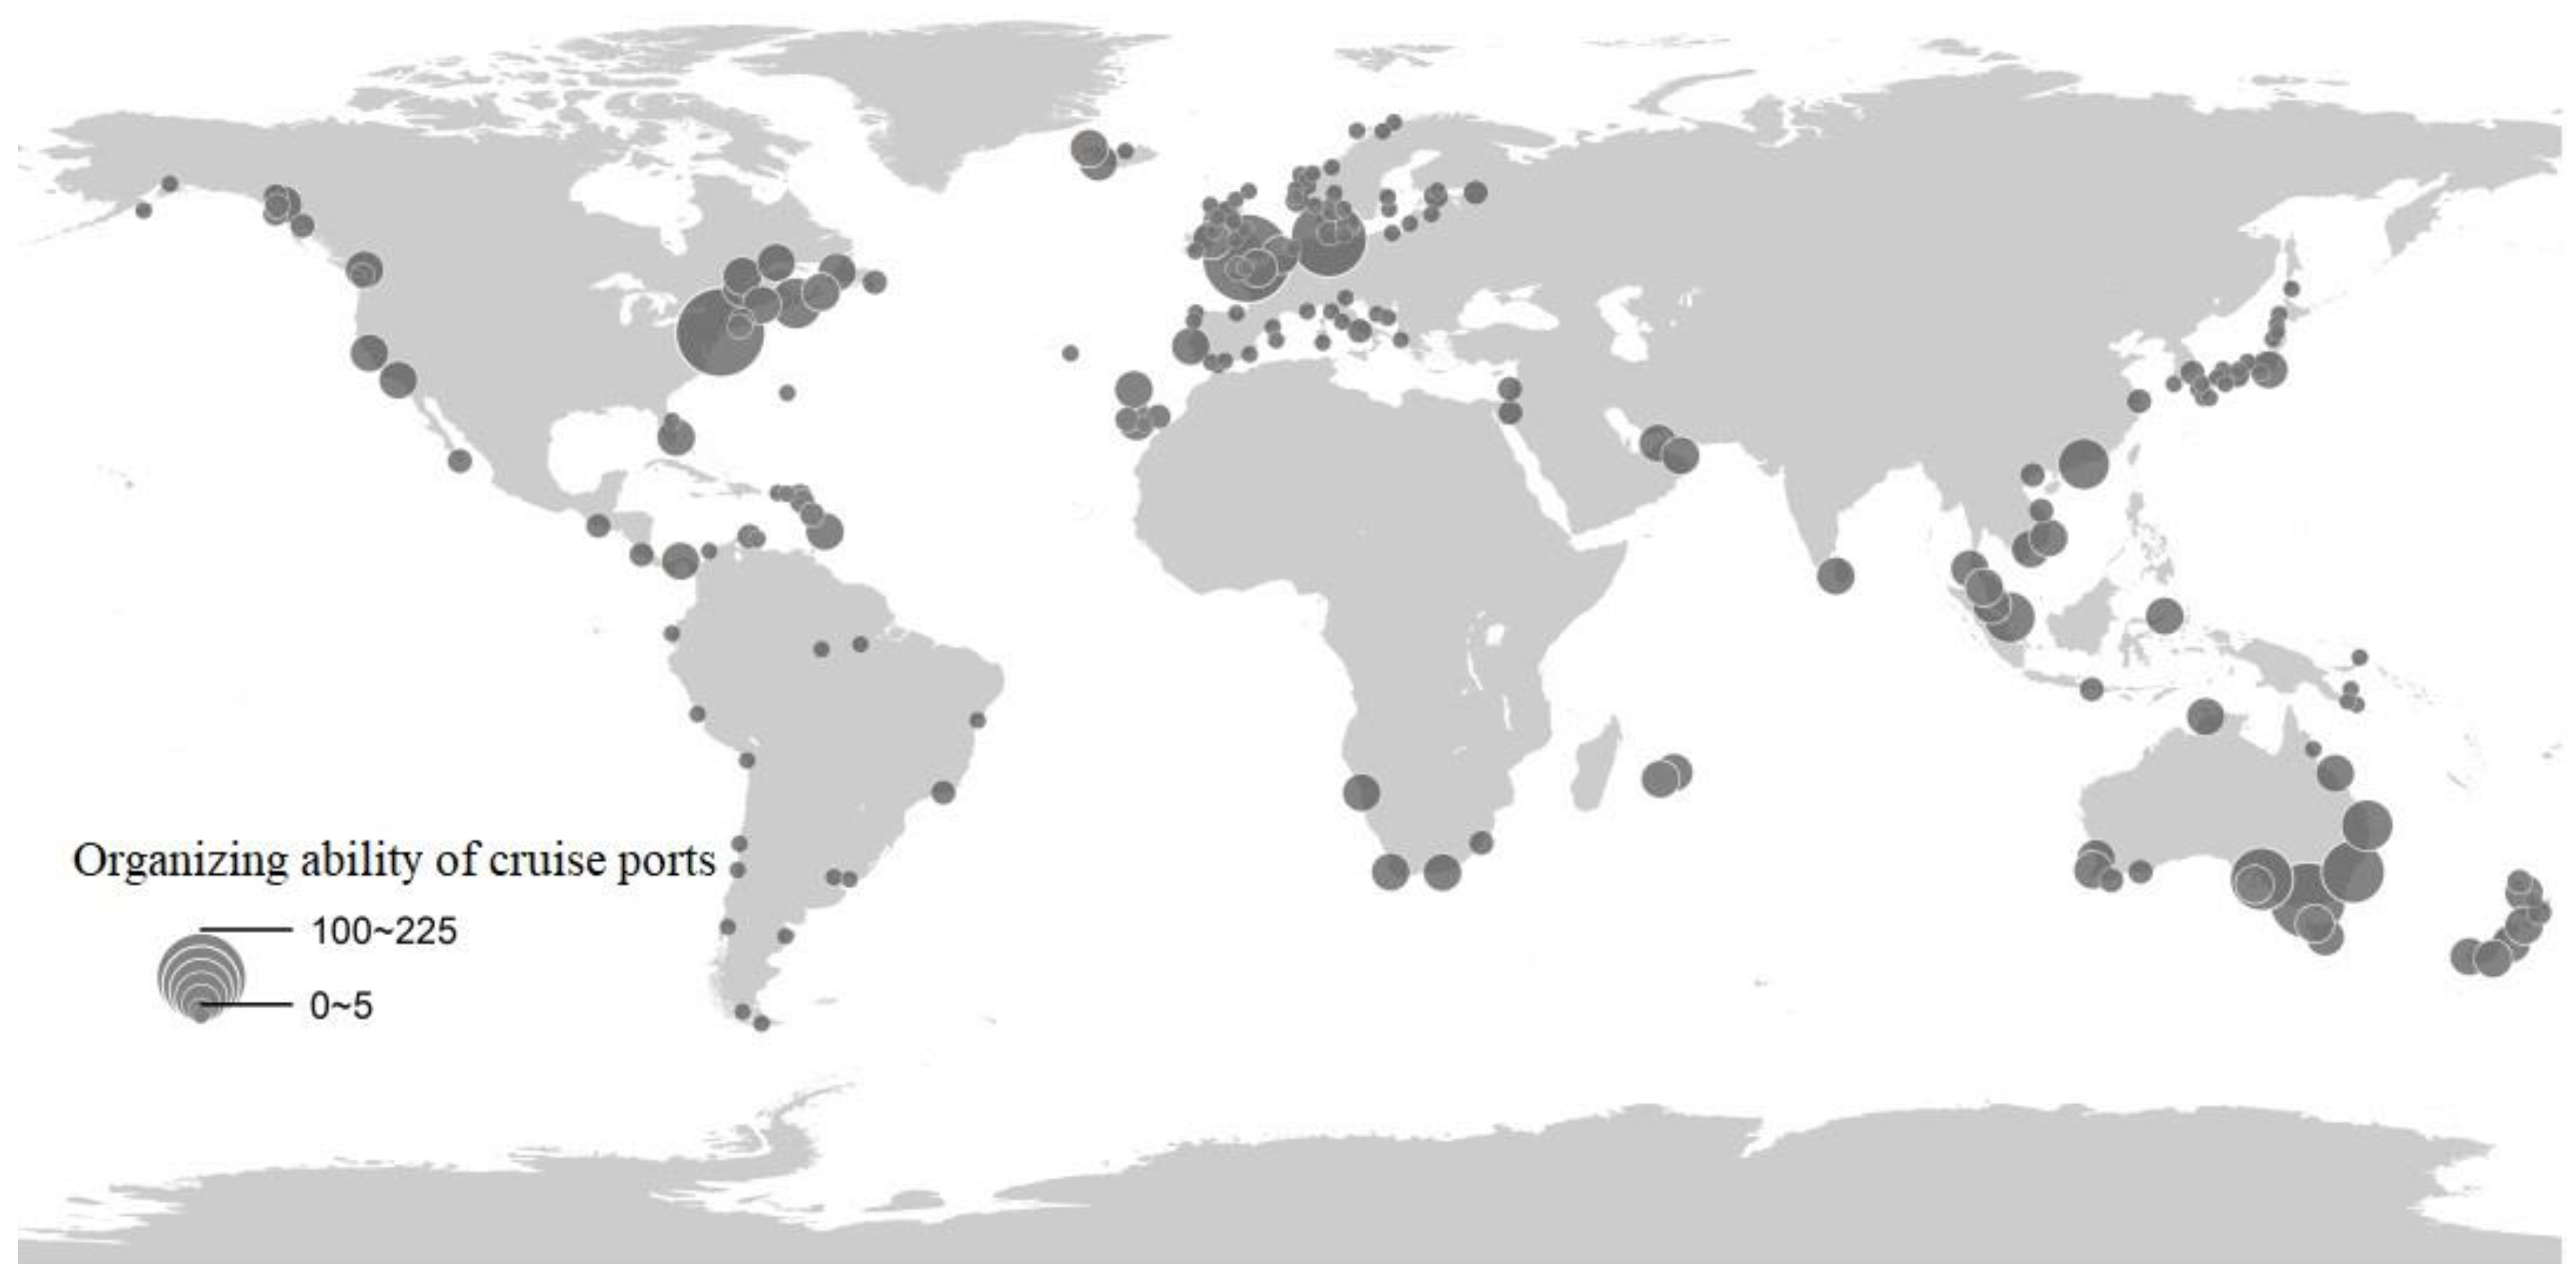
4.2.2. Organizing Ability of Cruise Ports

The use of limited ports to complete the round-the-world journey is bound to form the difference in port organizational capacity. According to Formula (1), we calculated the itinerary organization capacity of the cruise ports which Cunard used (Figure 6).
The average itinerary organization capacity of each cruise port used by Cunard is 11. Fifty-seven ports are higher than the average, accounting for 29.1% of all cruise ports used by Cunard. Southampton, New York, and Melbourne are the top three cruise ports. Southampton has the highest level of organizing ability, with 88 itineraries. New York and Melbourne have 43 and 25 itineraries respectively. Besides, Adelaide, Halifax, Sydney, Hamburg, Brisbane, Hobart, Corner Brook, Singapore, and Darwin are all over 20 itineraries. They are mainly concentrated in Western Europe, North America, Australia, and Southeast Asia, especially Britain, the United States, Australia, and Canada. Some cruise ports, with low organizational capacity, have only one itinerary, including Invergordon, Levick, Kirkwall, Belfast, Auburn, Edinburgh, Rome, Venice, Corfu, Vigo, Mallorca, Cagliari, Fukuoka, Kagoshima, Kochi, etc.

4.2.3. Classification of Cruise Homeports

As the embarkation and debarkation port of cruise itineraries, the cruise homeport plays a key role in the itinerary [30]. According to the definition of the cruise homeport, we have identified 24 cruise homeports, including Southampton, New York, Hamburg, Sydney, Fort Lauderdale, Melbourne, Yokohama, Singapore, Vancouver, Hong Kong, Brisbane, Dubai, San Francisco, Los Angeles, Cape Town, Kiel, Perth, Adelaide, Santiago, Auckland, Rio de Janeiro, Quebec, Shanghai, Le Havre (Figure 7). They account for 12% of all cruise ports. These cruise homeports are located on six continents besides Antarctica. There are six homeports in North America and Australia. Only two homeports are in South America (Rio de Janeiro and Santiago) and one in Africa (Cape Town).
A small number of cruise homeports are used by Cunard to complete all the itineraries and circumnavigation. The key point is that cruise itineraries with different durations connect the homeports of different regions to form a global cruise network. The cruise homeport of Southampton has close links with 17 other homeports, including New York, Hamburg, Sydney, Hong Kong, and Cape Town. The next one is New York, which has links with 13 homeports, including Fort Lauderdale, Singapore, Sydney, and Los Angeles, etc. Sydney has links with 11 homeports, including Melbourne and Auckland. Besides, Hong Kong, Singapore, and Hamburg have links with nine homeports each (Table 1). For example, during of 49-day itinerary from Southampton to Melbourne, there are five homeports, including Southampton, Cape Town, Adelaide, Perth, and Melbourne. This also confirms the above findings.
Besides, there are obvious differences in the connection strength between cruise homeports. The links between New York and Southampton are the strongest with 44 itineraries, while 32 itineraries are departing from Southampton to New York. Secondly, there are 17 itineraries from Hamburg to Southampton, 16 itineraries from Southampton to Hamburg, 12 itineraries from Hamburg to New York, 12 itineraries from Melbourne to Adelaide, 11 itineraries from Melbourne to Auckland, 11 itineraries from Adelaide to Melbourne, and 10 itineraries from New York to Hamburg. The itinerary between the two cruise homeports is both unidirectional and bidirectional, reflecting the directionality of the itineraries. This also indicates that the itinerary organization of Cunard cruises in different regions is different, which may be related to seasonality and the passenger source market [11,31].
A port of call differs from the cruise homeport. They are usually located in the middle of the cruise itinerary. Therefore, a port of call plays the “relay” role in the cruise network and provides a driving force for the diversity of the cruise homeport network. Based on the schedule data collected, we identified 170 ports of call and then calculated the relationship between ports of call and homeports. The number of ports of call used by Cunard is larger than the number of cruise homeports. Most ports of call are directly connected with Southampton and Hamburg. Southampton has links with 128 ports of call all over the world. Therefore, it has the widest coverage at sea, with the frequent links being from Southampton to Lisbon. New York has links with 51 ports of call, and the frequent links are from New York to Halifax. Melbourne has links with 23 ports of call, the frequency of which is from Melbourne to Hobart.
Based on the results of the previous analysis, due to the arrangement of the cruise itineraries, the ports used by Cunard are quite different, especially the cruise homeport. According to the links of the itineraries between the cruise ports, we classified the cruise homeports. As shown in Table 1. The homeports of Cunard can be divided into five grades.
Grade I. The homeports of Southampton and New York have the highest grades, located on the east and west sides of the North Atlantic, and are the major for Cunard. From the perspective of the cruise ports links, Southampton has links with 17 homeports and 129 ports of call (Table 1). New York has links with 13 homeports and 52 ports of call. From the spatial range of the itinerary, their itineraries are global.
Grade II. Sydney and Hamburg are located in Australia and Western Europe respectively. Sydney has links with 11 homeports and 23 ports of call. Hamburg has links with 9 homeports and 48 ports of call. They also have a high ability to organize itineraries. However, their itineraries are Intercontinental.
Grade III. There are 16 homeports, including Fort Lauderdale, Melbourne, Yokohama, Singapore, Vancouver, Hong Kong, Brisbane, Dubai, San Francisco, Los Angeles, Cape Town, Kiel, Perth, Adelaide, Santiago, and Auckland. The itineraries from Kiel are in northern Europe, while the itineraries from Adelaide and Auckland are concentrated in eastern Australia, so they belong to the regional homeports in terms of the range of voyage space. The itineraries from other homeports are spread over different continents, so they are intercontinental ports.
Grade IV. The homeports are Quebec, Rio de Janeiro, Shanghai, and Le Havre, which are located in North America, South America, Asia, and Europe, respectively. The itineraries from these homeports are few and regional and usually short in duration. Therefore, for Cunard, these homeports belong to a marginal part, and their grade is lowest.

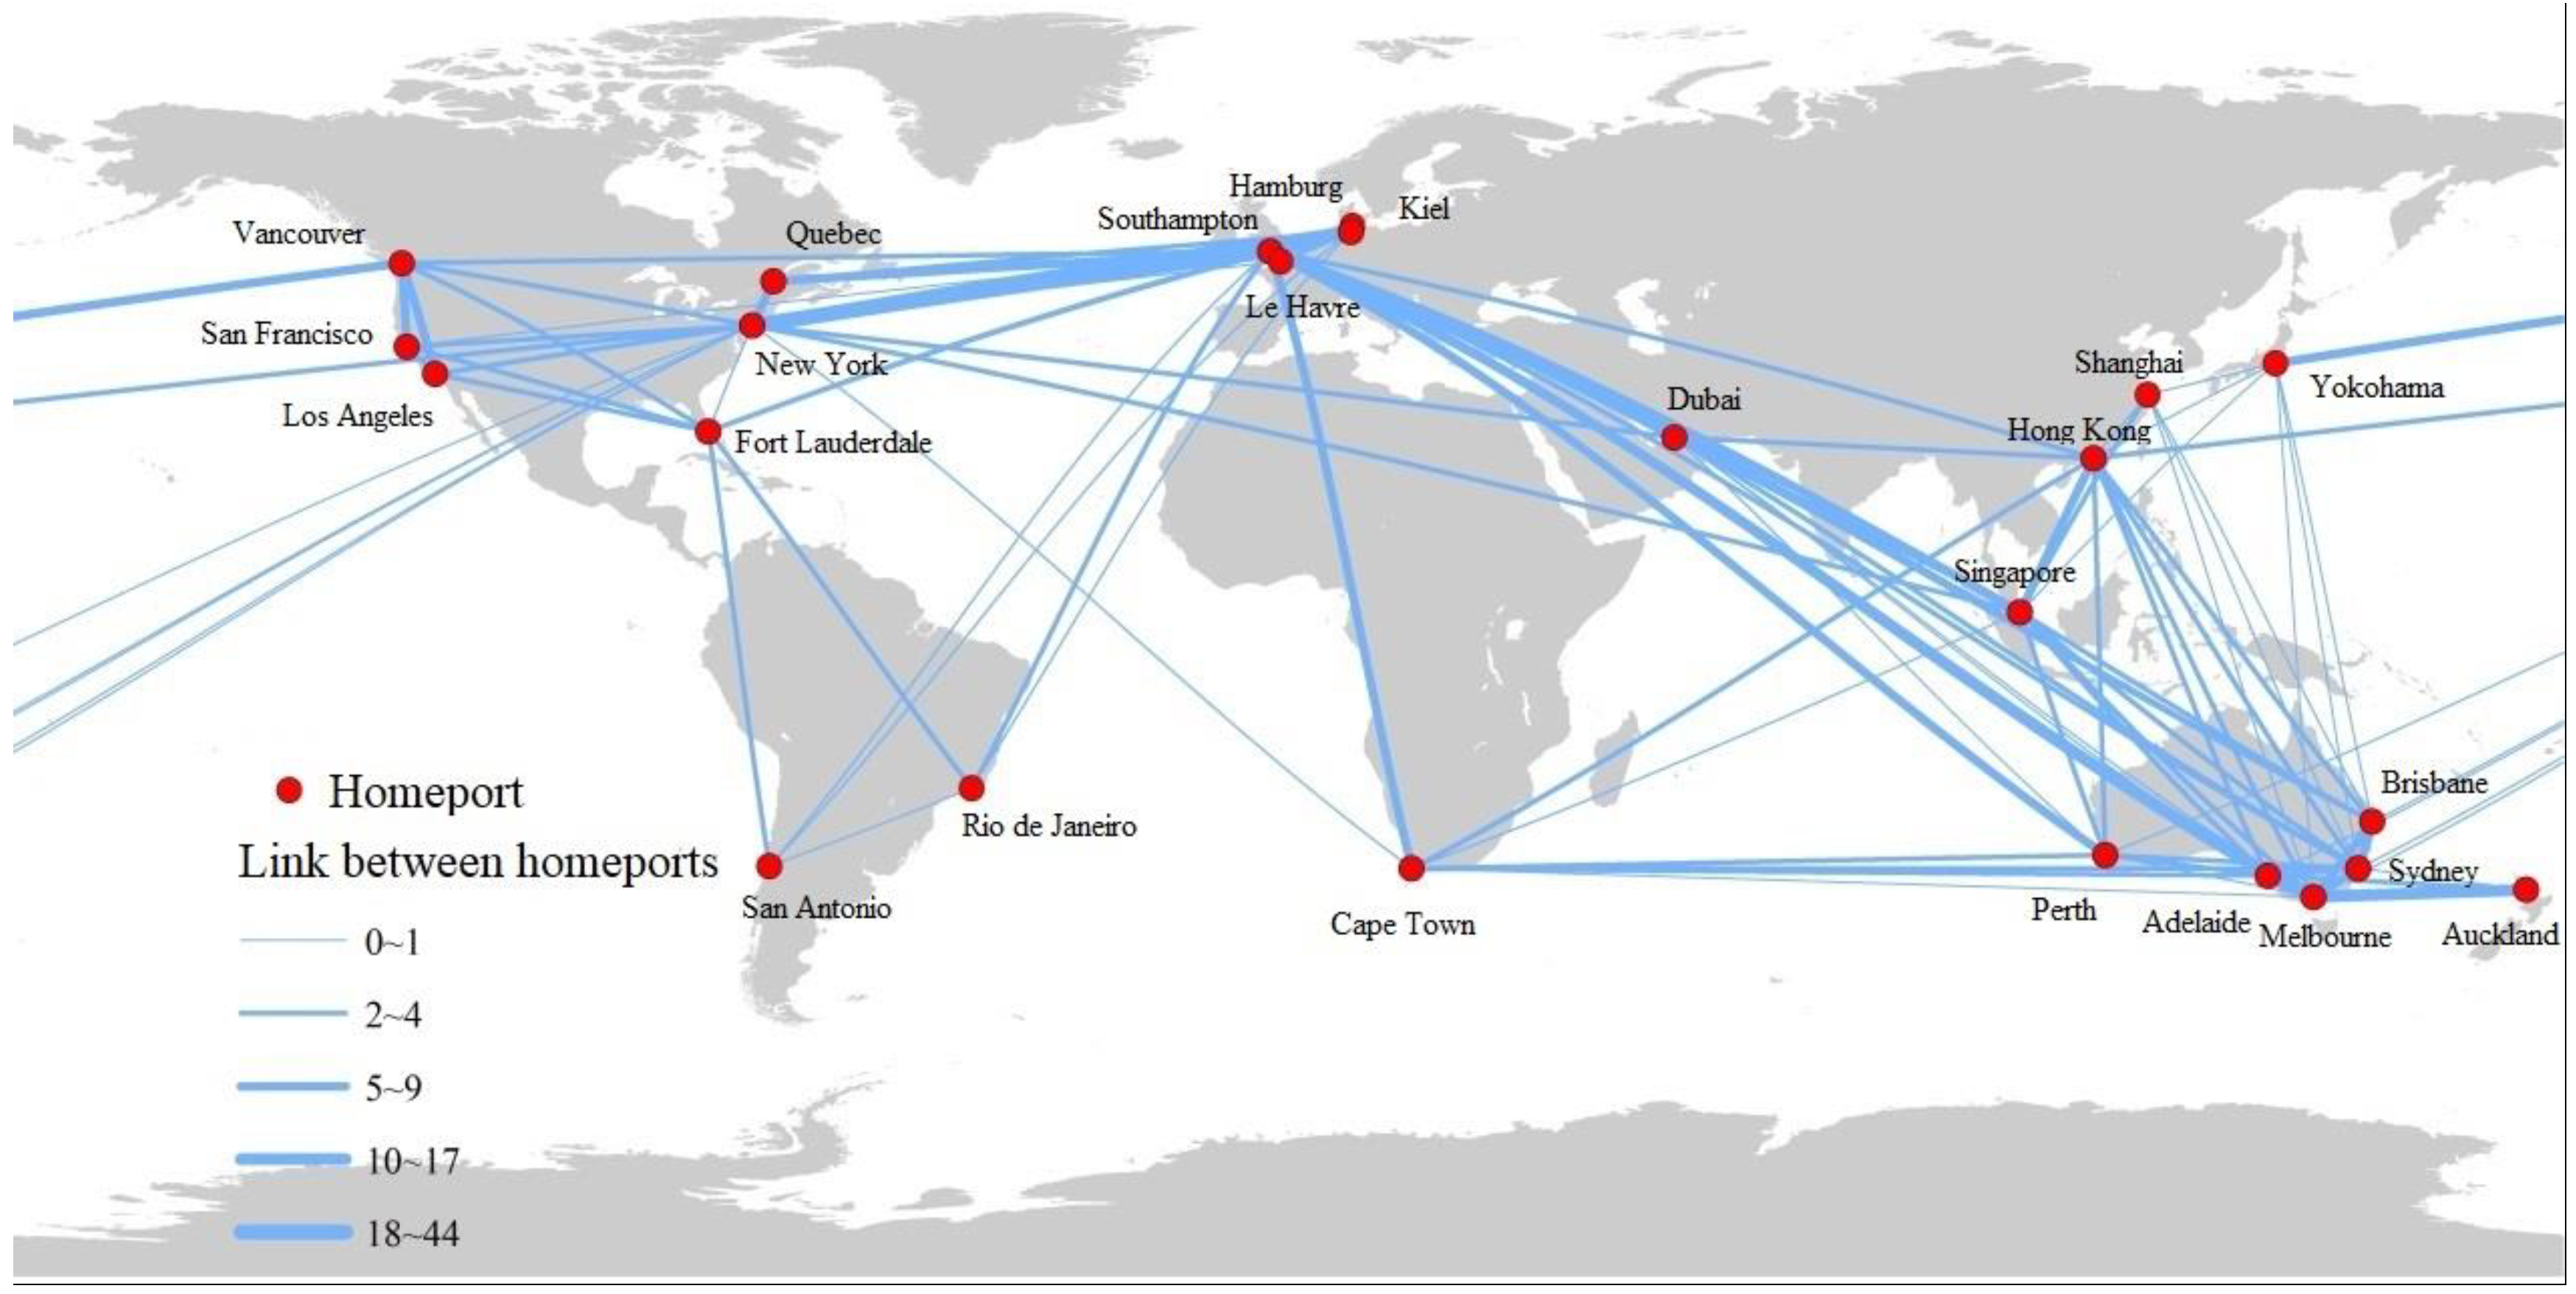
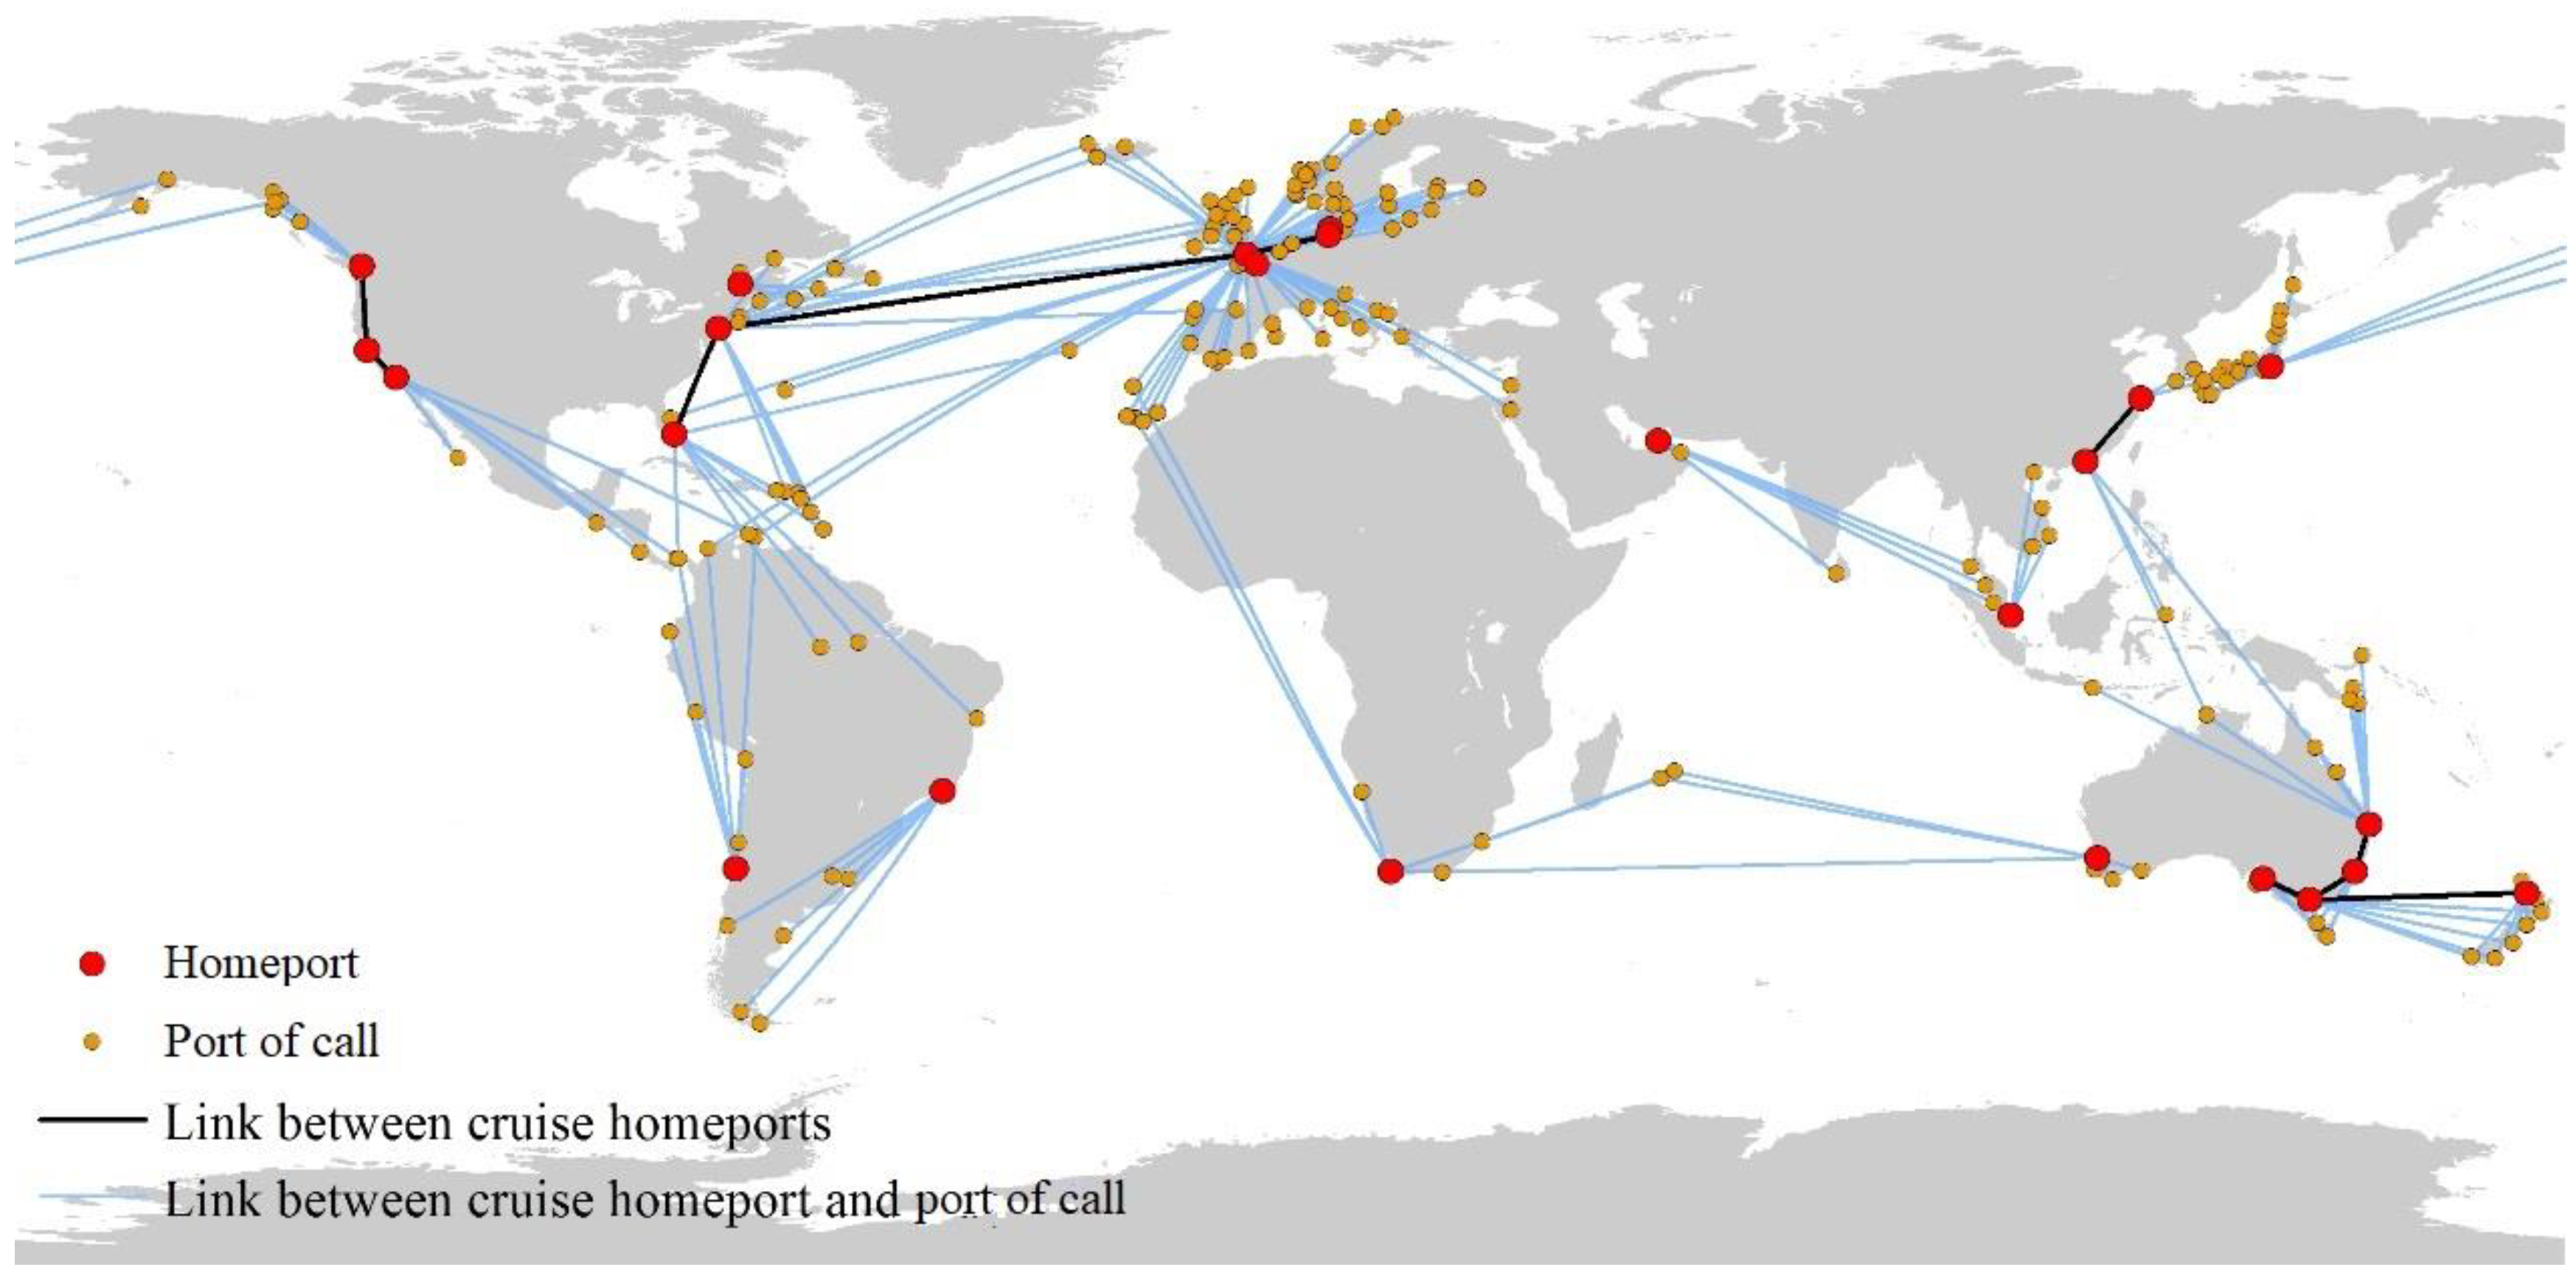
4.2.4. Spatial Systems of Cruise Ports

The above introduces the characteristics of the itinerary and the differentiation of ports. According to the space region of cruise ship voyages, the regional distribution of cruise homeport, Cunard divides the long and round-the-world itineraries into several regional itineraries. Then, the itineraries of each region are further divided to form a group of itineraries with the same embarkation port. Based on the conceptual model of port group formation under space and connectivity criteria, we divide the homeport and the port of call, which are contacted by different itinerary groups [38]. Theoretically, twenty-four port organization systems can be formed by combining the geographical regions of the cruise homeport and ports of call, but only 17 are identified (Figure 8). They are the Europe system, the Eastern North American system, the Western North American system, the Alaska system, the Caribbean system, the Northeast Canada system, the Western South America system, the Eastern South America system, the South Africa system, the Middle East system, the South China system, the East Asia system, the Southeast Asia system, the Northeast Asia system, the West Australia system, the East Australia system, and the North Australia system. This indicates the regional character of the cruise port system.
(1) The homeport is the core of these cruise port systems. Based on the number of cruise homeports, these cruise port systems can be further divided into two types. One type of cruise port system has more than two homeports, which is relatively complex, including the European system and the East Australia system. For example, in the Europe system, there are 68 ports of call with the cruise homeports of Southampton, Hamburg, Kiel, and Le Havre, which are distributed in Western Europe. Another type of cruise port system has only one homeport, including the Eastern North America system, the Western North America system, the Alaska system, the Caribbean system, the Northeast Canada System, the Western South America system, the Eastern South America system, the South Africa system, the Middle East system, the South China system, the East Asia system, the Southeast Asia system, the Northeast Asia system, the West Australia system, and the North Australia system. For example, the Eastern South America system has one homeport of Rio de Janeiro and six ports of call. The regional port system with multiple homeports has a larger source market and higher demand for itineraries. Therefore, the port connections of these systems are more complex and the grade of the homeport is higher.
(2) The cruise port systems not only have characteristics of proximity, but also show connectivity. As shown in Figure 8, the Middle East system is adjacent to the Southeast Asia system. The Eastern South America system is adjacent to the Western South America system. This is the result of the division of the round-the-world itinerary. Meanwhile, other systems are connected. The connectivity is controlled mainly by two factors. One case is the connection between homeports. In two adjacent cruise port systems, there are direct itineraries between these cruise homeports. For example, the East Asia system and the South China system are connected by ports of Hong Kong and Shanghai. The East Australia system and the North Australia system are connected through the ports of Brisbane, Sydney, and Melbourne. The Alaska system and the Western North America system are connected through Vancouver, Los Angeles, and San Francisco, while the Eastern North America system, Caribbean system, and Europe system are connected through Southampton, New York, and Fort Lauderdale. From the perspective of spatial location, the connections between homeports are all based on spatial proximity, except for the trans-Atlantic connection between Southampton and New York (Cunard is the only shipping company operating a scheduled passenger service between North America and Europe). The other is the connection between ports of call. One or more common ports of call are contained in two different systems. For example, the South Africa system is connected to the West Australia system through Port Elizabeth, Port Louis, and at the same time, to the Europe system through Tenerife and Madeira. From the perspective of itineraries, the main reason is that the ports of call are used more repeatedly by cruise ships sailing in different directions.
(3) The space radiation range of the homeport in the cruise port system is different. Some homeports, like Vancouver in the Alaska system, Singapore in the Southeast Asia system, radiate in a small region. The radiation area of other homeports is larger, including Dubai in the Middle East system, Cape Town in the South Africa system, etc. However, the radiation range is not directly related to the grade of the homeport, but is related to the arrangement of the itinerary and the spatial distance between regional homeports.
(4) The extension of the coastline, the spatial distribution of the ports, and the directionality of the cruise itineraries determine the form of the port system. The port systems of a single tend to be linear or fan-shaped, including the Western North American system, the Alaska system, the Western South America system, the Eastern South America system, the South Africa system, the Middle East system, the South China system, the East Asia system, the Southeast Asia system, the Northeast Asia system, the West Australia system, and the North Australia system.

5. Conclusions and Discussion

Differences in cruise itineraries have led to distinctive market segments [15]. From the perspective of geography, this study reveals the characteristics of itinerary and port organization. As a typical representative of the world cruise, Cunard provides differentiated leisure itineraries for cruise passengers and forming a regional and global cruise ports network through the configuration of cruise ports around the world.
The results clearly show that the long durations, open itineraries mainly, especially the “itinerary group”, were formed through the division of longer voyages, which are characteristic of Cunard’s itineraries. The ports used by Cunard are distributed in more than 60 countries and regions around the world. However, the regional agglomeration distribution of the itinerary group determines that the spatial organization of different functional ports (homeports, ports of call) also shows regionalization, so that several port space systems are formed. Therefore, from the perspective of geography, the itinerary and port organization of Cunard show the co-existence of globalization and regionalization.

5.1. Choice of Cruise Company

In principle, to complete the world navigation, the Cunard cruise needs to make the best use of cruise ports around the world, including cruise homeports and ports of call. At the same time, it is necessary to allocate the sailing time of ships in different regions reasonably, by using a limited number of ports. Cunard firstly builds a global layout of homeports which are key ports within a region or country. For example, New York harbor is the largest in the United States, and Sydney harbor is the busiest tourist distribution center in Australia. Hamburg is the most important port in Germany. These homeports are located in cities of high grade, dense population, developed economy, and rich tourism resources. Cunard takes the homeports of different regions as the center and the port of call as the supplement to build the regional itinerary network. However, in different regions, the duration of the vessel voyage determines the different classes between homeport and the complexity of the regional cruise port system. Actually, for world cruise ships, the allocation of the sailing time in different regions is influenced by seasonal factors of regional cruise ports and markets. Some cruise regions are less affected by the seasonality of activities, such as the Caribbean, the Mediterranean, and Europe. Cruise ships will voyage longer in these regions, while shorter in some regions where seasonality is evident, including Alaska, Canada, Australia/New Zealand, etc. [15]. Besides, cruises around the world require ships to voyage from one region to another. No matter which area the ships are sailing in, Cunard is guaranteed to operate during the high season. Doing this also helps to ensure a high occupancy rate.
As for Cunard, the itinerary group multiplies the number of itineraries. As for cruise lines, the number of ports used has remained stable, but the diversity of itineraries has greatly increased. Without a division of itineraries, just 65 itineraries are enough for all Cunard liners in a cycle (usually one year); less than a quarter of the current number. Voyages around the world usually last three months, even longer, which is difficult to ensure the occupancy rate of cruise ships without dividing the itineraries. In this way, cruise lines do not have to pay additional port charges but can offer passengers a more diverse itinerary experience, which can attract passengers with different preferences and increases occupancy rates. For cruise passengers, long itineraries are generally targeted at the elderly who have enough leisure time. However, the itinerary group formed by division can attract several young passengers and families with short leisure time. The itinerary of Cunard is more finely divided, and the shortest itinerary is only two days in the itinerary group. Besides, after the itinerary is divided, cruise passengers can reduce travel costs, because more ports can choose to board. From the perspective of itinerary structure and port functions, the main reason why the itinerary can be subdivided is that, in the middle part of the itinerary, some ports of call for ships can also provide the boarding service to the passenger, such as the homeport. Therefore, these ports, for passengers of different itineraries, have both the functions of a homeport and a port of call.
Compared with similar types of cruises, Cunard can maintain the maximum passenger capacity, which is closely related to the arrangement of the itinerary group and the layout of the homeports in different regions. The construction of the itinerary group is not only restricted by the port space location, but also affected by the immigration management policy, passenger consumption habits, etc., in a region. For example, the Asian market is year-round, with plenty of customers, especially in China. However, only two homeports, Hong Kong and Shanghai, are used by Cunard. Due to the current immigration policy in China, the passengers can only board and disembark at the same homeport in an itinerary, as shown in Figure 4c, which makes it hard to design the itinerary group. Compared to different types of cruises, most homeports used by Cunard are located on the mainland coast and in developed countries, and some homeports are reused by a different cruise in different itineraries. The source market hinterlands and the affluence of the port city of the homeport may be the main factor.

5.2. Challenge of Resuming Voyage

With the COVID-19 pandemic and no vaccine, the resuming voyage of cruise ships remains a challenge. Most countries and local governments have adopted stricter entry-exit policies, including restrictions on flights and ports, to reduce the mobility of international personnel and keep social distancing [44]. These have become an external obstacle to resume for Cunard, as shown in the following aspects.
(1) Long cruises, even round-the-world trips, are impossible during the COVID-19 cruise tourism crisis, and Diamond Princess has clearly demonstrated that long cruises provide “Petri dish” environment for COVID-19 [51].
(2) This itinerary structure of the “itinerary group” is more dangerous during the COVID-19 epidemic because passengers from different ports of embarkation will disembark at the same or different ports. This increases the chance for passengers from different regions to share the same vessel and speeds up the mobility of personnel between regions [52]. For the company, this greatly increases the difficulty and cost of COVID-19 prevention and control.
(3) Cunard’s itineraries require the cooperation of the cruise ports in many countries and regions around the world, but the current global travel ban, especially most cruise ports, does not allow cruise ships to be used. Therefore, the conditions for its resumption are basically not available.
(4) Due to the relatively closed space on the ship and the fact that it targets middle-aged and elderly customers, it is more difficult to prevent and control the disease.

5.3. Suggestions and Reflections of Resuming Voyage

The full resumption of the cruise industry is still unclear, but individual cruise lines have announced a resumption date. For Cunard and other world cruises, if they want to resume voyage as soon as possible, they can try to make adjustments in the following aspects.
(1) Local mobility
As for Cunard, the itinerary organization of the cruise ports indicates that it will not only simply visit ports around the world, but also further organize several cruise itineraries in some regions, which account for more than 70 percent of all itineraries. Besides, the grade difference of homeports used by Cunard indicates its choice and positioning of global source markets. Europe is the main source market, followed by North America and Australia-New Zealand, then Asia, and finally South America, South Africa, etc. For the regional port systems, the European system is on a large scale. Therefore, under the circumstance that the round-the-world trip cannot be provided and the open conditions are satisfied, it may be the best choice for Cunard to try to provide a regional cruise service, with Southampton as the homeport.
(2) Shorter itinerary and no itinerary group
Currently, the resume cruise itineraries serviced by cruise lines are mostly short, in order to avoid contact between passengers from different regions and reduce the time onboard. Under the current situation, the itinerary shown in Figure 4a or Figure 4c is the one adopted by cruise ships that have resumed voyage without the itinerary group. In addition, a short cruise without destination, even cruise sightseeing without itinerary, may also be an option.
(3) Strict boarding and safety on board
Before boarding the ship, passengers and crew should pass the strict virus inspection and health observation, in order to ensure that the passengers aboard the ship are safe. Besides, health tracking, space safety, and air purification and flow, etc. should be essential on board. Comparing the resumed cruises with Cunard (Table 2), the minimum per capita space of Cunard is bigger. To reduce the number of personnel on board, the current full capacity of the cruises is about 60% to 70%, which can keep operating safely in this COVID-19 world.

Author Contributions

Conceptualization, X.L. and C.W.; writing—original draft preparation, X.L.; writing—review and editing, X.L.; visualization, X.L.; revision, X.L., C.W. and C.D.; funding acquisition, C.W. All authors have read and agreed to the published version of the manuscript.

Funding

This research was supported by the National Natural Science Foundation of China (Grant No. 42071151), the Strategic Priority Research Program of the Chinese Academy of Sciences (Grant No. XDA20010101), the Key project of the Chinese Academy of Sciences (Grant No. ZDRW-ZS-2017-4).

Acknowledgments

The authors thank the editors and referees for their helpful comments and suggestions.

Conflicts of Interest

The authors declare no conflict of interest.

References

  1. Cruise Market Watch. Growth of the Ocean Cruise Line Industry. 2020. Available online: https://cruisemarketwatch.com/growth/ (accessed on 1 July 2020).
  2. Radic, A. Towards an understanding of a child’s cruise experience. Curr. Issues Tour. 2019, 22, 237–252. [Google Scholar] [CrossRef]
  3. Wanhill, S.R.C. Some aspects of cruise ships. Marit. Policy Manag. 1982, 9, 251–257. [Google Scholar] [CrossRef]
  4. Charles, P.N.; Marques, B. Determining factors for the distribution of cruise tourism across the Caribbean. Tour. Econ. 2012, 18, 1051–1067. [Google Scholar] [CrossRef]
  5. Castillo, M.J.I.; Fageda, X.; Gonzalez, L.F. An analysis of the determinants of cruise traffic: An empirical application to the Spanish port system. Transport. Res. E -Logist. Transport. Rev. 2014, 66, 115–125. [Google Scholar] [CrossRef]
  6. Sun, X.; Yip, T.L.; Lau, Y.Y. Location characteristics of cruise terminals in China: A Lesson from Hong Kong and Shanghai. Sustainability 2019, 11, 5056. [Google Scholar] [CrossRef] [Green Version]
  7. Liu, Y.; Dong, E.; Li, S.; Jie, X.W. Cruise tourism for sustainability: An exploration of value chain in Shenzhen Shekou port. Sustainability 2020, 12, 3054. [Google Scholar] [CrossRef] [Green Version]
  8. Marti, B.E. Trends in world and extended-length cruising (1985–2002). Mar. Policy 2004, 28, 199–211. [Google Scholar] [CrossRef]
  9. Pallis, A.A. Cruise Shipping and Urban Development, State of the Art of the Industry and Cruise Ports; International Transport Forum Discussion Papers; OECD Publishing: Paris, France, 2015. [Google Scholar]
  10. Lee, S.; Brezina, S. Cruise line efficiency: An analysis of seven cruise lines’ operational efficiency. Tour. Econ. 2016, 22, 1075–1086. [Google Scholar] [CrossRef]
  11. Rodrigue, J.P.; Notteboom, T. The geography of cruises, itineraries, not destinations. Appl. Geogr. 2013, 38, 31–42. [Google Scholar] [CrossRef]
  12. Charlier, J.; Mccalla, R. A geographical overview of the world cruise market and its seasonal complementarities. In Cruise Ship Tourism; The British Library: London, UK, 2006; pp. 18–30. [Google Scholar]
  13. Mink, R. Fantastic voyages: Whether around the world or around the hemisphere, extended cruises are dreams come true. Cru Tra 1992, 14, 46–50. [Google Scholar]
  14. Ward, D. Ocean Cruising and Cruise Ships 2004; Berlitz Publishing: London, UK, 2004. [Google Scholar]
  15. Chang, Y.T.; Park, H.; Liu, S.M.; Liu, S.M.; Roh, Y. Economic impact of cruise industry using regional input-output analysis: A case study of Incheon. Marit. Policy Manag. 2016, 43, 1–18. [Google Scholar] [CrossRef]
  16. Brida, J.G.; Bukstein, D.; Tealde, E. Exploring cruise ship passenger spending patterns in two Uruguayan ports of call. Curr. Issues Tour. 2015, 18, 684–700. [Google Scholar] [CrossRef]
  17. Jeronimo, E.P.; Antonio, G.S. Characteristics and consequences of the cruise traffic seasonality on ports: The Spanish Mediterranean case. Marit. Policy Manag. 2017, 44, 358–372. [Google Scholar]
  18. Dehoorne, O.; Tatar, C.; Theng, S. Cruise tourism: Global logic and Asian perspectives. Adv. Intell. Syst. Comput. 2014, 254, 447–460. [Google Scholar]
  19. Hung, K.; Wang, S.; Guillet, B.D.; Liu, Z.P. An overview of cruise tourism research through comparison of cruise studies published in English and Chinese. Int. J. Hosp. Manag. 2019, 77, 207–216. [Google Scholar] [CrossRef]
  20. Radic, A.; Popesku, J. Quality of cruise experience: Antecedents and consequences. Teme 2018, 42, 523–539. [Google Scholar]
  21. Ward, D. Berlitz Complete Guide to Cruising and Cruise Ships; Berlitz Publishing: New York, NY, USA, 1995. [Google Scholar]
  22. Cruise Industry News. Cunard Cancels Cruises Into 2021 and Makes Sweeping Deployment Changes. 2020. Available online: https://www.cruiseindustrynews.com/cruise-news/23419-cunard-cancels-cruises-into-2021-and-makes-sweeping-deployment-chnages.html (accessed on 6 September 2020).
  23. Jeronimo, E.P.; Antonio, G.S. Determination of seasonality patterns in the transport of cruise travelers through clustering techniques. J. Navig. 2019, 72, 1417–1434. [Google Scholar]
  24. Han, H.; Eom, T.; Chung, H.; Lee, S.; Ryu, H.B.; Kim, W. Passenger repurchase behaviors in the green cruise line context: Exploring the role of quality, image, and physical environment. Sustainability 2019, 11, 1985. [Google Scholar] [CrossRef] [Green Version]
  25. Lee, S.; Ramdeen, C. Cruise ship itineraries and occupancy rates. Tour. Manag. 2013, 34, 236–237. [Google Scholar] [CrossRef]
  26. Jeon, J.W.; Duru, O.; Yeo, G.T. Cruise port centrality and spatial patterns of cruise shipping in the Asian market. Marit. Policy Manag. 2019, 46, 257–276. [Google Scholar] [CrossRef]
  27. Marianna, S. Cruise Itinerary Planning. Cruise Ship Tourism; The British Library: London, UK, 2017; pp. 524–545. [Google Scholar]
  28. Tan, K. Smart New Ocean Industries: Growth of Cruise Tourism in Asia; World Ocean Forum: Busan, Korea, 2011. Available online: http://webcache.googleusercontent.com/search?q=cache:XK6jX9RhLHMJ:kami.kr/sub02/2011/2011_s05_02.ppt+&cd=1&hl=en&ct=clnk&gl=uk (accessed on 22 April 2016).
  29. Papathanassis, A.; Beckmann, I. Assessing the ‘poverty of cruise theory’ hypothesis. Ann. Tour. Res. 2011, 38, 153–174. [Google Scholar] [CrossRef]
  30. Pallis, A.A.; Arapi, K.P. Cruise port market dynamics, the Mediterranean Sea as a multi-port cruise region. In Proceedings of the IAME 2015 Annual Conference, Kuala Lumpur, Malaysia, 23–27 August 2015. [Google Scholar]
  31. Mccalla, R.; Charlier, J. Round-the-world cruising, a geography created by geography. In Cruise Ship Tourism; The British Library: London, UK, 2006; pp. 206–222. [Google Scholar]
  32. Marti, B.E. Geography and the cruise ship port selection process. Marit. Policy Manag. 1990, 17, 157–164. [Google Scholar] [CrossRef]
  33. Cusano, M.I.; Ferrari, C.; Tei, A. Port hierarchy and concentration: Insights from the Mediterranean cruise market. Int. J. Tour. Res. 2017, 19, 235–245. [Google Scholar]
  34. Notteboom, T. Container shipping and ports, an overview. Rev. Net. Econ. 2004, 3, 86–106. [Google Scholar] [CrossRef] [Green Version]
  35. Notteboom, T. Traffic inequality in seaport systems revisited. J. Transp. Geogr. 2006, 14, 95–108. [Google Scholar]
  36. Wang, C.J.; Wang, J.E. Spatial pattern of the global shipping network and its hub-and-spoke system. Res. Transp. Econ. 2011, 32, 54–63. [Google Scholar]
  37. Ducruet, C. Maritime Networks, Spatial Structures and Time Dynamics; Routledge: London, UK; New York, NY, USA, 2015. [Google Scholar]
  38. Ducruet, C.; Notteboom, T. The Worldwide maritime network of container shipping, spatial structure and regional dynamics. Glob. Netw. 2012, 12, 395–423. [Google Scholar]
  39. Liu, B.; Pennington, -G.L.; Klemmer, L. Using social media in hotel crisis management: The case of bed bugs. J. Hosp. Tour. Technol. 2015, 6, 102–112. [Google Scholar]
  40. Radic, A. Crisis management in cruise tourism: A case study of Dubrovnik. AT-TIJ 2015, 8, 29–44. [Google Scholar]
  41. World Tourism Organization (WTO). Cruise Tourism: Current Situation and Trends. 2010. Available online: www.e-unwto.org/ (accessed on 21 April 2016).
  42. Mallapaty, S. What the cruise-ship outbreaks reveal about COVID-19. Nature 2020, 580, 18. [Google Scholar] [CrossRef] [Green Version]
  43. Radic, A.; Law, R.; Michael, L.; Kang, H.; Ariza-Montes, A.; Arjona-Fuentes, J.M.; Han, H. Apocalypse Now or Overreaction to Coronavirus: The Global Cruise Tourism Industry Crisis. Sustainability 2020, 12, 6968. [Google Scholar] [CrossRef]
  44. Gossling, S.; Scott, D.; Hall, C.M. Pandemics, tourism and global change: A rapid assessment of COVID-19. J. Sustain. Tour. 2020, 1–20. [Google Scholar] [CrossRef]
  45. Cruise Industry News. Costa Deliziosa Set to Sail First Cruise Today. 2020. Available online: https://www.cruiseindustrynews.com/cruise-news/23471-costa-deliziosa-set-to-sail-first-cruise-today.html (accessed on 10 September 2020).
  46. Lekakou, M.B.; Pallis, A.A.; Vaggelas, G.K. Which homeport in Europe, The cruise industry’s selection criteria. Tourismos 2009, 4, 215–240. [Google Scholar]
  47. Bayazit, S.; Torrents, A.; Kirval, L. Main factors to select a cruise homeport in the Mediterranean Region, a perspective from the cruise industry agents. In Proceedings of the International Conference on Logistics, Barcelona, Spain, 27–29 July 2015; IEEE: Piscataway, NJ, USA, 2016. [Google Scholar]
  48. Cullinane, K.; Khanna, M. Economies of scale in large containers ships, optimal size and geographical implications. J. Transp. Geogr. 2000, 8, 181–195. [Google Scholar] [CrossRef]
  49. Veenstra, A.W.; Mulder, H.M.; Sels, R.A. Analysing container flows in the Caribbean. J. Transp. Geogr. 2005, 13, 295–305. [Google Scholar] [CrossRef]
  50. Wang, C.J. Spatial organization networks of world marine container transportation. Geogr. Res. 2008, 27, 636–648. [Google Scholar]
  51. Nikiforuk, A. COVID-19, Brought to You by Globalization. The Tyee. 2020. Available online: https://thetyee.ca/Analysis/2020/03/13/COVID-19-Brought-By-Globalization/ (accessed on 10 September 2020).
  52. Renaud, L. Reconsidering global mobility–distancing from mass cruise tourism in the aftermath of COVID-19. Tour. Geogr. 2020, 22, 679–689. [Google Scholar] [CrossRef]
Figure 1. Cruise port connection system.
Sustainability 12 07893 g001
Figure 2. The duration of Cunard cruise itineraries.
Sustainability 12 07893 g002aSustainability 12 07893 g002b
Figure 3. The type of Cunard cruise itineraries.
Sustainability 12 07893 g003
Figure 4. Simple itinerary (one-way and round-trip) and itinerary group.
Sustainability 12 07893 g004
Figure 5. Cruise ports used by Cunard liners.
Sustainability 12 07893 g005
Figure 6. Spatial differentiation of cruise port space on cruise itineraries.
Sustainability 12 07893 g006
Figure 7. The links between cruise homeports.
Sustainability 12 07893 g007
Figure 8. Spatial systems of cruise ports.
Sustainability 12 07893 g008
Table 1. Classification of cruise homeports.
HomeportContact PortsRangeGradeHomeportContact PortsRange Grade
HomeportPort of CallHomeportPort of Call
Southampton17129GlobalISan Francisco411IntercontinentalIII
New York1352GlobalILos Angeles311IntercontinentalIII
Hamburg948IntercontinentalIICape Town58IntercontinentalIII
Sydney1123IntercontinentalIIKiel112regionalIII
Fort Lauderdale625IntercontinentalIIIPerth49IntercontinentalIII
Melbourne822IntercontinentalIIIAdelaide39regionalIII
Yokohama125IntercontinentalIIISan Antonio29IntercontinentalIII
Singapore914IntercontinentalIIIAuckland38regionalIII
Vancouver617IntercontinentalIIIRio de Janeiro10regionalIV
Hong Kong913IntercontinentalIIIQuebec33regionalIV
Brisbane513IntercontinentalIIIShanghai12regionalIV
Dubai711IntercontinentalIIILe Havre10regionalIV
Table 2. Cunard and the resumed cruises.
Queen ElizabethQueen VictoriaQueen Mary 2Costa DeliziosaCosta DiademaMSC Grandiosa
Gross Tonnage (gt)90,90190,049148,52892,720132,500181,000
Passengers (person)2077–25032074–24892726–32712260–27123772–45264888–5772
Min per capita space (gt/person)363645342931

