Stream Flow Changes and the Sustainability of Cruise Tourism on the Lijiang River, China


Abstract
:1. Introduction
2. Materials and Methods
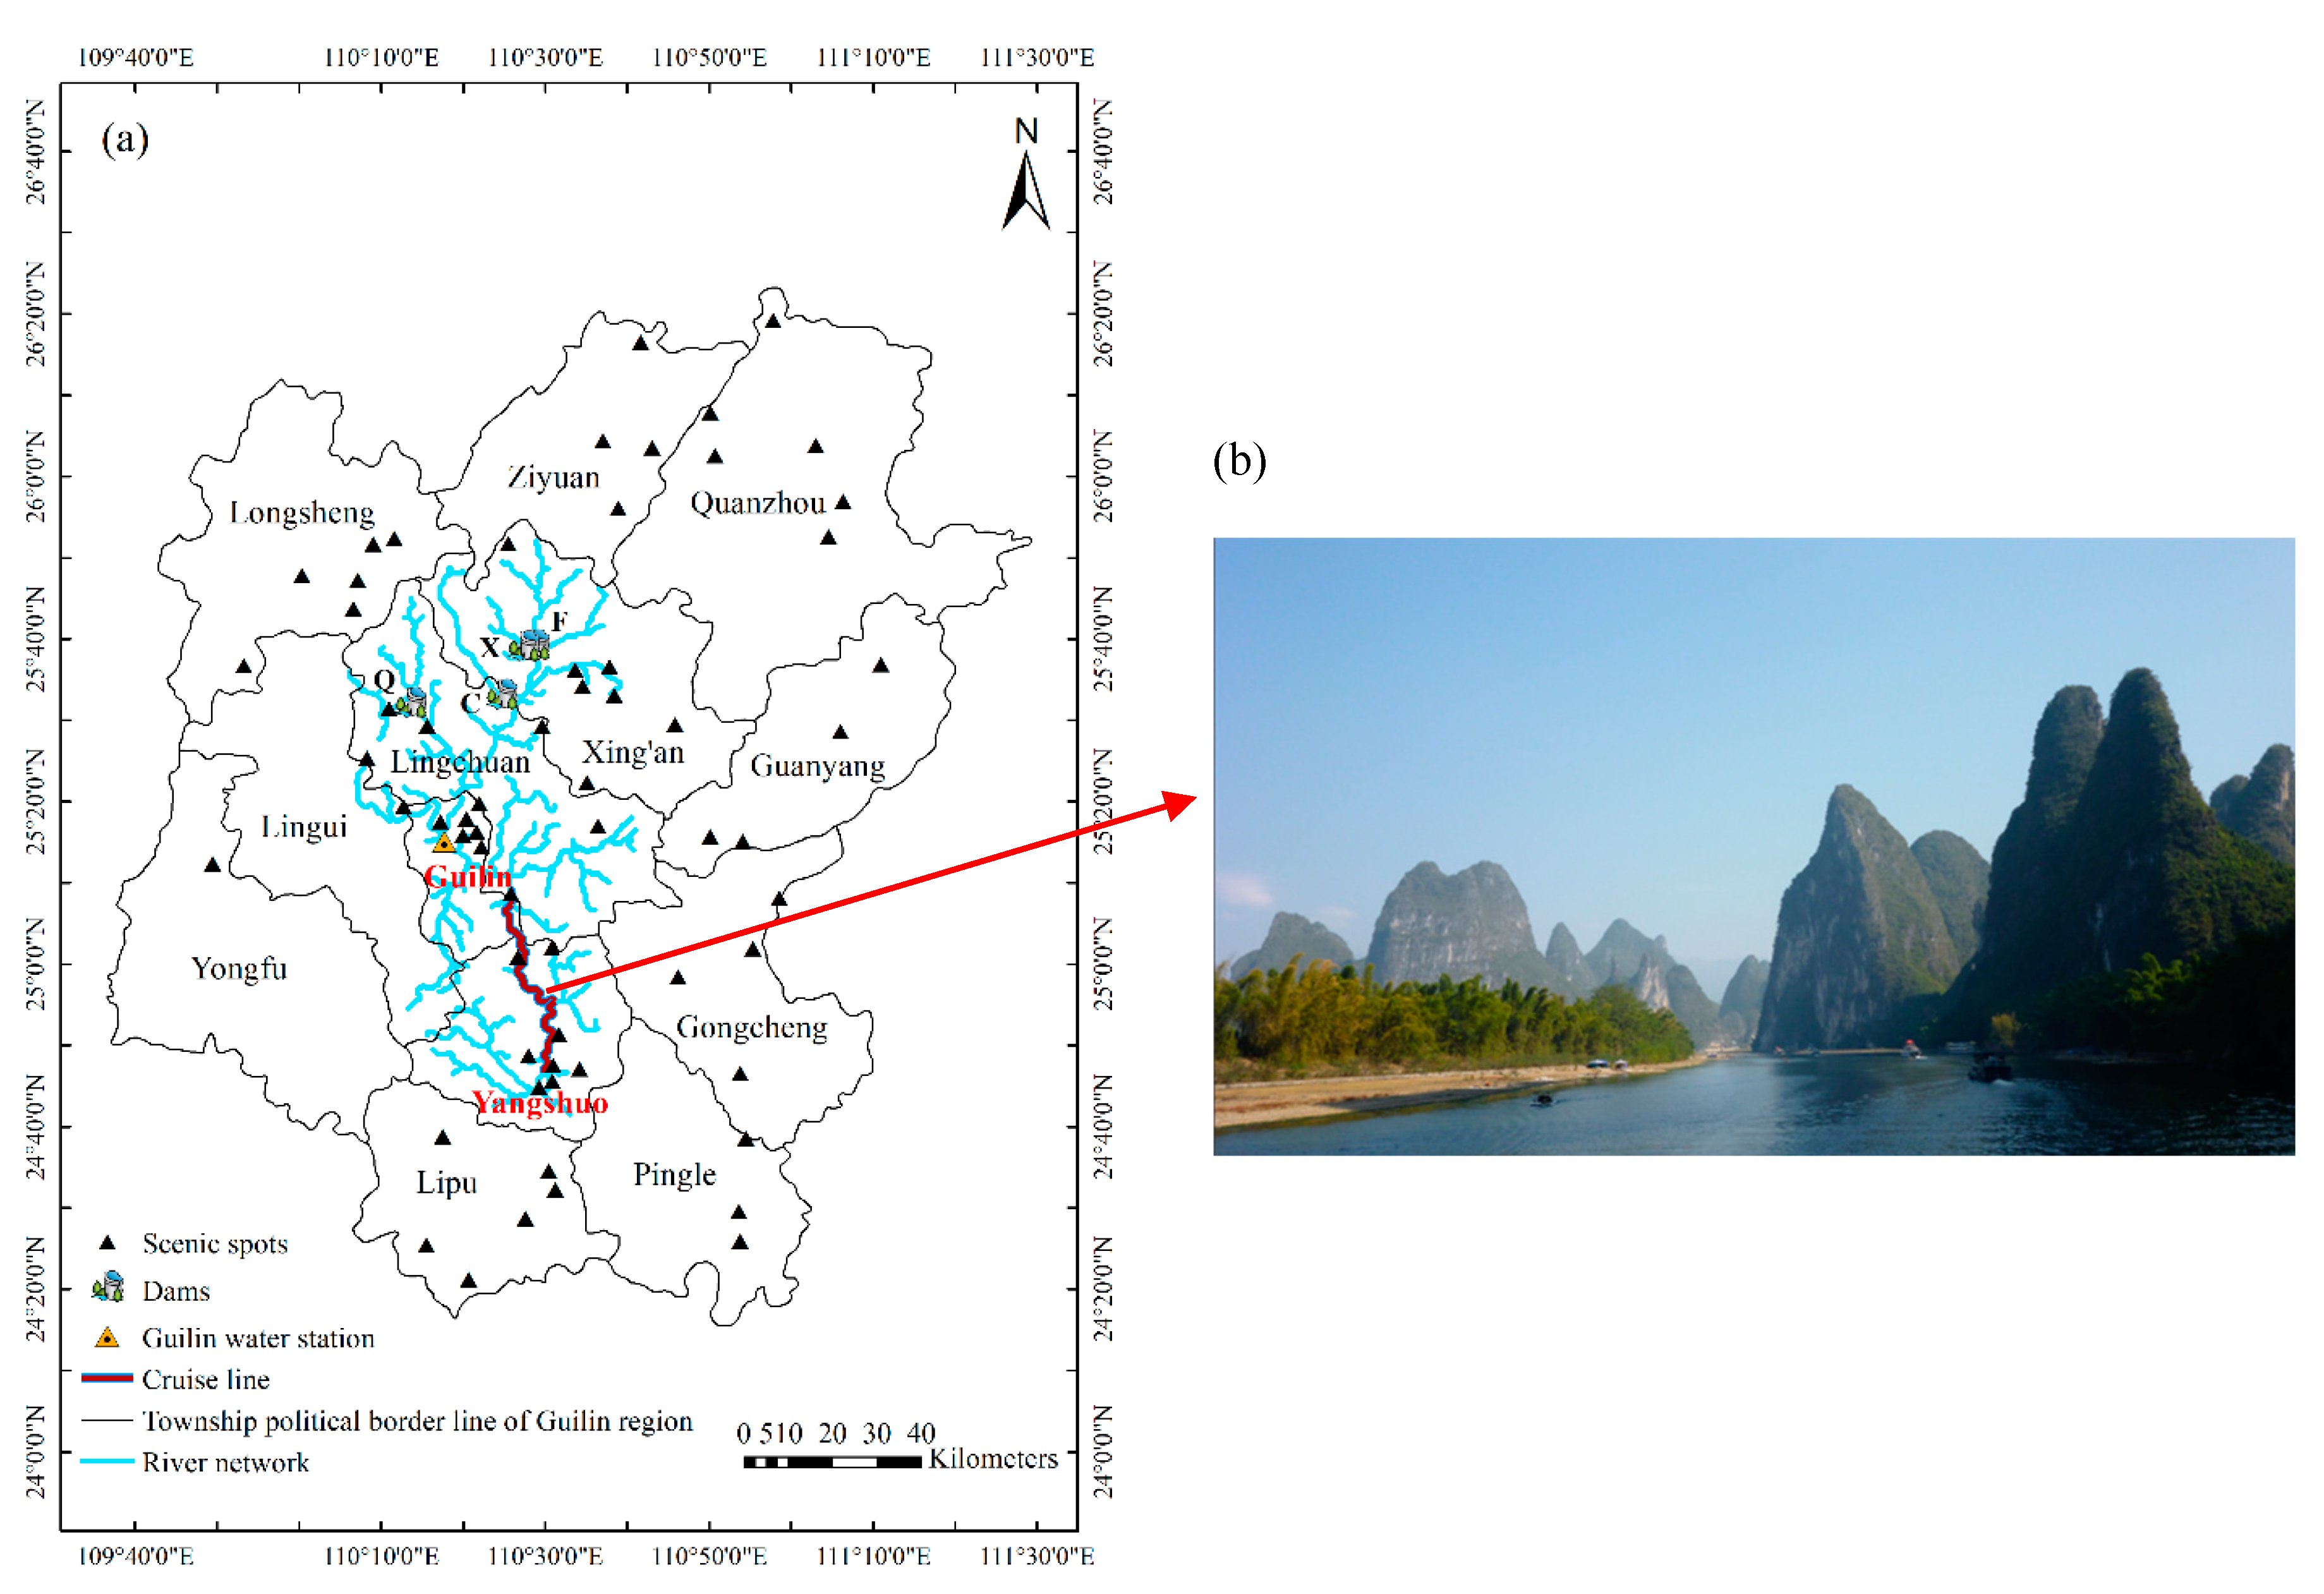
2.1. Study Area
2.2. Methods
2.2.1. Data Sources
2.2.2. Handling Missing Data
2.2.3. Cruise Tourism Development Indicators and Stream Flow Parameters
2.2.4. Linear Regression
2.2.5. Detecting Abrupt Change of the Time Series Data
2.2.6. Correlation Analysis and Granger Causality Test
2.2.7. Future Climate Change Scenario Analysis
2.2.8. Effect of Reservoir Operation on Stream Flow
3. Results
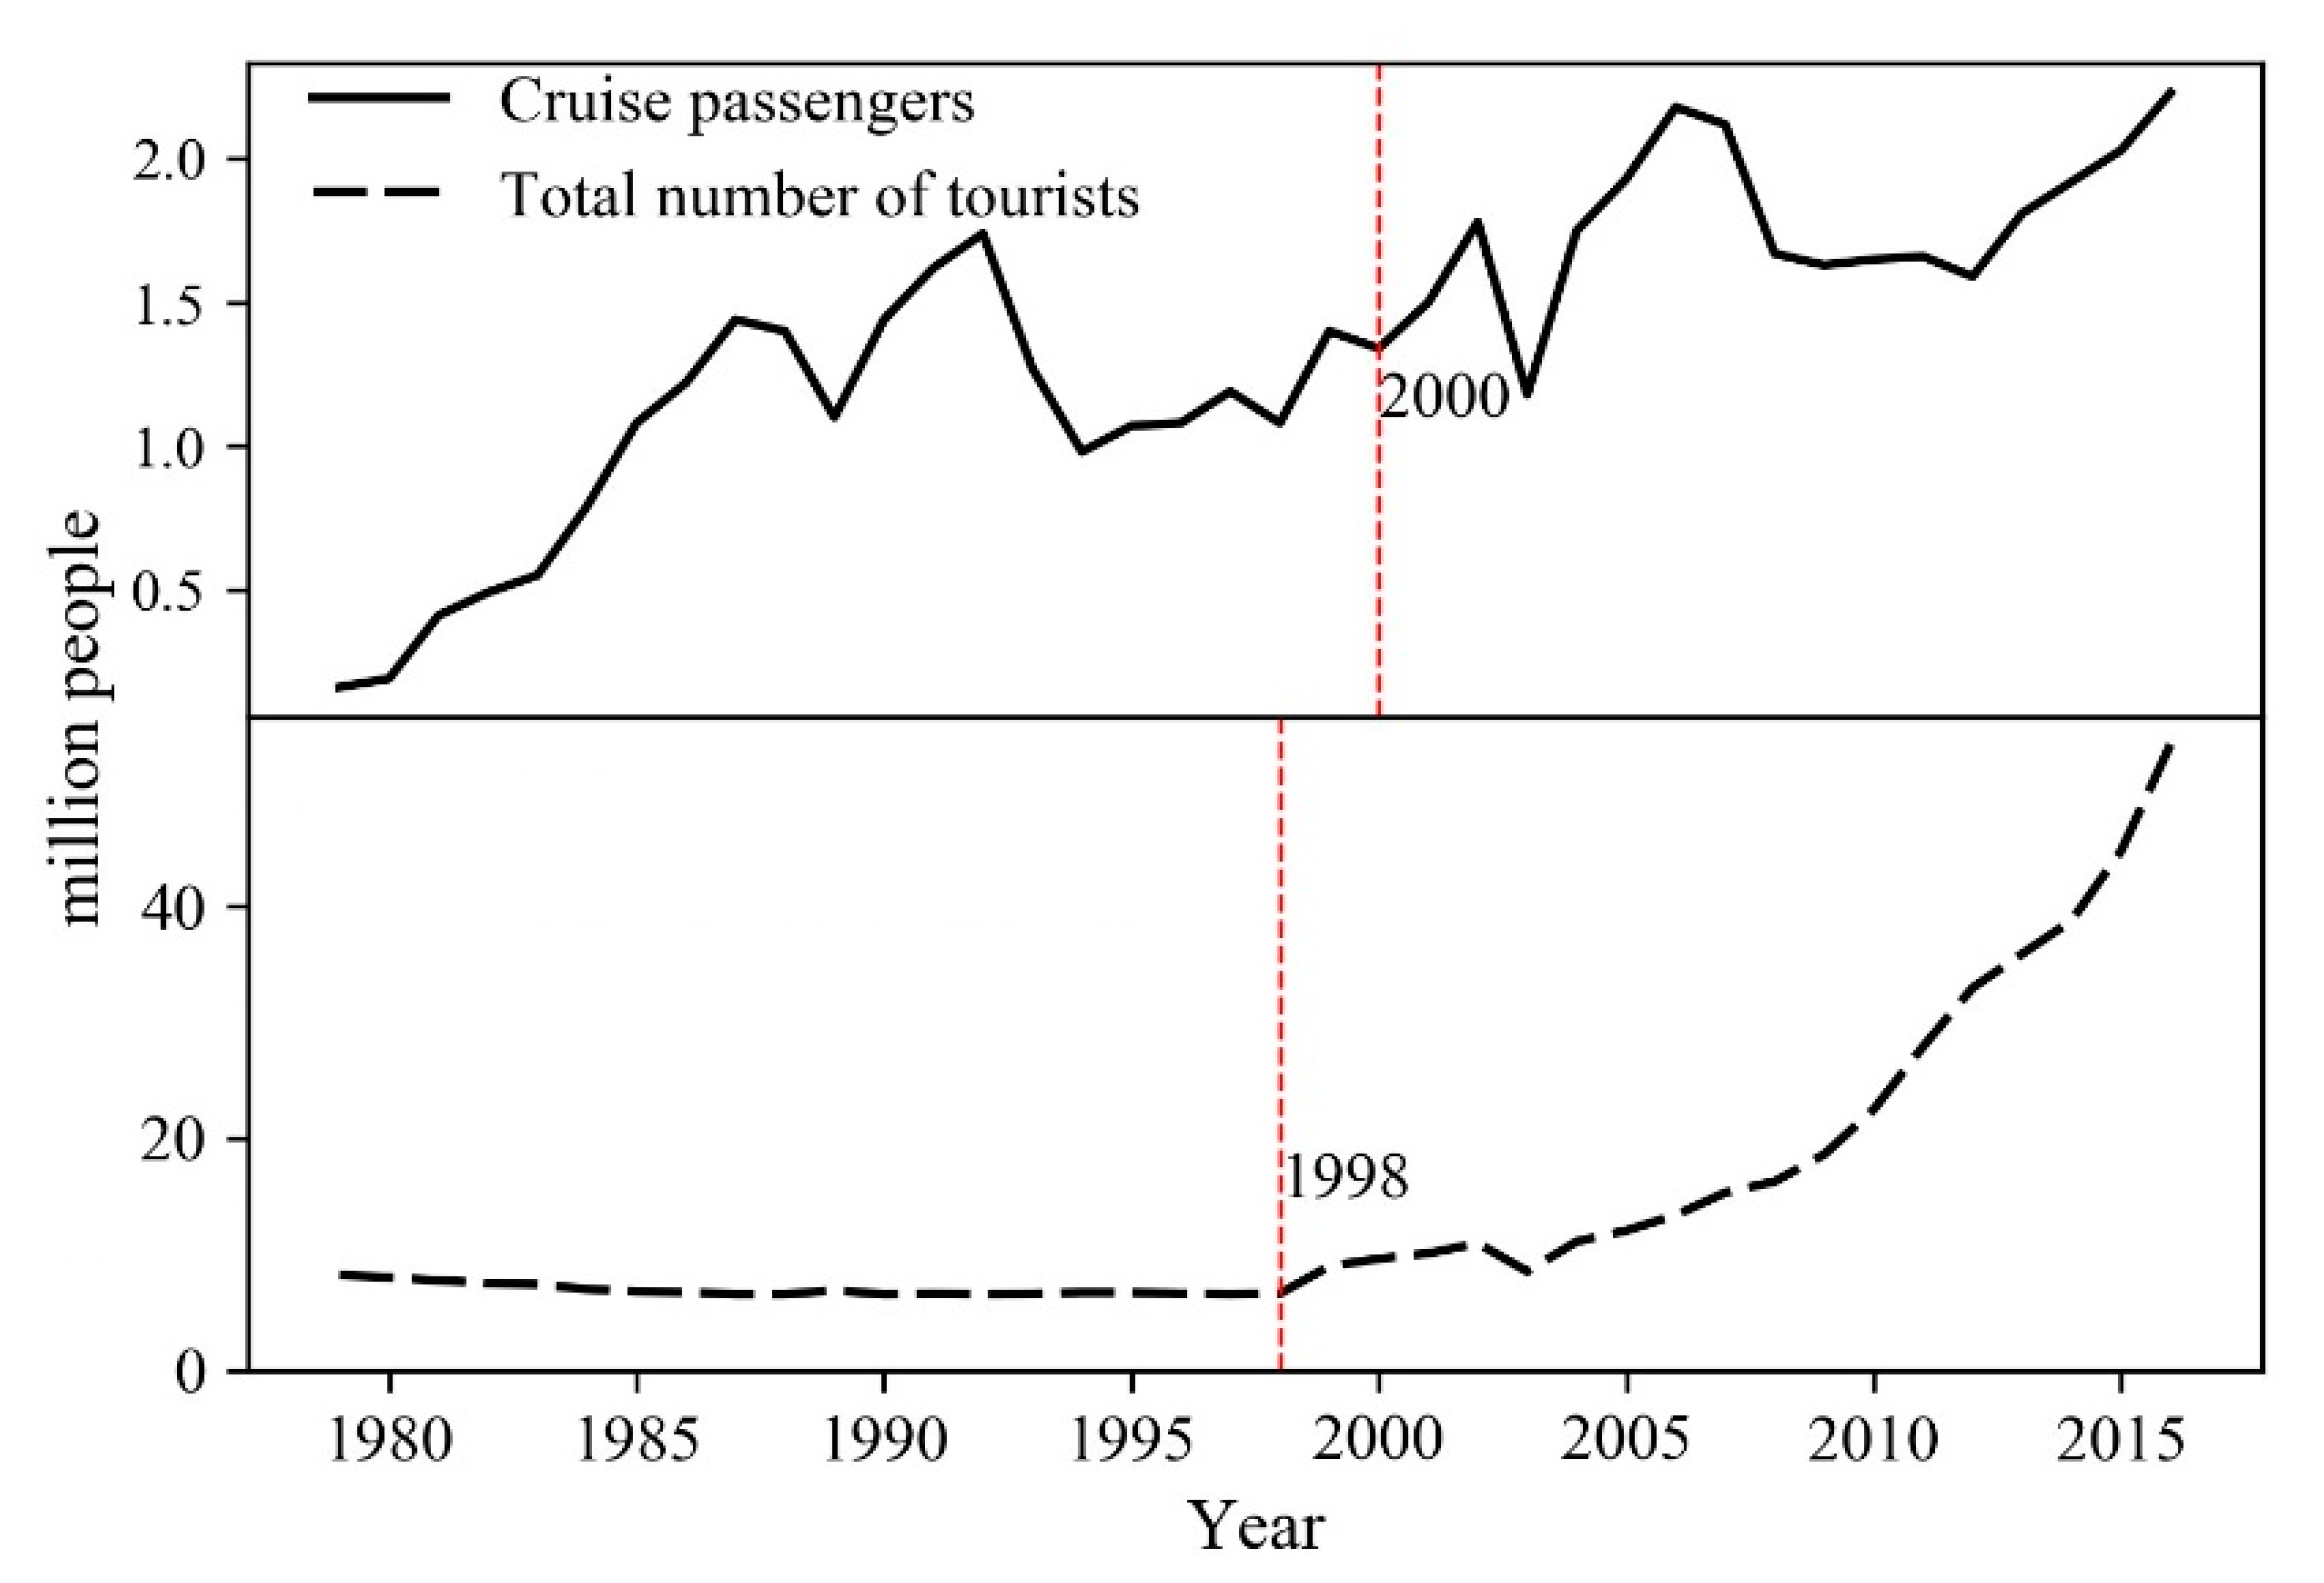
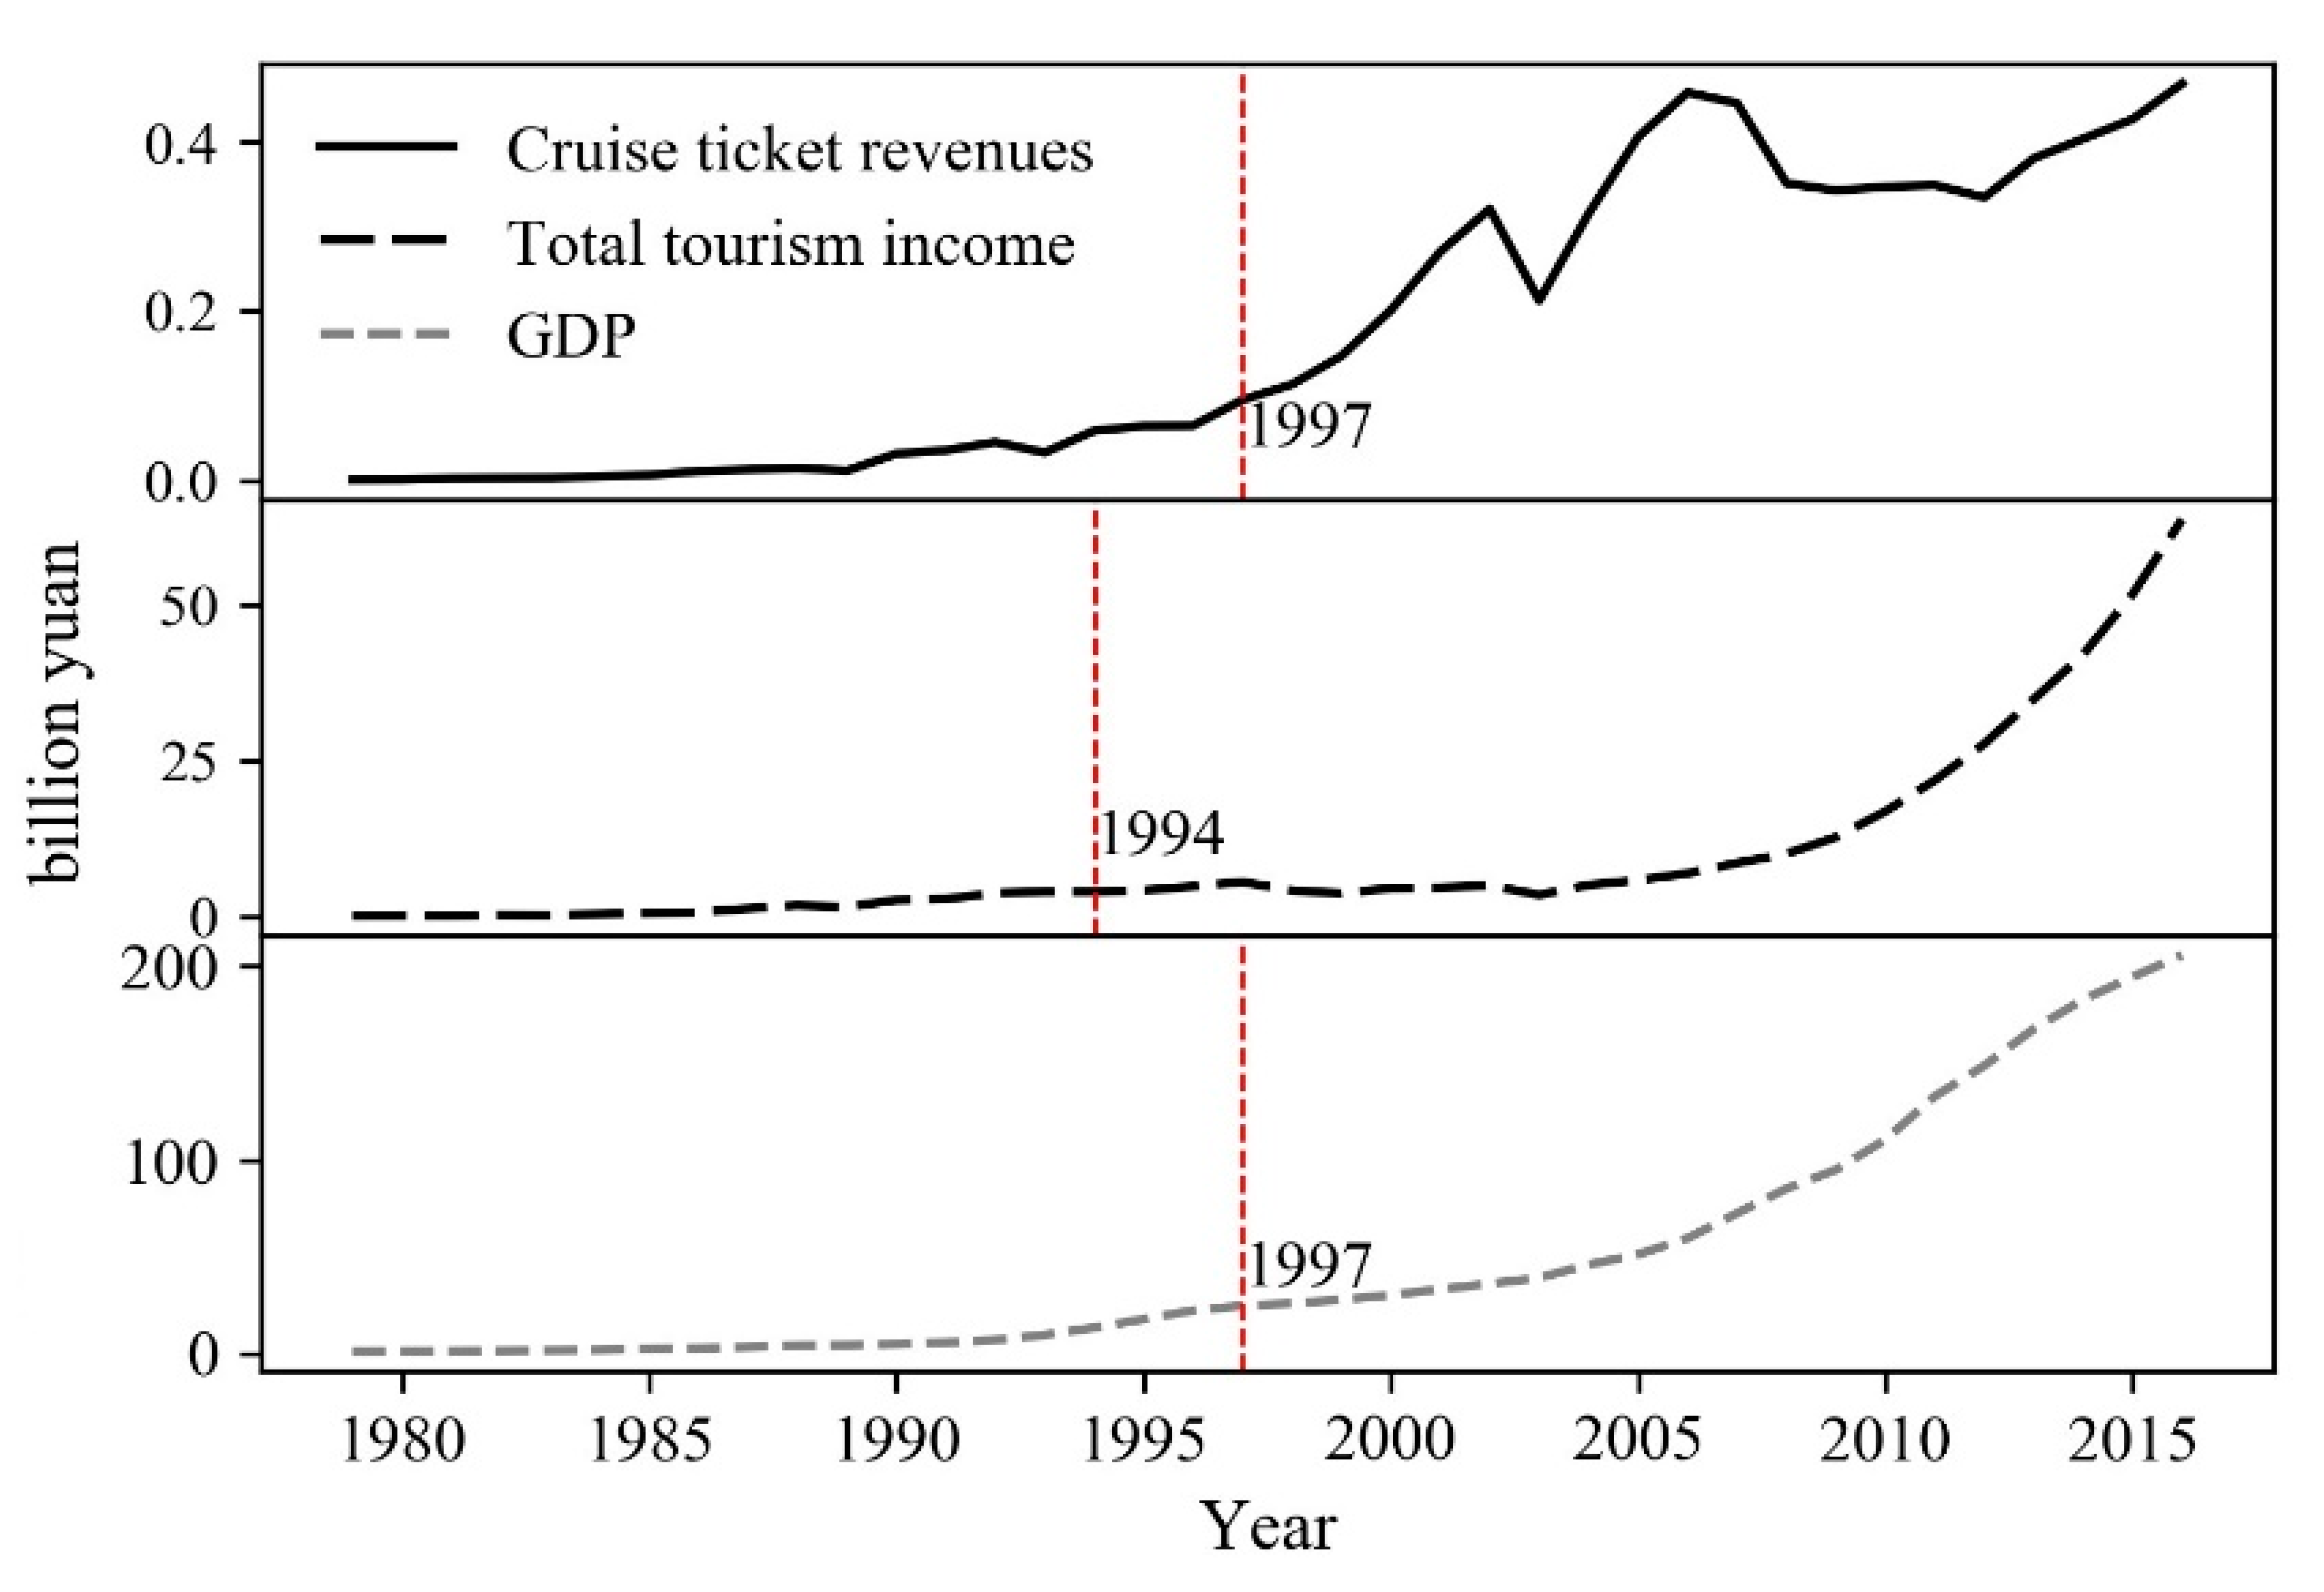
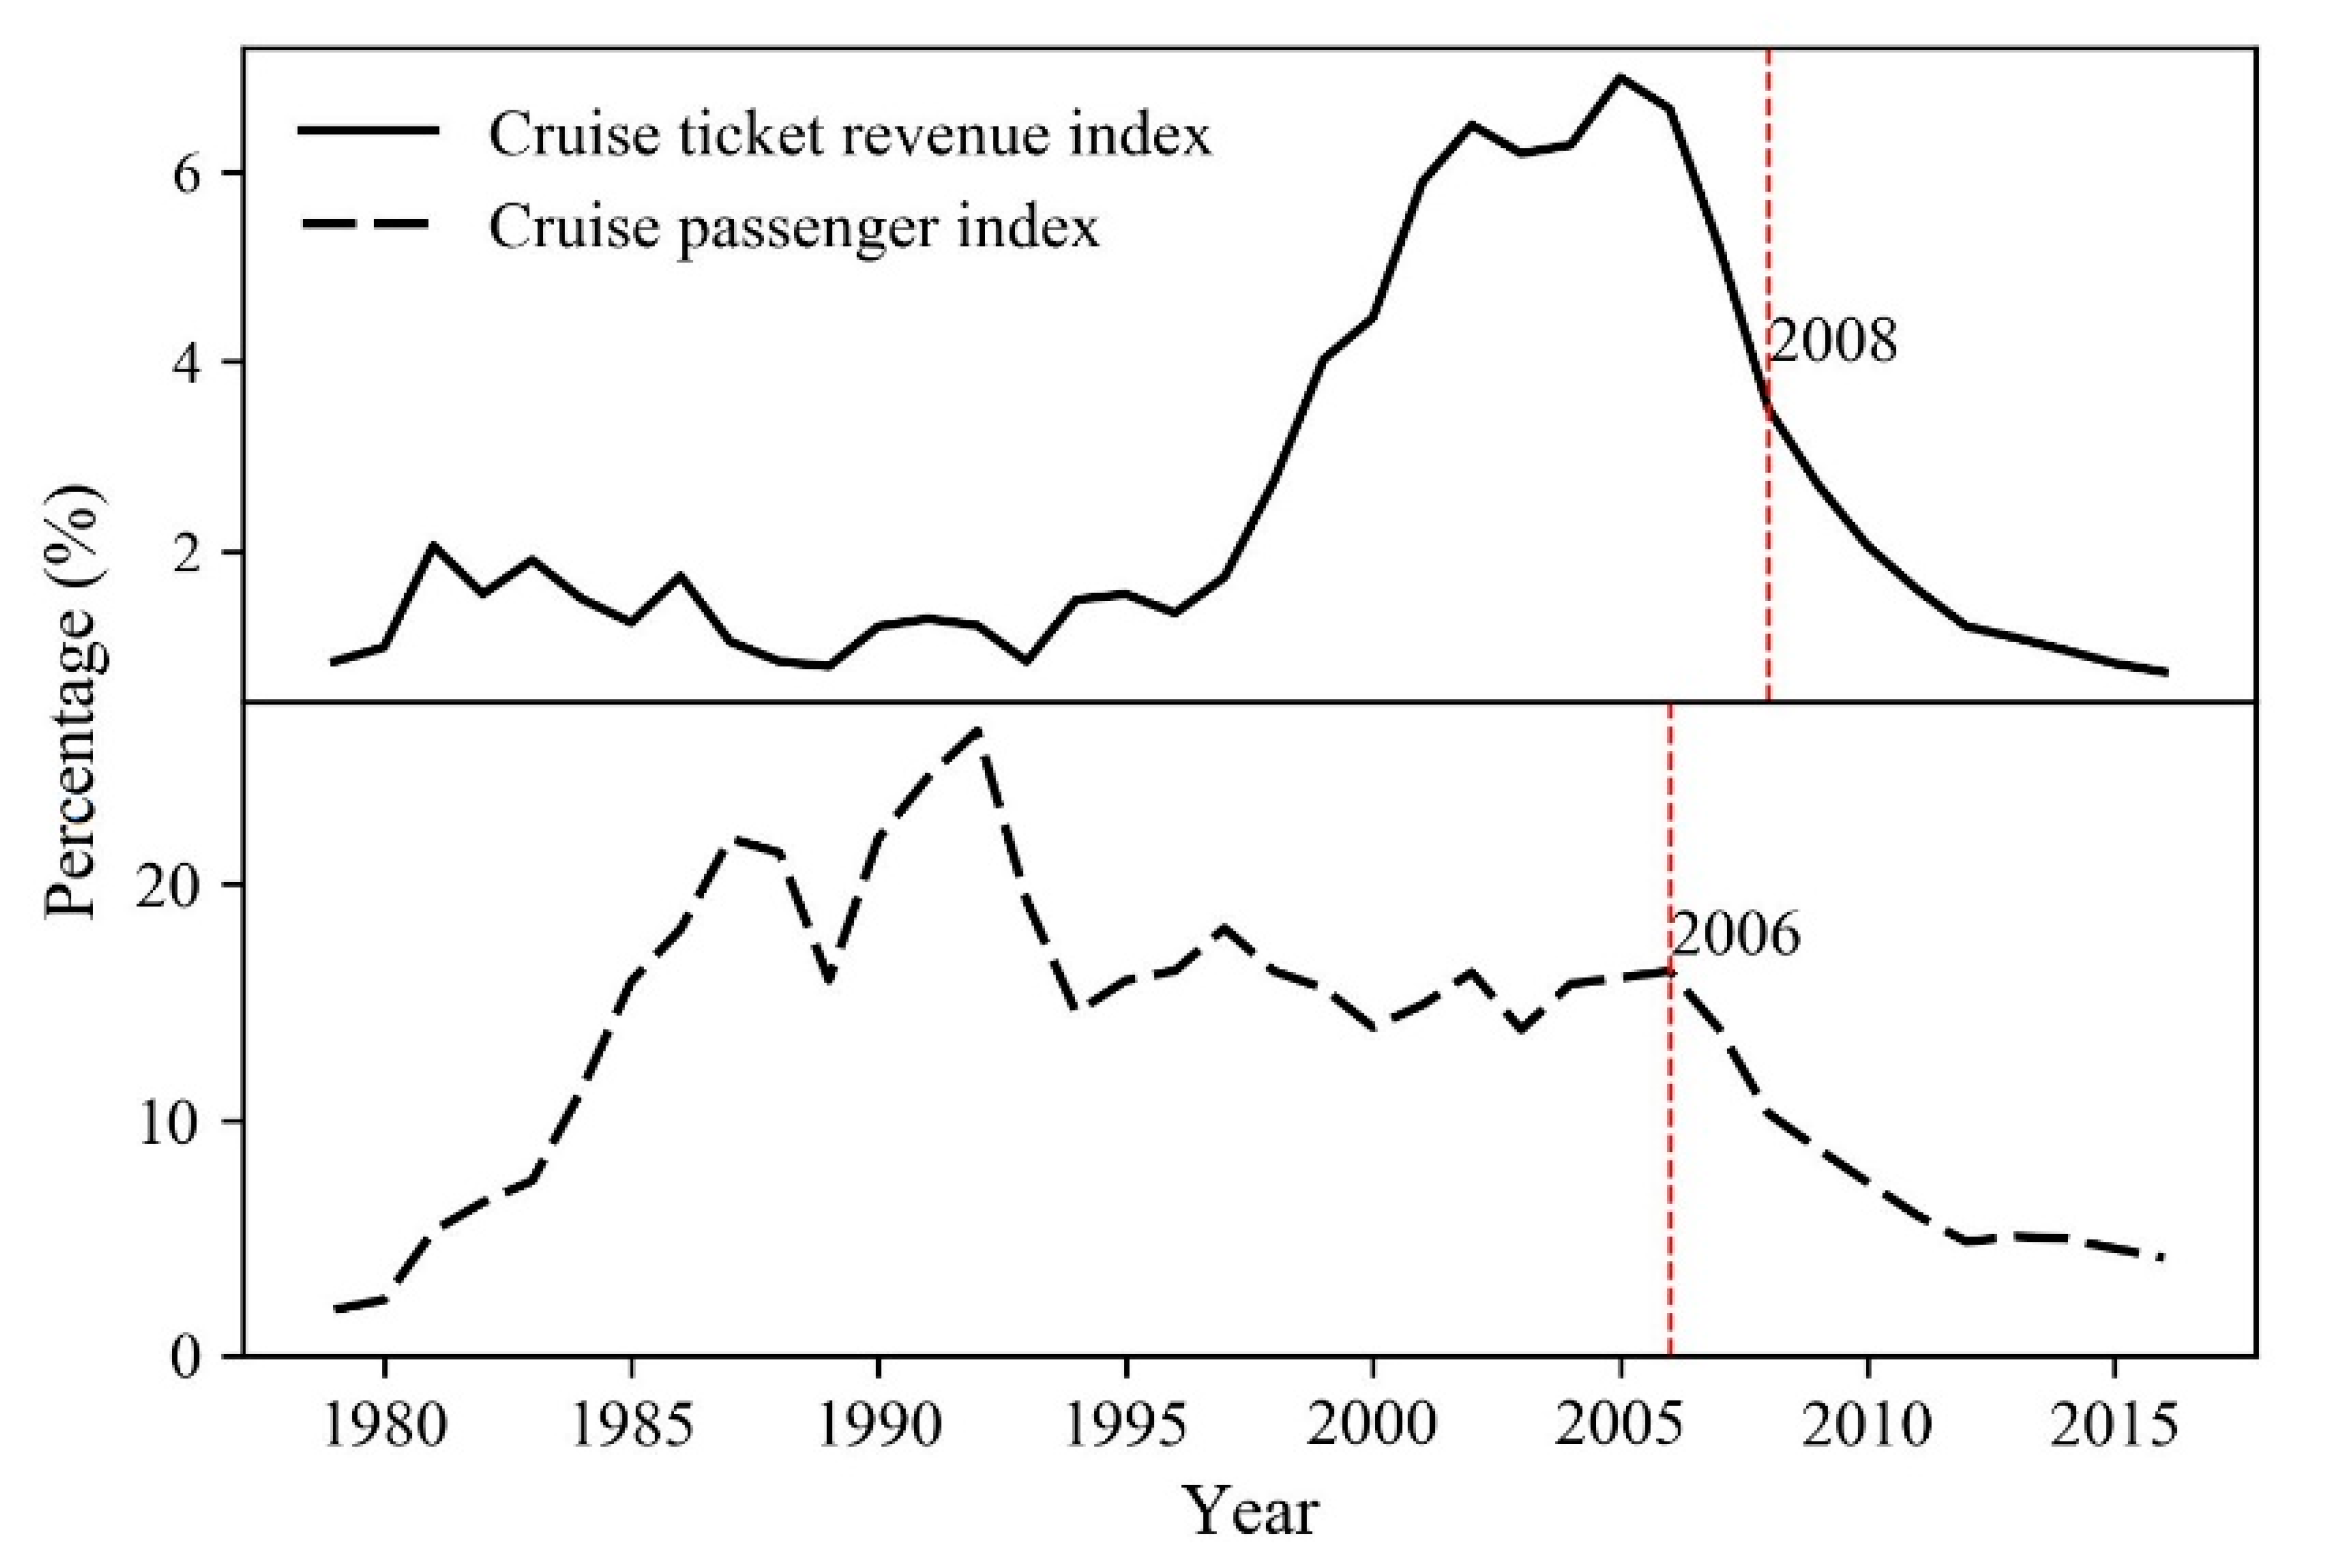
3.1. Trend Analysis of Cruise Tourism Development from Guilin to Yangshuo
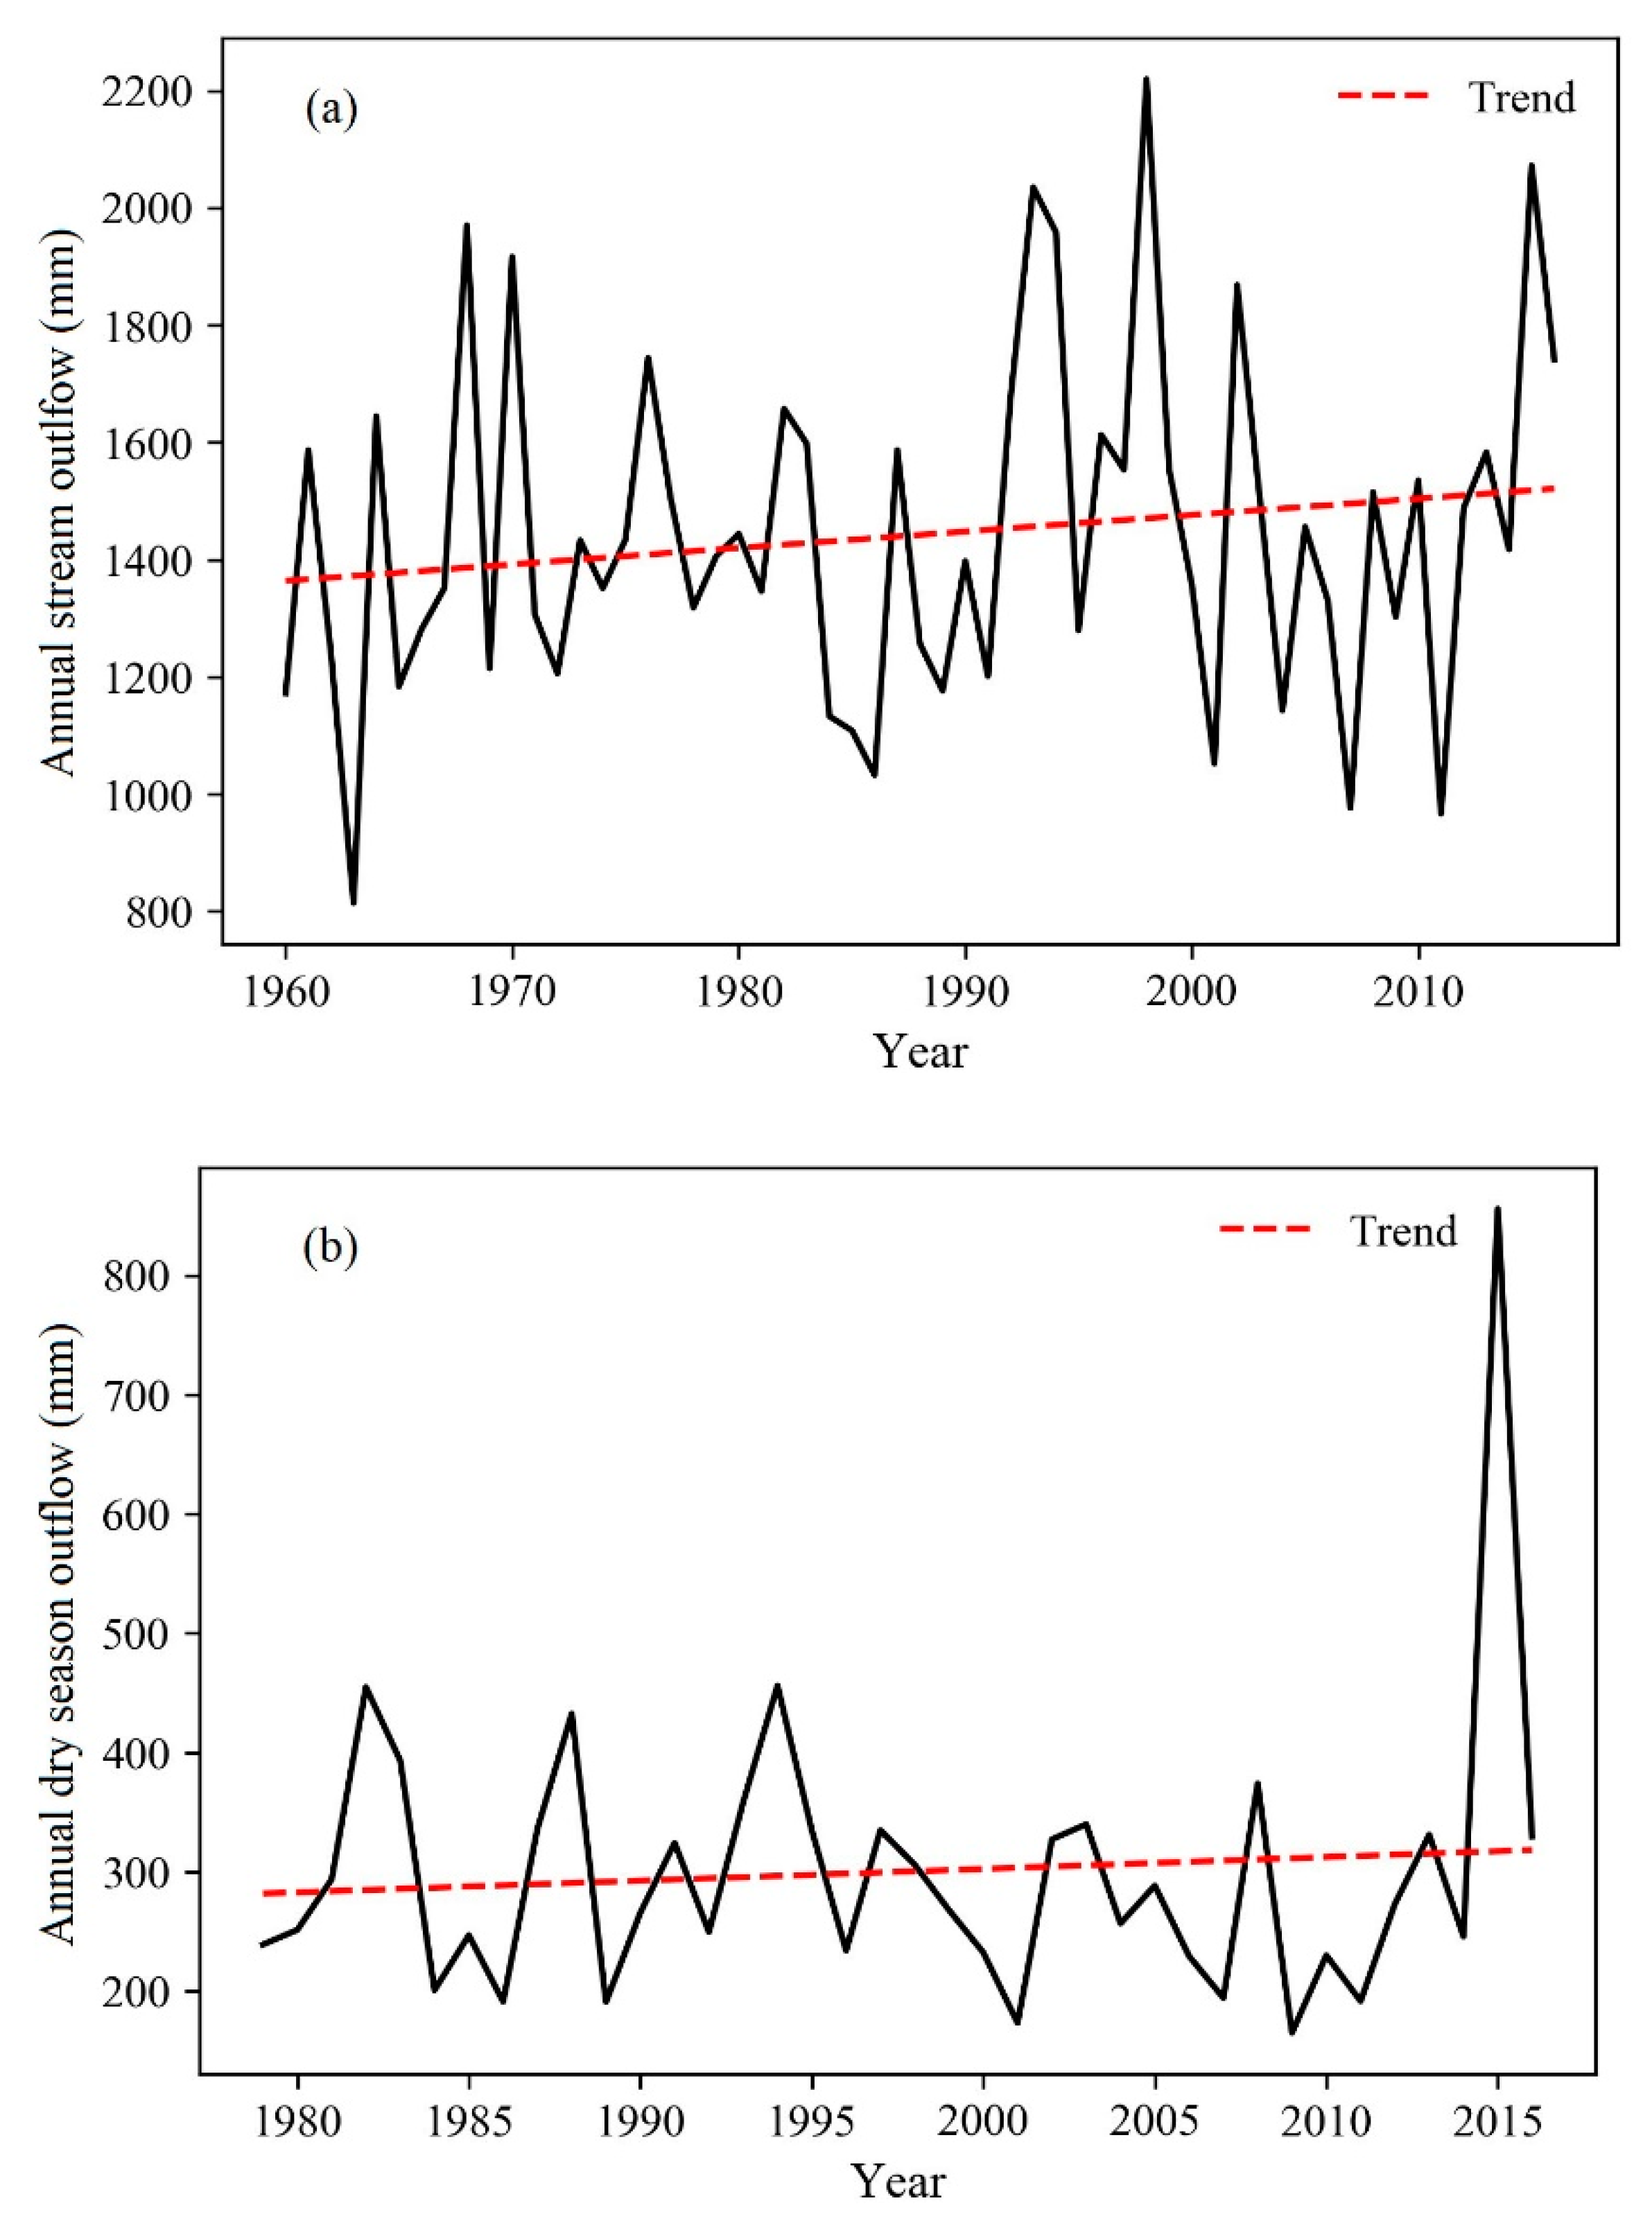
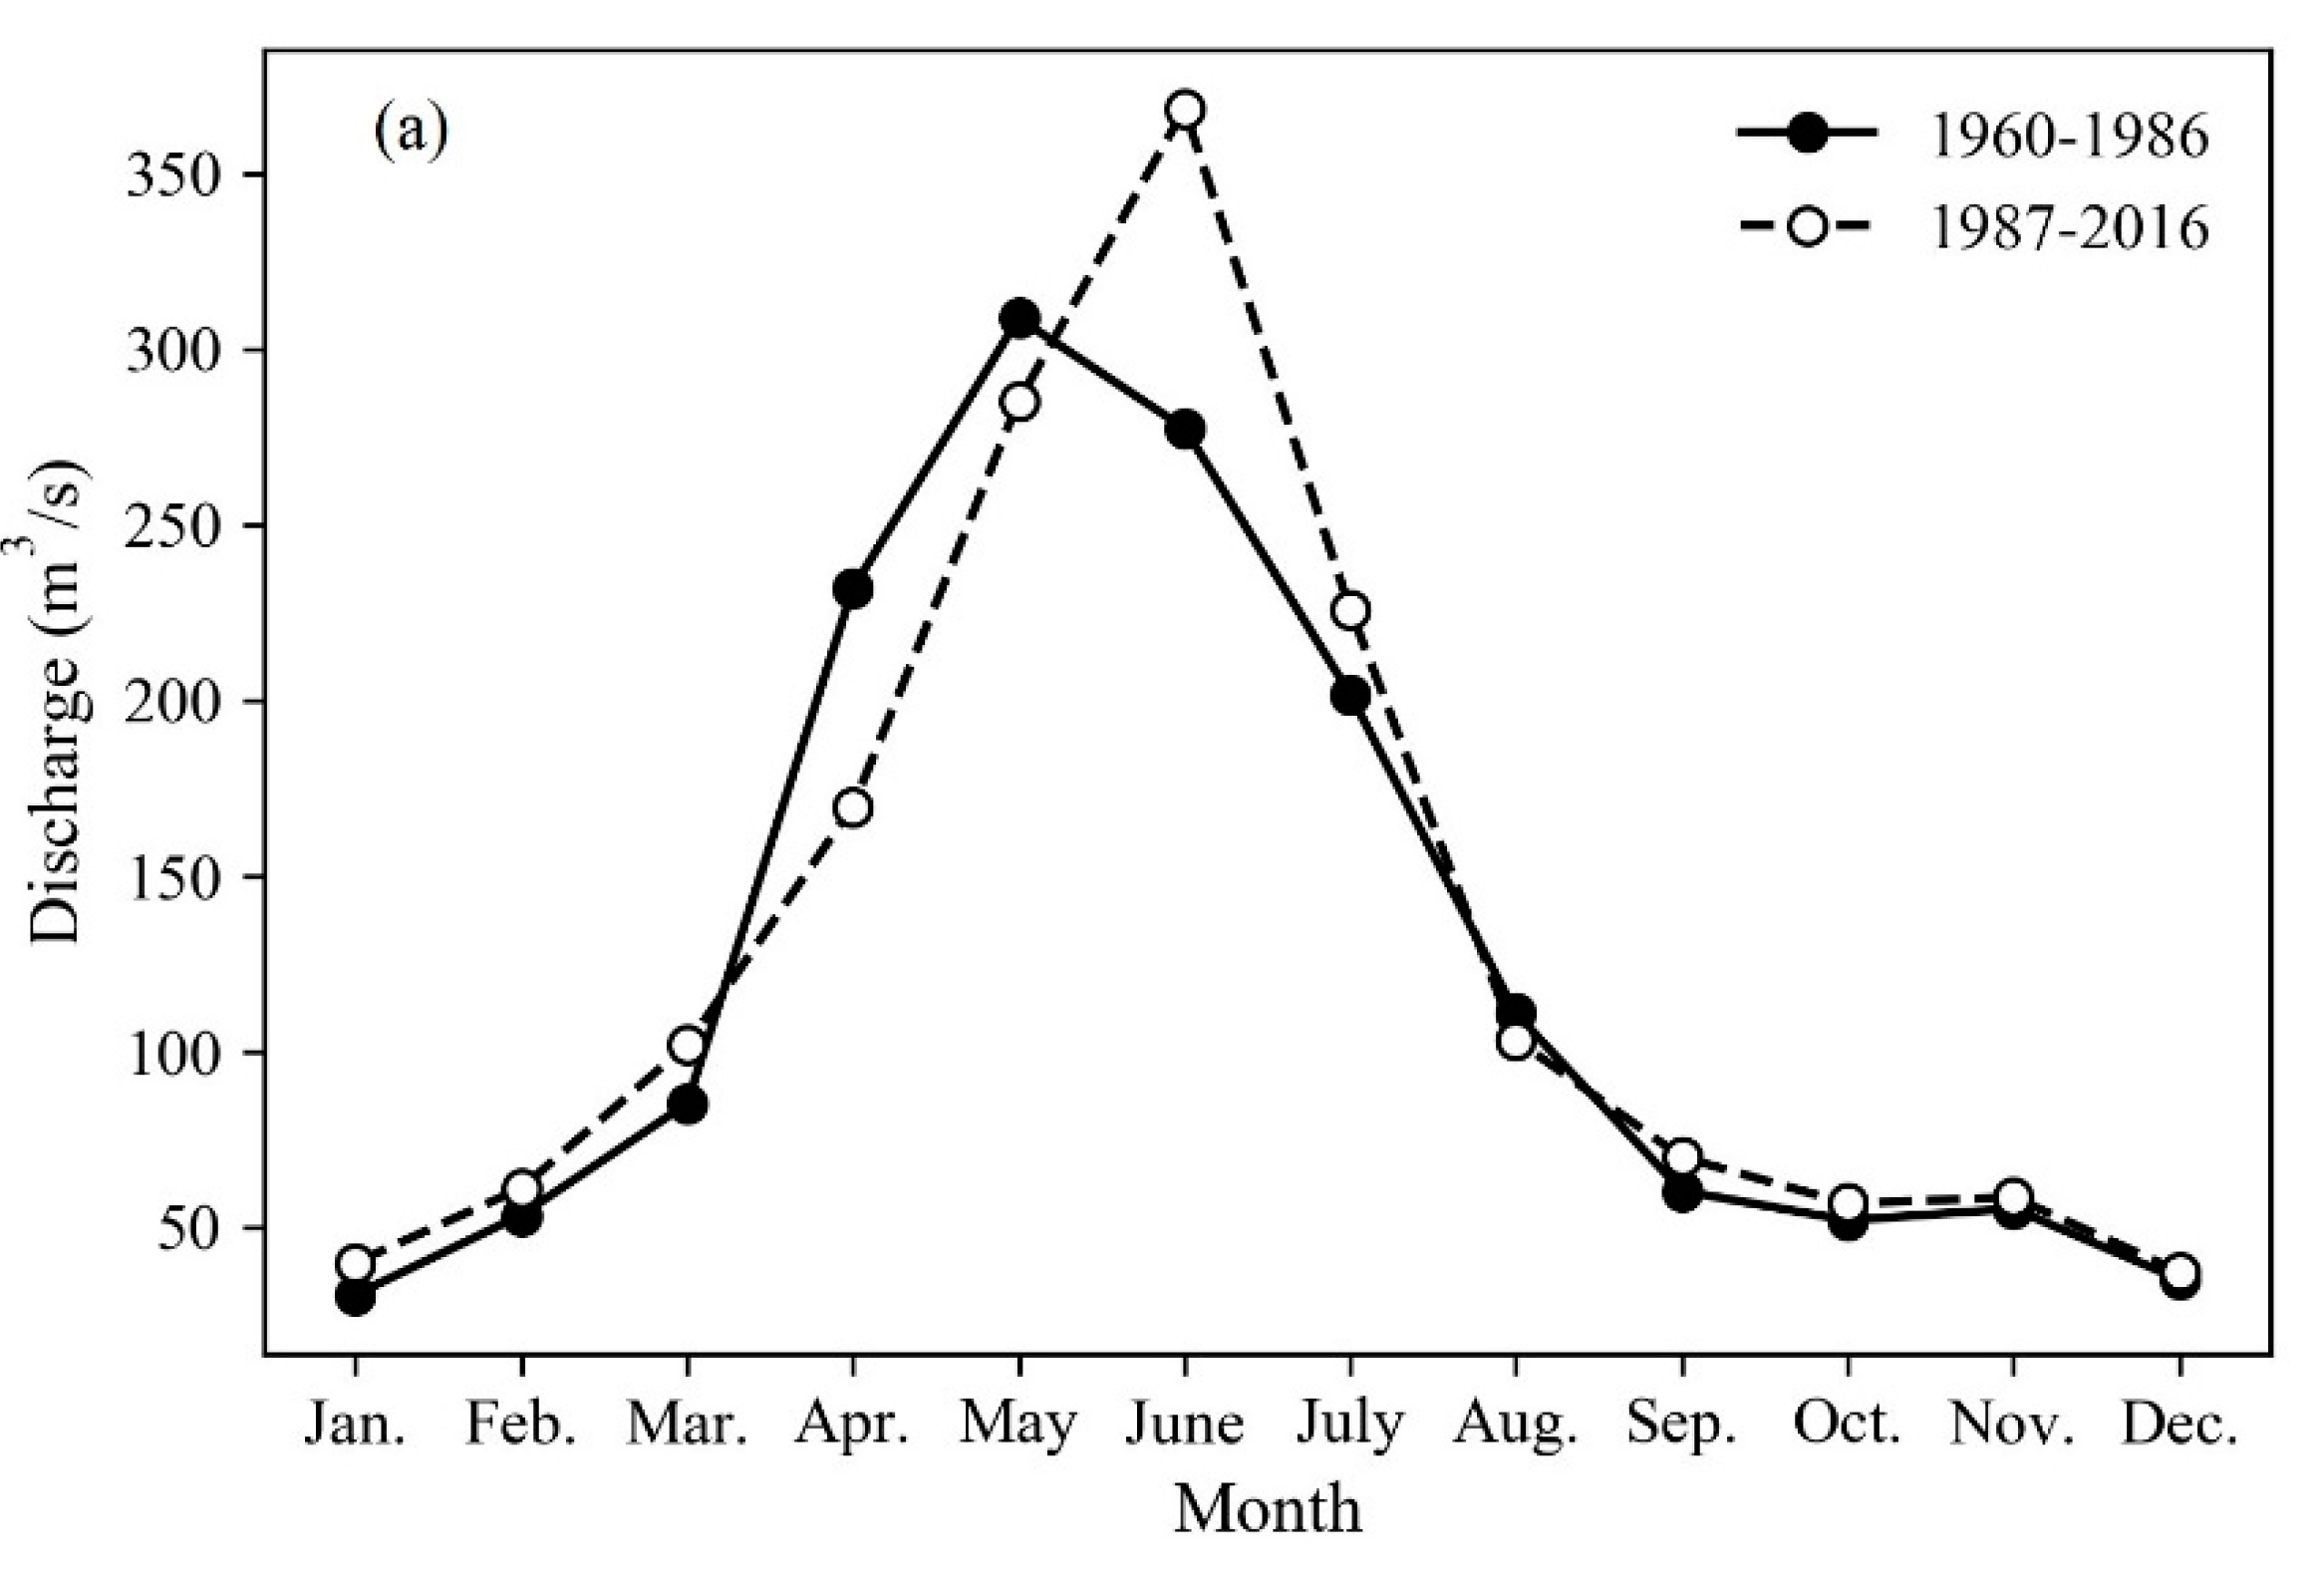
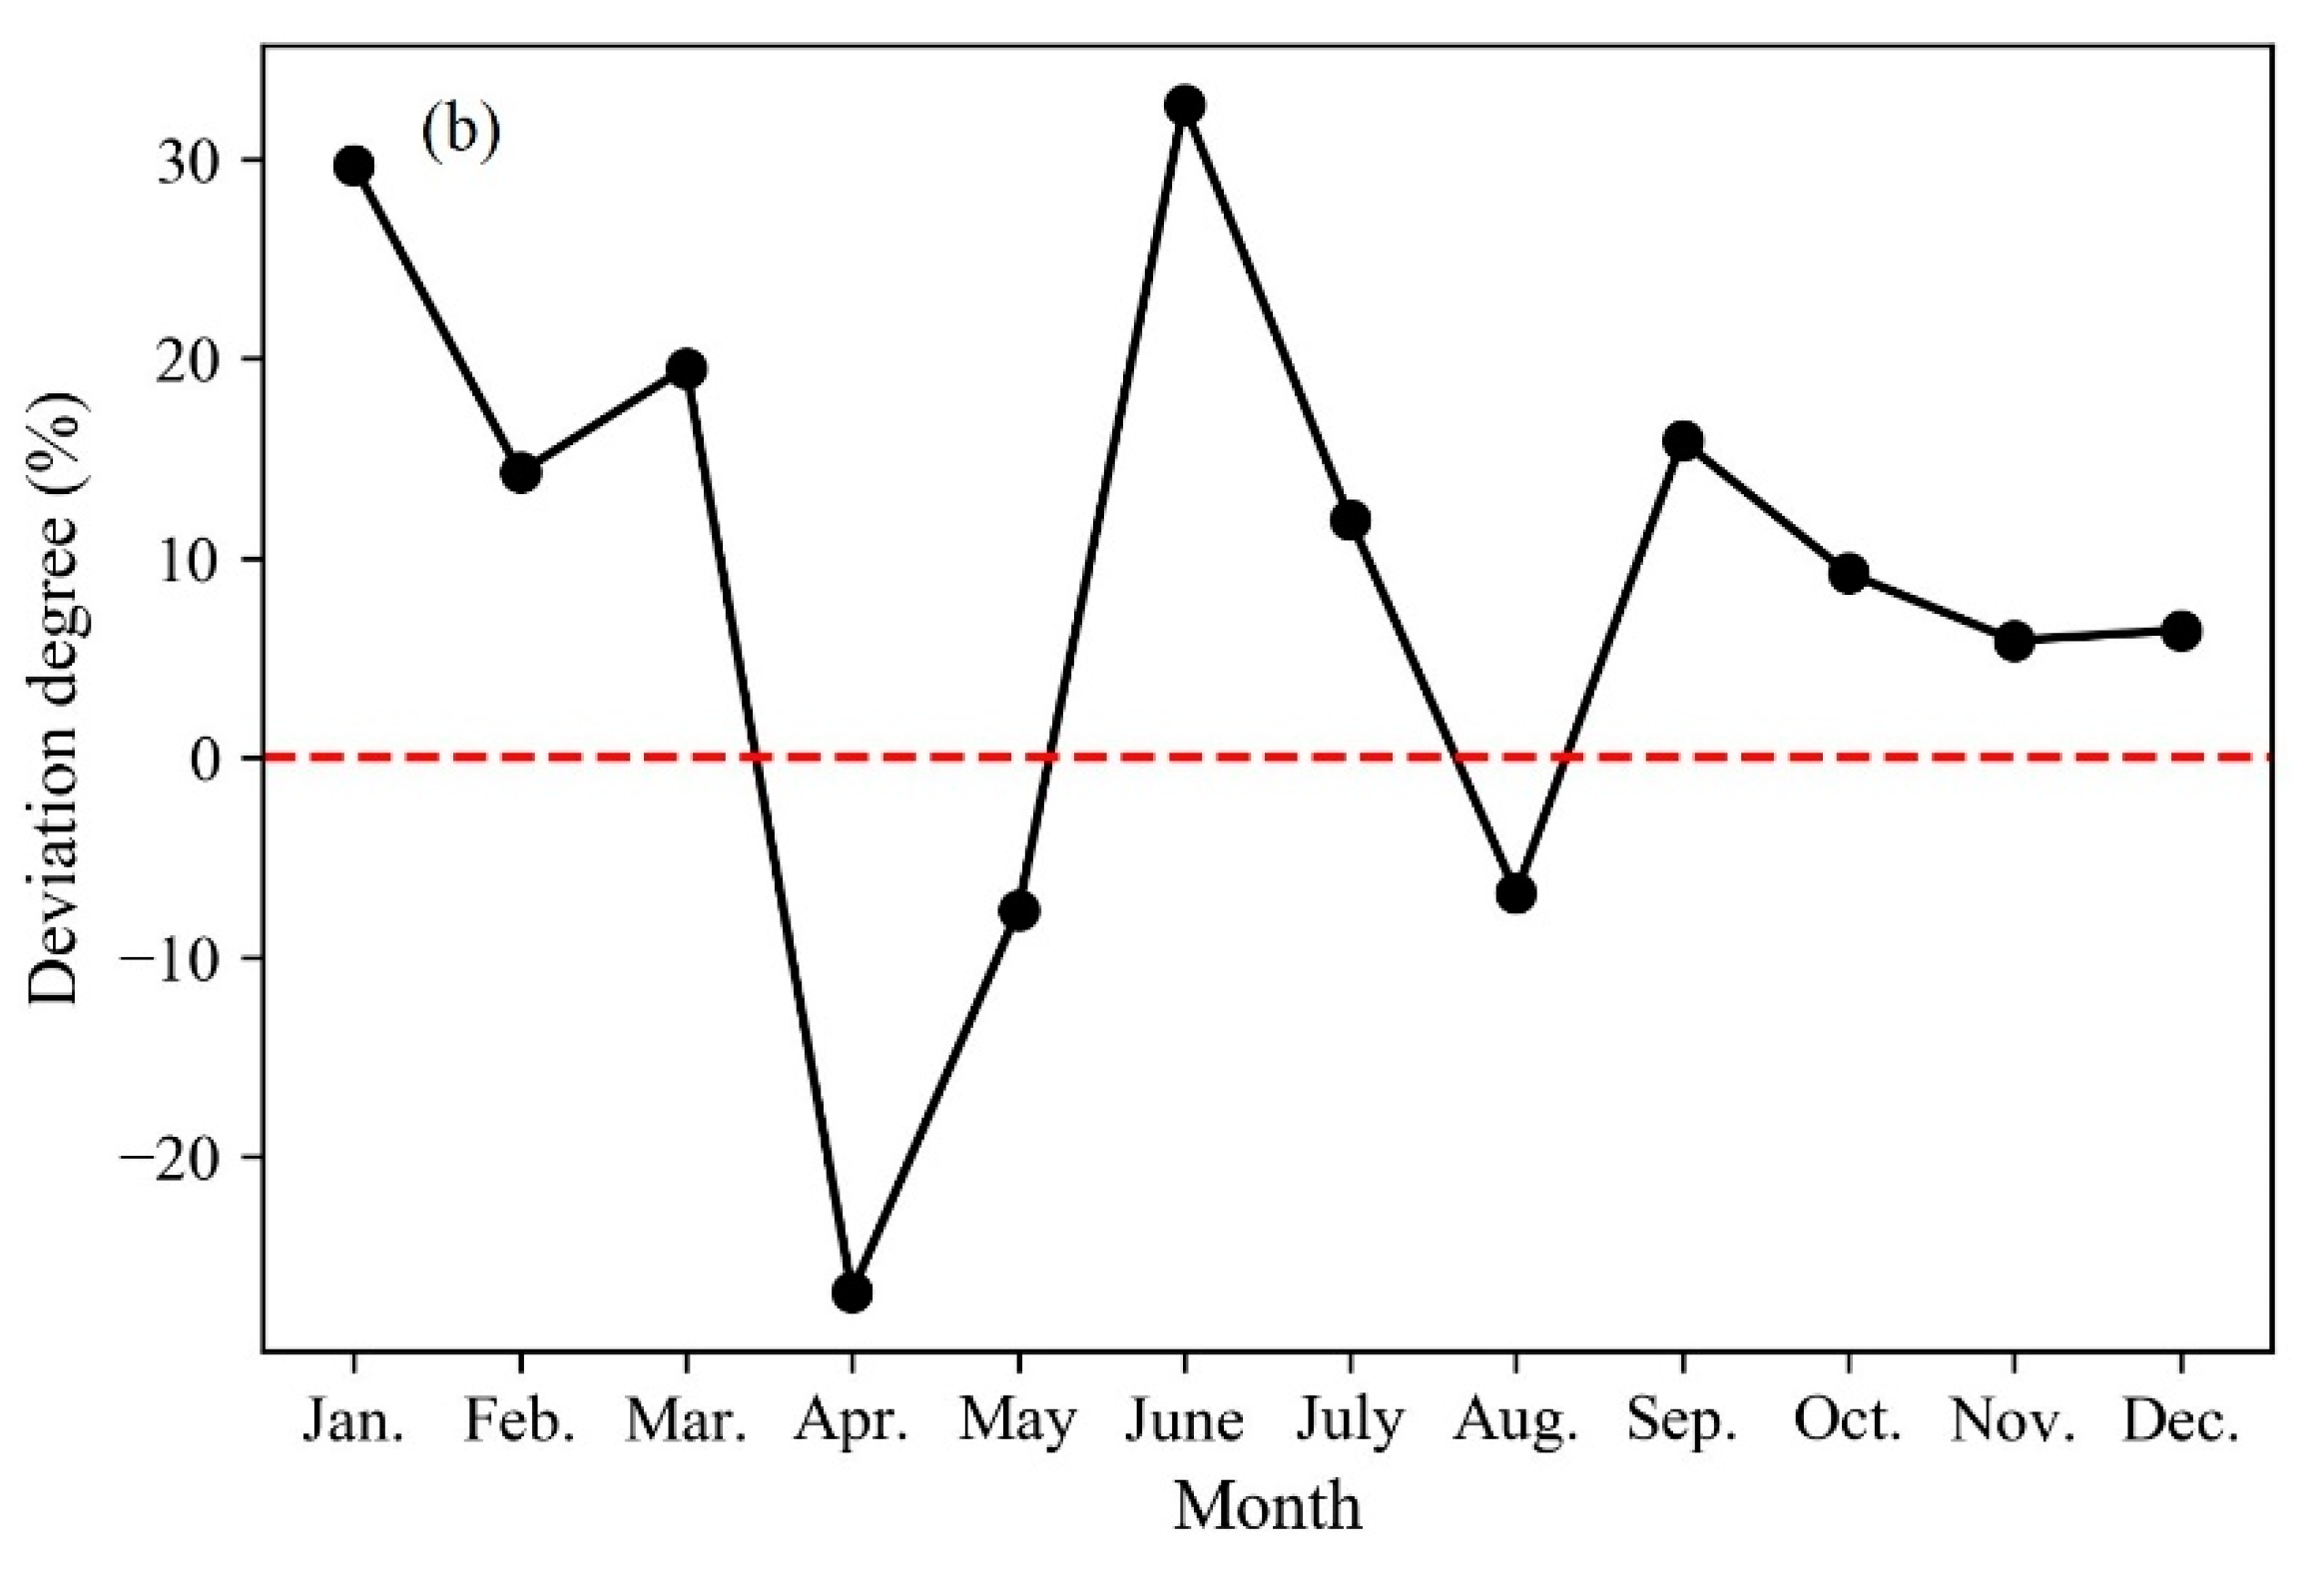
3.2. Characteristics of Annual Stream Flow in the Lijiang River
3.3. Effects of Stream Flow Changes on Cruise Tourism from Guilin to Yangshuo
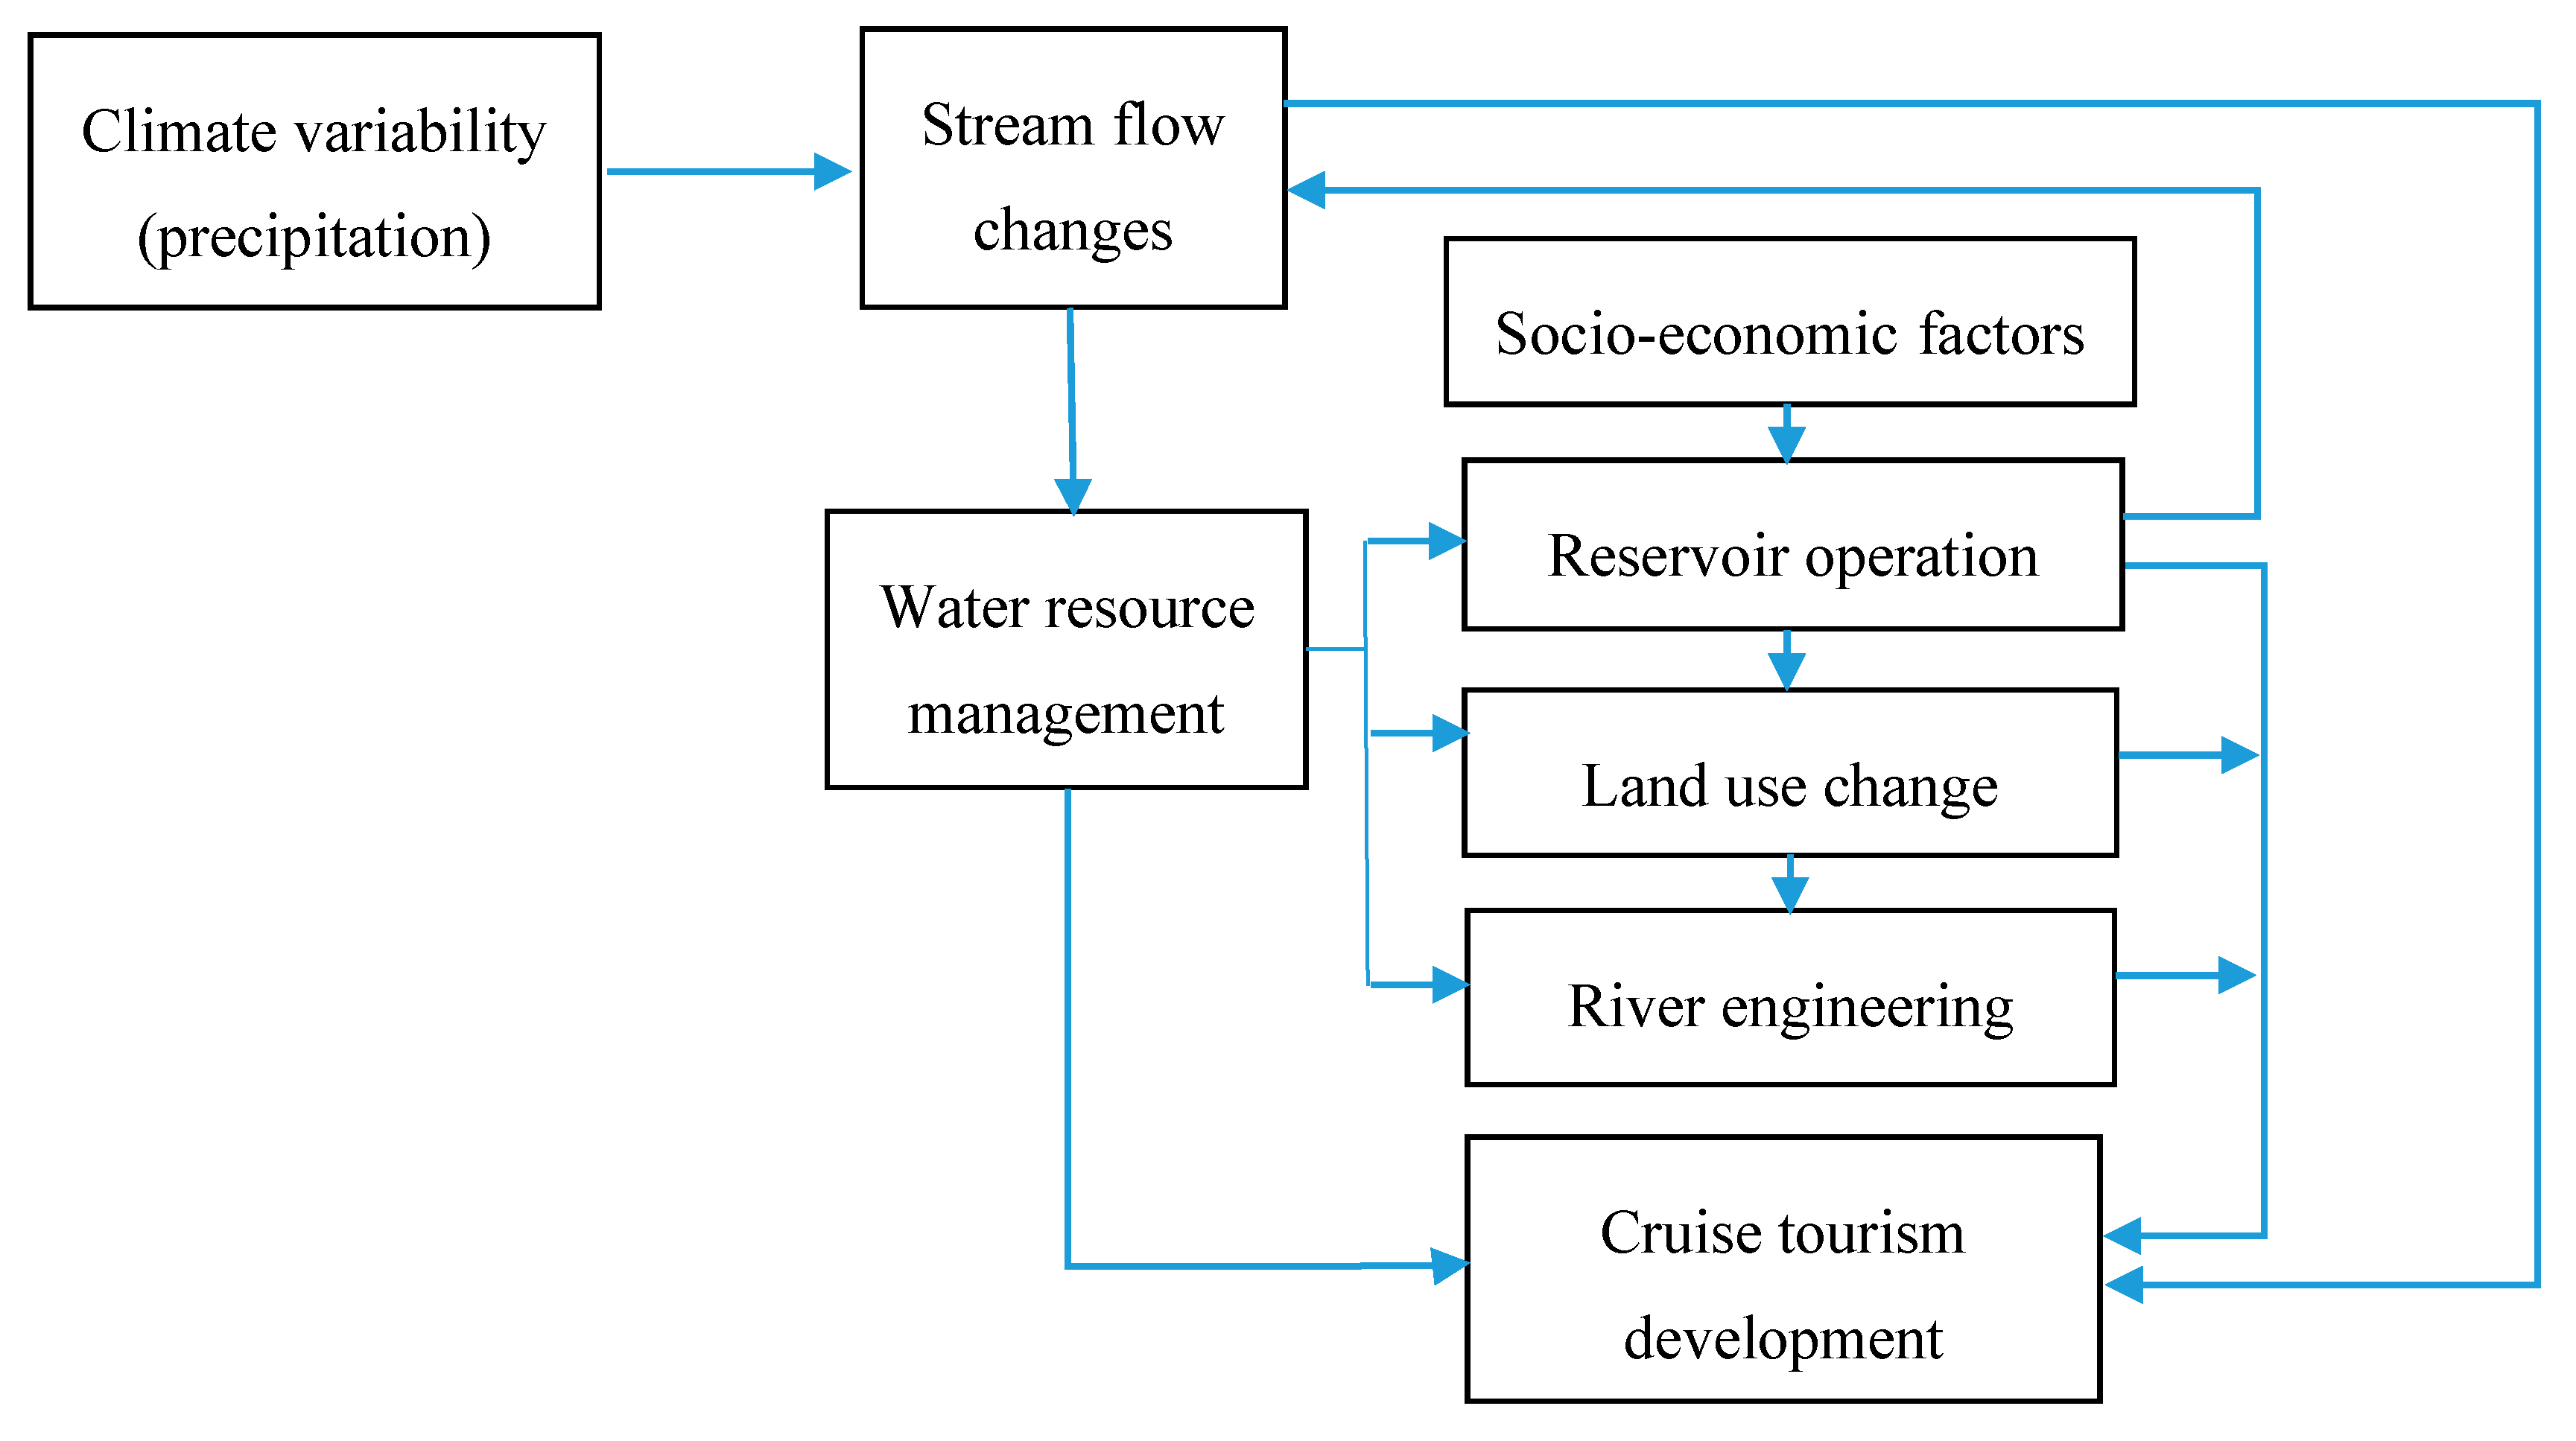
3.4. Climate Variability and Socio-Economic Factors Affecting Stream Flow and Cruise Tourism
3.4.1. Climate Variability (Precipitation)
3.4.2. Socio-Economic Factors
Reservoir Operation
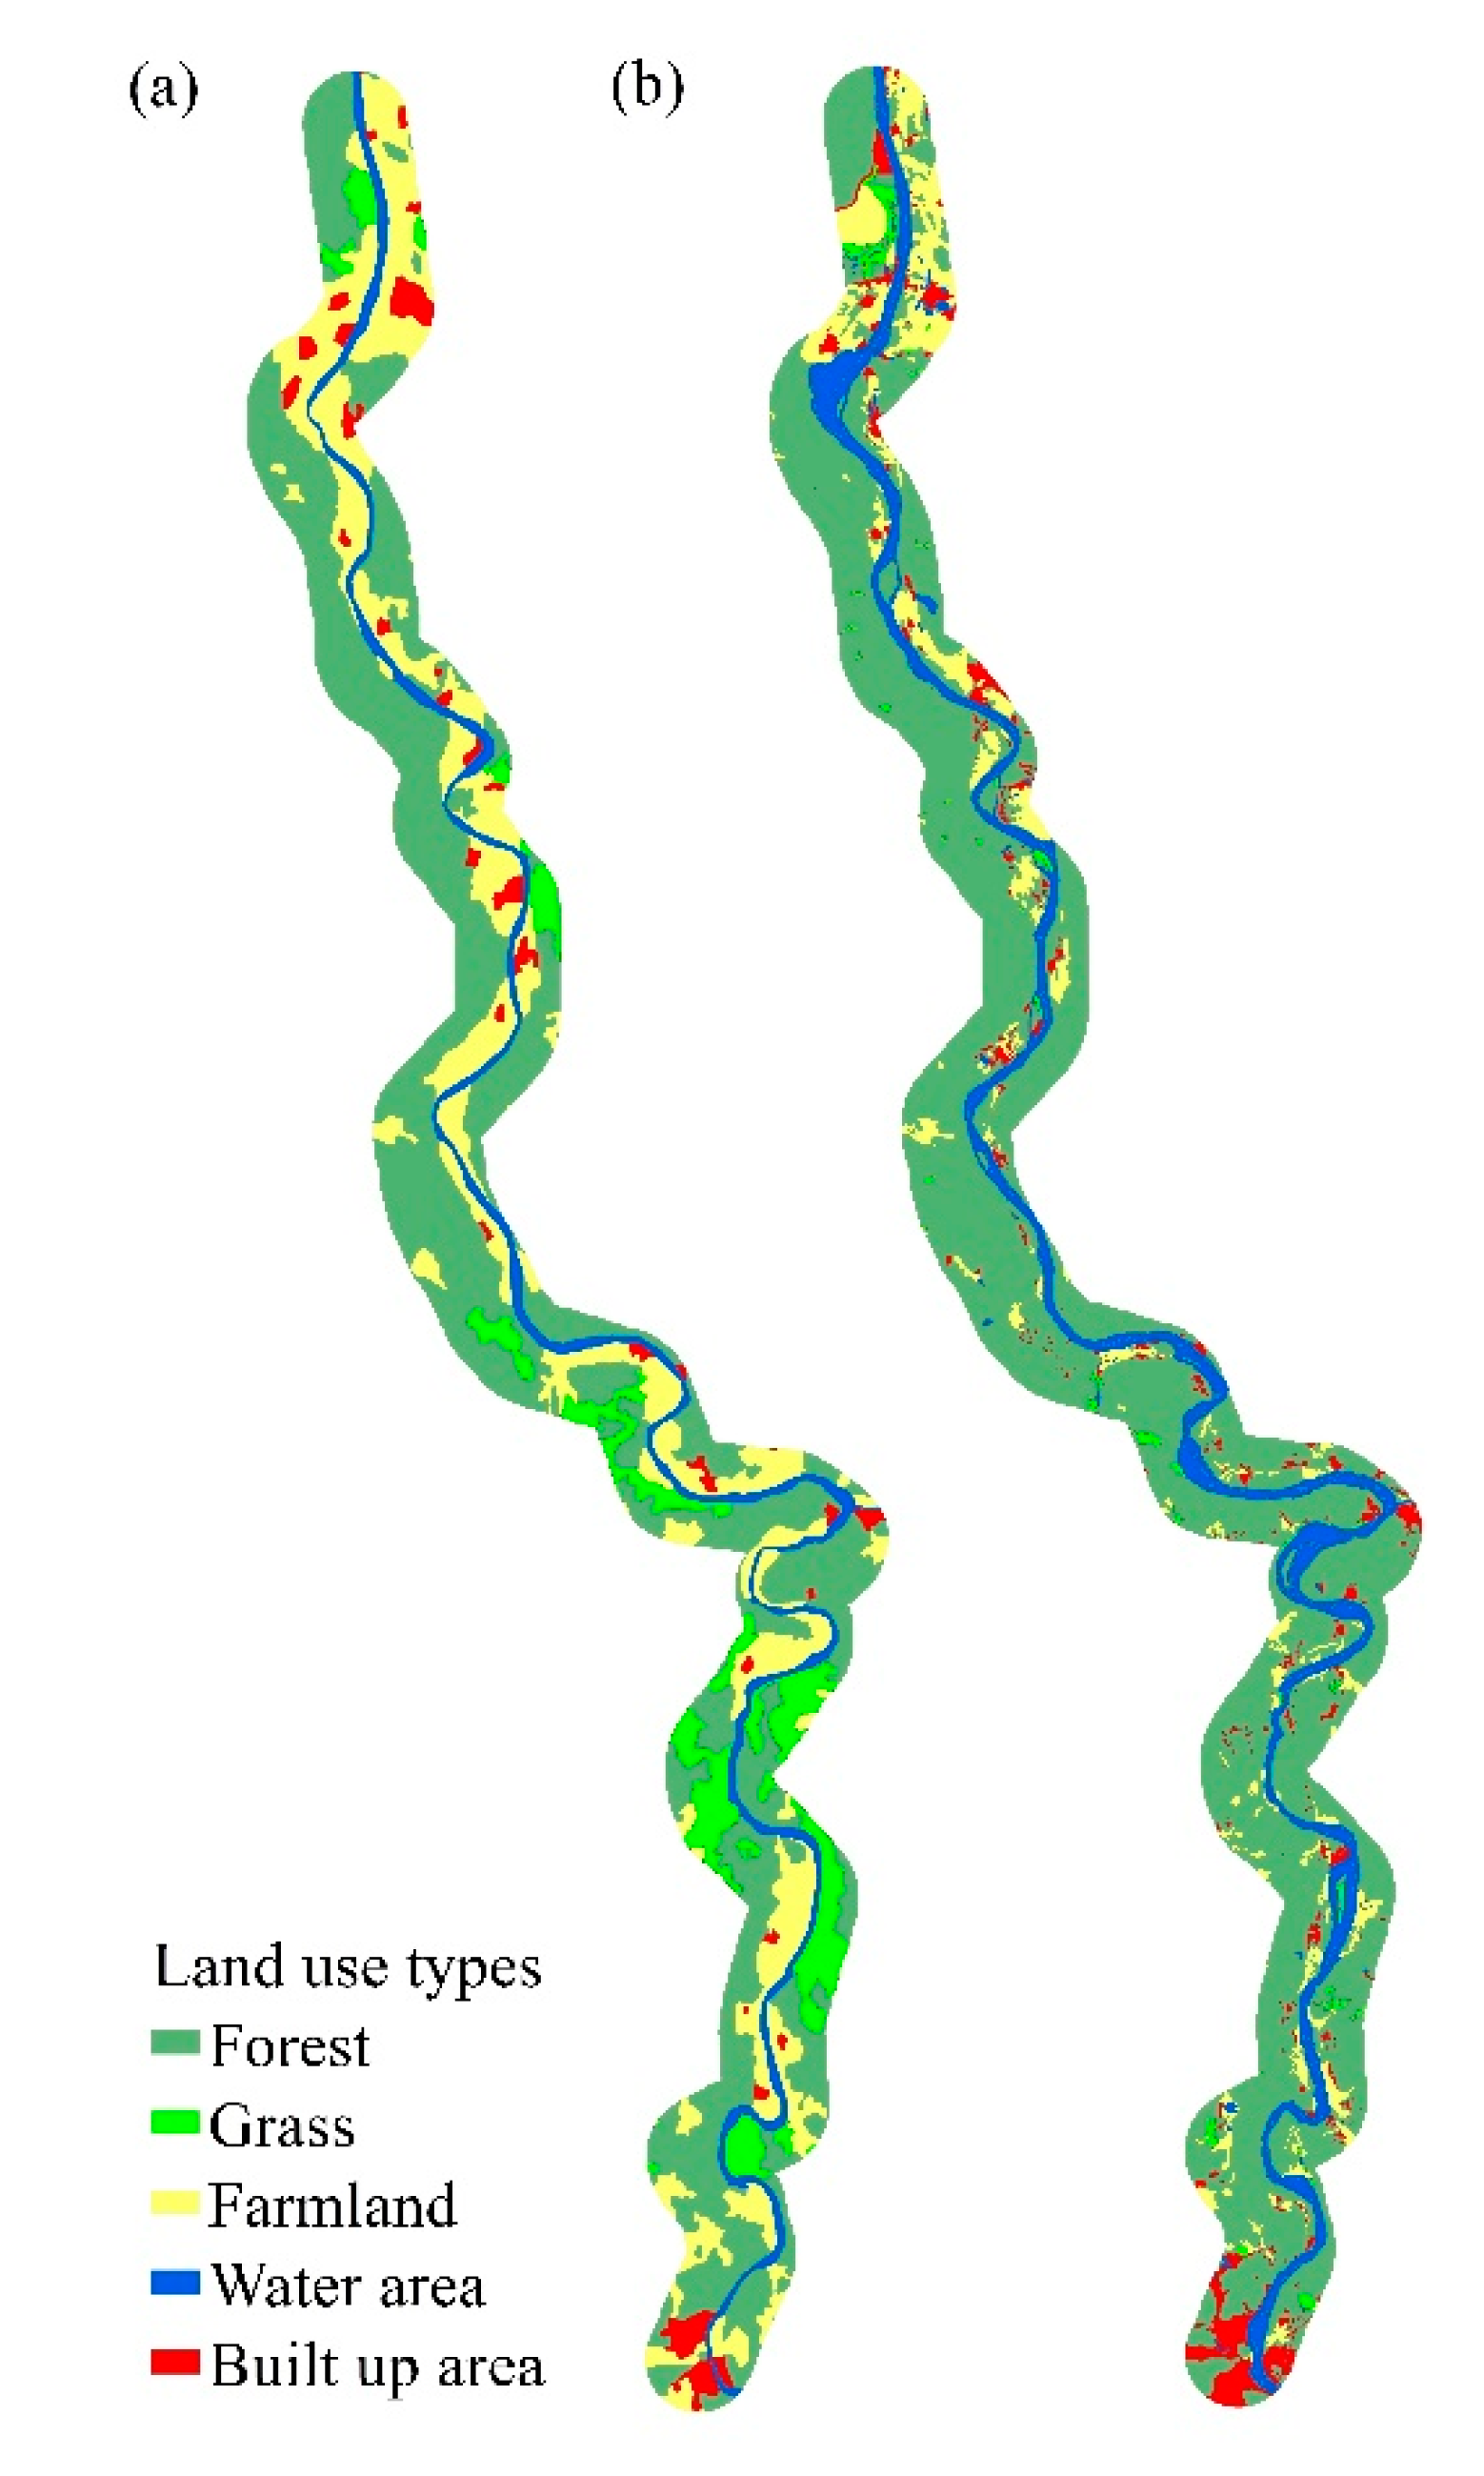
Land Use Change
4. Discussion
5. Conclusions
Author Contributions
Funding
Acknowledgments
Conflicts of Interest
References
- Li, J.; Qiao, Y.; Lei, X.; Kang, A.; Wang, M.; Liao, W.; Wang, H.; Ma, Y. A two-stage water allocation strategy for developing regional economic-environment sustainability. J. Environ. Manag. 2019, 244, 189–198. [Google Scholar] [CrossRef] [PubMed]
- Gössling, S. Global environmental consequences of tourism. Glob. Environ. Chang. 2002, 12, 283–302. [Google Scholar] [CrossRef]
- Valizadeh, N.; Mirzaei, M.; Allawi, M.F.; Afan, H.A.; Mohd, N.S.; Hussain, A.; El-Shafie, A. Artificial intelligence and geo-statistical models for stream-flow forecasting in ungauged stations: State of the art. Nat. Hazards 2017, 86, 1377–1392. [Google Scholar] [CrossRef]
- Yang, W.; Liu, J. Water sustainability for China and beyond. Science 2012, 337, 649–650. [Google Scholar] [CrossRef]
- Gössling, S.; Peeters, P.; Hall, C.M.; Ceron, J.P.; Dubois, G.; Lehmann, L.V.; Scott, D. Tourism and water use: Supply, demand, and security. An international review. Tour. Manag. 2012, 33, 1–15. [Google Scholar] [CrossRef]
- Gössling, S. New performance indicators for water management in tourism. Tour. Manag. 2015, 46, 233–244. [Google Scholar] [CrossRef]
- Paiano, A.; Crovella, T.; Lagioia, G. Managing sustainable practices in cruise tourism: The assessment of carbon footprint and waste of water and beverage packaging. Tour. Manag. 2020, 77, 104016. [Google Scholar] [CrossRef]
- Papathanassis, A.; Beckmann, I. Assessing the “poverty of cruise theory” hypothesis. Ann. Tour. Res. 2011, 38, 153–174. [Google Scholar] [CrossRef]
- Carić, H.; Mackelworth, P. Cruise tourism environmental impacts—The perspective from the Adriatic Sea. Ocean Coast. Manag. 2014, 102, 350–363. [Google Scholar] [CrossRef]
- Lau, Y.; Sun, X. An Investigation into the Responsibility of Cruise Tourism in China. In Maritime Transportation and Regional Sustainability; Ng, A.K.Y., Monios, J., Jiang, C., Eds.; Elsevier Inc.: Amsterdam, The Netherlands, 2020; pp. 239–249. ISBN 9780128191347. [Google Scholar]
- MacNeill, T.; Wozniak, D. The economic, social, and environmental impacts of cruise tourism. Tour. Manag. 2018, 66, 387–404. [Google Scholar] [CrossRef]
- Johnson, D. Environmentally sustainable cruise tourism: A reality check. Mar. Policy 2002, 26, 261–270. [Google Scholar] [CrossRef]
- Wang, H. Report on the Development of Cruise Industry in China (2019); Wang, H., Ed.; Springer: Berlin/Heidelberg, Germany, 2020; ISBN 978-981-15-4660-0. [Google Scholar]
- Brida, J.G.; Zapata, S. Cruise tourism: Economic, socio-cultural and environmental impacts. Int. J. Leis. Tour. Mark. 2010, 1, 205–226. [Google Scholar] [CrossRef]
- Wang, Y. Lijiang River cruise tourism development issues and stratiges. Econ. Reserch Guid. 2015, 254–256. [Google Scholar] [CrossRef]
- Carrying Capacity for 5A Scenic Zone in China. Available online: http://www.gov.cn/xinwen/2015-07/17/content_2898961.htm (accessed on 11 August 2020).
- Mao, X.; Meng, J.; Wang, Q. Modeling the effects of tourism and land regulation on land-use change in tourist regions: A case study of the Lijiang River Basin in Guilin, China. Land Use Policy 2014, 41, 368–377. [Google Scholar] [CrossRef]
- Lu, L.; Bao, J.; Ling, S.; Zeng, Q.; Yu, H. The evolution progress and mechanism of Guilin-Lijiang River-Yangshuo tourism destination system. Sci. Geogr. Sin. 2012, 32, 1066–1074. [Google Scholar] [CrossRef]
- Miao, Z. Water replenishment and tourism shipping in Lijiang River. Site Investig. Sci. Technol. 2000, 36–40. [Google Scholar] [CrossRef]
- Xu, J.; Dai, J. Variation characteristics of runoff in upper reaches of Lijiang River basin. Yangtze River 2018, 49, 41–46. [Google Scholar] [CrossRef]
- Li, R.; Chen, Q.; Ye, F. Modelling the impacts of reservoir operations on the downstream riparian vegetation and fish habitats in the Lijiang River. J. Hydroinformatics 2011, 13, 229. [Google Scholar] [CrossRef]
- Li, R.; Chen, Q.; Tonina, D.; Cai, D. Effects of upstream reservoir regulation on the hydrological regime and fish habitats of the Lijiang River, China. Ecol. Eng. 2015, 76, 75–83. [Google Scholar] [CrossRef]
- Ye, F.; Chen, Q.; Li, R. Modelling the riparian vegetation evolution due to flow regulation of Lijiang River by unstructured cellular automata. Ecol. Inform. 2010, 5, 108–114. [Google Scholar] [CrossRef]
- Yang, Y. Discussion on ecological and environmental water supplement target flow of Lijiang River. GX Water Resour. Hydropower Eng. 2012, 3, 7–10. [Google Scholar]
- Lijiang River Eco-environmental Protection Law. 2011. Available online: http://www.gxzf.gov.cn/zwgk/flfg/dfxfg/t955429.shtml (accessed on 19 August 2020).
- Outline Plan (2012–2020) for the Development of Guilin into an International Tourist Attraction. Available online: http://www.gov.cn/gzdt/2012-11/30/content_2278843.htm (accessed on 11 August 2020).
- Guilin Forges Ahead in Tourism Upgrading. Available online: http://en.gxzf.gov.cn/2019-05/20/c_376274.htm (accessed on 11 August 2020).
- Guilin Lijiang Zhi Editorial Committee. Guilin Lijiang Zhi; Guilin Lijiang Zhi Editorial Committee, Ed.; Guangxi People’s Publishing House: Nanning, China, 2004; ISBN 7-219-05073-9/K987. [Google Scholar]
- Guilin Economic and Social Statistical Yearbook Editorial Committee. Guilin Economic and Social Statistical Yearbook; Guilin Economic and Social Statistical Yearbook Editorial Committee, Ed.; China Statistics Press: Beijing, China, 2016; ISBN 9787503779817. [Google Scholar]
- Richter, B.D.; Baumgartner, J.V.; Powell, J.; Braun, D.P. A method for assessing hydrologic alteration within ecosystems. Conserv. Biol. 1996, 10, 1163–1174. [Google Scholar] [CrossRef] [Green Version]
- Guan, Q.; Yang, L.; Pan, N.; Lin, J.; Xu, C.; Wang, F.; Liu, Z. Greening and browning of the Hexi Corridor in northwest China: Spatial patterns and responses to climatic variability and anthropogenic drivers. Remote Sens. 2018, 10, 1270. [Google Scholar] [CrossRef] [Green Version]
- Pohlert, T. Non-Parametric Trend Tests and Change-Point Detection. 2020. Available online: https://www.google.com.hk/url?sa=t&rct=j&q=&esrc=s&source=web&cd=&ved=2ahUKEwizspPJ1PHrAhUIMd4KHSLCDoYQFjAAegQIBRAB&url=https%3A%2F%2Fcran.r-project.org%2Fweb%2Fpackages%2Ftrend%2Fvignettes%2Ftrend.pdf&usg=AOvVaw2pWef-HxDUtvHEURSwCfMp (accessed on 20 August 2020).
- Mann, H.B. Nonparametric tests against trend. Econometrica 1945, 13, 245–259. [Google Scholar] [CrossRef]
- Hamed, K.H. Trend detection in hydrologic data: The Mann-Kendall trend test under the scaling hypothesis. J. Hydrol. 2008, 349, 350–363. [Google Scholar] [CrossRef]
- Pettitt, A.N. A non-parametric approach to the change-point problem. Appl. Stat. 1979, 28, 126–135. [Google Scholar] [CrossRef]
- Benesty, J.; Chen, J.; Huang, Y.; Cohen, I. Noise Reduction in Speech Processing; Springer: Berlin/Heidelberg, Germany, 2009; ISBN 9783540786115. [Google Scholar]
- Tibshirani, R. Regression shrinkage and selection via the lasso: A retrospective. J. R. Stat. Soc. Ser. B 2011, 73, 273–282. [Google Scholar] [CrossRef]
- Tibshirani, R. Regression shrinkage and selection via the lasso. J. R. Stat. Soc. Ser. B 1996, 58, 267–288. [Google Scholar] [CrossRef]
- Granger, C.W.J. Testing for causality: A personal viewpoint. J. Econ. Dyn. Control 1980, 2, 329–352. [Google Scholar] [CrossRef]
- Kamiński, M.; Ding, M.; Truccolo, W.A.; Bressler, S.L. Evaluating causal relations in neural systems: Granger causality, directed transfer function and statistical assessment of significance. Biol. Cybern. 2001, 85, 145–157. [Google Scholar] [CrossRef]
- Mehdi, B.J.; Slim, B.Y. The role of renewable energy and agriculture in reducing CO2 emissions: Evidence for North Africa countries. Ecol. Indic. 2017, 74, 295–301. [Google Scholar] [CrossRef] [Green Version]
- Gent, P.R.; Danabasoglu, G.; Donner, L.J.; Holland, M.M.; Hunke, E.C.; Jayne, S.R.; Lawrence, D.M.; Neale, R.B.; Rasch, P.J.; Vertenstein, M.; et al. The community climate system model version 4. J. Clim. 2011, 24, 4973–4991. [Google Scholar] [CrossRef]
- van Vuuren, D.P.; Edmonds, J.; Kainuma, M.; Riahi, K.; Thomson, A.; Hibbard, K.; Hurtt, G.C.; Kram, T.; Krey, V.; Lamarque, J.F.; et al. The representative concentration pathways: An overview. Clim. Chang. 2011, 109, 5–31. [Google Scholar] [CrossRef]
- Xue, L.; Zhang, H.; Yang, C.; Zhang, L.; Sun, C. Quantitative assessment of hydrological alteration caused by irrigation projects in the Tarim River basin, China. Sci. Rep. 2017, 7, 1–13. [Google Scholar] [CrossRef] [PubMed] [Green Version]
- Guiding Opinions on Promoting the Development of Rural Tourism. Available online: http://www.gov.cn/govweb/jrzg/2006-08/23/content_368032.htm (accessed on 20 August 2020).
- Guilin Local Chronicies Editorial Committee. Guilin Yearbook (2007); Guilin Local Chronicies Editorial Committee, Ed.; China Local Records Publishing Press: Beijing, China, 2007; ISBN 978-7-80238-175-9. [Google Scholar]
- Guilin Local Chronicies Editorial Committee. Guilin Nianjian (2017); Guilin Local Chronicies Editorial Committee, Ed.; Guangxi Normal University Press: Guilin, China, 2017; ISBN 9787559804105. [Google Scholar]
- Feng, L.; You, H. Research on the Construction Index System of China Guilin Tourism Distribution Center. In Proceedings of the 2nd International Conference on Management, Education and Social Science (ICMESS2018), Qingdao, China, 23–24 June 2018; Atlantis Press: Beijing, China, 2018; Volume 176, pp. 1143–1146. [Google Scholar]
- Guiding Opinions on Promoting the Sustainable Development of Rural Tourism. Available online: http://zwgk.mct.gov.cn/auto255/201812/t20181211_836468.html?keywords= (accessed on 13 August 2020).
- Wang, L.E.; Cheng, S.K.; Zhong, L.S.; Mu, S.L.; Dhruba, B.G.C.; Ren, G.Z. Rural tourism development in China: Principles, models and the future. J. Mt. Sci. 2013, 10, 116–129. [Google Scholar] [CrossRef] [Green Version]
- Guilin Local Chronicies Editorial Committee. Guilin NianJian (2019); Guilin Local Chronicies Editorial Committee, Ed.; Thread-Binding Books Publishing House: Beijing, China, 2019; ISBN 9787512038479. [Google Scholar]
- Barnett, T.P.; Adam, J.C.; Lettenmaier, D.P. Potential impacts of a warming climate on water availability in snow-dominated regions. Nature 2005, 438, 303–309. [Google Scholar] [CrossRef]
- Li, W.; Han, R.; Chen, Q.; Qu, S.; Cheng, Z. Individual-based modelling of fish population dynamics in the river downstream under flow regulation. Ecol. Inform. 2010, 5, 115–123. [Google Scholar] [CrossRef]
- Chen, Q.; Chen, D.; Han, R.; Li, R.; Ma, J.; Blanckaert, K. Optimizing the operation of the Qingshitan Reservoir in the Lijiang River for multiple human interests and quasi-natural flow maintenance. J. Environ. Sci. 2012, 24, 1923–1928. [Google Scholar] [CrossRef] [Green Version]
- Chen, Q.; Yang, Q.; Li, R.; Ma, J. Spring micro-distribution of macroinvertebrate in relation to hydro-environmental factors in the Lijiang River, China. J. Hydro-Environ. Res. 2013, 7, 103–212. [Google Scholar] [CrossRef]
- Jiang, Y.; Chen, Y.; Yan, Z. Water Utilization and Water Problems in Guilin City. Proceeding of the International Symposium on Water Resources and the Urban Environment, Wuhan, China, 9–10 November 2003; China Environmental Science Press: Wuhan, China, 2003; pp. 390–393. [Google Scholar]


| Jan. | Feb. | Mar. | Apr. | May | June | July | Aug. | Sept. | Oct. | Nov. | Dec. | ||
|---|---|---|---|---|---|---|---|---|---|---|---|---|---|
| Cruise passengers | 0.18 | −0.15 | −0.08 | −0.24 | −0.10 | 0.04 | 0.10 | −0.29 | −0.11 | −0.20 | 0.13 | 0.17 | |
| Cruise ticket revenue | 0.15 | −0.23 | −0.23 | −0.07 | 0.02 | 0.13 | −0.07 | −0.23 | −0.13 | −0.18 | 0.18 | 0.21 | |
| 1 day min a | 3 day min | 7 day min | 30 day min | 90 day min | 1 day max b | 3 day max | 7 day max | 30 day max | 90 day max | base flow | annual flow | dry season flow | |
| Cruise passengers | −0.14 | 0.02 | 0.02 | 0.12 | −0.28 | −0.07 | −0.09 | −0.11 | −0.07 | −0.01 | 0.05 | −0.01 | 0.04 |
| Cruise ticket revenue | −0.21 | 0.01 | 0.01 | 0.01 | −0.21 | −0.04 | −0.07 | −0.09 | −0.09 | 0.02 | −0.01 | 0.01 | 0.04 |
| Jan. | Feb. | Mar. | Apr. | May | June | July | Aug. | Sept. | Oct. | Nov. | Dec. | ||
|---|---|---|---|---|---|---|---|---|---|---|---|---|---|
| Cruise passengers | 0.0032 | −0.0017 | −0.0010 | −0.0021 | −0.0018 | 0.0003 | 0.0000 | −0.0042 | 0.0000 | 0.0000 | 0.0000 | 0.0022 | |
| Cruise ticket revenue | 0.0000 | −0.0004 | −0.0004 | 0.0000 | 0.0000 | 0.0005 | 0.0000 | −0.0002 | 0.0000 | 0.0000 | 0.0001 | 0.0000 | |
| 1 day min a | 3 day min | 7 day min | 30 day min | 90 day min | 1 day max b | 3 day max | 7 day max | 30 day max | 90 day max | base flow | annual flow | dry season flow | |
| Cruise passengers | 0.0000 | 0.0000 | 0.0000 | 0.0000 | −0.0014 | −0.0002 | 0.0002 | −0.0002 | 0.0000 | 0.0012 | 0.0000 | 0.0005 | 0.0001 |
| Cruise ticket revenue | 0.0000 | 0.0000 | 0.0000 | 0.0000 | 0.0000 | 0.0000 | 0.0000 | −0.0002 | −0.0001 | 0.0000 | 0.0000 | 0.0000 | 0.0000 |
| Jan. | June | Nov. | Dec. | 90-Day Max a | Annual Flow | Dry Season Flow | |
|---|---|---|---|---|---|---|---|
| Cruise passengers | 0.01 | 0.74 | 0.40 | 0.41 | 0.45 | 0.96 | |
| Cruise ticket revenue | 0.60 | 0.36 |
© 2020 by the authors. Licensee MDPI, Basel, Switzerland. This article is an open access article distributed under the terms and conditions of the Creative Commons Attribution (CC BY) license (http://creativecommons.org/licenses/by/4.0/).
Share and Cite
Yao, Y.; Mallik, A. Stream Flow Changes and the Sustainability of Cruise Tourism on the Lijiang River, China. Sustainability 2020, 12, 7711. https://doi.org/10.3390/su12187711
Yao Y, Mallik A. Stream Flow Changes and the Sustainability of Cruise Tourism on the Lijiang River, China. Sustainability. 2020; 12(18):7711. https://doi.org/10.3390/su12187711
Chicago/Turabian StyleYao, Yuefeng, and Azim Mallik. 2020. "Stream Flow Changes and the Sustainability of Cruise Tourism on the Lijiang River, China" Sustainability 12, no. 18: 7711. https://doi.org/10.3390/su12187711