Review

Resilience of Process Plant: What, Why, and How Resilience Can Improve Safety and Sustainability

TEES Mary Kay O’Connor Process Safety Center (MKOPSC), and Artie McFerrin Department of Chemical Engineering, Texas A & M University, College Station, TX 77843, USA
*
Author to whom correspondence should be addressed.
Sustainability 2020, 12(15), 6152; https://doi.org/10.3390/su12156152
Submission received: 22 June 2020 / Revised: 22 July 2020 / Accepted: 26 July 2020 / Published: 30 July 2020

Abstract

:
Resilience is the ability to restore performance after sustaining serious damage by a usually unexpected threat. This paper analyzes resilience of process plants as there are oil and gas refining, chemical manufacturing, power-producing plants, and many more. Over the years, plant safety has shifted from retrospective to proactive measures. Safety is important from many points of view, such as protection of workforce and nearby population, but certainly too from an economical and sustainability aspect. Pro-action requires predictive insight of what in the process can go wrong because of internal or external disruptive disturbance. Over the years, to that end, much effort was spent developing risk assessment methods and management. However, risk assessment has proven to be fallible because of various uncertainties and not the least by overlooked or unknown threats. To protect against those upsetting threats, measures can be taken up to a certain limit. These start in designing error-tolerant equipment able to be receptive to early warning signals during operations, responding to those with ‘plasticity’ of mind (that is, an organization and its leadership especially able to think ‘outside-the box’ for coping with unexpected situations), and finally, to deploy effective emergency response and able to recover from damage quickly. The paper presents a summary/review of nearly a decade of research work at the Mary Kay O’Connor Process Safety Center at the Texas A&M University to develop the concept and the techniques to realize a resilient plant, so far with a focus on chemical plant. It is, however, still a ‘work-in-progress’; potential is large. Besides the conceptual details, cases are presented that show how human and technical factors, combined in a socio-technical system, can lead to a broader plant safety insight enabling more effective risk control and increased resilience. These cases have up to now only considered warning signals and possible management action, while still limited to internal threats. Hence, aspects of equipment design and recovery should be further considered, also in the light of the dynamics of present-day business environment.

1. Introduction

Nowadays, the word ‘resilience’ has become rather common. It is mentioned in many news messages commenting on companies, institutions, organizations, and even countries. This paper is about resilience of process plants. Process plant should be understood to comprise oil and gas source drilling and production platforms, refining and chemical conversion plants, as well as that of power generation and many other processing plants. The quick interpretation of resilience is adequate recovery after an incident of some sort, as depicted in Figure 1. This represents performance over time of two identical process plants, in which case 2 has been better prepared for unexpectedly hitting threat. Damage is less deep and recovery is faster. This is thanks to measures explained in the next few sections and, in particular, in Section 2.2.
It is known that resilience’s root is mechanical, or according to a web definition by Oxford Dictionaries: “the ability of a substance or object to spring back into shape; elasticity”. As a metaphor, psychologists have already used it for 50 years [1] in connection with the ability of an individual to recover from mental stress and trauma, or trying to enhance an individual’s resilience [2]. Via culture and strife from high-reliability organizations (HROs) in the 1990s, resilience became a property of organizations [3]. In 2004, psychologist and risk assessor Erik Hollnagel with David Woods and Nancy Leveson organized the first conference on resilience engineering [4]. This focused on organizational resilience and the ability to maintain safety. Four cornerstones of resilience were identified: Monitoring, anticipation, response, and learning (MARL). Hence, the engineering concerns only the mindset. Haavik et al. [5] compared HRO and resilience engineering. It also became clear that disasters can depress communities strongly and that risk assessment and protective structures can help, e.g., [6]. Because of the growing number of disasters, particularly in the third world, the UN decided in 2010 to set up a task team and a development agenda to support increasing resilience on a national level [7]. Adequate resilience has been recognized by the business community to sustain business continuity in case of a crisis, e.g., [8].
The number of academic papers on resilience has grown exponentially. Relevant recent review papers are [9] on resilience and safety; [10] on definitions and resilience measures; [11] on resilience of critical infrastructures; and [12] on organizational resilience engineering. However, this paper focuses on the process industry and considers the entire socio-technical system, hence including all plant technology. It is based on the early Ph.D. work of Linh Dinh, followed by the more mature developmental work of Prerna Jain (Doctoral dissertations of Dinh.L.T.T, (2011). Safety-oriented resilience evaluation in chemical processes, and Jain, P. (2018). Process Resilience Analysis Framework for Design and Operations. These dissertations are available at http://oaktrust.library.tamu.edu/handle/1969.1/2).

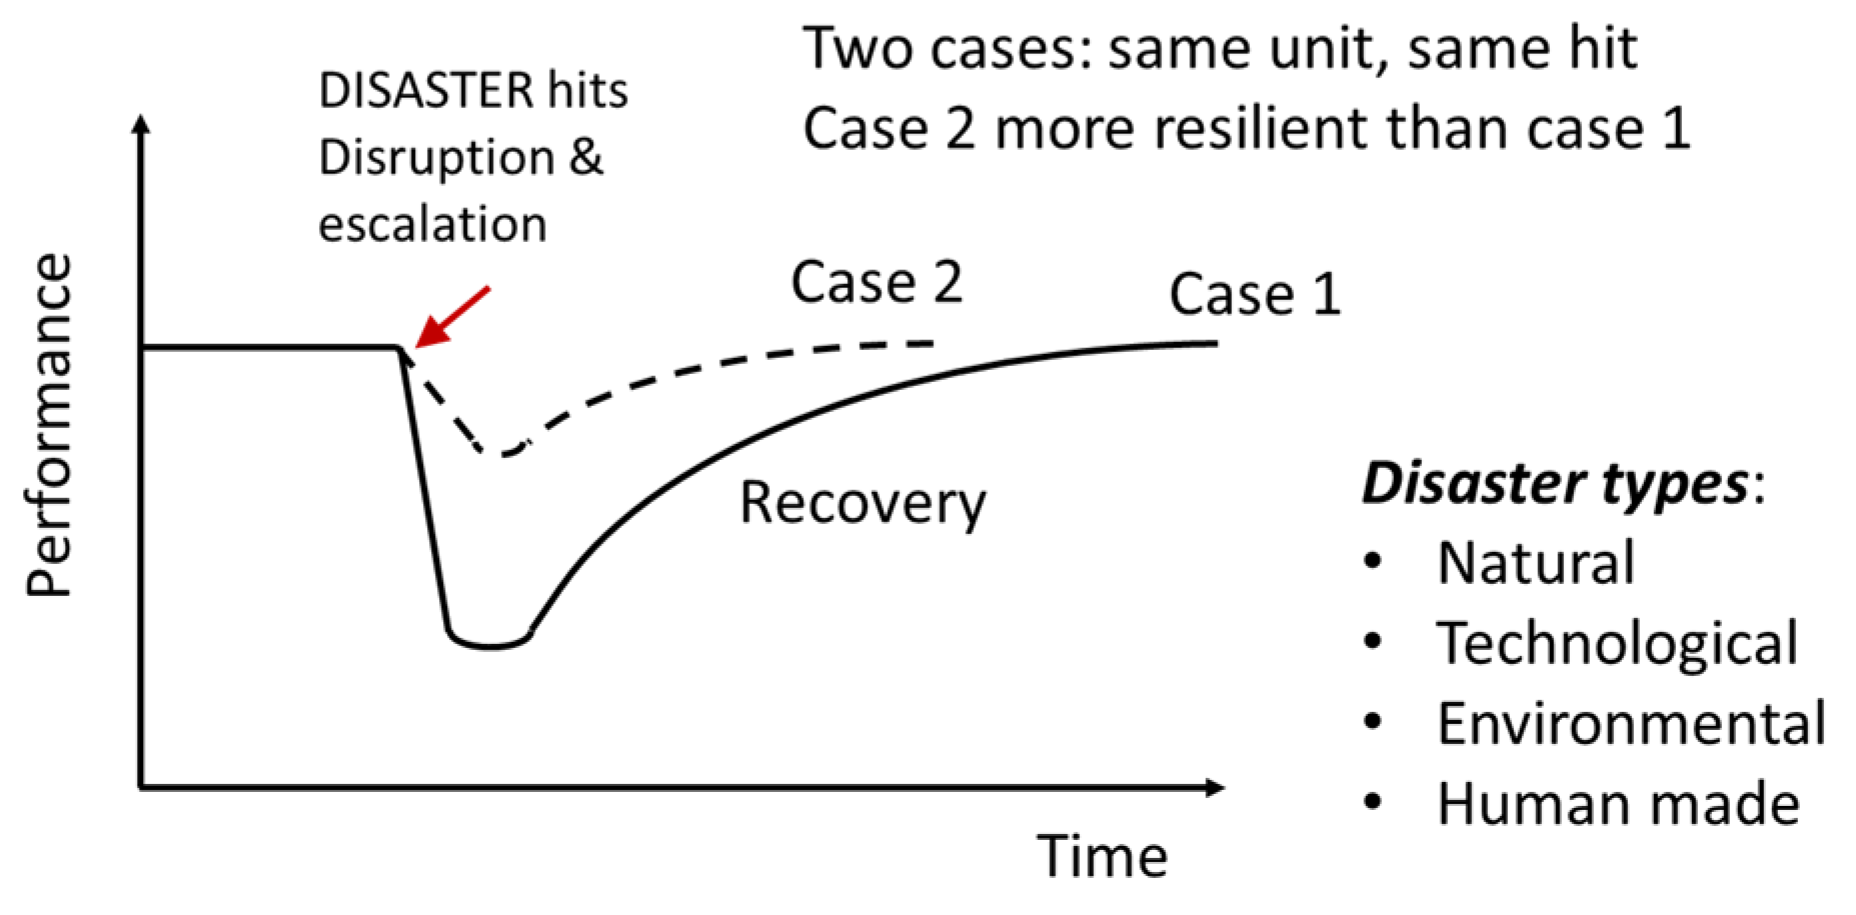
1.1. What Is Meant with Resilience in This Paper?

As mentioned above, this work targets the process industry, hence plants processing gas, oil, and chemicals in the broadest sense, hence from exploration of raw materials (upstream), actual processing (midstream), and further conversion (downstream), including storage and transportation stages. If a plant sustains damage due to an internal accidental event or an external threat, lives may be lost, and employees or even members of the public injured, while various further consequences can occur. If the damage is large and rebuilding takes a longer time, reputation and market share can become lost. Hence, the business will suffer. Returning a moment Figure 1, it is clear that when management receives a warning, when it is prepared and responding adequately, damage at a given threat may be less deep and recovery more rapid (Case 2). In such case, the organization is considered more resilient. To realize such performance of Case 2 requires much of top-management, leadership, and the rest of the organization and the technology. Resilience has social and technical aspects; good resilience requires the right attitude of the individuals involved, the organization as a whole, and it sets requirements for the plant installations. Treating resilience will include implementation of these aspects.

1.2. Why Is Considering Resilience Useful?

Safety of process plants with their hazardous materials is important for the protection of workers and nearby population, but also for economical and sustainable reasons. If there would be no chance that the plant would be hit by an unexpected or even unknown threat causing major damage, resilience analysis would be unnecessary. Given conditions and uncertainties, however, practice is completely different. Apart from earthquake, cyber-attack, or other human intentional act, there are unforeseen internal deficiencies that can induce a major damage event. Since the late 1980s, it has been known that hazard identification techniques, such as HAZOP, FMEA, and What-if, provide only an incomplete representation of the possibilities of mishap. Suokas and Rouhiainen [13] estimated, based on many data, that just more than half of the possible major events are identified. The EU Benchmark of risk assessments ASSURANCE in 2000 [14] showed orders of magnitudes spread in results in which differences in scenario definition of the seven participating experienced risk analysis teams was the strongest contributor. Baybutt [15] provided a summary of many reasons why HAZOP overlooks possible hazards, also based on many of his previous articles. Analyzing causes of the 100 major losses in the onshore oil, gas, and petrochemical industries over the period 1996–2015, Jarvis and Goddard [16] concluded that a major contributor (48% of integrity failures) is inadequate process hazard analysis. Taylor [17], looking back after performing 92 QRAs over 36 years, saw 26 major accidents in the plants he assessed. He concluded that despite his rigorous hazard identification thanks to extensive experience, including human error analysis and automation, hazard identification had been incomplete, although a major contributor has been the management not following his recommendations. Based on data of various sources and Lloyd’s Register experience, Casal and Olsen [18] concluded that many mishaps in operations, such as loss of containment, are human error related, such as column liquid overflow, inadvertent opening pressurized equipment, and more, and they are not being covered by earlier hazard identification. Improvement is possible, but even when at the outset a complete hazard inventory is obtained, new mishaps causes may appear in aging plants.
A conclusion of the above is that despite great efforts to rule out possible mishap by design and preventative measures, i.e., process upsets and losses of containment, and by installing protection barriers against escalation, major accidents still can and do occur. This evidence justifies a resilience analysis.

1.3. Previous Work and Objective of This Paper

In 2008, the Mary kay O’Connor Process Safety Center began research in the area of plant resilience and published the first journal paper by Dinh et al. [19], based on Dinh’s Ph.D. thesis [20]. This initial work had limited scope and, based on literature reviews and expert opinions, attempts were made to identify principles and factors that contribute to plant resilience. Six principles were found: Flexibility, Controllability, Early Detection, Minimization of Failure, Limitation of Effects, Administrative Controls/Procedures. Also, five main factors contributing to resilience were proposed, including Design, Detection Potential, Emergency Response Plan, Human Factors, and Safety Management. Each of the principles and factors were elucidated. Dinh [20] developed indices for the various principles and concluded with a case study of ethylene production alternatives.
This work was followed by another five years (2013–2018) of research resulting in a much sharper contour on process resilience definition, resilience concepts, metrics, and demonstration of practical methods for process systems in the way of process resilience analysis framework (PRAF) (Jain et al. [21,22,23,24,25,26,27,28,29,30]). These papers respectively addressed the necessity of resilience [21], its elements [22], the framework and how that works out at the plant system level [23], the same with regards to management system level [24], resilience metrics with weights [25], predictability of process abnormal situations/upsets given resilience metrics’ outcomes illustrated by a batch plant case study [26] and [27], resilience analysis-based data-driven maintenance optimization on a cooling tower case [28], how resilience can be part of a conceptual process design and technology selection phase [29], and finally, what a state of good resilience can mean for business continuity and sustainability [30]. In the next few sections, more details will be described.
The objective of this paper is to summarize and review results obtained in these 10 years and to provide a reflection of what further should be done. Hence, the paper is rather limited in scope. In Section 2, resilience elements will be treated, in Section 3, how resilience can be assessed, in Section 4, how it can be maintained, and in Section 5, a summary of example cases shall be presented. In Section 6, future efforts shall be discussed, while finally Section 7 contains the Conclusion.

2. Resilience Elements

2.1. System Approach: Sociotechnical System

A starting point of resilience analysis is to approach a process plant activity as a sociotechnical system. Rasmussen [31] promoted the concept of socio-technical system for the purpose of accident investigation and risk management of hazardous industrial facilities. The concept is based on earlier work of Trist and Bamforth [32] when dealing with the social implications of a new coal mining technique. A socio-technical system approach covers all hierarchical layers from regulators via company board or organization top-management to lower managing layers, down to operations layers and technical installations. The various layers communicate orders and assignments downward and reports upward. At all layers and between layers there is human interaction, while at the lowest level, humans will interact with the technology. Looking at a system and trying to find out how it works, the human mind may perceive it as complex and opaque. As a result of an action somewhere, this may have non-linear, hence, at first sight unpredictable, effects. In fact, all components can be functioning as designed, but the system can still fail due to one or more dysfunctional interactions, which not have been identified in the design.
In this century, the concept has further been developed by Leveson [33,34] for the accident investigation model STAMP (system-theoretic accident model and processes). The latter led to the hazard scenario identification method STPA (system-theoretic process analysis), of which it is claimed it can conditionally identify all mishaps a system can undergo. This is realized by decomposing the system at the various organizational and technical levels into all possible control loops and analyzing each on defect of sensor, of processor, and actuator, and on interference with other loops in the controlled item. These control loop components can be human or technical. However, for a full-size plant, there are a myriad of possibilities, and there is no automated means of analysis in sight yet, so the extremely large effort prohibits exploiting STPA’s full potential.

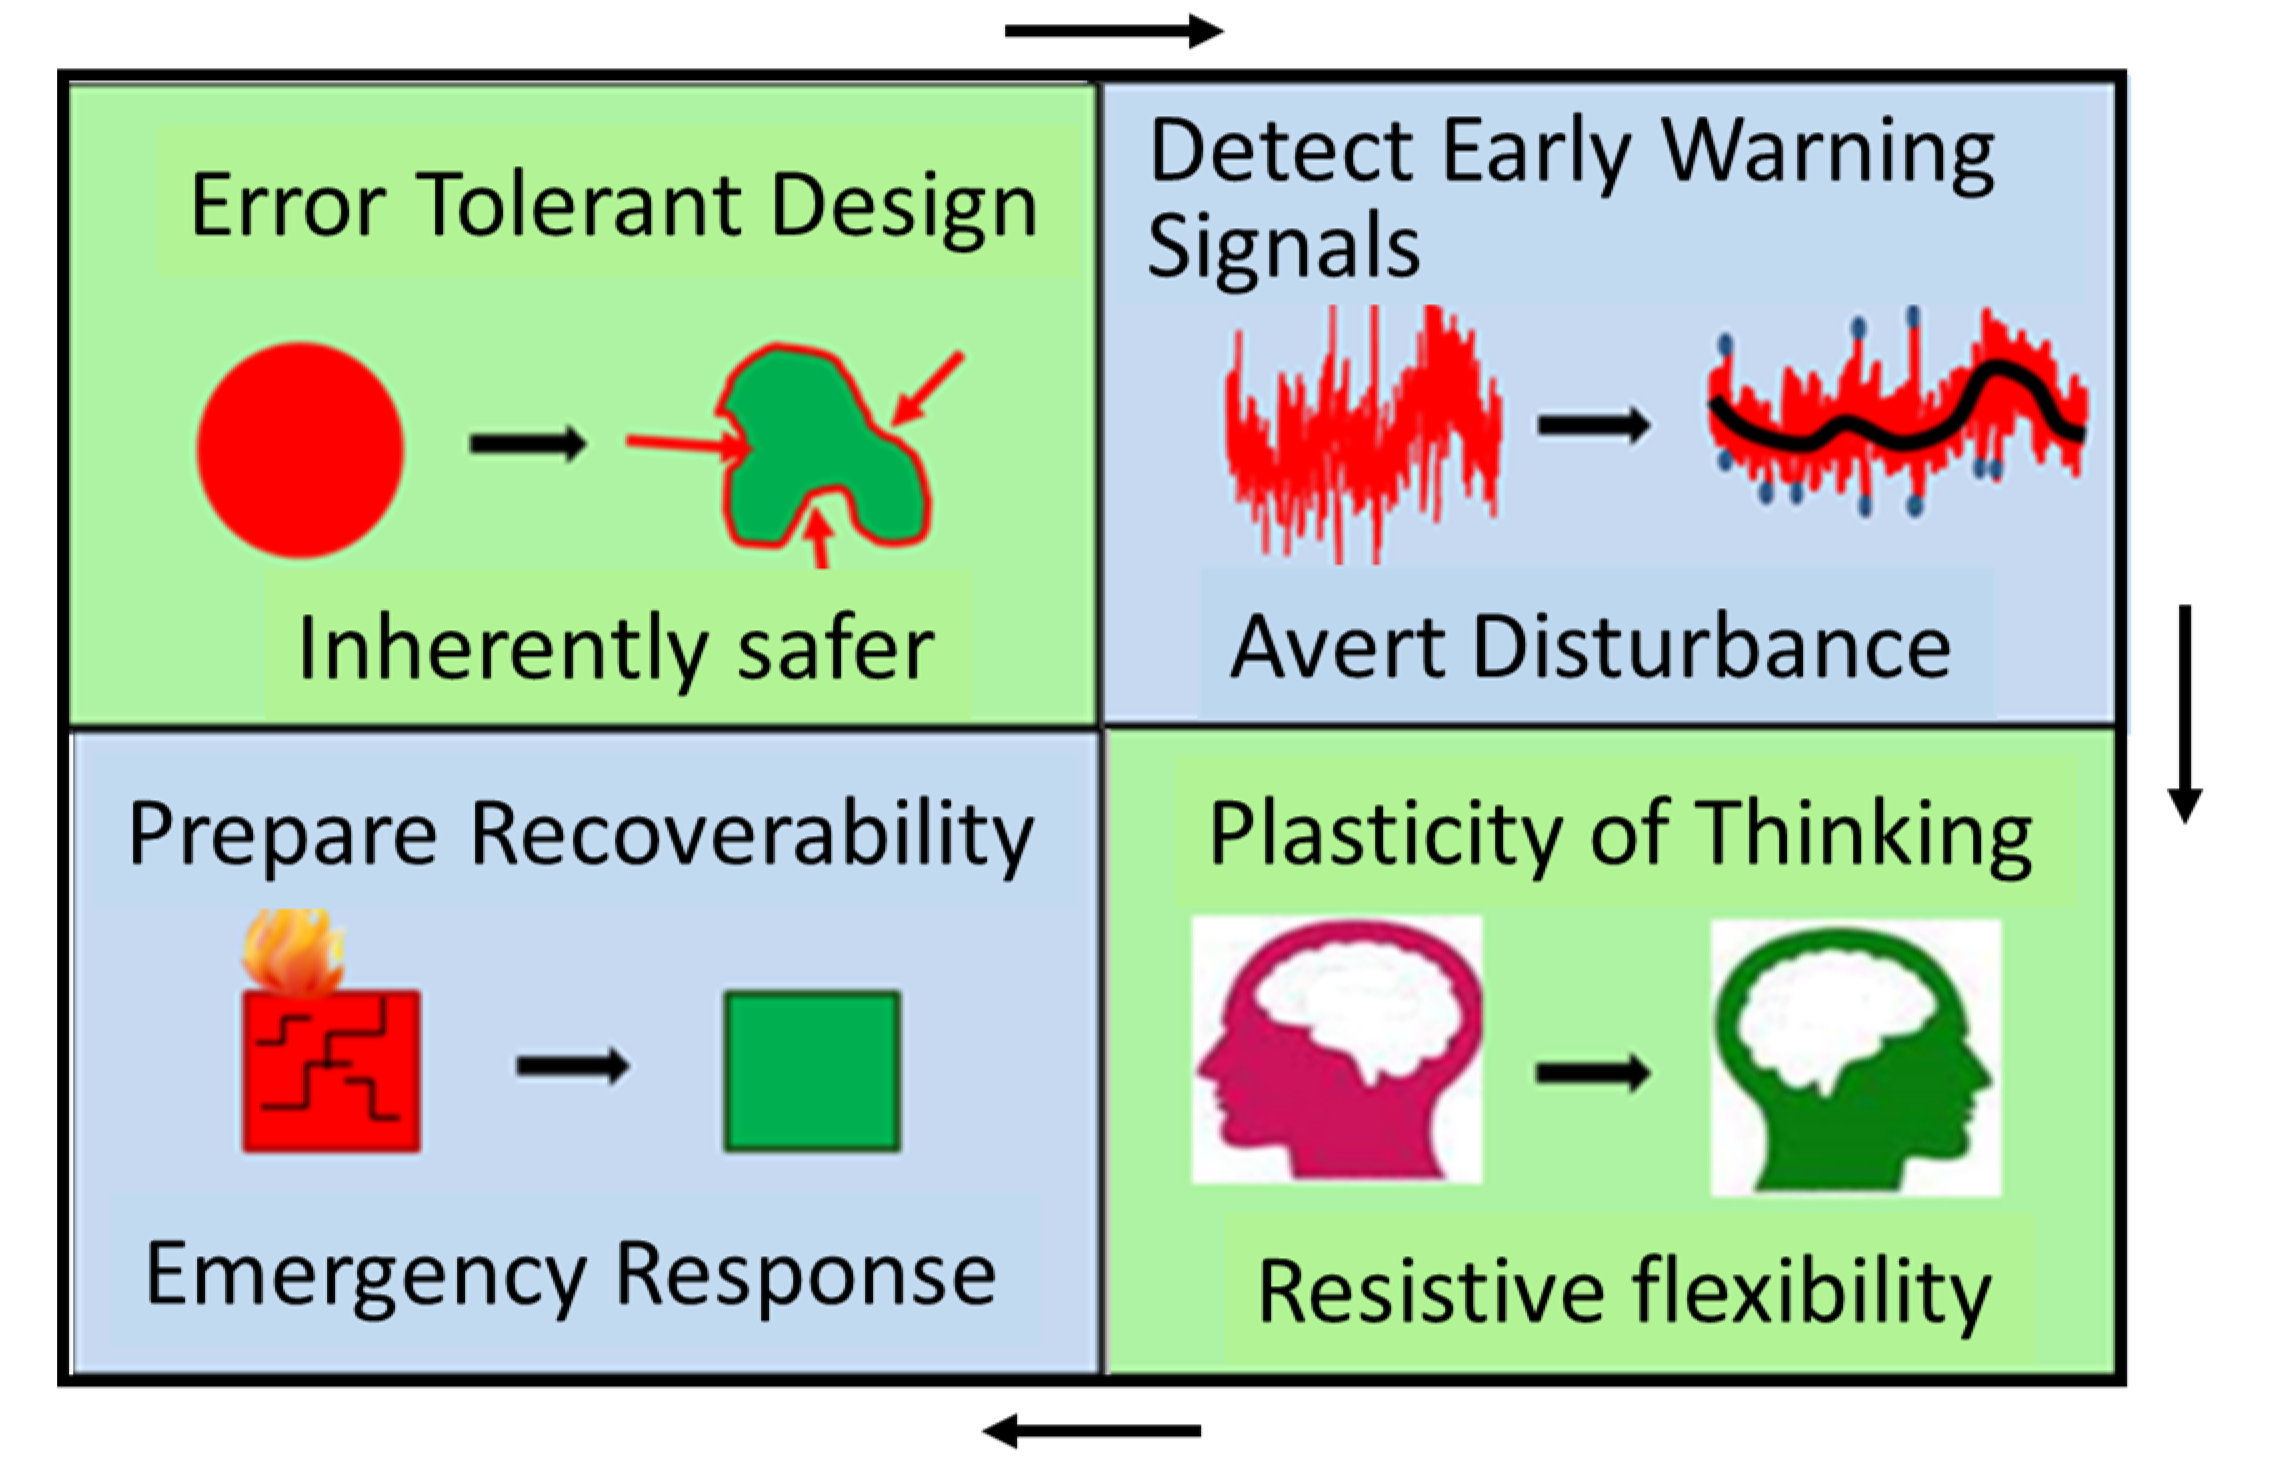
2.2. Key Elements or Aspects of Resilience

The principles and contributing factors identified by Dinh [19], presented in Figure 2, underwent a further evolution and became more concise and imaginative as shown in the four elements or aspects in Figure 3 from Jain et al. [21]. This latter figure is slightly adapted from the original one in [21] to better show by following the arrows the sequence of elements that at one hand play at the start of a plant’s life cycle, the design, and what later is important given an attack. The sequence is consistent with the three phases that can be distinguished during an attack or developing threat in which resilient capability is relevant: Avoidance, survival, and recovery.

2.2.1. Error Tolerant Design

Dinh et al. [19] identified the principles of minimization of failure and effects to implement preventative measures with inherently safer design concepts. This is one of the elements of process resilience in an attempt to maximize inherently safer features of a plant with respect to process as well as equipment. According to Jain et al. [21], error-tolerant design also means that an operator cannot make an error quickly, or conversely the design should be forgiving regarding possible operator error, and if part of the equipment is failing, it should not lead easily to an upset. At the same time, past experience is that design errors contributed quite frequently to accident [35,36]. The same holds for the design of operational procedures. So, because the design process is as important as the operational one, Leveson [34] included design as a second pillar in the socio-technical system parallel to the operational one. The design organization should have the right competence level and culture with a quality management system and key performance indicators. Error-tolerant design helps to reduce the safety cost at the conceptual stage leading to a more resilient process. Research on targeting resilience at the fundamental stage through error-tolerant design has opened new dimensions for conceptual design of any process.

2.2.2. Early Warning

A timely warning for impending threat and risk is of great significance. For this, weak signals from a variety of sources should be permanently scanned. In the first place, this will be the regular process control signals. As a result of the development of signal processing techniques by sophisticated statistical methods, machine learning, and artificial intelligence, much has been published lately on fault detection and diagnosis of measured process variables; a review of a variety of methods is presented in [37]. In addition, there are many other sources of risk relevant information, such as barrier health data, energy consumption of equipment, pump and pipeline vibration, corrosion, transient and simultaneous operations in, e.g., maintenance activities and turnaround, issued work permits, unusual internal plant vehicle traffic, and temporary personnel or visitor concentrations. Both CMMS (centralized maintenance management system) and LIMS (laboratory information management system) can provide updates that are of significance. Further, there is also ERP (enterprise resource planning) information, such as SAP (system analysis and program development) data on the company business processes (accountancy, client orders, suppliers, maintenance schedules, and logistics). Finally, and not the least, the lagging and leading process safety performance indicators (CCPS [38]) data can be gauged, which can provide useful information on trends in the quality of the safety management system, safety culture, and resulting safety climate. Similarly, monitoring of resilience metrics shall be included, which will be described in Section 3.
Then, there are external data to follow, such as utility disturbances, weather, environmental conditions, possible earthquake, and whether there are alerts on cyber threat or other intentional acts. Processing of these data should be highly automated with alarming results presented to management as urgently actionable information. Digitization and the host of nowadays available analytic techniques should enable the data processing. Experience teaches that presentation of alarming information to top-management resulting in adequate measures taken timely is often the most difficult but crucial step.

2.2.3. Plasticity

Unexpected and unknown threats must, in the first place, be recognized as such, while ingenuity may be required to cope with a threat without generating risk elsewhere. It requires flexible thinking but also for restraint to jump to conclusions, hence resistive flexibility. One can also characterize it as agility in dynamic decision making under uncertainty. The right attitude, adequate process knowledge, insight, and experience are needed qualities. To some extent, flexibility would also be a favorable equipment property. Given a threat, process simulation and risk assessment will be useful to investigate in both the design and operational stages the best possibilities, and to train staff for crisis situations. Having experienced potential disaster scenarios requiring a quick survey of available options and fast decision making, albeit in simulation, will be of great help to stay cool and do the right thing when a real threat presents itself.

2.2.4. Recoverability

Effective emergency response is a first necessity of recoverability. It requires the right equipment capability, team preparation by scenario analysis, and operational training with, depending on the situation, company, and community responder teams including medical personnel and police. An Emergency Command Center is a basic requirement for coordination among authorities, company management, and media. To be prepared also requires adequate fast shutdown possibilities, facility fire safety provisions, and self-rescue routes.
Where emergency response may take days or weeks, recovery as a whole may take a much longer time. Recoverability needs preparation in the form of acquiring contingencies, so that company output activity suffers minimal disturbance and as much as possible business continuity is guaranteed. This concerns supply of raw materials and substitute equipment, reserve staff, sufficient financial reserves, and not losing market share selling product produced elsewhere. Because all investment is limited, risk assessment results will provide a basis of how to distribute resources for the best final result and an optimal chance of business continuity. This leads us to Section 3.

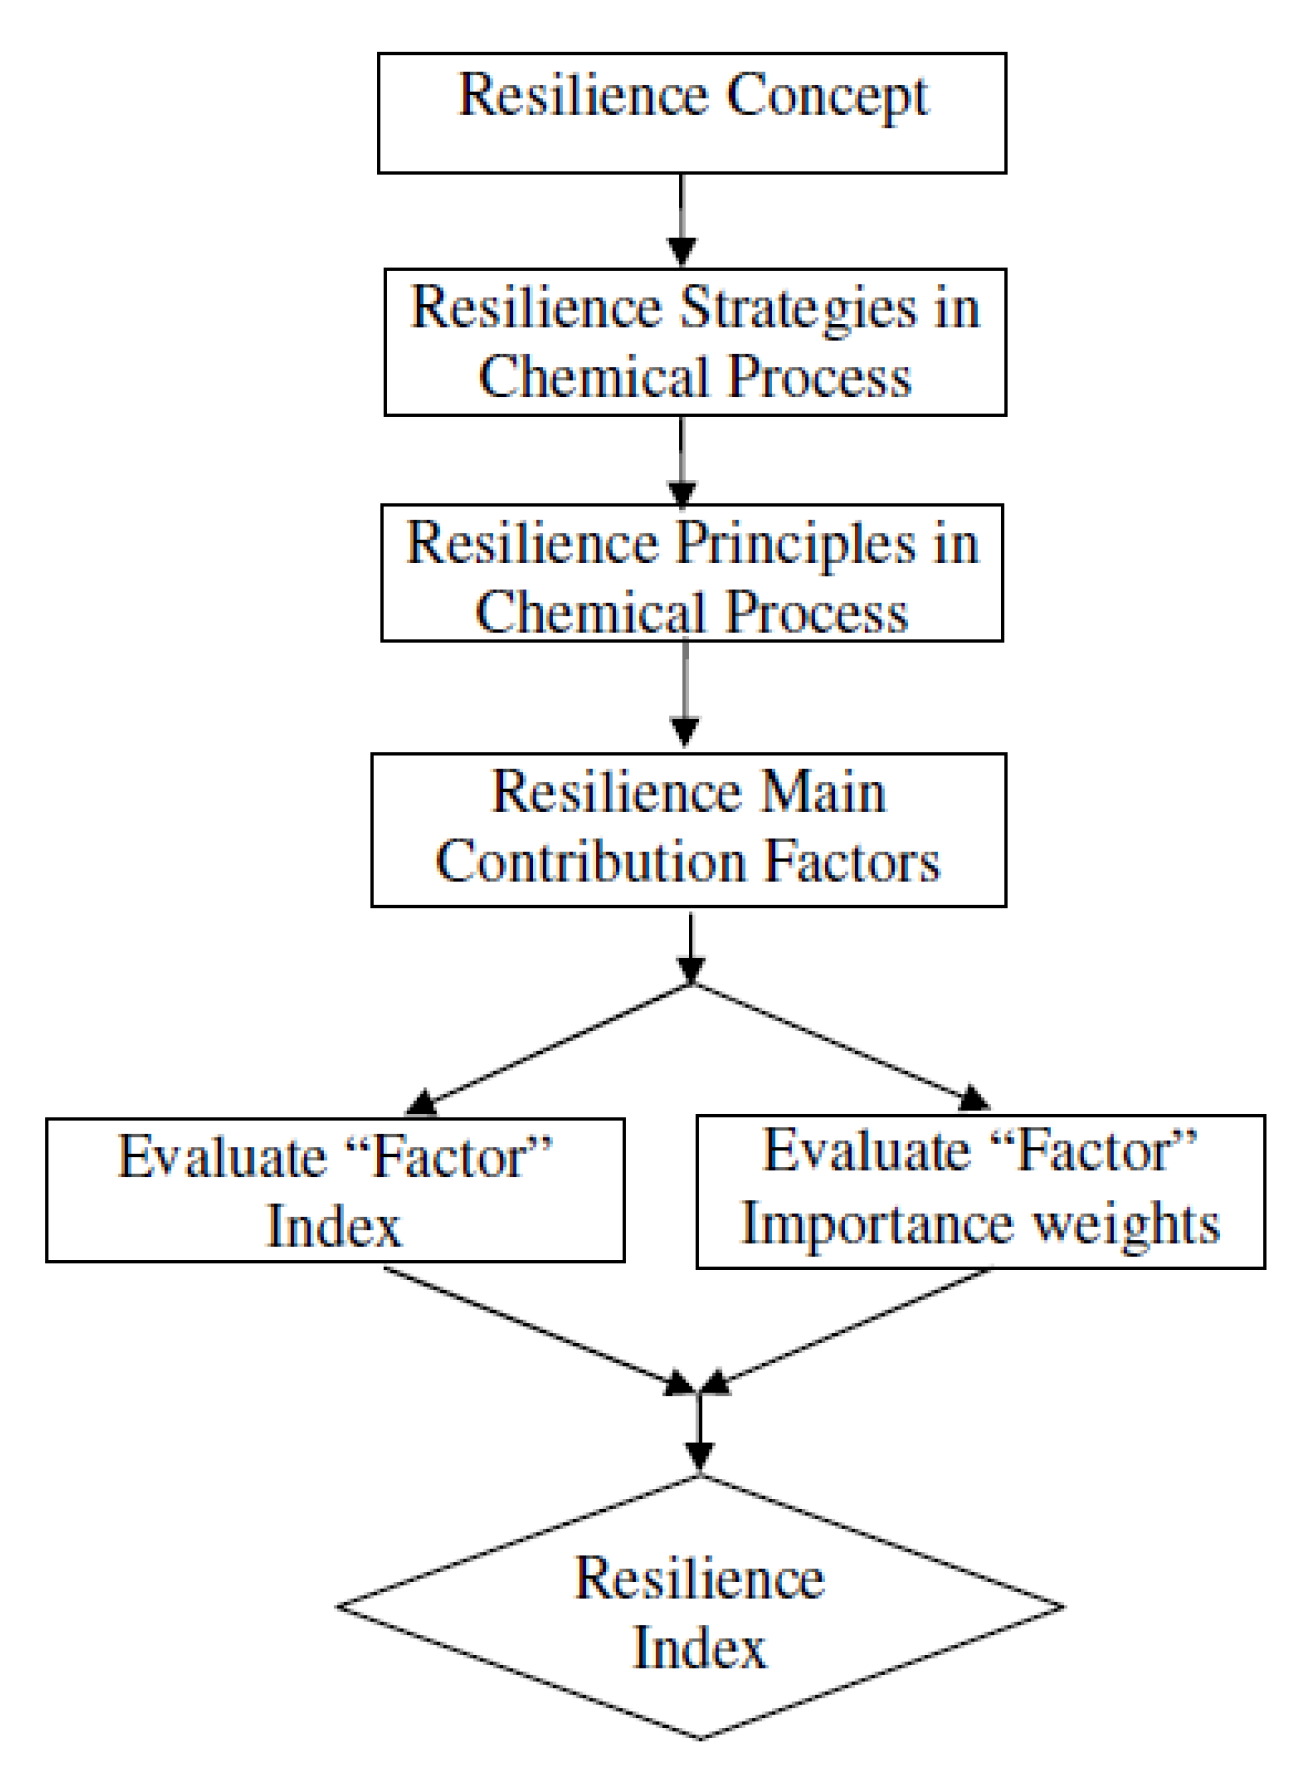
3. How Can Resilience Be Determined?

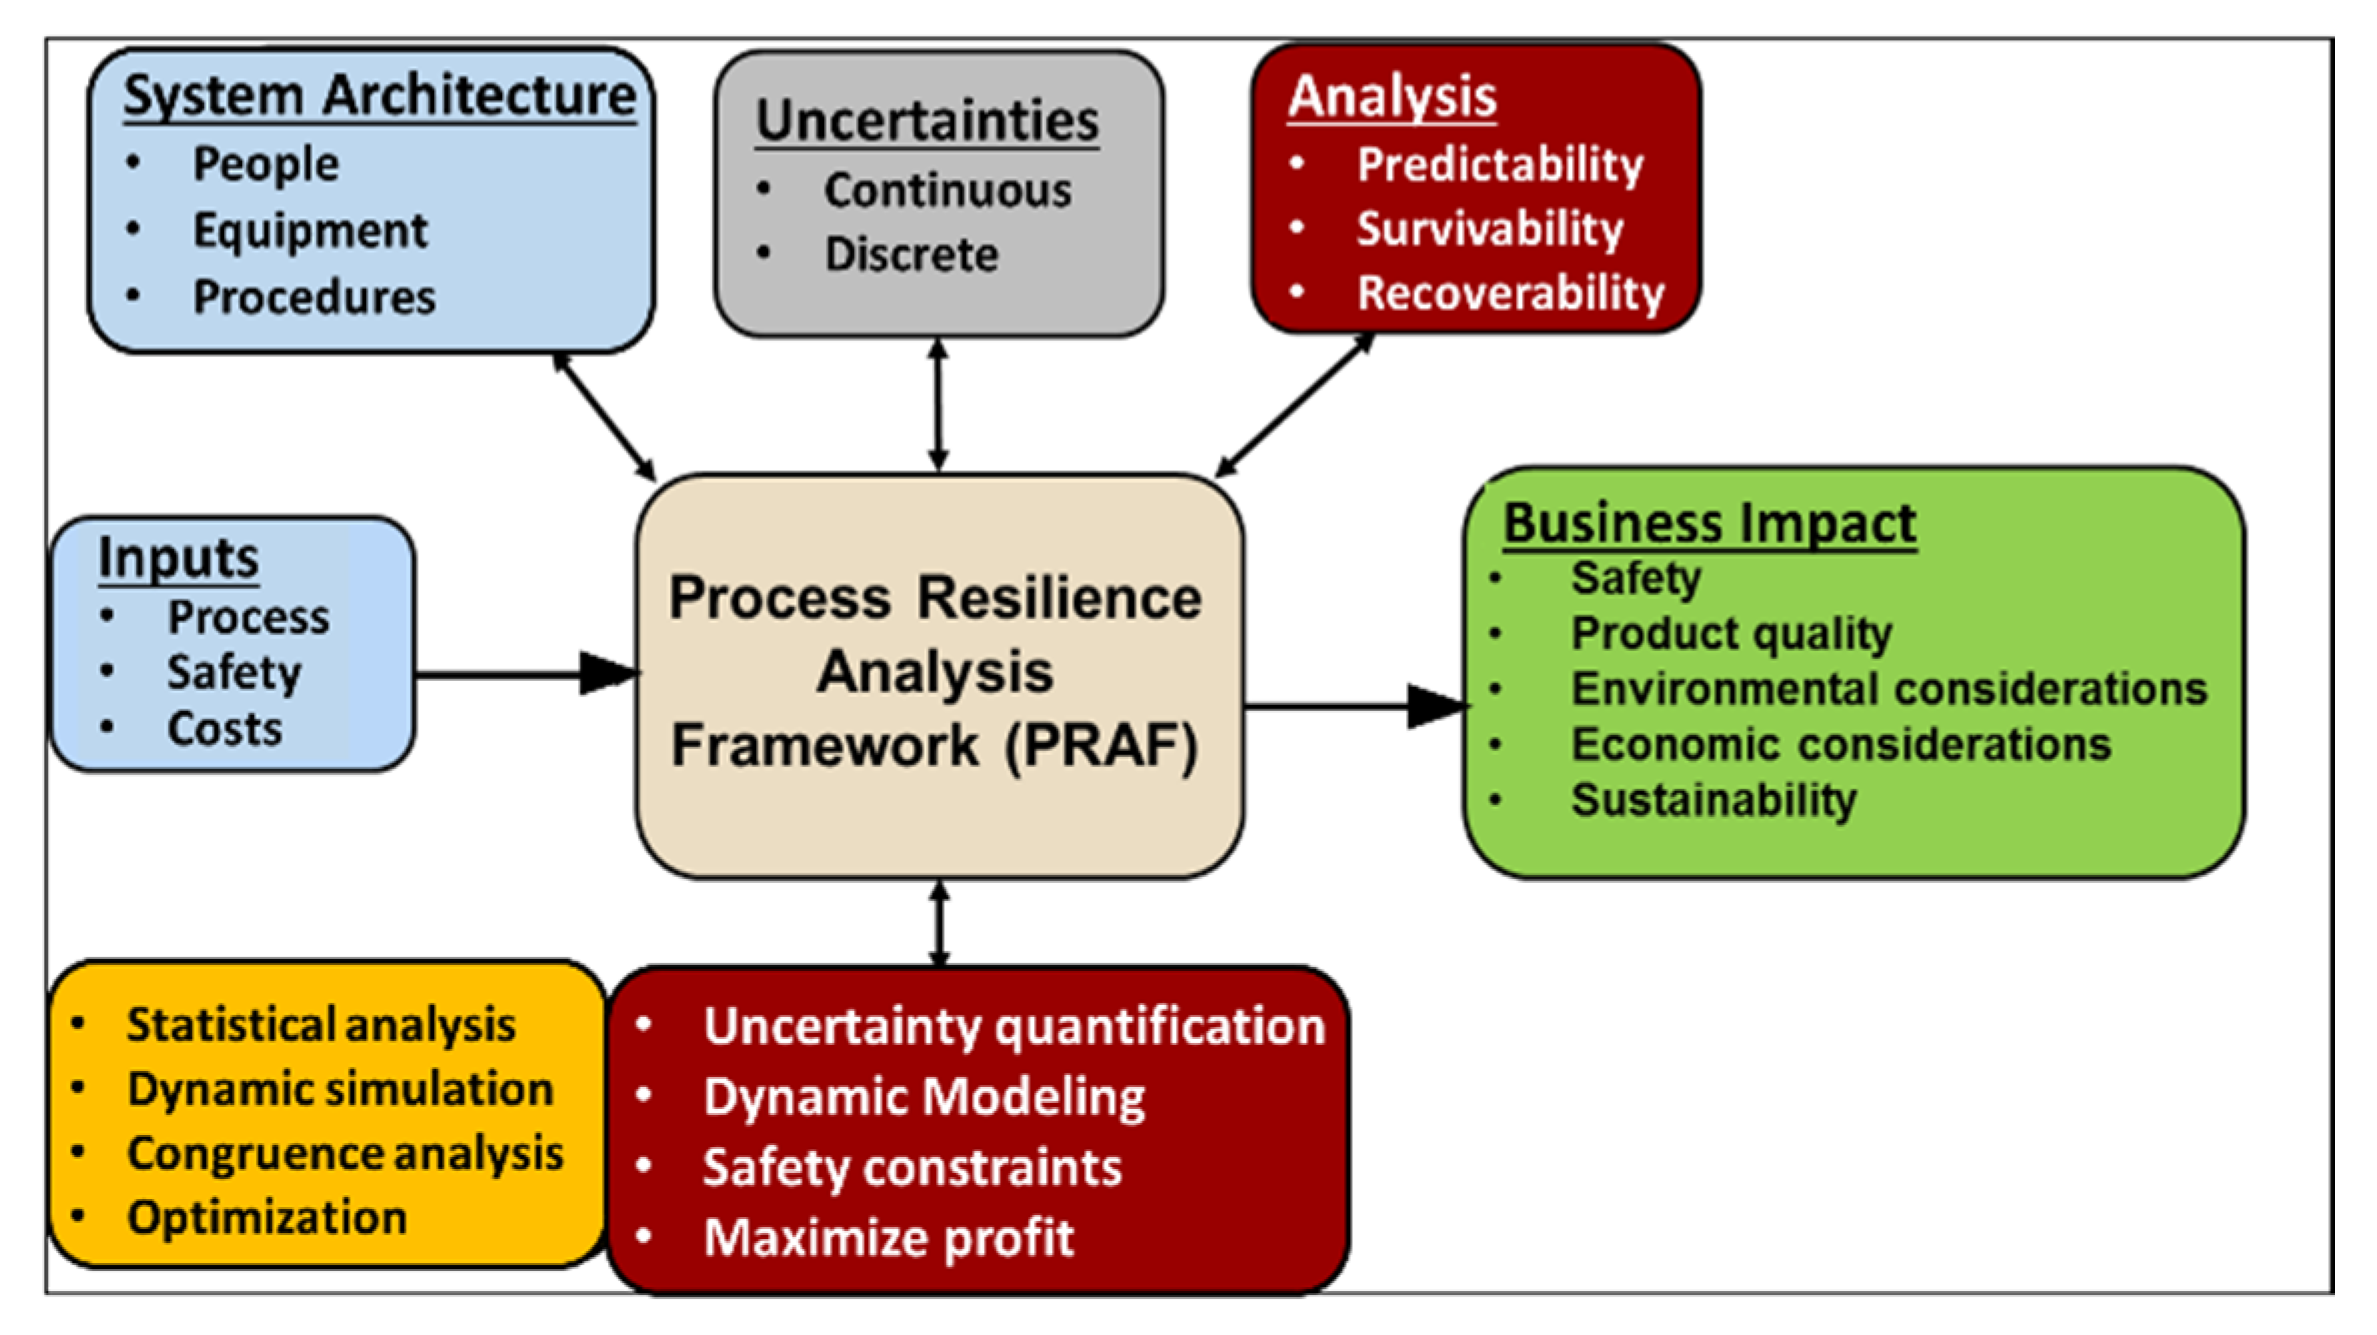
3.1. Resilience Determination Framework

Dinh et al. [19] proposed an algorithm depicted in Figure 4 to evaluate process resilience in index form using the principles and contributing factors with multi-factor approach as shown in Figure 2. Jain et al. [22] proposed as a further refinement PRAF, the novel process resilience analysis framework as presented in Figure 5.
PRAF is integrated, time dependent, and quantifiable. As already mentioned, resilient capability is characterized by the three-phase resilience analysis: Avoidance, survival, and recovery. For an analysis of the state of resilience, one must first make a distinction between that at a given moment of time, hence static, and trends when in operation, hence dynamic. The latter will be treated briefly in Section 4. The basis for the first is thorough quantitative risk assessments of the initial plant situation or later ones. These will be fallible, as we have shown in Section 1.2, but nevertheless, they are the best we can do.
As depicted in Figure 5, these assessments should comprehend the whole system architecture, hence plant, people, and procedures. Plant risk assessment due to failing equipment is achieved using conventional methods; for the effect of people and procedures on risk, one must rely on less mature methods. For analysis of human failure when interacting with equipment and procedures, a variety of performance shaping factors, such as time pressure, competence, task complexity, and operator plant interface, play a role. In addition, culture-based attitude and motivation are important. For these, resilience indicators proposed by Jain et al. [25] will be discussed in the next section. The risk assessments should also include uncertainty analysis as this information is important for optimally informed decision making. All this will influence predictability and hence survivability, while the reliability of the risk assessment is also a factor in preparing recoverability.
Economics always play a dominant role, so the PRAF [22] contains which additional measures will cost and affect profitability, but also which positive effect the measures will have in case of calamity.
Summarizing, PRAF incorporates absorptive, adaptive, and restorative capacities. Because it is a quantitative and data-driven approach, resilience indicator metrics have been identified, and the way that has been realized is reported in the next section.

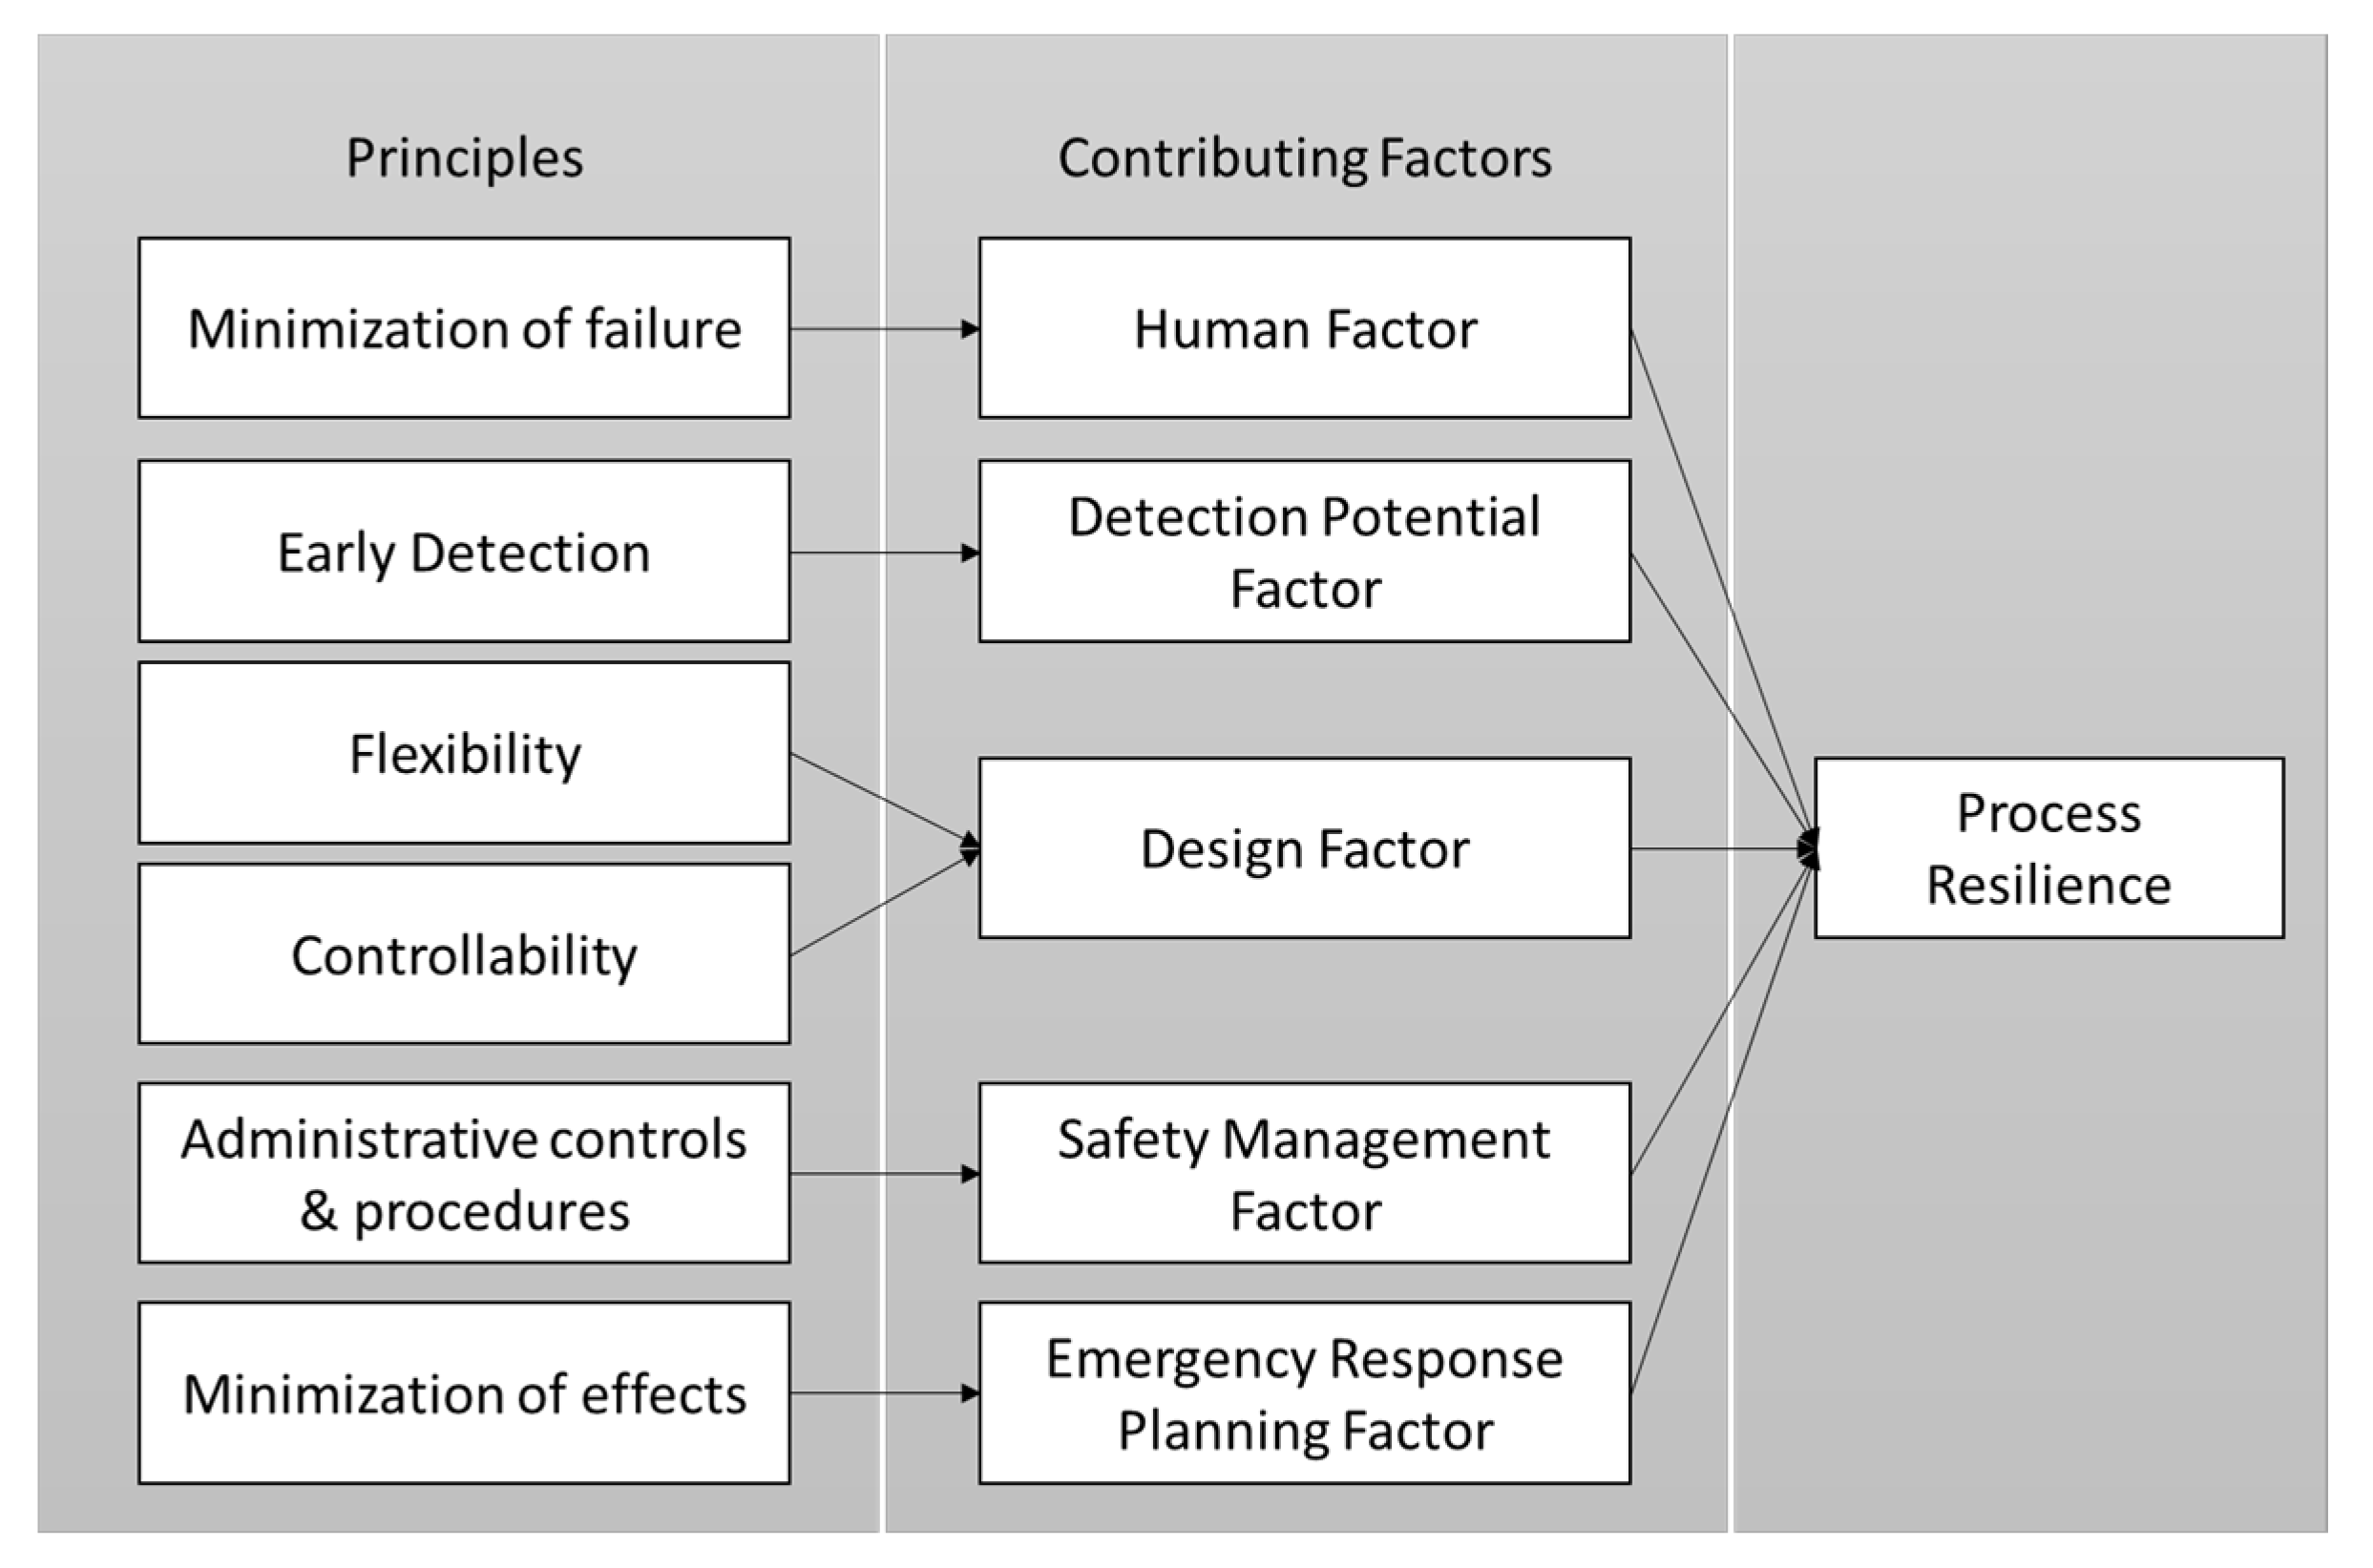
3.2. Resilience Factors or Metrics
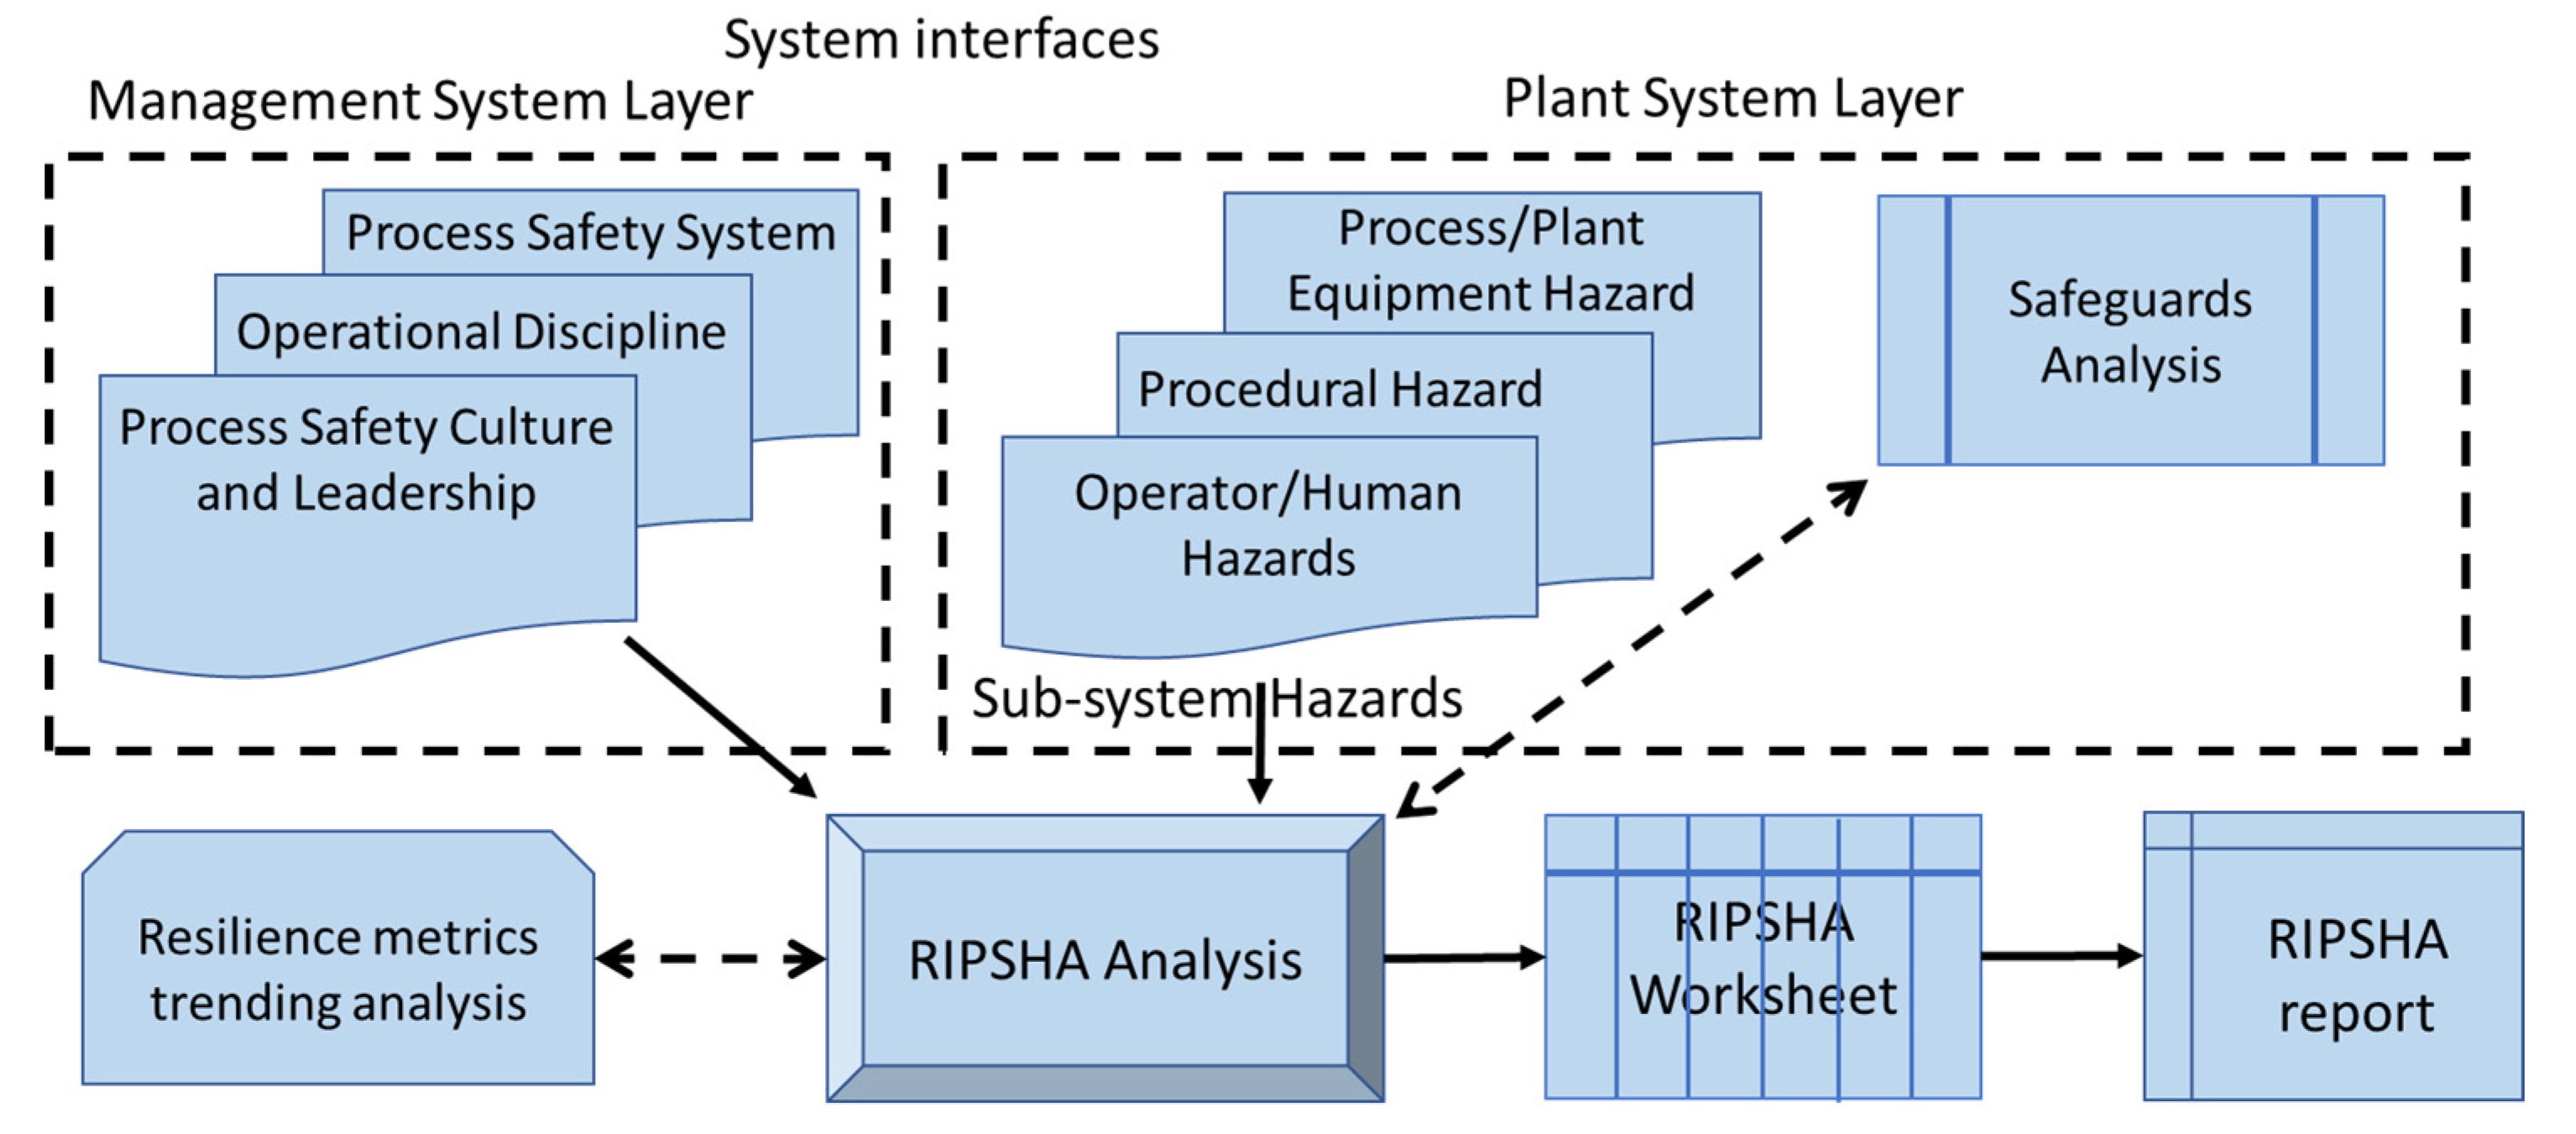
As explained in previous sections, the state of resilience of a facility depends on technical and social factors. Hence, the contributing factors based on different principles are proposed by Dinh et al. [19] as depicted in Figure 2, and the resilience metrics that have been developed by Jain et al. [25], are addressing both aspects. The resilience metrics drafted by Jain et al. [25] can be referred from Table 14 of [25].
The resilience indicator metrics [25] are all quantitative in terms of a number or a percentage per time unit, e.g., a year, and therefore metrics in the true sense; authors covered all three phases with the following metrics: Avoidance, which requires an event is predicted, survival applying plasticity, and recovery stating with emergency response. A survey questionnaire with proposed indicators and graded importance questions to answer was sent around to industry, academia, and government [25]; 251 recipients responded, of which a large majority (72%) had process safety experience, while 85% of respondents worked in industry or as a consultant for industry. The graded questions utilized a Likert scale: 4—essential, 3—important, 2—helpful, and 1—unnecessary. Results of the survey were found to be statistically reliable and internally consistent in, among others, ordinal alpha, Cronbach-alpha, and Kruskal–Wallis tests applying programming language R.
Based on the survey, three questions were answered:
RQ1: What are the most important metrics for each of the 3 phases of PRAF—avoidance, survival, and recovery?
RQ2: Are there any differences in viewpoints of various groups of survey respondents? In this case, group means sector of employment.
RQ3: What are the weights for each of the metrics?
In Table 14 of [25], the resilience indicator metrics are listed together with the weights that resulted from the survey. There are 26 metrics of which some are relevant for more than one of the phases. Q number designation refers to the survey question; the next item number column refers to the resilience aspect in RIPSHA I and II (next two sections); each metric is linked to a resilience element as well (ETD—error-tolerant design; EW—early warning; P—plasticity; R—recovery). Scaling is based on the highest at each phase. These are: Process safety near misses, Management response to the inspection findings of safety critical equipment (SCE) deficiency, and Successful tests for emergency systems and procedures. The lowest at the three phases are: Communications on learning from incidents, Changes executed through the Management of Change (MoC) procedure, and Phase 3 Shift handover communication violations, which may be surprising to some extent.

3.3. RIPSHA

The resilience-based integrated process system hazard analysis (RIPSHA) approach developed by Jain et al. [23,24] is based on the previous discussed concepts and aspects of resilience, hence a socio-technical system and four aspects in Figure 3. Hazard analysis technique is applied to a designed process, process design aspects are seldom considered except the pressure relief systems recommendation as an independent protection layer. As mentioned, when discussing PRAF (Section 3.1), resilience analysis assumes results of the best quality risk assessments are available. HAZOP is an important basis for those assessments, but as we have seen are not sufficient, not even when additional methods are applied. RIPSHA is meant to overcome the deficiencies.
As shown in Figure 6, RIPSHA comes in two layers: The plant and management layers. The former comprises process/plant hazards, procedural hazards, and operator/human error hazards, while the latter comprises hazards due to failure of the process safety management system, operational discipline, and deficient safety culture and leadership. The plant layer will be treated in the next section and the management layer in the one following.

3.4. RIPSHA I

RIPSHA I—Plant System Layer [23]. For the plant, we have to distinguish design and operations. As mentioned in the RIPSHA I and II, only few design items are included, while the operations consist of normal operations, simultaneous one of different units, or maintenance works interacting, and transient ones, such as start-up, shutdown, and turnaround.
With regards to process/plant hazards certainly in the case of design, we have to rely much on traditional HAZOP techniques. For operations, not only operator error, but also failure rate and unavailability must be taken into account, which are all much influenced by organizational and human performance factors. Considering human reliability analysis (HRA), a large volume of literature is available (see [39] for 50 years of HRA in the nuclear industry); problems are widespread in values and uncertainty of results, and when decomposing factors in type of interactions, work conditions, and personality features much interdependence and correlation is found [40]. With respect to process industry, the HEART method [41,42] and more recently based on much experience Taylor’s practitioner’s guide [43] seems to be of practical use. Also, with respect to procedures, there are various kinds of complications [44], not to forget the effect of fatigue and other physiological states [45].
RIPSHA attempts to obtain more certainty in these matters by a HAZOP-like procedure using a keyword of the indicator metric expression as parameter, a guide word, and the anticipated deviation, with cause and consequence, likelihood and risk with and without safeguards, and finally recommendations including the person, who must undertake action. Parameters are grouped and numbered according to the four aspects: Error-tolerant design (ETD1 to 3), early detection (ED1 to 7), plasticity (P1 to 12), and recovery (R1 to 2), in total 24. Guidewords depend on the linked parameter; guideword examples are missing, inadequate, more, less, other than, wrong, unavailable, untimely, ineffective, and skipped.
A RIPSHA analysis takes seven steps to conduct [23]:
  • Team formation;
  • Charter preparation;
  • Data and documents collection;
  • Sub-systems procedural review, including worksheet elucidation;
  • Documentation of findings;
  • Recommendations;
  • Closure of recommendations and corrective actions.

3.5. RIPSHA II

RIPSHA II—Management System Layer [24]. Past incidents made clear the necessity of maintaining and nurturing an adequate process safety culture level. This can only be realized by motivated leadership. On safety culture, much has been written. It is built on organizational culture, which nowadays is “measured” through surveys. This is despite the fact that measuring the deep culture core values is difficult, whereas measuring safety climate is more straightforward [46]. Although, based on many tests, there has been a warning for the likelihood of so-called non-random errors in safety climate survey data [47]. Zohar and Hofmann [48] wrote a noted work in which these authors recognize the need for measuring culture and seeing the perspective that “organizational climate could be used as a bottom-up indicator of organizational culture”. Recently, a French institute on safety published a practical guide on safety culture [49].
Another aspect is operational discipline. This is not independent from the previous. If discipline deteriorates, the chance of accidents grows; this occurs regarding experience as well. The third aspect is process safety systems; in general, barriers. These can be technical (physical), organizational (administrative, procedural), and human (action). It is top management that must create the conditions by which the health of barriers can be measured and assured. Bowties can provide effective overview in combination with various barrier health monitoring techniques. In a bowtie, preventive barriers and components that can fail are shown in the left part of the fault tree of the initiating (top) event as well as effects and protective barriers in the right side of the event tree.

4. How Can Resilience Be Maintained?

Resilience indicator metrics are quantitative. By setting up a system in which the values are periodically updated, statistical treatment, such as determining a moving average over a number of periods, together with making use of the capability of Bayesian network, will enable monitoring trends in resilience. The latter is demonstrated for process safety performance indicator metrics [50].
In addition, every five years, for example, an analysis must be performed to see whether conditions or parameters have changed.

5. Summaries of Process System Resilience Analysis Example Cases

The cases are limited to disruptions of operations by internal threats, hence, external threats, and the elements of error-tolerant design and recovery details remain out of sight. The cases come under the PRAF phases avoidance and survival.

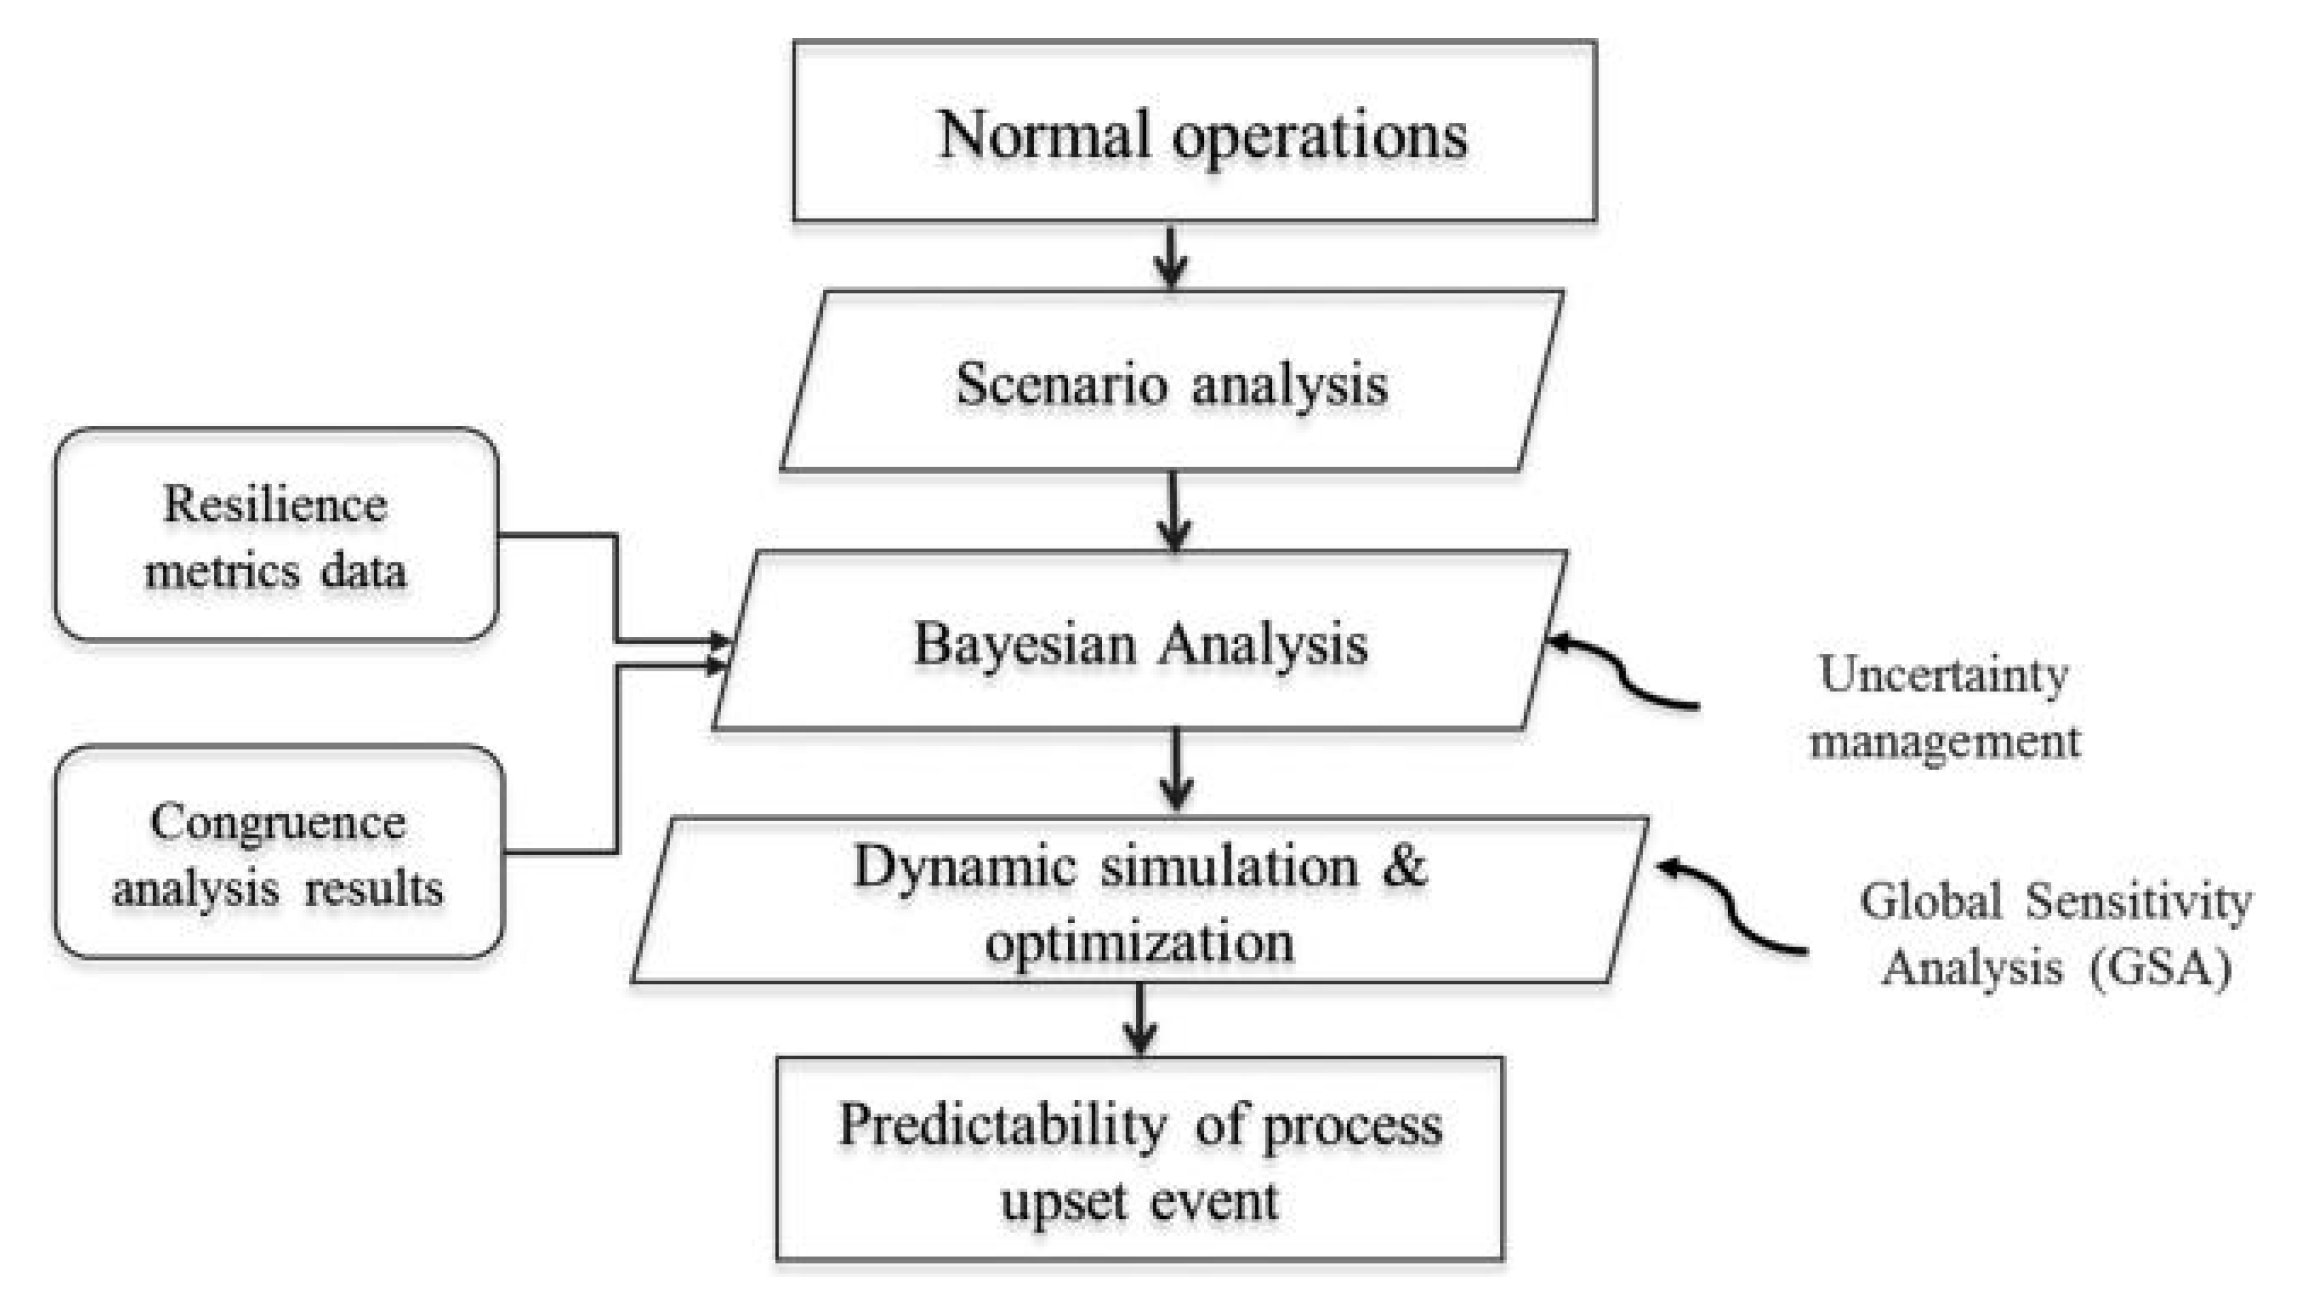
5.1. Batch Process Upset Event

Jain et al. [26,27] proposed a way that established an accurate and integrated method to predict process upset situations by applying the resilience approach. This way enables a rather comprehensive upset risk probability determination as a function of process conditions taking account of historical data, actual organizational effectiveness related indicators (social metrics) and equipment failures, including uncertainty ranges in the various inputs. This can serve to optimize profitability under the constraint of safe process operations by avoiding hazardous zones. In simple form, Figure 7 depicts the analysis scheme followed. Scenario analysis and Bayesian analysis are performed in [26], while [27] can be referred to for a detailed process simulation providing insight in the process dynamics, and a global sensitivity analysis of inputs versus outputs, done before the Bayesian uncertainty analysis (as in [26]), and thereafter investigation of flexibility within acceptable bounds and economic optimization. The authors of [27] described the overall prediction assessment methodology schematically in their Figure 5.
The example process system concerns the poly-vinyl chloride (PVC) production batch process, which due to reaction heat, can potentially produce a thermal run-away with pressure build-up, and because of quantity involved, disastrous consequences. Monomer vinyl chloride is flammable and toxic and an escape of hot vapors will produce explosion and fire; several past accidents are known [51]. Temperature control in the progressing polymerization of the liquid reactor content with increasing viscosity is of utmost importance. This study focuses on the early detection of warning signals phase of resilience. It is less dependent on general databases of failure rates and overcomes missed HAZOP scenarios.
The analysis claims to predict the occurrence of run-away process upset. Hence, the method is one of fault detection and diagnosis. Based on experience and process simulation, scenario analysis comprises an inventory of the various events that will trigger an upset state. Run-away can have several causes, such as failure of agitator or cooling medium pump, wrong feed materials dosage, or other human failure in operations or maintenance.
Weighted resilience metrics collected, such as on maintenance weakness, make an essential contribution both with respect to plant performance and to social factors. The latter need to be quantified using socially oriented metrics in [26] through congruence analysis according to [52]. This kind of analysis enables taking into account interdependencies between worker tasks or activities, e.g., a worker must communicate a change in process state to another one to advance the process. It occurs by multiplying a matrix of which worker has which task by one of which task depends on which other task, resulting in a matrix of the extent a worker’s task/activity depends on other ones. If coordination is needed, the latter matrix must be multiplied by the peoples’ transpose to find out to what extent one person’s task must be coordinated with one of another individual.
Next is the Bayesian analysis applying the Bayes Theorem, which consists of formulating a prior distribution, multiplying with a likelihood of current observations, dividing by the total probability, and so yielding a posterior distribution. Historical cooling media data provide a mean of cooling medium temperatures, μ . To this is added the sum of the weighted resilience metrics ν ( X ) with a random effect α , assumed to be normally distributed with zero mean, and an additional randomness due to unknown sources, also normally distributed. Together, this can be considered as a mean and variance of the temperature fluctuations. Prior to this, the mean is modeled as normal distribution with hyper parameters μ 0 and σ 0 2 , and the prior variance as an uninformative gamma distribution. Data for the likelihood are one year of hourly observations. The procedure of Gibbs sampling and Markov chain Monte Carlo (MCMC) algorithm using R software was produced in a two-cycle computation as posterior a temperature distribution (An alternative is applying OPENBugs software: http://openbugs.net/w/FrontPage).
For the stirring failure analysis, the electric feed current signal is used I 1 modeled as a gamma distribution and joint with relevant unplanned maintenance metrics I 2 , a number conditioned on I 1 and Poisson distributed. Distinction is made between a joint distribution function when agitating fails f 1 ( I 1 , I 2 ) and when working normally f 2 ( I 1 , I 2 ) . The two are summarized to an overall joint distribution by multiplying the failing one with a failure probability p and the normal one with p ’s complement. In case of f 1 , the parameters of the conjugate gamma and Poisson distributions are different from those of f 2 , while the gamma one contains ν ( X ) yielding a scale shift due to the metrics level. Given data, p is to be determined and modeled as a beta prior distribution. The Bernstein-Von Mises Theorem [53] does not require the prior parameters to be very precise as for a large sample the posterior tends to become normally distributed of which the mean approximates that of the likelihood. The likelihood probability distribution follows from plant observation data. To facilitate the further computation, a latent binary variable Z enabling a Bernoulli likelihood, with Z = 0 in case, the process functions normally, and Z = 1 in case of failure, so that I 1 , I 2 | Z = 0 f 1 and   I 1 , I 2 | Z = 1 f 2 . Deriving the joint posterior distribution P ( p , Z | I 1 , I 2 ) follows in two steps by means of Gibbs sampling the equations, applying MCMC algorithm as mentioned before. Simulation and solving for the probability of process upset due to mischarging is broadly following the same procedure, albeit with different parameters.
In the follow-on study [27], the first step was again scenario analysis. This is followed by process simulation based on conservation equations and chemistry. Process simulation can be performed using different simulation platforms; in this study, the author used gPROMS [27]. The purpose of process simulation is to understand the dynamics, i.e., the variability of process output with the change in input parameters. The third step is a global sensitivity analysis (GSA). This calculates given inputs and their uncertainties, the output, and its uncertainty range. The analysis is global because all inputs are varied simultaneously over their full range. This was followed by an uncertainty analysis considering the cooling medium temperature and the stirring failure as parameters. The study was finalized with a flexibility analysis and economic optimization.

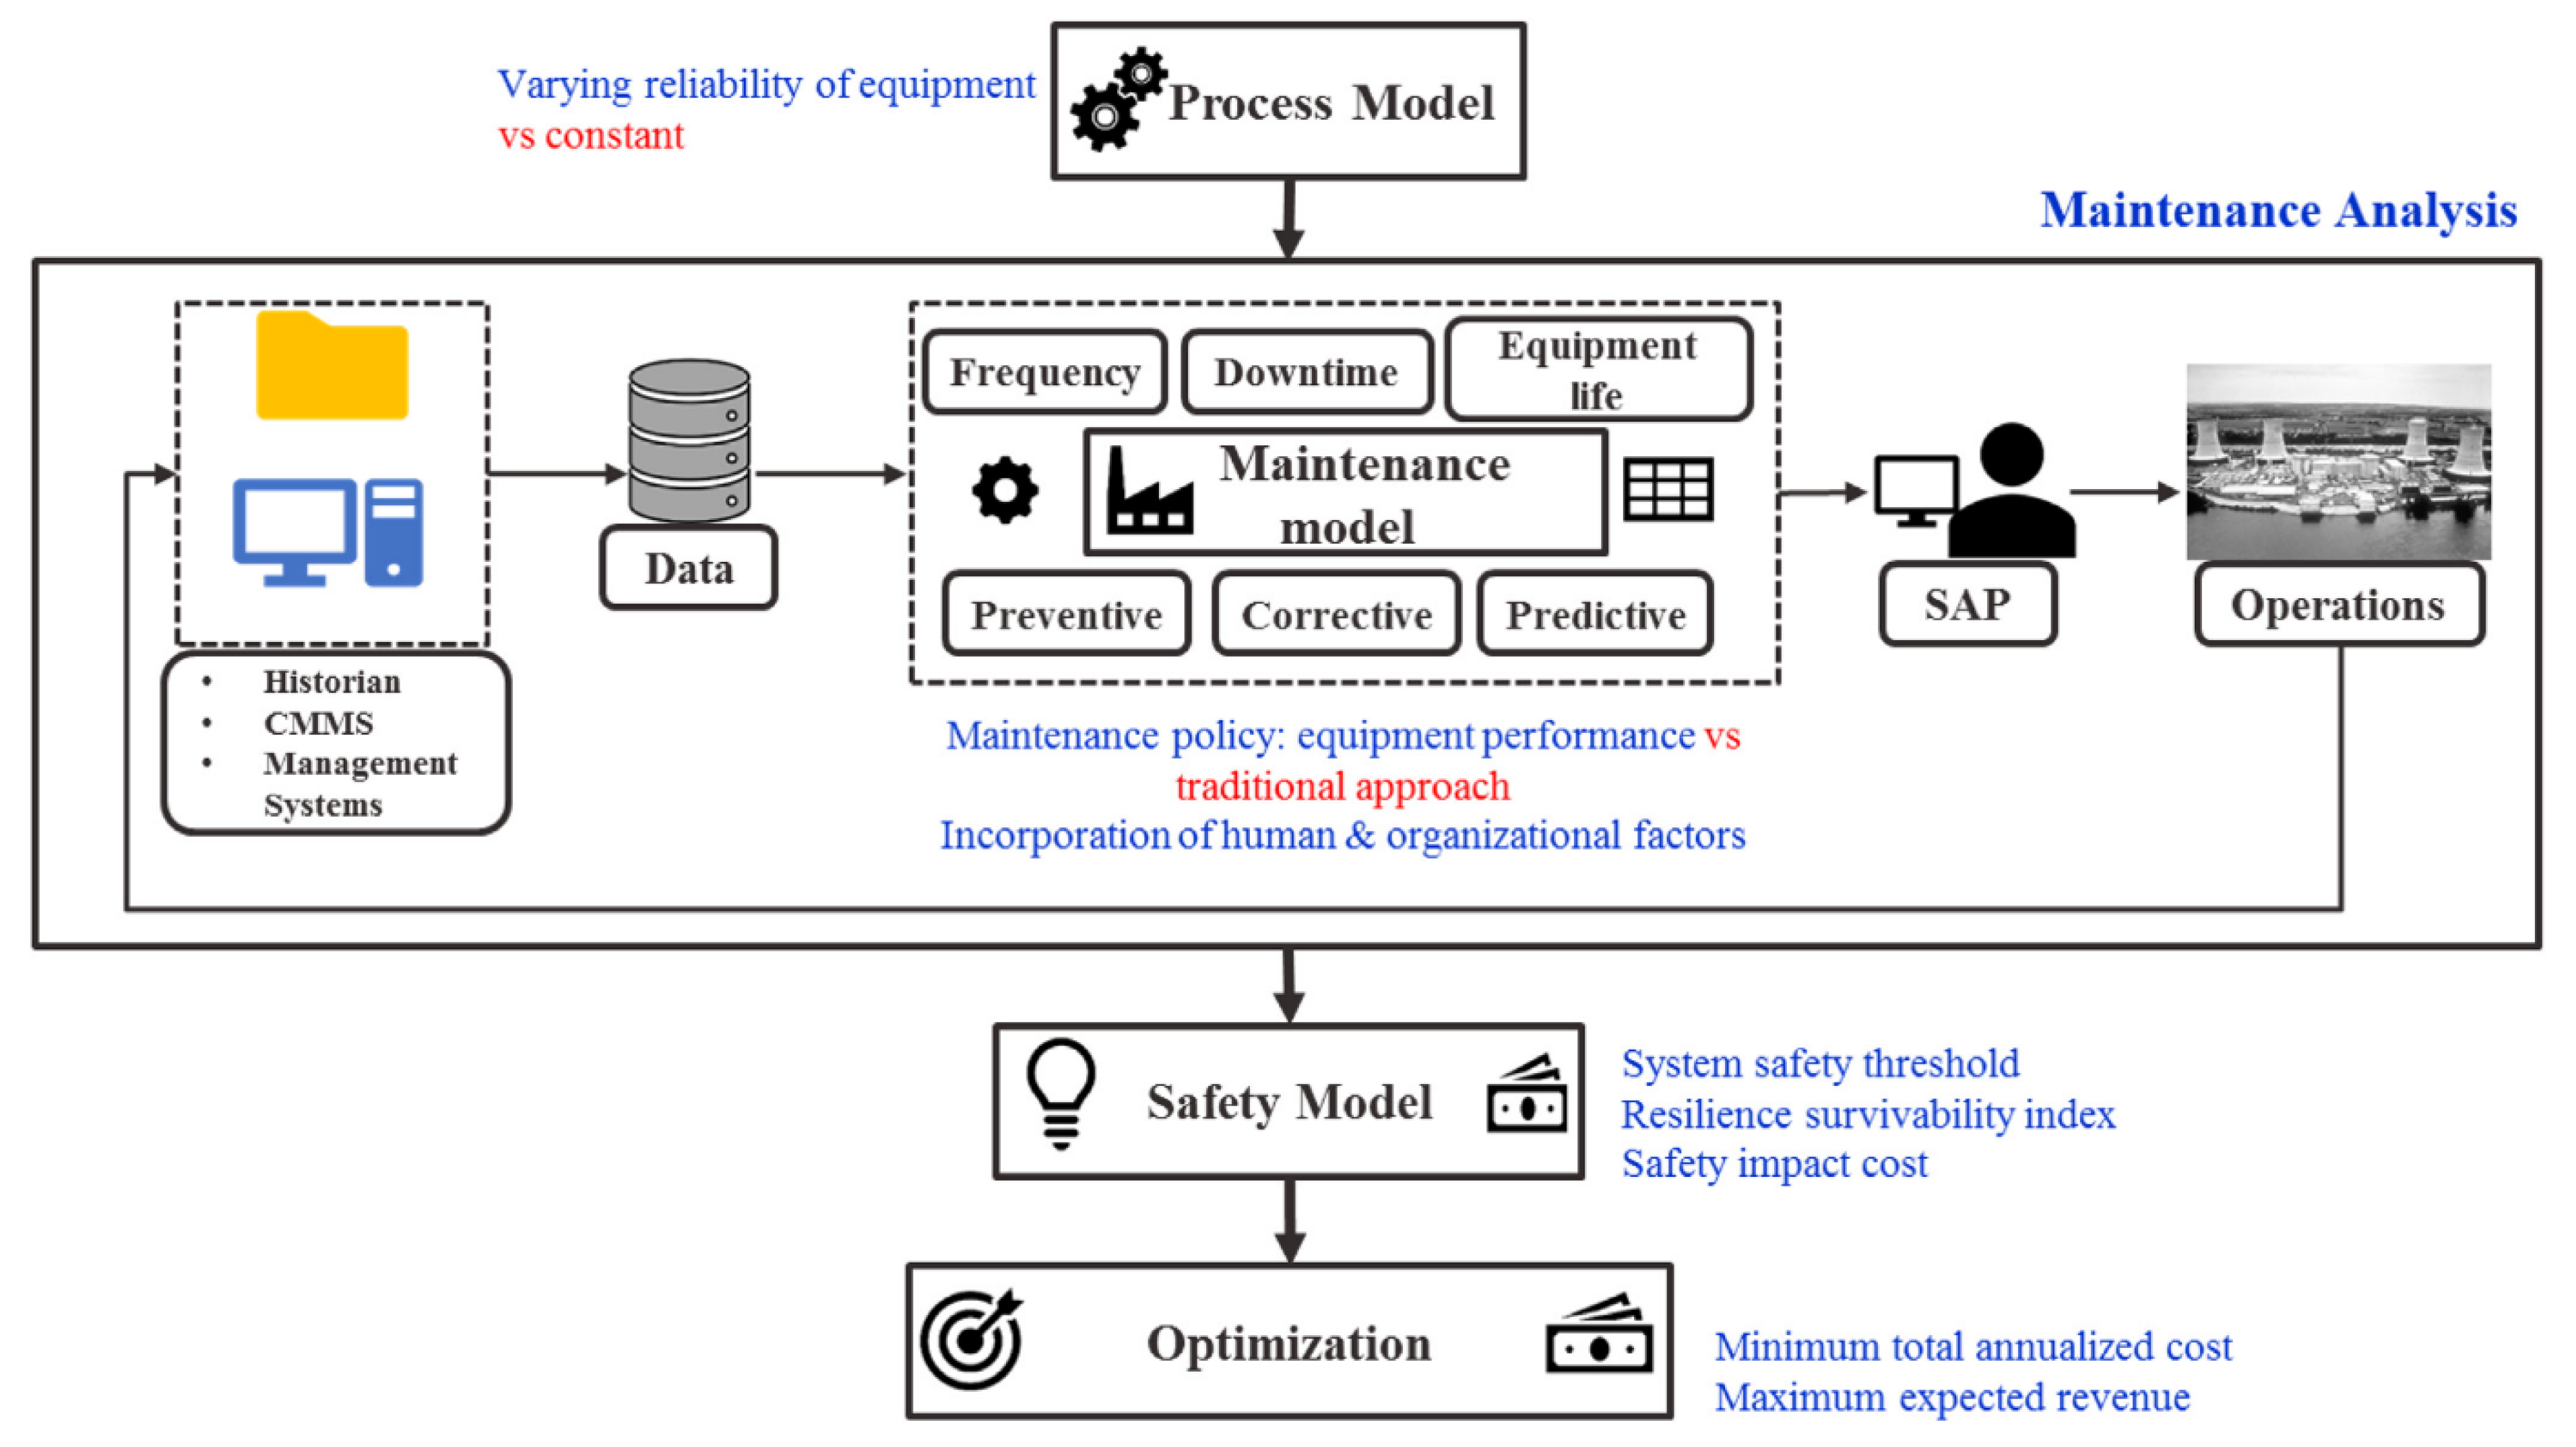
5.2. Data Driven Maintenance Optimization

This study by Jain et al. [28] concerns maintenance of a cooling tower servicing a number of units, e.g., a batch reactor and a distillation column heat exchanger. Maintenance policy can be corrective, preventive, or predictive. Three questions were addressed in this study. The first is about the influence of social factors on the maintenance policy effectiveness with respect to, e.g., spare parts management, training, and procedures. The second is on how cost of safety affect profitability and sustainability, and the third question on how reliability and maintenance policy are influenced when based on defined safety thresholds system effectiveness becomes highest priority. This study focuses on the survivability phase of resilience.
The overall analysis of survivability with the objective to prevent escalation, given maintenance options and final optimization, follows the scheme shown in Figure 8 [28].
The process model is built on conservation balance equations with data produced by simulation. Given all needed data, a vector of process variables, one on effectiveness depending on equipment reliability and degrees of freedom, total annualized cost (TAC) is minimized and at the same time expected process revenue (EPR) is maximized for each operable system state under equality and inequality constraints using GAMS software (general algebraic modeling language; www.gams.com).
The maintenance model contains the variables action frequency, down-time, and variability of equipment life, which in part are composed of weighted resilience metrics. Frequency depends on failure rate but in a mixture takes model vibration means, voltage mean, weighted number of unplanned maintenance jobs, and percentage of maintenance backlogs as covariates. Down-time is composed of weighted percentage safety critical inspections according to management directive, the same for scheduled maintenance procedures and for required training sessions. Equipment life variability was based on data augmented with those of a vulnerable component, in the example pump impeller speed. The three above mentioned variables for a pump were derived from the historical data applying trace and auto-correlation plots. Coefficients of the mixture models were determined applying Standard Bayesian linear regression assuming for the coefficient as prior a normal distribution N ( β 0 ,   σ 2 ) , which corresponds to a conjugate likelihood function. After splitting the joint prior, assuming mean and variance are independent, the variance prior can be written as an inverse gamma distribution. The posterior was then derived by MCMC using R software, while the Heidelberg–Welch diagnostic was used for testing convergence to stationarity.
The safety model depends on the scenario. Four loss scenarios were defined when cooling a batch reactor and in case of reflux heat, exchanging of a distillation column, both at two consequence levels. Next, a system survivability index (SSI) defined as the ratio of the actual system effectiveness following the process model and optimization, while the required one is determined by the thresholds of the safety scenarios. Further, the resilience survivability index (RSI) is defined as the product of SSI and the ratio of the expected revenue (ER) and the maximum one. ER is determined by the probabilities weighted sum of the EPRs at the various process states. RSI measures the system capability to avoid upset states.
The cost/revenue model minimizes TAC and maximizes ER. Cost includes the following components: Capital, operating, maintenance, energy, and safety impact. This second optimization stage including the safety threshold is further worked out forthrightly.

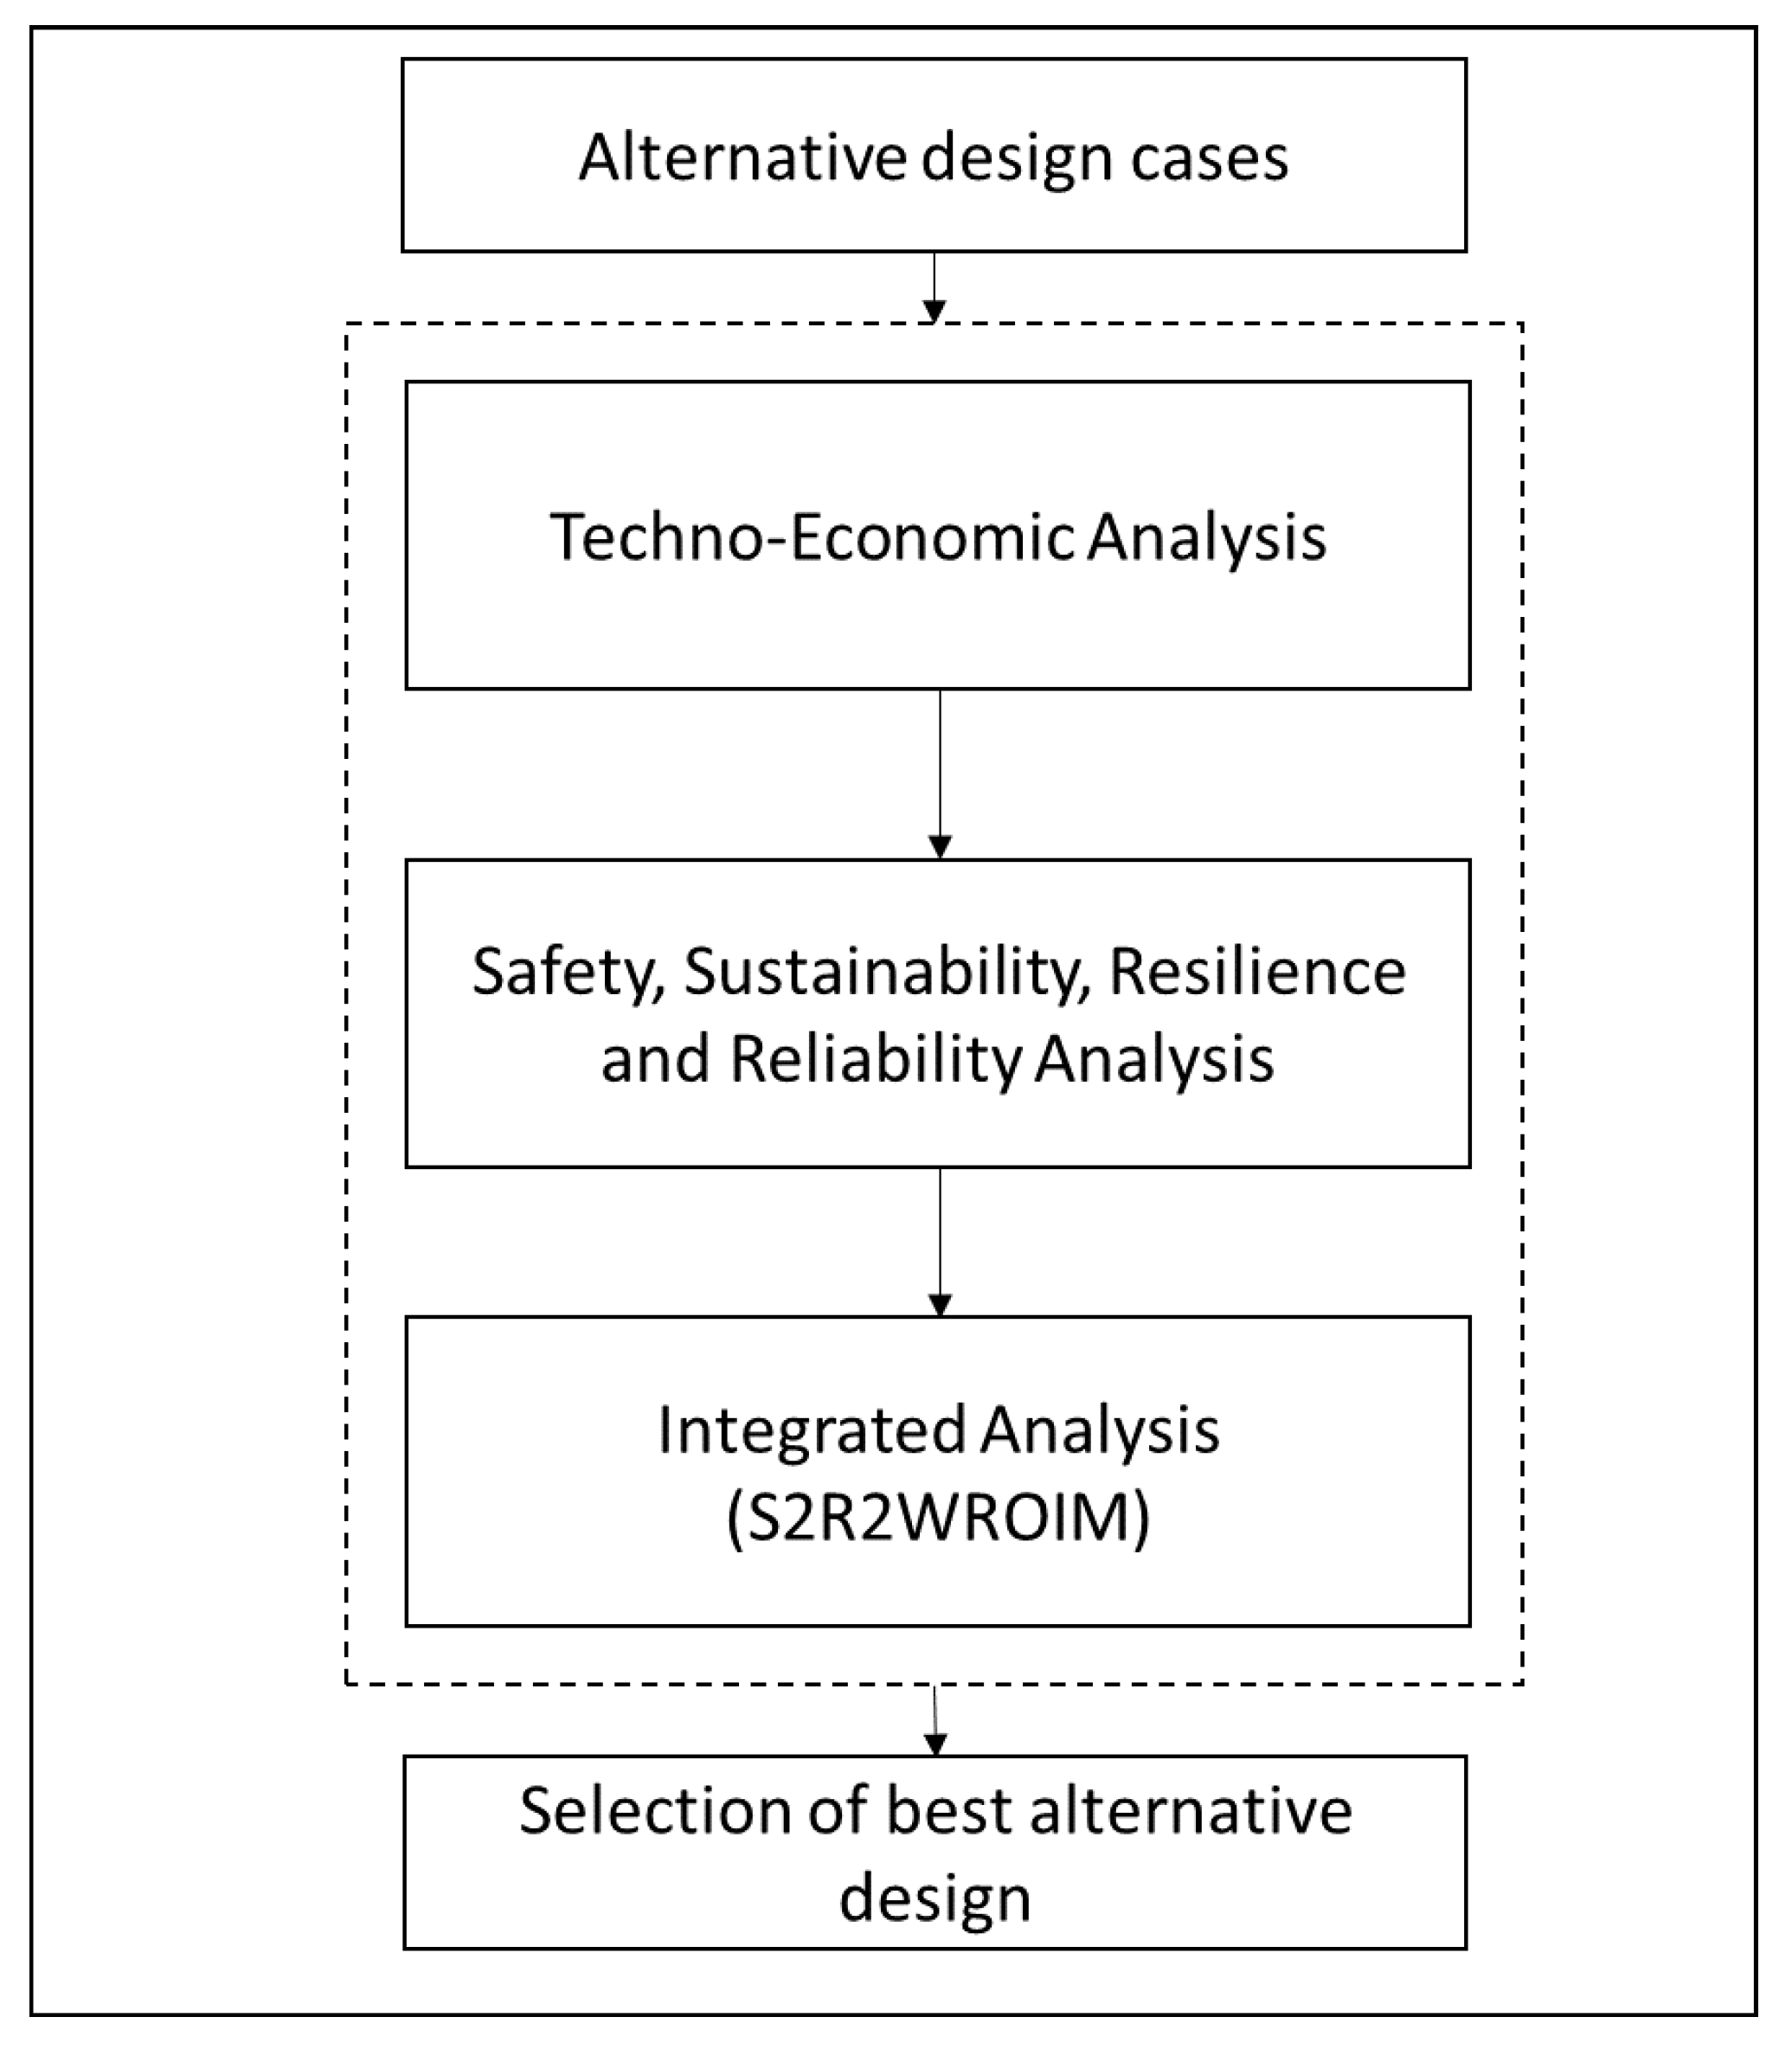
5.3. Resilience Integrated with Safety, Reliability, and Sustainability

Jain et al. [29] modified the existing SASWROIM (Safety and Sustainability Weighted Return On Investment Metric, see Table 1) to include reliability and resilience analysis during process design and technology selection phase. This has been the first attempt to incorporate reliability and resilience in the conceptual design stage, the proposed methodology is depicted in Figure 9. The mathematical model proposed by [29] can evaluate S2R2WROIM for a design alternative by comparing the indicators with the base case and targeted values set by the governing organization. Table 1 lists out all the step-by-step modifications in ROI metric over the time.
Authors presented a hydrogen compressor system in a hydro-cracking plant as an example to demonstrate the applicability of this proposed methodology. A base case process flow scheme of the compressor section is compared with alternative design cases through integrated analysis, which includes resilience, reliability, sustainability, and safety aspects.
This comparison needs to perform techno-economic analysis, which involves process synthesis, simulation, and economic analysis using commercially available software. Authors used Aspen HYSYS to run the steady state simulations for the base case and all the alternative design cases, followed by economic analysis using Aspen Economic Analyzer tool. Among all indicators to evaluate S2R2WROIM, resilience and reliability indicators for any process system need either knowledge of established properties of similar systems or historical operational data. The resilience metrics developed by [25] are applied as resilience indicators based on actual project type. MTTF (mean time to failure) is used as the reliability indicator for all cases. For safety analysis, FEDI (fire and explosion index) is considered as an indicator. While for the sustainability analysis, energy-dependent factors are considered.

5.4. Business Continuity and Sustainability

Jain et al. [30] focus on fundamentals and the set-up of the resilience approach being more business continuity and sustainability oriented. Its application is explained in the case of the August 2012 Chevron refinery fire in Richmond, California. According to the CSB report [57], the fire was due to a catastrophic pipe rupture in the crude unit as a result of sulfidation corrosion. Flammable, high-temperature light gas oil was released that ignited spontaneously. Six employees suffered light injuries, but the community impact was significant because 15,000 local residents were seeking medical attention due to smoke inhalation, the Bay Area Rapid Transit (BART) metro was shut down, and financial loss was around 1 million USD (including citations, statutory fines, and medical reimbursements) [57].
Business Continuity is defined according to ISO 22301 [58,59] and ISO 22313 [60] as ‘the capability of the organization to continue delivery of products or services at acceptable predefined levels following a disruptive incident’. Following the literature, e.g., BS25999, [61] metrics for business continuity can be inferred as:
  • Business resumption response time: This is the time required by an organization to continue with their business after an incident or failure scenario;
  • Recovery time: This is the time required by an organization to restore to its original state after an incident or failure scenario;
  • Recovery point objective (RPO): This is the acceptable limit for maximum data loss that an organization can withstand during an upset event;
  • Return time objective (RTO): This is the target time for the resumption of product, service, or activity after an incident;
  • Maximum tolerable period of disruption (MTPoD): This is the threshold period after which an organization’s operational capability will be irreversibly threatened because of the adverse impacts that would arise as a result of not providing a product, service, or perform an activity.
The 1987 definition of a sustainable process system inspired by the one of the United Nations Commission on Environment and Development, the Brundtland Commission, is: ‘a process system that generated value to meet the needs of the present without compromising the ability of future generations to meet their own needs’ [62]. This is achieved by maintaining and continuously improving the environmental, safety, and social performance of the system.
Sikdar [63] defined sustainability metrics on the dimensions of environment, economy, and social acceptability relevant to process systems, regarding eco-efficiency, socio-economic impact, and socio-environmental effects, which are all combinations of various factors.
For business continuity, the metrics business resumption response time and recovery time were estimated based on available information by Avalos [64] and CSB [65].
Sustainability metrics were based on key performance indicators extracted from Chevron sustainability reports [66,67].
Based on information of CSB [57], metrics for Process Resilience were determined for the three phases avoidance, survival, and recovery as resilience performance index (RPI) values. This index is defined as the ratio of the actual resilience metric score and the expected one in a satisfactory state, where the actual metric score is the ratio of the weighted actual performance score and the weighted maximum actual one, while the expected metric is the ratio of the resilience score (full) times a weight and the maximum weighted resilience score (full). The weights can be found in [25]. If the state of affairs would be normally satisfactory, RPI would be 1, while below 0.5, performance would be qualified as poor. It turned out that the RPI scores before the accident were all significantly lower than 0.5; the lowest RPI being the social metrics related to safety and maintenance, whereas the highest was linked to emergency response drills. Finally, based on the data, graphs were plotted of annual revenue and profit of Chevron in the years before the accident, showing a decline, as well as graphs of trendlines of business continuity and sustainability as a function of resilience.

6. What Shall Be Done Further?

The largest problem is validation and lack of experience in implementing the approach in real, industrial cases. Although interest in resilience has been growing as an insurance for unfortunate catastrophes, at the top management of companies, interest in process safety and risk assessment often leaves much to be desired, although, e.g., the large oil and chemical companies, such as Exxon, Shell, BP and Chevron, having had hard lessons in the past give it ample attention. So far, in our work, cases have only been worked out on plant internal threats, while we focused on just one of the three phases. Avoidance and recovery deserve further work, too. In addition, along with sudden appearing external threats, attention is needed to evaluate another internal threat in terms of process resilience: The impact on operations of fluctuating product demand, and stressed assets.
Many manufacturing units have stressed assets due to competing markets and low margin. Application of optimization techniques, model predictive control, and dynamic simulation is apparent to suggest changes in the process operating conditions to get the desired output in terms of quality and quantity. The cases discussed by authors referred to in the present paper gave a better understanding of the applicability of proposed algorithms and frameworks. However, the hazards associated with process and failure of management system are likely to change with change in operating strategy. Also, process integration and optimization at any stage makes a big difference to gain a competitive advantage over the life cycle. Thought must be given to predict the abnormal events due to these changes. These abnormal events can affect a specific unit operation or the entire process unit depending on how the process is integrated and optimized. Thus, the proposed methodology of resilience assessment can be further expanded to incorporate sudden appearing threats by rapid process condition modifications, applying models of process optimization, model predictive control and dynamic simulation either in design or operations phase.
The social-technical system approach is fundamental in resilience building. In addition to the interaction of social and technical factors considered in the quantitative cases here, further aspects shall be studied, e.g., that of control room operators and their control of process dynamics.
It all implies that progress can be made if there is an open relation among companies interested in performing research in resilience and academia, where industry provides cases and data and the scientists provide theory, models, and computation. This will help in building sustainability.

7. Conclusions

For potentially high-impact chemical and other processes, risk assessment is crucial to enable a decision on how safe is safe enough. However, risk assessment is afflicted by many shortcomings [68]. Therefore, a “safety net” is needed to cope with unexpected and even unknown threats that can disrupt a process and give rise to major accident, which results in severe hazard to people, assets, and environment, and hence detracts sustainability. Such a safety net is provided by the concept of resilience.
Resilience building is an ‘umbrella’ methodology embracing, based on a socio-technical system approach, human and social factors, optimum risk control, and equipment reliability. So, it enables seeking economic optimum given safety constraints and uncertainties at the best risk management, but at the same time it takes account of and prepares for unexpected operations disrupting threats to occur. This is reflected in the four elements resilience builds on: Error-tolerant design, early warning signal alertness, ‘plasticity’ of mind, and effective means of recovery from damage. Risk management will draw on many sources of information including expert judgment [69], while optimizing to achieve a certain target will also require decision making [70] on what alternatives fit best, while dealing with conflicting weighted criteria such as performance, budget, and cost similar to [71]. Methods for this are available and are not subject of this paper.
A summary is made of the resilience work performed in two Ph.D. studies at the Mary Kay O’Connor Process Safety Center. Significant development can be seen in the development of methodologies and frameworks for process resilience application in process industry. To determine the level of resilience, the three phases during the occurrence of a threat, attack. or a developing mishap, namely avoidance, survival, and recovery, PRAF (process resilience analysis framework) was developed. The development of algorithms for resilience indices with PRAF for resilience capability should be determined quantitatively.
The PRAF idea was worked out in RIPSHA (resilience-based integrated process systems hazard analysis) that distinguished two parts: A plant and a management layer. Before RIPSHA could be further developed, it was necessary to define a number of resilience indicator metrics, an exercise, which was conducted by a survey with inputs by experts from industry, government, and academics. In the next two papers, the plant layer (RIPSHA I) and management (RIPSHA II) were elaborated. On monitoring resilience over time, only an indication could be given of how to accomplish this.
Cases of applying PRAF concept in two phases of avoidance and survival have been demonstrated regarding early detection and diagnosis of a batch process, batch process upset prediction, and further maintenance optimization of a cooling tower. It has also been shown how resilience can be integrated into a design together with safety, reliability, and sustainability. Finally, an accident case has been analyzed on business continuity and sustainability loss aspects.
Because process facility risk assessments are indispensable but its results uncertain and incomplete, also in view of environmental considerations, business continuity, and sustainability, it is to be expected that additional resilience analysis will gain further interest. Yet, the cases analyzed do not cover the whole gamma of resilience capability aspects, certainly not with respect to design and recovery and process dynamical adaptation to changing market requirements. Hence, there will be quite a few future challenges to gain more experience and validation by considering other practical cases and, where needed, further development of the methodology. Much more work shall be done before we can speak of a mature concept.

Author Contributions

P.J.—conceptualization of process resilience analysis framework (PRAF) and its application as summarized in this manuscript, review and editing, co-supervision; K.K.—writing, and future plan; H.P.—conceptualization, writing original draft, and supervision. All authors have read and agreed to the published version of the manuscript.

Funding

This research received funding by the Texas A&M Engineering Experiment Station (TEES) Mary Kay O’Connor Process Safety Center, Texas A&M University System.

Acknowledgments

We acknowledge the continuous encouragement and support of late M. Sam Mannan.

Conflicts of Interest

The authors declare no conflicts of interest.

References

  1. Fleming, J.; Ledogar, R.J. Resilience, an Evolving Concept: A Review of Literature Relevant to Aboriginal Research. Pimatisiwin 2008, 6, 7–23. Available online: http://www.pimatisiwin.com/online/?page_id=221 (accessed on 28 July 2020).
  2. Höfler, M. Psychological Resilience Building in Disaster Risk Reduction: Contributions from Adult Education. Int. J. Disaster Risk Sci. 2014, 5, 33–40. [Google Scholar]
  3. Weick, K.E.; Sutcliffe, K.M. Managing the Unexpected, Resilient Performance in an Age of Uncertainty, 2nd ed.; Jossey-Bass: San Francisco, CA, USA, 2007; ISBN 978-0-7879-9649-9. [Google Scholar]
  4. Hollnagel, E.; Woods, D.D.; Leveson, N. (Eds.) Resilience Engineering, Concepts and Precepts; Ashgate Publisher Ltd.: Aldershot, UK, 2006; ISBN 0-7546-4641-6. [Google Scholar]
  5. Haavik, T.K.; Antonsen, S.; Rosness, R.; Hale, A. HRO and RE: A pragmatic perspective. Saf. Sci. 2019, 117, 479–489. [Google Scholar] [CrossRef] [Green Version]
  6. Pasman, H.J.; Kirillov, I.A. (Eds.) Resilience of Cities against Terrorist and Other Threats: Learning from 9/11 and further Research Issues; NATO Workshop; Springer: Dordrecht, NL, USA, 2008; ISBN 978-1-4020-8488-1. [Google Scholar]
  7. UN, Disaster Risk and Resilience, UN System Task Team on the Post-2015 Development Agenda, 2012. Available online: https://www.un.org/millenniumgoals/pdf/Think%20Pieces/3_disaster_risk_resilience.pdf (accessed on 28 July 2020).
  8. Griffiths University. Business Continuity Management and Resilience Framework, 2018. Available online: http://policies.griffith.edu.au/pdf/BusinessContinuityManagementandResilienceFramework.pdf (accessed on 28 July 2020).
  9. Bergström, J.; Van Winsen, R.; Henriqson, E. On the rationale of resilience in the domain of safety: A Literature Review. Reliab. Eng. Syst. Saf. 2015, 141, 131–141. [Google Scholar] [CrossRef] [Green Version]
  10. Hosseini, S.; Barker, K.; Ramirez-Marquez, J.E. A review of definitions and measures of system resilience. Reliab. Eng. Syst. Saf. 2016, 145, 47–61. [Google Scholar] [CrossRef]
  11. Curt, C.; Tacnet, J.M. Resilience of Critical Infrastructures: Review and Analysis of Current Approaches. Risk Anal. 2018, 38, 2441–2458. [Google Scholar] [CrossRef]
  12. Patriarca, R.; Bergström, J.; Di Gravio, G.; Costantino, F. Resilience engineering: Current status of the research and future challenges. Saf. Sci. 2018, 102, 79–100. [Google Scholar] [CrossRef]
  13. Suokas, J.; Rouhiainen, V. Quality control in safety and risk analyses. J. Loss Prev. Process Ind. 1989, 2, 67–77. [Google Scholar] [CrossRef]
  14. Lauridsen, K.; Kozine, I.; Markert, F.; Amendola, A.; Christou, M.; Fiori, M. Assessment of Uncertainties in Risk Analysis of Chemical Establishments; The ASSURANCE Project. Final Summary Report; Risø National Laboratory: Roskilde, Denmark, 2002; Available online: https://backend.orbit.dtu.dk/ws/files/7712279/ris_r_1344.pdf (accessed on 28 July 2020).
  15. Baybutt, P. A critique of the Hazard and Operability (HAZOP) study. J. Loss Prev. Process Ind. 2016, 33, 52–58. [Google Scholar] [CrossRef]
  16. Jarvis, R.; Goddard, A. An Analysis of Common Causes of Major Losses in the Onshore Oil, Gas and Petrochemical Industries: Implications for Insurance Risk Engineering Surveys; Version 1.0; Lloyd’s Market Association: London, UK, September 2016; (Search Web on the Title of the Report). [Google Scholar]
  17. Taylor, J.R. Can Process Plant QRA Reduce Risk?—Experience of ALARP from 92 QRA Studies over 36 Years. Chem. Eng. Trans. 2016, 48, 811–816. [Google Scholar]
  18. Casal, A.; Olsen, H. Operational Risks in QRAs. Chem. Eng. Trans. 2016, 48, 589–594. [Google Scholar]
  19. Dinh, L.T.T. Safety-oriented Resilience Evaluation in Chemical Processes. Ph.D. Thesis, Texas A&M University, College Station, TX, USA, 2011. [Google Scholar]
  20. Dinh, L.; Pasman, H.; Gao, X.; Mannan, M.S. Resilience engineering of industrial processes: Principles and contributing factors. J. Loss Prev. Process Ind. 2012, 25, 233–241. [Google Scholar] [CrossRef]
  21. Jain, P.; Pasman, H.J.; Waldram, S.P.; Rogers, W.J.; Mannan, M.S. Did we learn about risk control since Seveso? Yes, we surely did, but is it enough? An historical brief and problem analysis. J. Loss Prev. Process Ind. 2017, 49, 5–17. [Google Scholar] [CrossRef]
  22. Jain, P.; Pasman, H.J.; Waldram, S.; Pistikopoulos, E.; Mannan, M.S. Process Resilience Analysis Framework (PRAF): A systems approach for improved risk and safety management. J. Loss Prev. Process Ind. 2018, 5, 61–73. [Google Scholar] [CrossRef]
  23. Jain, P.; Rogers, W.J.; Pasman, H.J.; Mannan, M.S. A resilience-based integrated process systems hazard analysis (RIPSHA) approach: Part I Plant system layer. Process Saf. Environ. Prot. 2018, 116, 92–105. [Google Scholar] [CrossRef]
  24. Jain, P.; Rogers, W.J.; Pasman, H.J.; Mannan, M.S. A resilience-based integrated process systems hazard analysis (RIPSHA) approach: Part II management system layer. Process Saf. Environ. Prot. 2018, 118, 115–124. [Google Scholar] [CrossRef]
  25. Jain, P.; Mentzer, R.; Mannan, M.S. Resilience metrics for improved process-risk decision making: Survey, analysis and application. Saf. Sci. 2018, 108, 13–28. [Google Scholar] [CrossRef]
  26. Jain, P.; Chakraborty, A.; Pistikopoulos, E.N.; Mannan, M.S. Resilience-Based Process Upset Event Prediction Analysis for Uncertainty Management Using Bayesian Deep Learning: Application to a Polyvinyl Chloride Process System. Ind. Eng. Chem. Res. 2018, 57, 14822–14836. [Google Scholar] [CrossRef]
  27. Jain, P.; Diangelakis, N.A.; Pistikopoulos, E.N.; Mannan, M.S. Process resilience based upset events prediction analysis: Application to a batch reactor. J. Loss Prev. Process Ind. 2019, 62, 103957. [Google Scholar] [CrossRef]
  28. Jain, P.; Pistikopoulos, E.N.; Mannan, M.S. Process resilience analysis based data-driven maintenance optimization: Application to cooling tower operations. Comput. Chem. Eng. 2019, 121, 27–45. [Google Scholar] [CrossRef]
  29. Moreno-Sader, K.; Jain, P.; Tenorio, L.C.B.; Mannan, M.S.; El-Halwagi, M.M. Integrated Approach of Safety, Sustainability, Reliability, and Resilience Analysis via a Return on Investment Metric. ACS Sustain. Chem. Eng. 2019, 7, 19522–19536. [Google Scholar] [CrossRef]
  30. Jain, P.; Pasman, H.J.; Mannan, M.S. Process System Resilience: From Risk Management to Business Continuity and Sustainability. Int. J. Bus. Contin. Risk Manag. 2020, 10, 47–66. [Google Scholar] [CrossRef]
  31. Rasmussen, J. Risk management in a dynamic society: A modelling problem. Saf. Sci. 1997, 27, 183–213. [Google Scholar] [CrossRef]
  32. Trist, E.L.; Bamforth, K.W. Some Social and Psychological Consequences of the Longwall Method of Goal-getting. Hum. Relat. 1951, 4, 3–38. [Google Scholar] [CrossRef]
  33. Leveson, N. A new accident model for engineering safer systems. Saf. Sci. 2004, 42, 237–270. [Google Scholar] [CrossRef] [Green Version]
  34. Leveson, N.G. Engineering a Safer World, Systems Thinking Applied to Safety; The MIT Press: Cambridge, MA, USA, 2011; ISBN-10:0e262-01662-1, ISBN-13:978-0-262-01662-9. [Google Scholar]
  35. Taylor, J.R. Statistics of design error in the process industries. Saf. Sci. 2007, 45, 61–73. [Google Scholar] [CrossRef]
  36. Kidam, K.; Sahak, H.A.; Hassim, M.H.; Hashim, H.; Hurme, M. Method for identifying errors in chemical process development and design base on accidents knowledge. Process Saf. Environ. Prot. 2015, 97, 49–60. [Google Scholar] [CrossRef]
  37. Alauddin, M.; Khan, F.; Imtiaz, S.; Ahmed, S. A Bibliometric Review and Analysis of Data-Driven Fault Detection and Diagnosis Methods for Process Systems. Ind. Eng. Chem. Res. 2018, 57, 10719–10735. [Google Scholar] [CrossRef]
  38. CCPS, Center for Chemical Process Safety AIChE. Guidelines for Process Safety Metrics; Wiley: Hoboken, NJ, USA, 2010; ISBN 978-0-470-57212-2. [Google Scholar]
  39. Boring, R.L. 50 Years of THERP and Human Reliability Analysis, PSAM 11, 2012, INL/CON-12-25623 Preprint. Available online: https://inldigitallibrary.inl.gov/sites/sti/sti/5680968.pdf (accessed on 28 July 2020).
  40. Moura, R.; Beer, M.; Patelli, E.; Lewis, J.; Knoll, F. Learning from accidents: Interactions between human factors, technology and organisations as a central element to validate risk studies. Saf. Sci. 2017, 99, 196–214. [Google Scholar] [CrossRef] [Green Version]
  41. Williams, J.C. A data-based method for assessing and reducing human error to improve operational performance. In Proceedings of the IEEE Fourth Conference on Human Factors and Power Plants, Monterey, CA, USA, 5–9 June 1988; IEEE: New York, NY, USA, 1988; pp. 436–450. [Google Scholar] [CrossRef]
  42. Williams, J.C. Toward an improved evaluation analysis tool for users of HEART. In Proceedings of the International Conference on Hazard Identification and Risk Analysis, Human Factors and Human Reliability in Process Safety, AIChE/CCPS, Orlando, FL, USA, 15–17 January 1992. [Google Scholar]
  43. Taylor, J.R. Human Error in Process Plant Design and Operations: A Practitioner’s Guide; CRC Press: Boca Raton, FL, USA, 2015; ISBN 978-1-4987-3886-6. [Google Scholar]
  44. Peres, S.C.; Quddus, N.; Kannan, P.; Ahmed, L.; Ritchey, P.; Johnson, W.; Rahmani, S.; Mannan, M.S. Summary and synthesis of procedural regulations and standards - Informing a procedures writer’s guide. J. Loss Prev. Process Ind. 2016, 44, 726–734. [Google Scholar] [CrossRef]
  45. Mehta, R.K.; Peres, S.C.; Shortz, A.E.; Hoyle, W.; Lee, M.; Saini, G.; Chan, H.C.; Pryor, M.W. Operator situation awareness and physiological states during offshore well control scenarios. J. Loss Prev. Process Ind. 2018, 55, 332–337. [Google Scholar] [CrossRef]
  46. Guldenmund, F.W. The use of questionnaires in safety culture research–an evaluation. Saf. Sci. 2007, 45, 723–743. [Google Scholar] [CrossRef]
  47. O’Connor, P.; Buttrey, S.E.; O’Dea, A.; Kennedy, Q. Identifying and addressing the limitations of safety climate surveys. J. Saf. Res. 2011, 42, 259–265. [Google Scholar] [CrossRef] [PubMed] [Green Version]
  48. Zohar, D.M.; Hofmann, D.A. Organizational Culture and Climate. In The Oxford Handbook of Organizational Psychology; Oxford Library of Psychology; Kozlowski, S.W.J., Ed.; Oxford University Press: London, UK, 2012; Volume 1, pp. 643–666, ISBN-13: 978-0199395453. [Google Scholar]
  49. Besnard, D.; Boissières, I.; Daniellou, F.; Villena, J. Safety Culture: From Understanding to Action, ICSI, Institut pour une culture de sécurité industrielle, Toulouse, France 2018. Available online: https://www.foncsi.org/en/publications/collections/industrial-safety-cahiers/safety-culture-from-understanding-to-action/view (accessed on 28 July 2020).
  50. Pasman, H.J.; Rogers, W.J.; Mannan, M.S. Risk Control of Complex Systems: Can safety performance indicators be more informative? Hazards 2016, 26, 1–9. [Google Scholar]
  51. FACTS Data Bank. Accident #21667 2002 Czech Republic; #21266 2005 China; #25344 2011 France. Available online: www.factsonline.nl (accessed on 28 July 2020).
  52. Cataldo, M.; Herbsleb, J.D.; Carley, K.M. Socio-technical congruence: A framework for assessing the impact of technical and work dependencies on software development productivity. In Proceedings of the Second ACM-IEEE international symposium on Empirical software engineering and measurement, Kaiserslautern, Germany, 9–10 October 2008; ACM: New York, NY, USA, 2008; pp. 2–11. [Google Scholar]
  53. Freedman, D. Wald Lecture: On the Bernstein-Von Mises Theorem with Infinite-Dimensional Parameters. Ann. Stat. 1999, 27, 1119–1140. [Google Scholar] [CrossRef]
  54. El-Halwagi, M. Sustainable Design through Process Integration: Fundamentals and Applications to Industrial Pollution Prevention, Resource Conservation, and Profitability Enhancement; Elsevier: Amsterdam, The Netherlands, 2012. [Google Scholar]
  55. El-Halwagi, M.M. A return on investment metric for incorporating sustainability in process integration and improvement projects. Clean Technol. Environ. Policy 2017, 19, 611–617. [Google Scholar] [CrossRef]
  56. Guillen-Cuevas, K.; Ortiz-Espinoza, A.P.; Ozinan, E.; Jiménez-Gutiérrez, A.; Kazantzis, N.K.; El-Halwagi, M.M. Incorporation of Safety and Sustainability in Conceptual Design via a Return on Investment Metric. ACS Sustain. Chem. Eng. 2018, 6, 1411–1416. [Google Scholar] [CrossRef]
  57. CSB, US Chemical Safety and Hazards Investigation Board. Final Investigation Report Chevron Richmond Refinery Pipe Rupture and Fire; Report No. 2012-03-I-CA; CSB, US Chemical Safety and Hazards Investigation Board: Richmond, CA, USA, January 2015. [Google Scholar]
  58. ISO 22301:2012. Societal Securit—Business Continuity Management Systems—Requirements; The Standard Specifies Requirements to Plan, Establish, Implement, Operate, Monitor, Review, Maintain and Continually Improve a Documented Management System to Protect Against, Reduce the Likelihood of Occurrence, Prepare for, Respond to, and Recover from Disruptive Incidents When They Arise; International Standards Organisation: Geneva, Switzerland, 2012. [Google Scholar]
  59. ISO 22301:2019. Security and Resilience—Business Continuity Management Systems—REQUIREMENTS; ISO: Geneva, Switzerland, 2019. [Google Scholar]
  60. ISO 22313:2012. Societal Security—Business Continuity Management Systems—Guidance, in Accordance with the Requirements Set Out in ISO 22301:2012; ISO: Geneva, Switzerland, 2012. [Google Scholar]
  61. BS25999-2. Business Continuity Management-Part2: Specification Business Continuity Management; BSI: London, UK, July 2007; ISBN 860-2-47329-488-5. [Google Scholar]
  62. The Brundtland Commission, formally World Commission on Environment and Development (WCED), Main Report: Our Common Future. 1987. Available online: https://sustainabledevelopment.un.org/content/documents/5987our-common-future.pdf (accessed on 28 July 2020).
  63. Sikdar, S.K. Sustainable development and sustainability metrics. AIChE J. 2003, 49, 1928–1932. [Google Scholar] [CrossRef]
  64. Avalos, G. Chevron Restarts Crude Oil Unit at Richmond Refinery Damaged in August Fire. 2013. Available online: http://www.eastbaytimes.com/2013/04/26/chevron-restarts-crude-oil-unit-at-richmond-refinery-damaged-in-august-fire-2/ (accessed on 28 July 2020).
  65. Chemical Safety Board. Recommendations Statistics 2017. Available online: http://www.csb.gov/chevron-refinery-fire/ (accessed on 28 July 2020).
  66. Chevron. Corporate Sustainability Report Performance data 2016. Available online: https://www.chevron.com/-/media/shared-media/documents/corporate-responsibility-performance-data.pdf (accessed on 28 July 2020).
  67. Fortune 500. A Database of FORTUNE’s List of America’s Largest Corporations, November 2017. Available online: http://fortune.com/fortune500/2012/ (accessed on 28 July 2020).
  68. Pasman, H.J.; Rogers, W.J. How trustworthy are risk assessment results, and what can be done about the uncertainties they are plagued with? J. Loss Prev. Process Ind. 2018, 55, 162–177. [Google Scholar] [CrossRef]
  69. Pasman, H.J.; Rogers, W.J. How to treat expert judgment? With certainty it contains uncertainty! J. Loss Prev. Process Ind. 2020, 66, 104200. [Google Scholar] [CrossRef]
  70. Karunathilake, H.; Bakhtavar, E.; Chhipi-Shrestha, G.; Mian, H.R.; Hewage, K.; Sadiq, R. Decision Making for Risk Management: A Multi-Criteria. Perspective; Chapter 7 in Methods in Chemical Process Safety; Advanced Methods of Risk Assessment and Management; Khan, F.I., Amyotte, P.R., Eds.; AP Elsevier: Cambridge, MA, USA, 2020; Volume 4, pp. 239–287. [Google Scholar]
  71. Di Bona, G.; Silvestri, A.; Forcina, A.; Falcone, D. AHP-IFM Target: An Innovative Method to Define Reliability Target in an Aerospace Prototype Based on Analytic Hierarchy Process. Qual. Reliab. Eng. Int. 2017, 33, 1731–1751. [Google Scholar] [CrossRef]
Figure 1. The concept of resilience as we shall consider it in this paper applied to a process plant.
Sustainability 12 06152 g001
Figure 2. Principles and contributing factors of process resilience, Dinh et al. [19].
Sustainability 12 06152 g002
Figure 3. Elements of resilience. Modified and adapted from Jain et al. [21].
Sustainability 12 06152 g003
Figure 4. Process resilience evaluation algorithm adopted from Dinh et al. [19].
Sustainability 12 06152 g004
Figure 5. The process resilience analysis framework, PRAF, reproduced from Jain et al. [22].
Sustainability 12 06152 g005
Figure 6. Resilience-based integrated process system hazard analysis’ (RIPSHA’s) two system layers feeding resilience analysis, reproduced from Jain et al. [23].
Sustainability 12 06152 g006
Figure 7. Flow scheme of the resilience analysis resulting in a process upset prediction, reproduced from Jain et al. [26].
Sustainability 12 06152 g007
Figure 8. Survivability assessment given maintenance options, operational data, and a process model, reproduced from Jain et al. [28]. CMMS is central maintenance management system; SAP stands for systems applications and products and is the name of the enterprise resource planning software providing business relevant data.
Sustainability 12 06152 g008
Figure 9. Simplified schematic of proposed methodology reproduced from Jain et al. [29].
Sustainability 12 06152 g009
Table 1. Modifications in Return on Investment (ROI) metric over the time.
MetricReference
ROIReturn on Investment R O I   ( % ) = A E P p T C I p ;[54]
SWROIMSustainability weighted ROI metric S W R O I M   ( % ) = A S P p T C I p ;
A S P p = A E P p [ 1 + i = 1 N i n d i c a t o r s w i   i n d i c a t o r p , i i n d i c a t o r i T a r g e t ] ;
[55]
SASWROIMSafety and sustainability weighted ROI metric S A S W R O I M   ( % ) = A S S P p T C I p ;
A S S P p = A E P p [ 1 + i = 1 N i n d i c a t o r s w i   ( i n d i c a t o r b a s e , i i n d i c a t o r p , i i n d i c a t o r b a s e , i i n d i c a t o r i T a r g e t ) ] ;
[56]
S2R2WROIMSafety, sustainability, reliability, and resilience weighted ROI metric S 2 R 2 W R O I M   ( % ) = A E P p   [ 1 + r = 1 n s = 1 m w ¯ r s   w c , r   s = 1 ( I b a s e , r s I p , r s I b a s e , r s I t , r s )   ] T C I p ; [29]

