Article

An Integrated Key Performance Measurement for Manufacturing Operations Management

1
Memory Business Unit, Device Solution, Samsung Electronics Co., Ltd., Hwaseong-si 18448, Korea
2
Department of Industrial and Management Engineering, Dong-A University, Busan 49315, Korea
3
Department of Industrial and Management Engineering/Intelligence and Manufacturing Research Center, Kyonggi University, Suwon-si 16227, Korea
*
Author to whom correspondence should be addressed.
Sustainability 2020, 12(13), 5260; https://doi.org/10.3390/su12135260
Submission received: 28 May 2020 / Revised: 22 June 2020 / Accepted: 22 June 2020 / Published: 29 June 2020
(This article belongs to the Collection Smart Production Operations Management and Industry 4.0)

Abstract

:
This paper proposes a comprehensive production performance measurement framework and illustrates the method to evaluate the performance and guide practitioners to make further improvement. The development comprises four steps. (1) Performance indicators derived from business excellence models are enumerated to provide the performance model: 74 indicators, which can be classified in terms of their characteristics, are identified in six criteria. (2) A multiple criteria decision-making approach based on the analytic hierarchical and network processes, which determine the weights of the criteria and indicators, is applied. In addition, this study introduced additional formulas to derive the final performance values. (3) A performance measurement framework that integrates the measurement and result analysis processes is implemented. (4) The proposed framework is verified through a case study. The results of the case study show that the proposed framework identifies the gaps and discrepancies among the management levels, enabling the determination of means for continuous improvement.

1. Introduction

1.1. Background

The ability to measure operational performance is an important factor for competing enterprises in the global market. Performance measurement helps in the evaluation of the long-term effects of outputs for improving competitiveness and decision-making power. A company’s competitiveness and profits are reduced by a consistent continuation of subpar performance, as this eventually leads to a failure to meet customer need. In this overall perspective, using performance measurement to understand the company’s circumstances is critical to gaining the success and sustaining competitiveness in the era of constantly changing markets [1].
To measure this performance, well-extracted performance indicators are important sources for the effective performance measurement. It is generally believed that inspecting all the processes of the company environment yields well-extracted indicators that can increase the chances for success [2]. Evaluation of well-extracted indicators provides advantages to a company in the form of defects corrections. Therefore, gathering indicators should be obtained regarding financial or non-financial measures. Before the 1990s, financial measurements such as firm revenue, market share, and return on investment, were the main methods for evaluating performance [3]. However, some shortcomings to this method have been discovered, i.e., the fact that it is easy to concoct and falsify financial measures. Moreover, especially in the manufacturing domain, it is easier for managers to focus on reducing cost. This causes a deterioration of quality and disturbs long term improvement. For this reason, simultaneous consideration of corporate and manufacturing strategy is imperative to having a well-formulated performance measurement. For example, production quality is considered one of the main subjects in smart manufacturing [4,5]. Various performance measurement methods for the evaluation of manufacturing performance were adopted in theoretical and empirical studies [3]. Ref. [6] developed a management tool of Balanced Scorecard (BSC), which answered the call for a multi-source performance management system that used both non-financial and financial strategic indicators. From the BSC, many methods, such as supply chain operations reference (SCOR) and business excellence models, have been derived. The Baldridge, Deming and European Foundation for Quality Management (EFQM) model are the most well-known and commonly used models throughout the world [7]. Many organizations have adopted business excellence models because of the realization that these models promote the adoption of the best practices and tools that best fit a successful, quality strategy [8]. Additionally, these models have also been established as the holistic approach to organizational performance measurement. This study investigated the business excellence models and Appendix A presents the extracted indicators.
In general, production performance measurement is regarded as a Multiple Criteria Decision Making (MCDM) problem, because manufacturing performance cannot be evaluated using only one criterion; rather, it has many criteria in addition to complex concepts [9]. There are various MCDM techniques for evaluating multiple criteria, e.g., data envelopment analysis (DEA), the analytic hierarchical process (AHP), the analytic network process (ANP) and the technique for order of preference by similarity to ideal solution (TOPSIS). Among them, AHP and ANP are proposed by [8] first. Since, Refs. [10,11,12,13] use AHP for medical decision-making problems. Refs. [14,15,16] use AHP to improve the performance of flexible manufacturing cells, and [17,18,19] adapt AHP for selecting and evaluating supply chains. Moreover, Refs. [20,21,22] use ANP for online banking, wireless sensor network and urban planning, and brand making, respectively.
As manufacturing environments have become more complex than ever before, manufacturing-related indicators are increasing, which requires categorizing many indicators according to established criteria. In this study, we apply the AHP and ANP methods that categorized many indicators considering the relationships among indicators for evaluation of manufacturing operations management in a real-world company in Korea.

1.2. Research Statement

The general objective of this study is the development of a framework for performance measurement using an MCDM method (hybrid AHP/ANP approach) shown in Figure 1. This hybrid approach determines the weights of the criteria and performance indicators according to the relationship between each element. To organize the list of performance indicators, we investigate business excellence models and categorize them into six criteria. Furthermore, we develop a performance measurement framework that includes an assessment stage and a continuous improvement stage. The four contributions of the study are as follows:
  • We list non-financial performance indicators based on the three business excellence models: Baldridge, EFQM and Deming. One of the core contributions of this work is the categorization of production related indicators into six criteria.
  • We use of an MCDM approach to define the weights that state the importance of each criterion and indicator according to pairwise comparisons. We develop an additional formulation to derive the performance value based on the results of the MCDM method.
  • We specify the process of inducing continuous improvement, which includes a method to analyze the assessment results showing the performance measurement gaps among the three management levels, i.e., strategic, tactical and operational level.
  • We present the results of a case study that show the developed framework; additionally, we use the case study output to verify the proposed framework process.

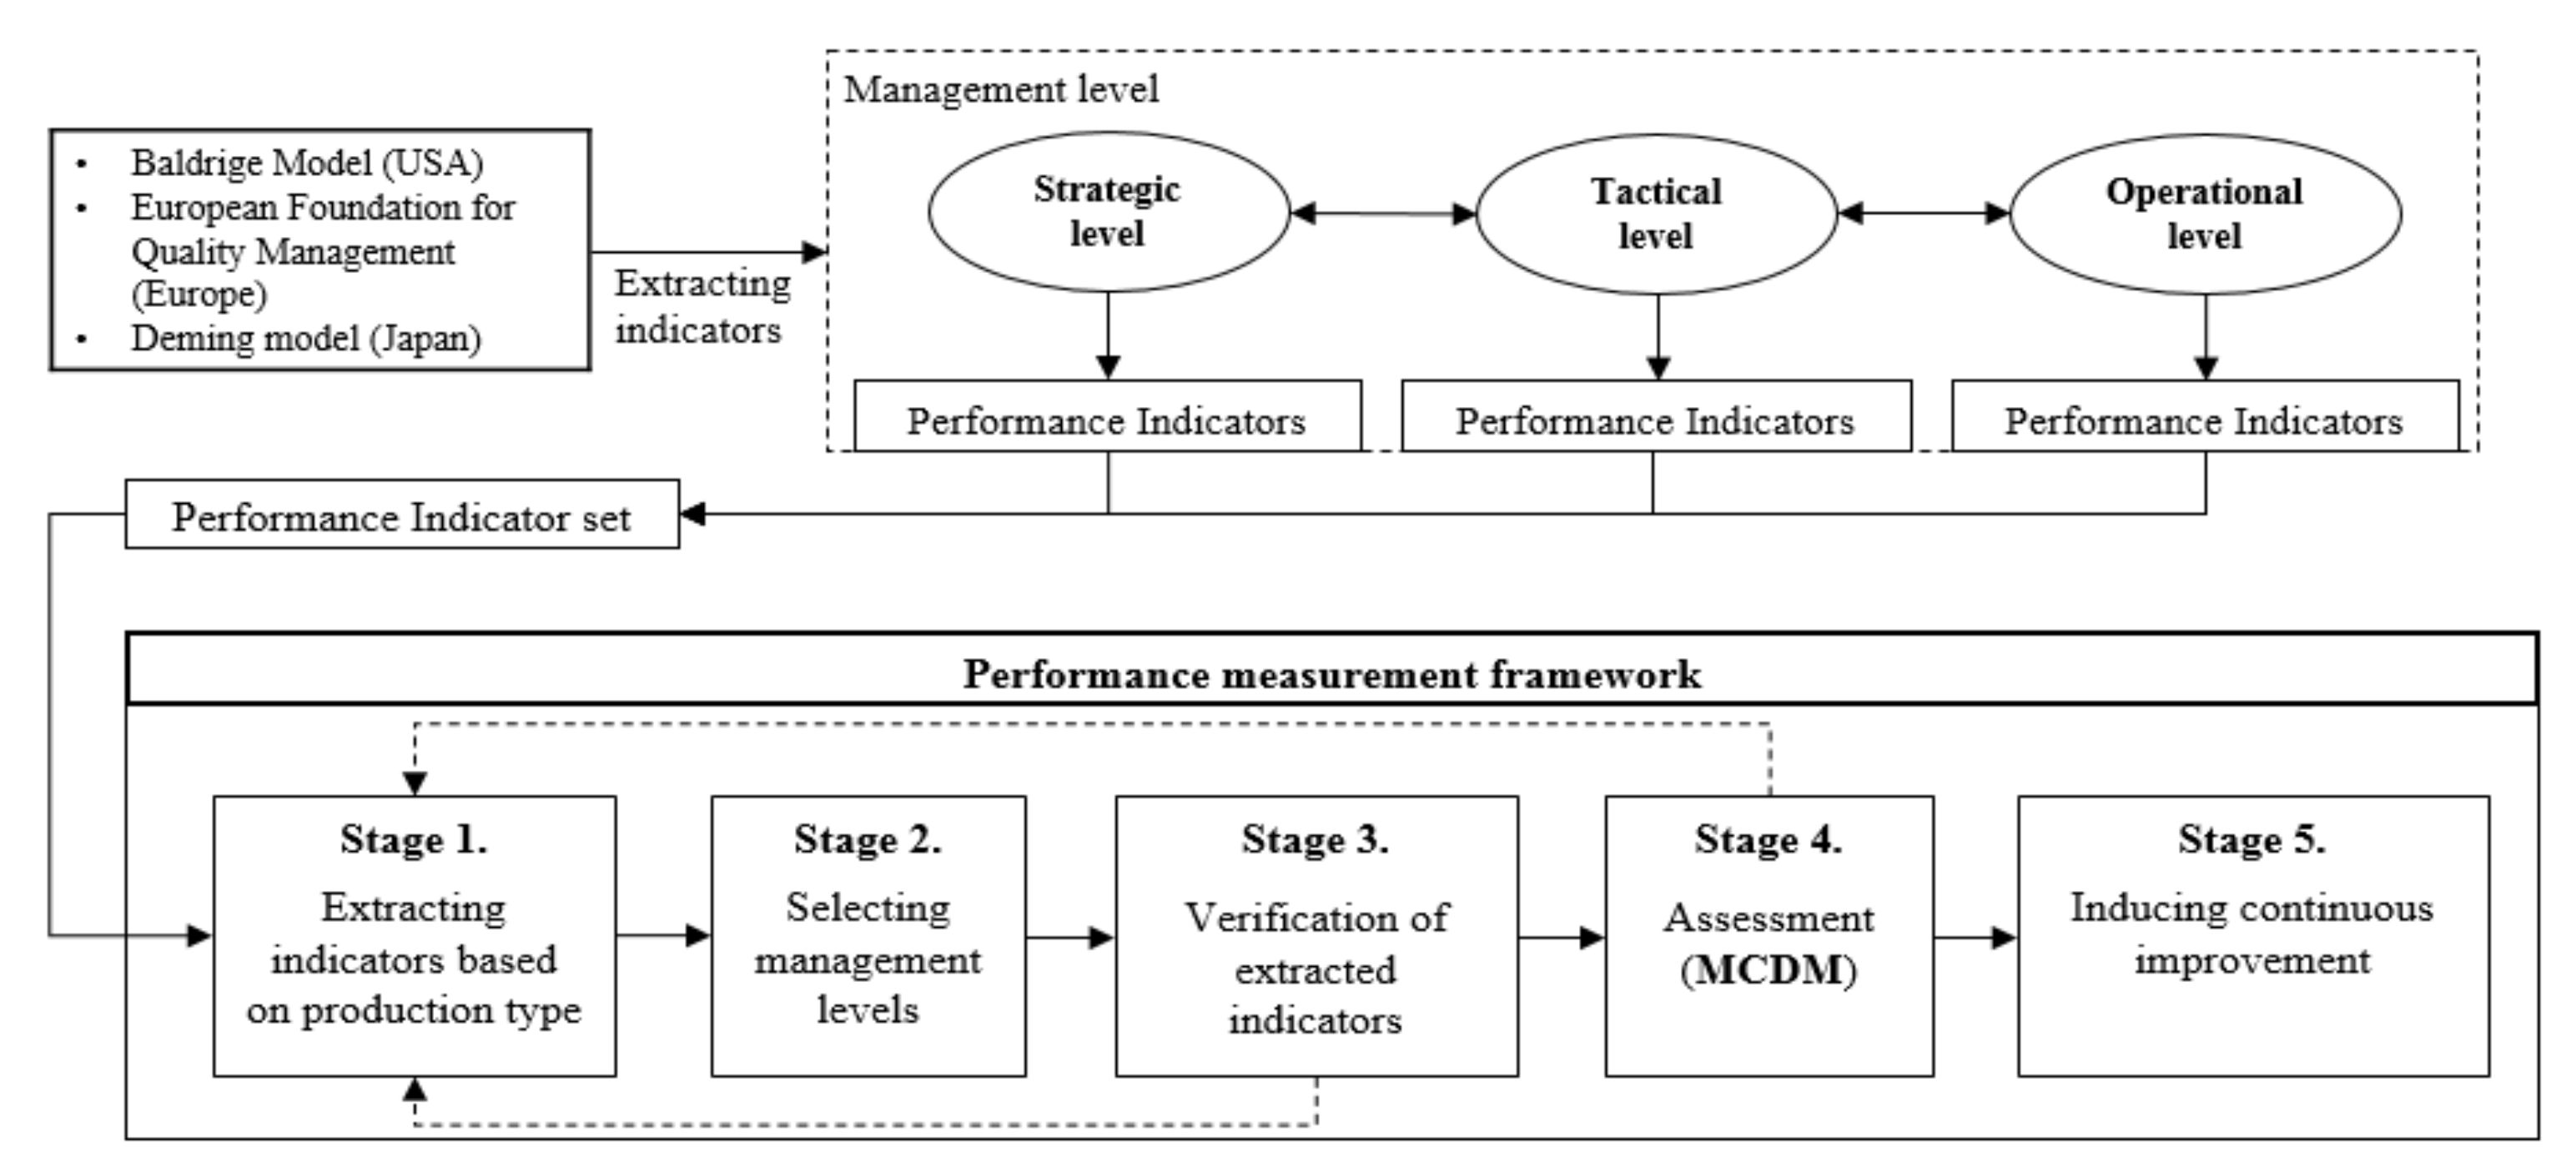
2. Problem Description

2.1. Designing the Structure of the Indicators
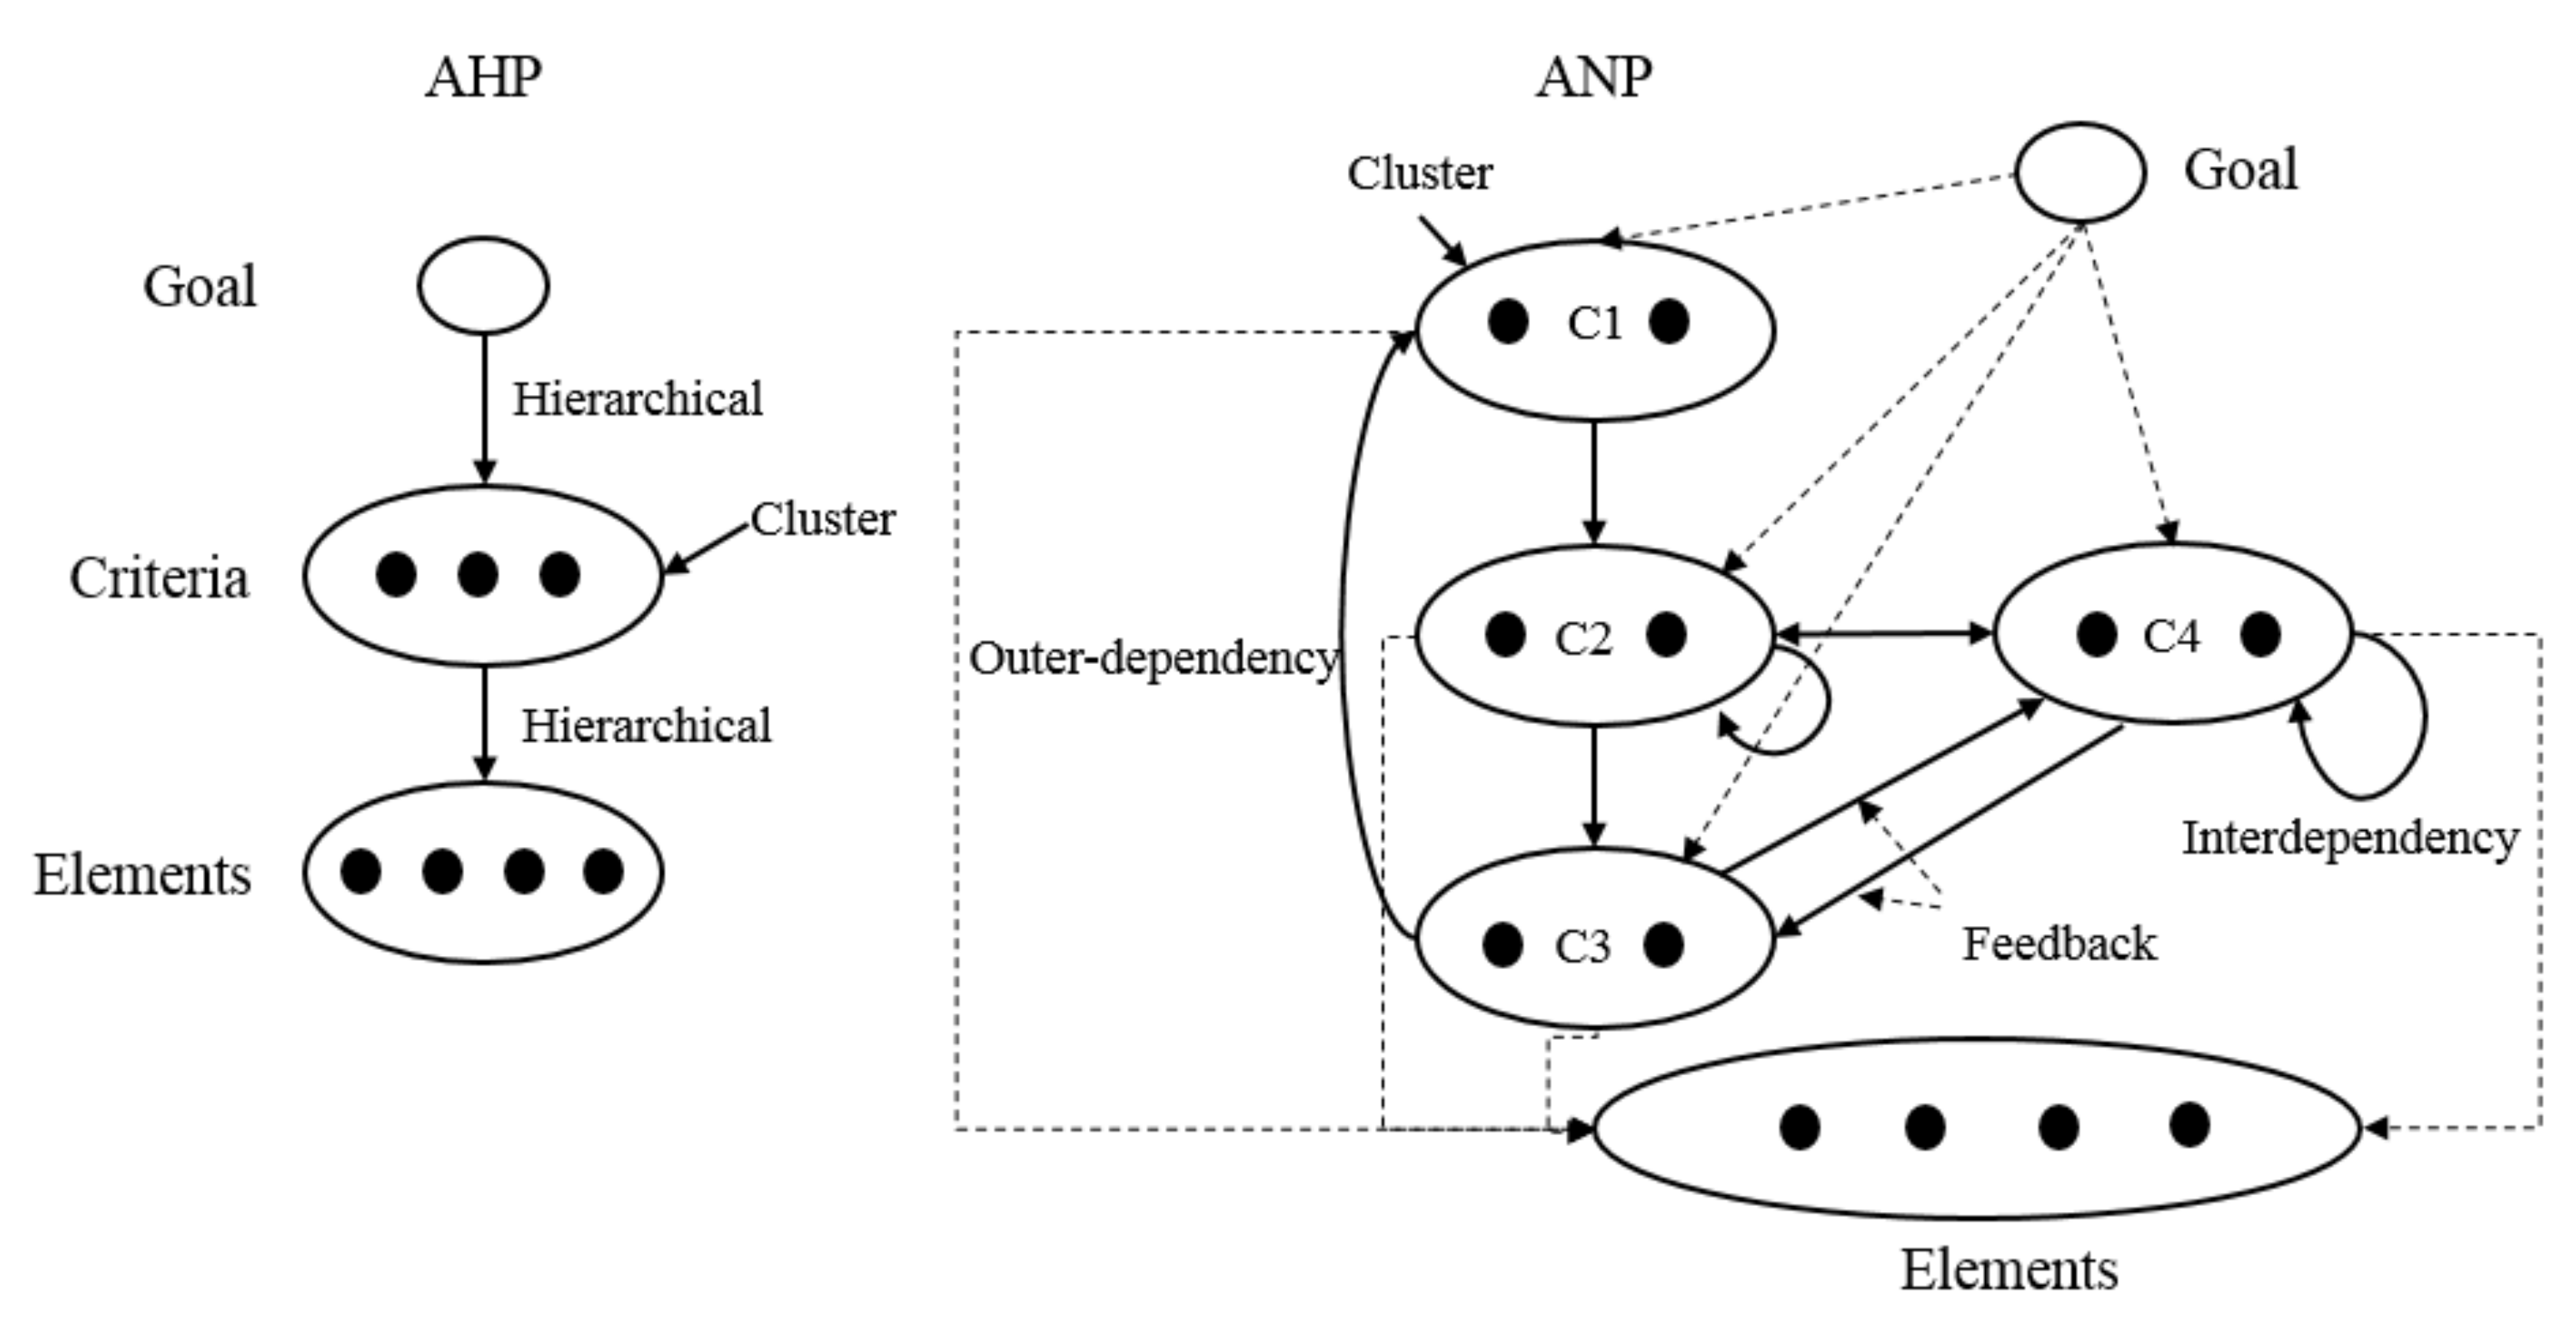
Several studies have suggested many criteria for use as the indicators, e.g., cost, delivery dependence, flexibility, quality, utilization, time and efficiency. Table 1 illustrates the selection of criteria and methods for measuring their production performance. There are some limitations of the related model in that it just introduces the list of criteria sorts the preference criteria, without deriving differences in criteria preference among employees
Conventional performance measurement studies are based on criteria strongly related with production performance, and they characterize information solely on production management aspects. However, production performance is complex in that worker productivity, production line environment status and efforts to improve strongly influence the results of performance. The main differentiators for this study are ‘Overall Waste’, ‘Human Resource’ and ‘Continuous Improvement’. These criteria enable the measurement to cover current production management aspects such as lean manufacturing and Toyota Production System. The criteria comprise six components that cover manufacturing performance, and Table 2 explains the criteria characteristics and presents the number of indicators used in this study (Appendix A provides additional details).

2.2. AHP/ANP Method

2.2.1. Fundamentals of the AHP/ANP Method

AHP decomposes the unstructured problem into a hierarchical structure, such as a decision tree. Decision elements at each hierarchical level are compared through the pair-wise method and assigned relative scales. The detailed process of AHP comprises three steps [29]:
(1)
The problem is decomposed into a hierarchical structure. The top level can be decomposed into some criteria and its lower level elements which cannot decompose furthermore.
(2)
Pair-wise comparison is performed. The pair-wise comparison indicates the perception of which element has more weight than the other.
(3)
The maximum eigenvalues and eigenvectors for the relative weights of the elements are derived. Then, the consistency property of the matrix must be checked to verify reliability of the decision making.
The Consistency Index (CI) and Consistency Ratio (CR), which illustrate the reliability, are defined as follows:
C I = λ max n n 1 ,   C R = C I R I
where λmax is the maximum eigenvalue, n is the number of elements and the random index (RI) is the average consistency index of randomly generated pair-wise comparison indicators (Table 3).
Using RI, the CR can be calculated, and this value shows whether the evaluations are sufficiently consistent. In general, if CR > 0.1, the decision-making structure is reliably consistent. If CR < 0.1, then it is inconsistent, and the evaluation procedure must be repeated until the CR satisfies the threshold.
The ANP method is an extension of the AHP that generalizes the AHP by replacing the hierarchy with a network that is composed of different clusters (groups of elements). The ANP has unique characteristics in that it assumes a mutual interaction relationship that exist between the clusters and contains feedback loops among the sub-elements [23]. Between the clusters and their elements different relationships (inner or outer dependence, feedback) exist as shown in Figure 2. The ANP still involves the hierarchical representation of relationships, but it does not require as strict a hierarchical structure as the AHP [30]. The ANP approach is capable of handling interdependence among elements by obtaining the composite weights through the development of a ‘super matrix’ which is similar to Markov chains [31].

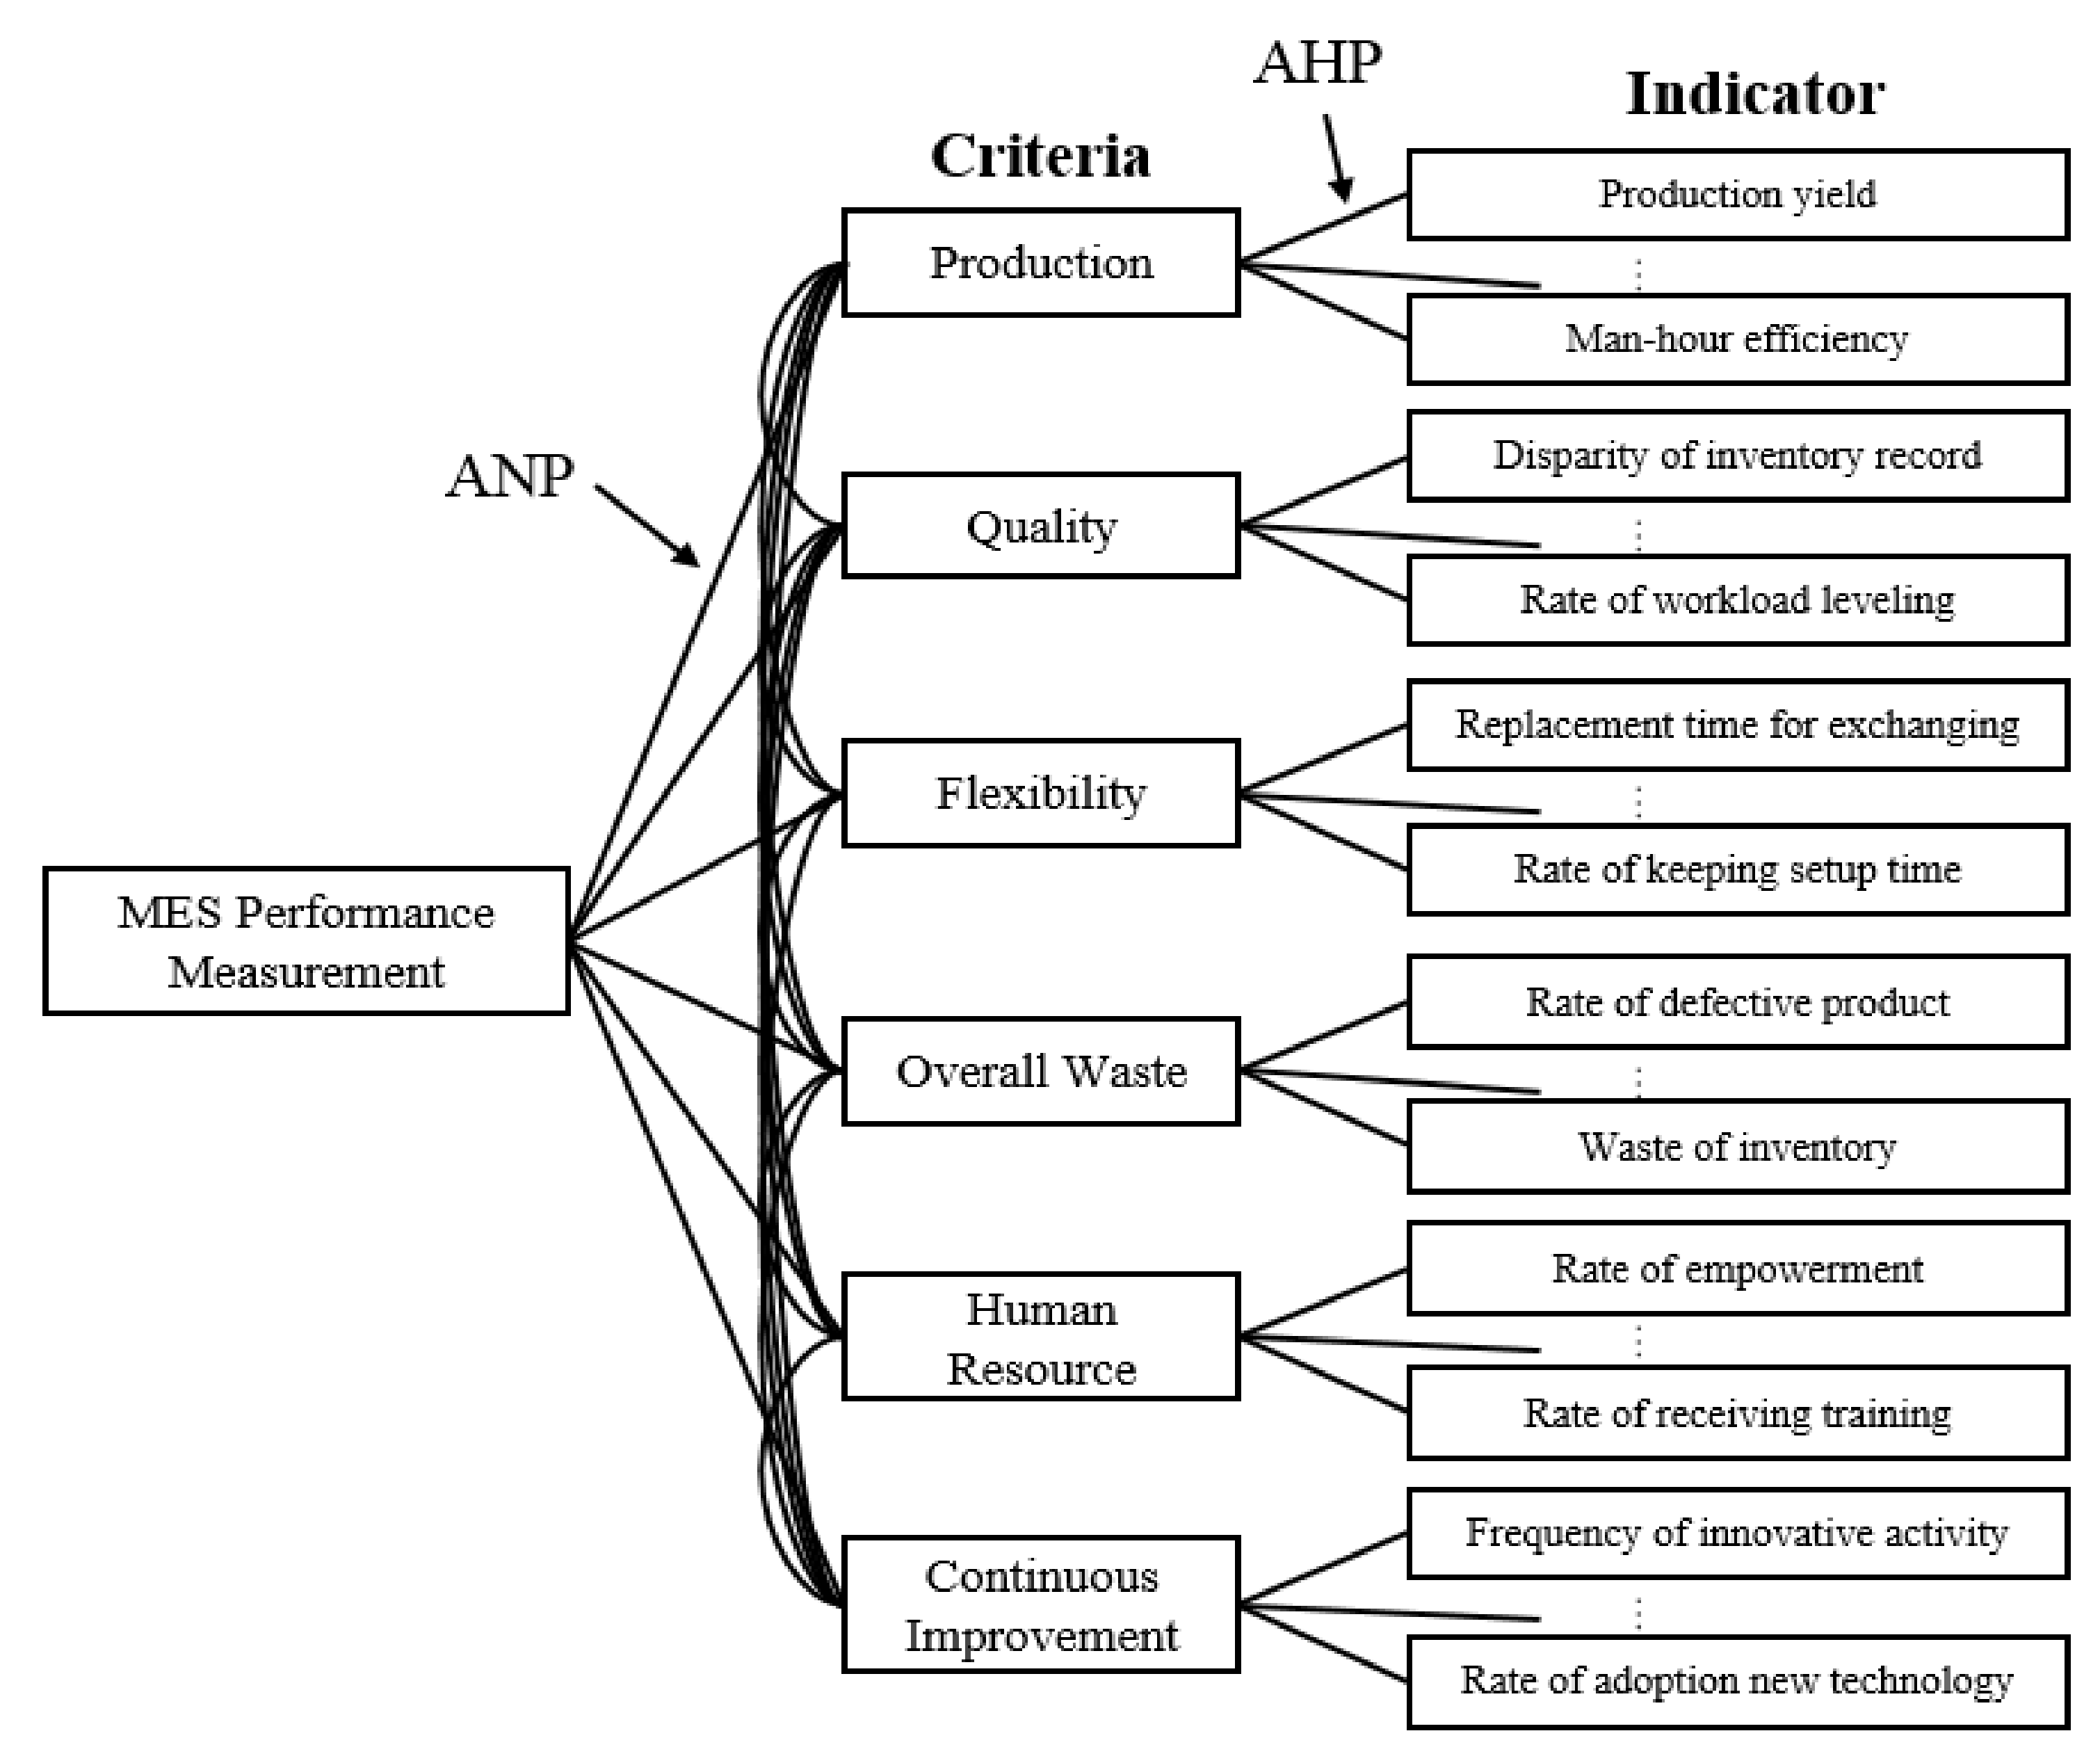
2.2.2. Applying the Indicators with the AHP and ANP Method

The AHP has been criticized because the decision problems are structured in a hierarchical manner. Some decision-making problems cannot be structured hierarchically because they involve the interaction and dependence of higher-level elements on lower-level elements [29]. The ANP also has some limits, e.g., it cannot perform comparisons between elements at the same hierarchical level, but it can be used for network structured decision-making problem [32]. For this reason, a hybridization of AHP and ANP was developed to overcome the complementary shortcomings. [30] used the AHP to evaluate various factors for different product mixes and then used the ANP to analyze more complex interrelationships among the decision levels and attributes. [33] use the AHP and ANP to determine the weight of each criterion when generating the performance model for a decision-making problem regarding the location of a facility.
In this study, the AHP and ANP are utilized to determine the weights of the criteria and indicators and the structure of the performance measurement is a categorization of 74 indicators into six criteria. A few of the 74 indicators have mutual interactions because some circumstances cannot be reflected by a single indicator. In addition, assuming relationships between the criteria and indicators with the hierarchical structure is problematic in that all indicators do not have a mutual relationship and their relationships vary depending on varying circumstances. For this reason, when forming the structure of the performance measurement, we should simultaneously include their mutual interactions and independent relationships. Figure 3 presents the structure of the performance measurement.
For simplification, we assume that the indicators have a hierarchical structure in accordance with the criteria. For this reason, the AHP should be utilized to assess indicators. The absence of the mutual interactions of the indicators are corrected by applying the ANP.

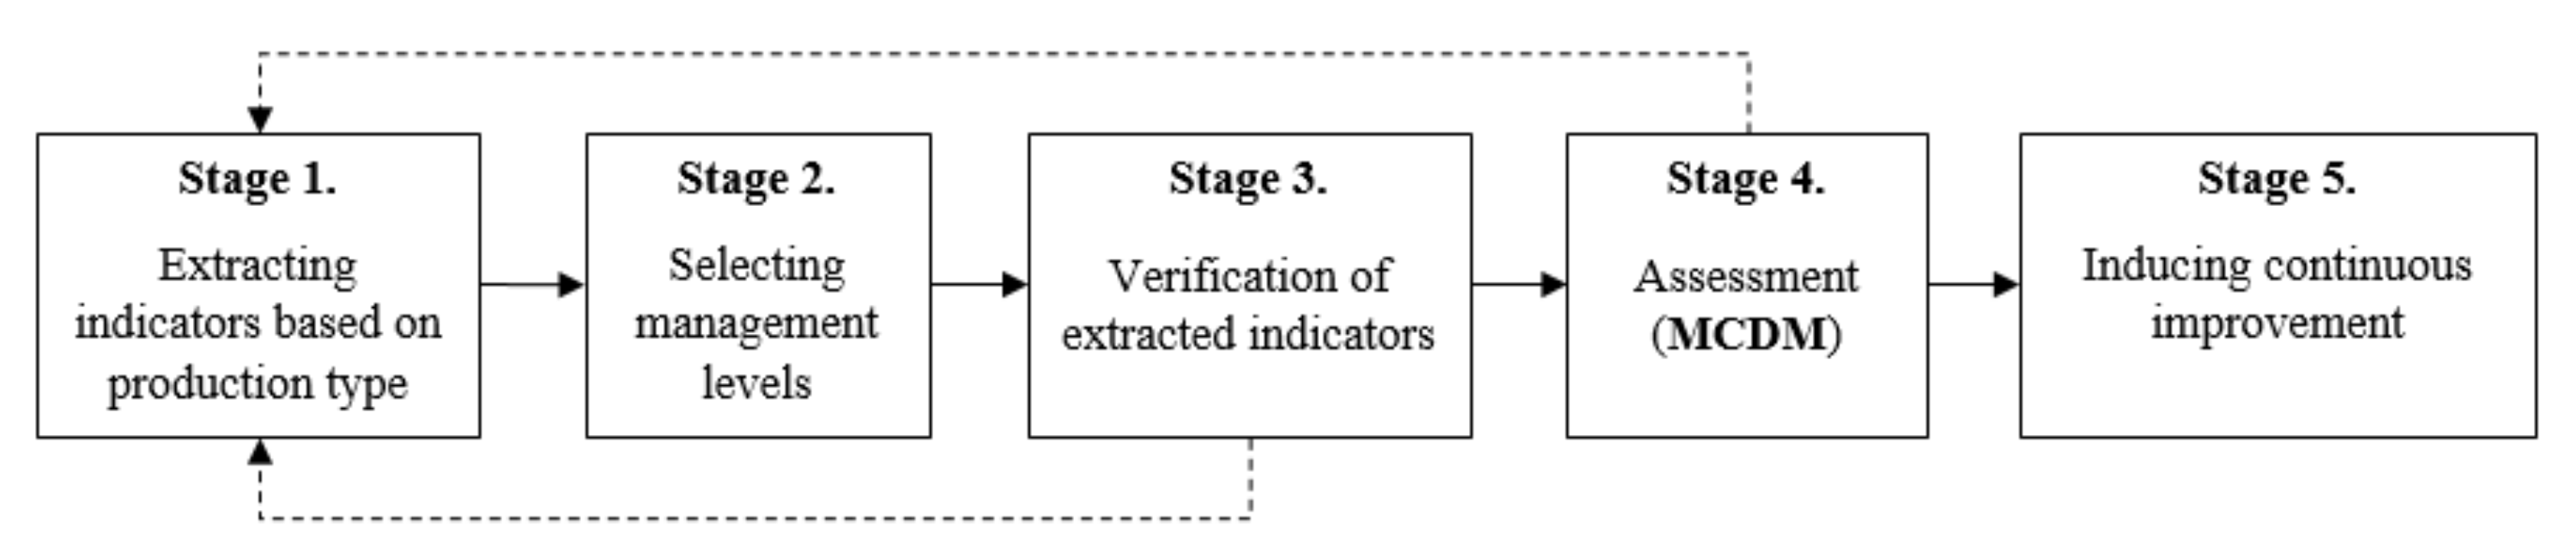
3. A Multi-Stage Framework

The conceptual framework involves five stages and has three main sections: performance measuring using MCDM, the analysis of gaps among different levels, and the alignment process with corporate and manufacturing strategy. Figure 4 shows the overall process of the framework and the following subsections explain the purpose and functions of each stage.

3.1. Stage 1: Extracting Indicators Based on Production Types

The starting point of the framework begins with the selection of the production type: Make to Stock (MTS), Make to Order (MTO) and Engineer to Order (ETO). This selection identifies the context of the manufacturing circumstance and presents the basis of the related indicators. Once the production type is identified, it is reflected in the indicators list in Stage 2. Each product type has weighted indicators that adequately reflect the production circumstance as shown in Table 4. Defined weighted indicators play an important role as additional performance factors when Stage 5 is progressing.
The output of this stage presents each management level with a list of indicators for the subsequent stages. The main challenge is identifying the indicators that reflect the company’s circumstance. Additionally, the indicators must be extracted in a balanced approach

3.2. Stage 2: Selecting Management Levels

In general, there are three hierarchical levels in manufacturing components: strategic level, tactical level and operational level. These levels are distinguished by their duties, position, job tenure, etc. The strategic level consists of the board of directors, president, vice-president and other members of the chief executives. They are responsible for controlling and overseeing the entire organization’s goals. The tactical level consists of the department managers related to production. They plan dispatch production, arrange production scheduling in detail, and supervise the shop floor. Lastly, the operational level consists of production workers on machines. These workers perform the production activities in manufacturing facilities including the equipment, inventory and storage areas. At this stage, the stakeholders who execute the assessment are selected.

3.3. Stage 3: Verification of Extracted Indicators

Throughout this stage, each management level checks the indicators in the list, and the outputs of this stage will be used in the performance assessment. This stage also monitors whether the previous stages are being satisfactorily performed such that the desired output can be attained. To meet the objectives, this stage is complemented with three different indicator lists, because each management level might choose different indicators based on their needs. If inadequate selections are identified, the process returns to the Stage 1. This process should be repeated until dissatisfaction has converged to a small value. In general, it is appropriate to perform the repeated process one to three times because relative improvement of the reliability value decreases as the number of iterations increases.

3.4. Stage 4: Assessment

This stage includes performing questionnaires based on the extracted indicators to make a grade, and the AHP/ANP analysis is applied to deduce the final results. If the basic value is drawn through the AHP/ANP analysis, the priority value among criteria, the priority value among indicators and the measured value of the overall production performance are derived with additional formulae. During this stage, the level of performance is calculated and the level of inconsistency among the management levels regarding each indicator and criterion can be measured. If the level of inconsistency is proven to be too big, Stage 5 is executed without the preceding stages. Figure 5 shows a flow chart of the assessment process.
Step 1 includes the survey, the AHP/ANP analysis, and the calculation of an index through an additional formula. The priority extracted indicators are estimated through pair-wise comparisons made by interested parties in the strategic, tactical, and operational levels using indicators acquired from the previous stage. In addition, the scores of the indicators and the criteria are rated on a point scale where 1 is poor, 3 is normal and 5 is excellent. Consequently, the mean estimated by each interested party is allotted as a Score. The Criteria Weight (CW), which is a rating of the importance of each criterion is determined through the ANP using pair-wise comparison. The Indicator Weight (IW), which is a value of the importance of each indicator, is determined through the AHP. Using CW and IW, the final outputs of performance measurement, criteria priority and final performance value, can be derived. The notation for the measurements of indices in this study are listed as follows:
  • i    Interested party index (i = 1, 2, 3),
  • j    Criteria index (j = 1, 2, …, 6),
  • k    Indicator index (k = 1, 2, ..., m),
  • m    Number of extracted indicators,
  • α    Weight by production environment,
  • TWCij    Score of the jth criterion from the ith interested party (criteria priority),
  • IWijk    Weight of the kth indicator of the jth criterion from the ith interested party (AHP),
  • Scoreijk    Score of the kth indicator allotment of the jth criterion from the ith interested party,
  • OPi    Overall point of the ith interested party and
  • CWij    Weight of the jth criterion from the ith interested party (ANP).
The TWCij and OPi can be calculated by using the following equations, and these results are to be analyzed to induce continuous improvement.
T W C i j = j = 1 6 k = 1 m α *   I W i j k *   S c o r e i j k
O P i = j = 1 6 T W C i j *   C W i j
The criteria priority (TWCij) determined through Equation (2) indicates which criterion has more importance than other criteria. The value α is used to allot greater importance to the priority value of a given criterion. This value can be estimates as α = IW + 1, because IW has an importance weight score that is always under 1. Equation (3) is used to acquire the final outcome of the measurement. Through this value, the performance level of the current production scheme can be identified at each management level.
Step 2 is the evaluation of the inconsistency via analysis of the values derived from Step 1. The notations for the inconsistency and their definitions are listed as follows:
  • lik    Lower value of the score of the kth indicator of the jth criterion given by each management level,
  • ujk    Upper value of the score of the kth indicator of the jth criterion given by each management level,
  • mjk     Difference between highest value (ujk) and lowest value (ljk),
  • l j k ¯    Minimum value of the lower values existing in the common section and
  • m j k ¯     Maximum value of the difference value (mjk) existing in the common section.
Based on these notations, we can identify two issues: inconsistency and discrepancy for inducing continuous improvement. First, the inconsistency, also called the gap of indicators among management levels, can be analyzed. One of the most significant characteristics of this framework is the ability to select indicators to consider through consultation with interested parties. Different selections of indicators mean that the part to which importance is attached in considering a manufacturing strategy differs depending on each management level. The difference in the selection, expressed as a gap, becomes the factor that may be the reason for an inefficiency of production. Here, unless the selected indicator was extracted by specific management level, the value is 0 or lik = 0. If the minimum value of all indicators is zero, then l j k ¯ = 0. A gap is judged to be the most serious inconsistency.
Second, large discrepancies in each management level are judged. A large discrepancy suggests that there are huge strategy gaps among the management levels resulting in lower productivity. The upper values (ujk) and the lower values (ljk) of specific indicators for a specific criterion given in each management level are measured. In general, if the difference between them (mjk) is more than 0.2, the criterion must be analyzed. In order to assign an order of appropriate measurement, priority should be decided. First, the mjk values should be sorted in a descending order then the indicators with the maximum value, that is, m j k ¯ should be sent to next stage.

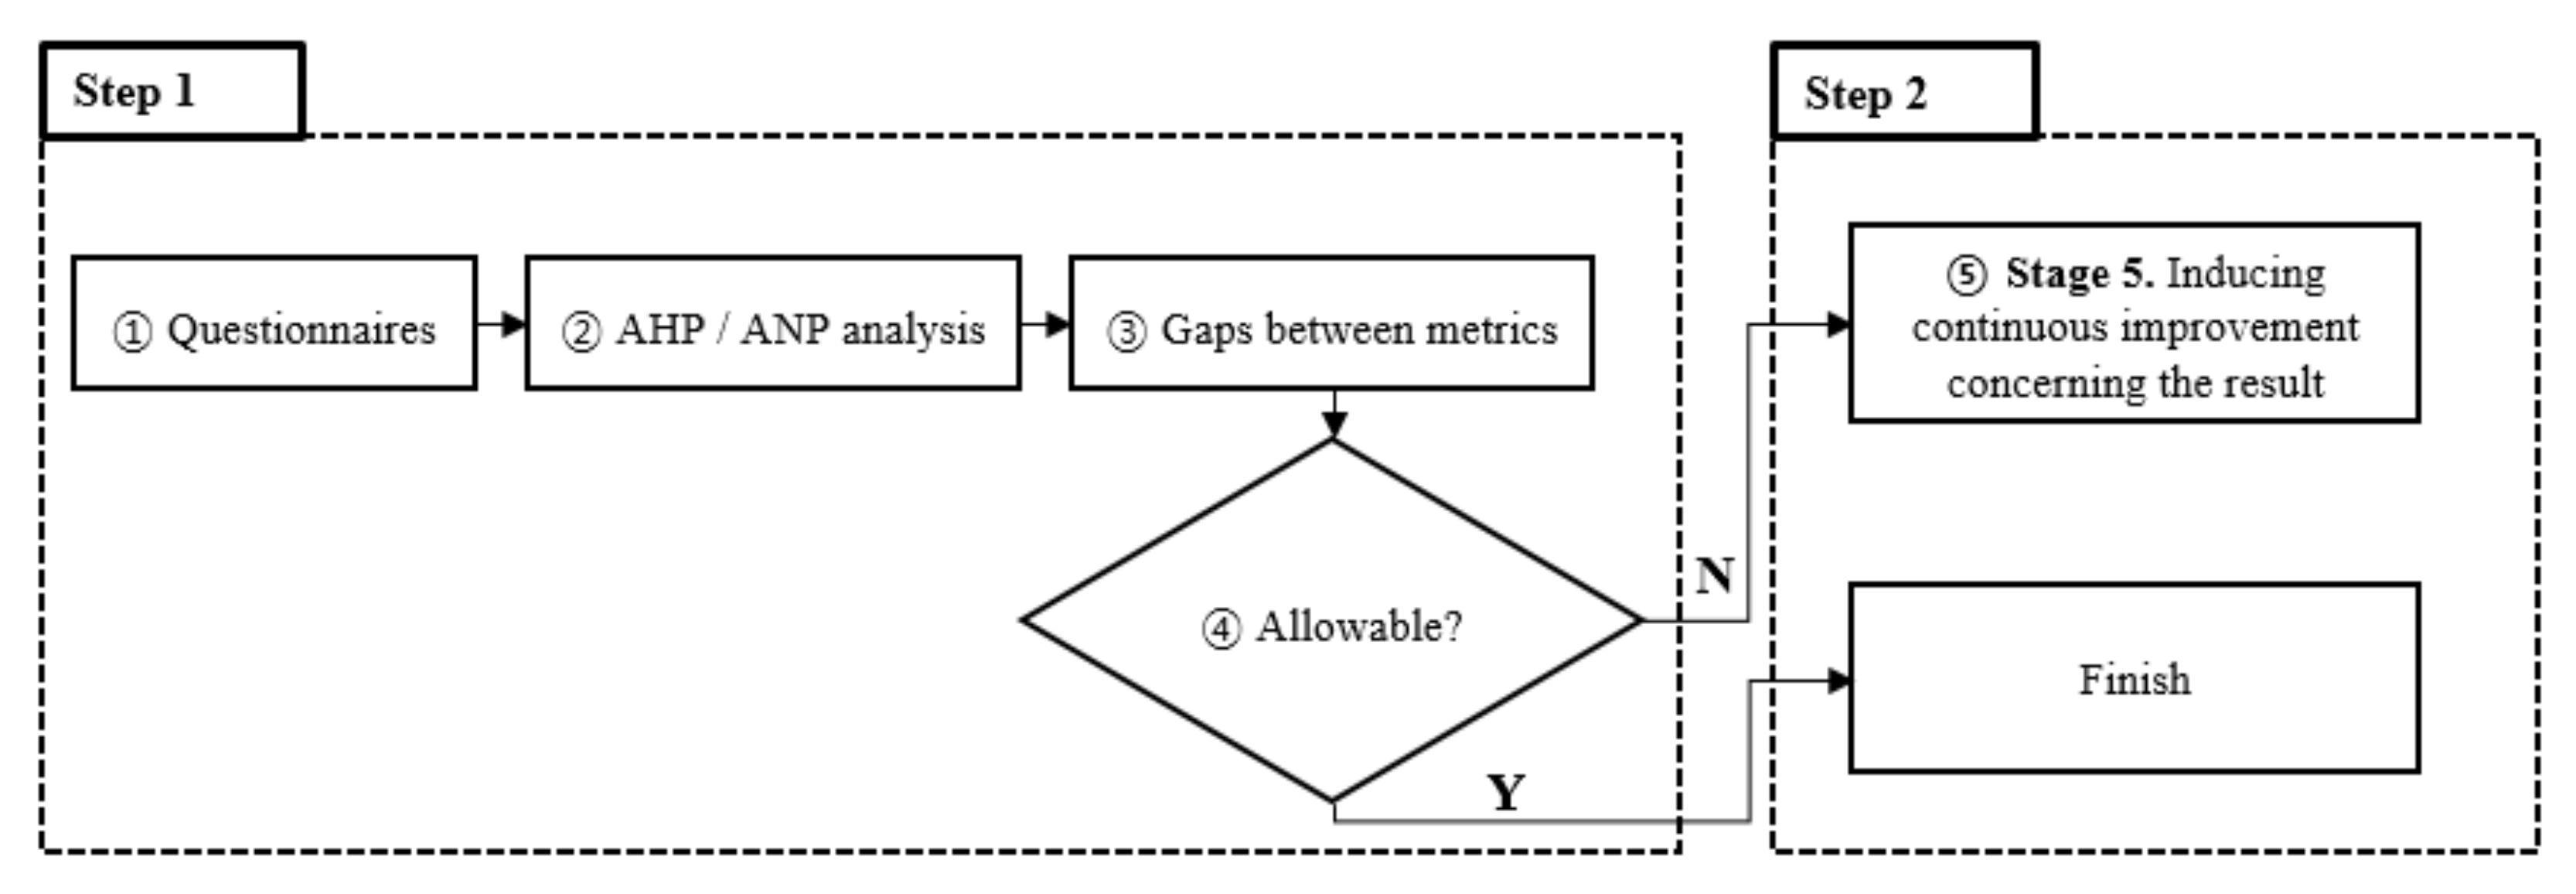
3.5. Inducing Continuous Improvement

Second, large discrepancies in each management level are judged. A large discrepancy suggests that there are huge strategy gaps among the management levels resulting in lower productivity. The upper values (ujk) and the lower values (ljk) of specific indicators for a specific criterion given in each management levels are measured. In general, if the difference between them (mjk) is more than 0.2, the criterion must be analyzed. In order to assign an order of appropriate measurement, priority should be decided. First, the mjk values should be sorted in a descending order than the indicators with the maximum value, that is, m j k ¯ should be sent to the next stage.
The output of the analysis of inconsistency in Step 2 of the previous stage may be analyzed to drive continuous improvement. An example of a noticeable table of Gap and Discrepancy is shown in Table 5. The ‘o’ symbol means that the specific management level chose the indicator, whereas the ‘×’ mark means that it was not be selected.
First, if a gap occurs, it is considered that there is a serious disagreement among management levels regarding the corporate and manufacturing strategy. In this case, the interested parties among the management levels discuss their opinions on the indicators for which gaps had occurred. In addition, they discuss the importance of the specific indicators so that there will not be any gaps in the future, and they agree on whether to even continue extracting indicators in the future.
Second, if a discrepancy occurs, it is necessary to reconcile the difference between the approaches of a strategy among management levels. After indicators with a large mjk value are established, it is important for the interested parties to determine the current status and understand the degree of resource commitment regarding the related process. Through this, the difference in perspectives on the measurement of the performance factor among management levels is analyzed. It is necessary for each management level to resolve this by presenting opinions regarding the indicators.

4. Application Case Study and Discussion

4.1. Selecting Production Type and Extracting Indicators

In order to verify the utilization of this framework, we have conducted a case study of a steel manufacturer. This company is the primary vendor of POSCO, which is the largest steel company in the Republic of Korea. The company consists of 120 workers, 70 of which were working on production lines. Six strategic managers, five tactical managers and five operational workers were invited to assess the performance. The company utilizes an MTO production strategy owing to its collaboration with a large steel company. As mentioned in Section 3.4, the indicators (34 strategic, 37 tactical and 21 operational) were presented in a survey through consultation with each management level.

4.2. Assessment

4.2.1. Step 1: Questionnaires and AHP/ANP Application

We performed a pair-wise comparison survey for the criteria and indicators to apply the AHP/ANP analysis. Because the score allotment for criteria assumes the mutual interaction relationship, it was analyzed by using the ANP. Table 6 presents the score allotment.
The calculated consistency of each management levels was in the range of 0.1 to 0.2, afforming the reliability of the data. First, it was found through the data that there is a similar priority of criteria between the strategic and tactical levels, but that of the operational level was somewhat different. From this fact, we could identify that there was a difference for priority of criteria between the office level and the plant level. Then, the AHP was applied when allotting a score to an indicator. To acquire a result, each stakeholder provided a pair-wise comparison for all indicators and allotted a score (1, 3, 5) for each indictor. The allotted scores show the averages of indicator scores and the IW means the results of AHP. Table 7 contains the scores of indicators in the criterion of quality.
The consistency also shows reliability and the ‘×’ mark in Table 7 means that the specific management level did not choose the indicator, specified as a gap in the analysis of inconsistency. This means that gap analysis is required to fix the problem.
Next, the outcome scores of the final production performance were calculated using Equation (2) and they are shown in Table 8.
If a value history is available, this value allows for analysis of the current status of production performance via comparison to previous values. Moreover, it becomes possible to compare individual management levels by using this final outcome score value. Using Equation (3), the overall production performance score can be derived: Strategic is 3.375, Tactical is 3.596, and Operational is 2.878. Because the operational level score was lower than scores of other management levels, the indicators allotted to the lower scores must be checked, and their causes must be identified.

4.2.2. Step 2: Gap and Discrepancy Analysis for Inducing Continuous Improvement

In this case study, it was found that a gap had occurred in eight of the indicators: four in ‘Quality’, two in ‘Overall waste’, one in ‘Human resources’ and one in ‘Continuous improvement’. The results of Gap analysis were shown in Table 9.
From discussions with management levels regarding the outcome of the gap, the indicator that seemed to most significantly contribute to the gap analysis was the ‘Frequency of production innovation activity’. The strategic and tactical levels selected this indicator, but the operational level did not because of the resistance to innovation the work site. The strategic and tactical levels wanted to heighten productivity through innovation activities, but the operational level was not interested in innovation because there were fewer advantages. For this, a long-term plan for innovation was established.
Next, from the analysis of the discrepancy indicator extracted with IW, it was determined that there were differences in the priority of waste by inventory, standardization rate, Cpk, etc. Figure 6 shows the details of the discrepancy.

4.3. Discussion of Application Study

From the discrepancy analysis, it was found that there were great differences in the indicators in the production and quality criteria. This means that different priorities existed during work site production depending on each management level, so the problem would be found through consultation. The following text describes consultation feedback. The indicators that contained the most significant results were those of the ‘Waste by stock’ and ‘Standardization rate’. The value of ‘Waste by stock’ was high in the tactical level yet low in the strategic level. Investigating this indicator, it was determined that stock management was not performed well at the site and many expenses were paid according to the stock. On the site, stocks and products were stored in outdoor yards (in addition to indoor storage), and the managers in the tactical level felt a need for the expansion of the plant; in contrast, the stakeholders at the strategic level had yet to even consider expansion. Next, the value of ‘standardization rate’ indicator was high for the operational level yet low for the tactical level. Investigating this indicator, it was determined that the site was interested in increasing efficiency through standardization, but the tactical level had a lower priority for the standardization. Through this observation, the tactical level could understand the desire for standardization at the site and develop the standardization methods for the future.
As a result of the case study, it was found that there the significance of indicators varied. It seems that this was primarily caused by varying interest in the priority of the work to be completed at each level. In order to overcome this limitation, it is necessary to identify the problems through consultation among the management levels for the indicators with high discrepancies. Among the 34 indicators, the 10 indicators that were prioritized at all management levels are as follows; input of materials; Waste by accident; Delivery observation rate; Understanding process rate; Manufacturing cycle time; Waste by stock; Pass rate of finished goods; Cpk; Innovation of production process; Straight to process rate.

5. Conclusions

In this study, we investigated business excellence models for extracting related indicators. Based on the extracted indicators, we built a performance measurement structure for applying a hybrid AHP/ANP. A five-stage framework of performance measurement was proposed. It includes estimating the weight between hierarchical consistent indices through applying the hybrid AHP/ANP in the assessment stage and extracting implications to be applied to the site in the diagnostic stage. A case study was conducted to verify the proposed framework. This research will be very helpful to managers who want to evaluate their performance.
As the market environment has complex factors, the evaluation of performance is widely accepted as an MCDM problem. Especially in the manufacturing industry, which has complete distinctive management levels, lessening the gap and discrepancy among management levels is very important to get the company’s competitiveness. Our proposed framework affords a steppingstone for identifying those issues. Our proposed model can be used by small- and medium-size companies to measure the performance completely, because building structure of indicators and doing pair-wise comparison to each management level requires time and is cost consuming. Moreover, defining the relations among indicators is ambiguous as company size is bigger. Our proposed model fits the manufacturing industry, models (Baldridge, EFQM, Deming, etc.) from which we extracted the criterion are specialized in manufacturing. Moreover, a characteristic of our research, dividing the management level into three, is easily applied into manufacturing industry.
This study has four aspects to be improved in future research. First, if more performance indicators are selected, the assessment process will be rather time consuming. Thus, there is a challenge to neglect unimportant indicators before assessment. Developing the knowledge management system is helpful in this issue. Second, more case studies could verify and strengthen the proposed framework. Further case studies are recommended to analyze the framework’s usefulness and difference between companies or industries. Third, as many states of the art technologies, such as the Internet of Things (IoT), are being applied into the real sites, new indicators should be developed to reflect their performance. Feedback from professionals would definitely enrich the list of indicators. Finally, as environmental factors become important in manufacturing, it is necessary to establish environmental criteria.

Author Contributions

All authors contributed substantially to the conception of the paper. G.H. was responsible for conceptual work, literature review and most of the writing; J.-H.H. was responsible for literature review, analysis of case studies and editing; T.-W.C. was involved in conceptual work, modeling, developing methodology and funding acquisition. All authors have read and agreed to the published version of the manuscript.

Funding

This work was supported by the GRRC program of Gyeonggi province. [(GRRC KGU 2017-B01), Research on Industrial Data Analytics for Intelligent Manufacturing].

Conflicts of Interest

The authors declare no conflict of interest.

Appendix A

Table A1. List of Extracted Indicators.
CriteriaIndicators
ProductionCycle time; Yield, Defect by each process; Cpk; Straight to process rate; level of stock; Shorten time for standardization; 5S compliance rate; Machine failure rate
QualityInspection rate; Final product pass rate; Rework rate; Refuse rate; Out-sourcing return rate; Return rate (WIP); Correction measure; Inspection error rate; Rectifying error rate; Rate of on-time delivery; Schedule observation rate; MRP accuracy; Delay in delivery; Delay in material input; Overall workload; Load-leveling rate; Final goods return rate; Inventory report
FlexibilitySetup time; Material Input; Variance of process; Worker flexibility; Lot size
Overall wasteWaste by production; Waste by production layout; Setup standard time; Waste of standby; Waste by failure; Waste by unnecessary work; Waste of inventory; Waste by material; Waste by failure; Waste by accident
Human resourceTurnover rate; Training cost per worker; Training investment; Training complete rate; # of qualification; Personnel expense rate; Working time per worker; Rate of process comprehension; Communication level; Leadership of managers; Accident rate; Incentive rate; Overtime work rate; Flexibility to work variation; Authority empowerment; Recruit rate; Stress level; Work strike rate; Flexibility of human resource
Continuous Improvement# of proposal per person; Achievement of proposal rate; Rate of standardization; Standard observation rate; Information gathering; # of innovation; Incentive for innovation; # of group of innovation; Knowledge share; Proposal acceptance rate; Introduction of new technology; Achievement to goal; Response rate to strategy change

References

  1. Bhagwat, R.; Sharma, M.K. Performance measurement of supply chain management using the analytical hierarchy process. Prod. Plann. Control 2007, 18, 666–680. [Google Scholar] [CrossRef]
  2. Taticchi, P.; Balachandran, K.; Tonelli, F. Performance measurement and management systems: State of the art, guidelines for design and challenges. Meas. Bus. Excell. 2012, 16, 41–54. [Google Scholar] [CrossRef]
  3. Yu, V.F.; Hu, K.J. An integrated fuzzy multi-criteria approach for the performance evaluation of multiple manufacturing plants. Comput. Ind. Eng. 2010, 58, 269–277. [Google Scholar] [CrossRef]
  4. Kamble, S.S.; Gunasekaran, A.; Gawankar, S. Industry 4.0 framework: A systematic literature review identifying the current trends and future perspectives. Process Saf. Environ. Prot. 2018, 117, 408–425. [Google Scholar] [CrossRef]
  5. Durana, P.; Kral, P.; Stehel, V.; Lazariou, G.; Sroka, W. Quality culture of manufacturing enterprises: A possible way to adaption to Industry 4.0. Soc. Sci. 2019, 8, 124. [Google Scholar] [CrossRef] [Green Version]
  6. Kaplan, R.S.; Norton, D.P. Using the Balanced Scorecard as a Strategic Management System; Harvard Business Review: Boston, MA, USA, 1996; pp. 103–108. [Google Scholar]
  7. Al-Dhaafri, H.S.; Al-Swidi., A.K.; All-Ansi, A.A. Organizational excellence as the driver for organizational performance: A study on Dubai police. Rev. Int. J. Bus. Manag. 2016, 11, 47–52. [Google Scholar] [CrossRef]
  8. Sampaio, P.P.S.; Manteiro, A.A. Comparison and usage overview of business excellence models. TQM J. 2012, 24, 181–200. [Google Scholar] [CrossRef] [Green Version]
  9. Jakhar, S.K.; Mukesh, K.B. An integrated model of supply chain performance evaluation and decision-making using structural equation modelling and fuzzy AHP. Prod. Plan. Control 2014, 25, 938–957. [Google Scholar] [CrossRef]
  10. Saaty, T.L. A scaling method for priorities in hierarchical structures. J. Math. Psychol. 1977, 15, 234–281. [Google Scholar] [CrossRef]
  11. Maruthur, N.M.; Joy, S.M.; Dolan, J.G.; Shihab, H.M.; Singh, S. Use of the Analytic Hierarchy Process for Medication Decision-Making in Type 2 Diabetes. PLoS ONE 2015, 10, e0126625. [Google Scholar] [CrossRef] [Green Version]
  12. Wu, G.; Duan, K.; Zuo, J.; Zhao, X.; Tang, D. Integrated Sustainability Assessment of Public Rental Housing Community Based on a Hybrid Method of AHP-Entropy Weight and Cloud Model. Sustainability 2017, 9, 603. [Google Scholar]
  13. Oudah, M.; Jabeen, F.; Dixon, C. Determinants linked to family business sustainability in the UAE: An AHP approach. Sustainability 2018, 10, 246. [Google Scholar] [CrossRef] [Green Version]
  14. Nguyen, H.T.; Dawal, S.Z.M.; Nukman, Y.; Aoyama, H.; Case, K. An Integrated Approach of Fuzzy Linguistic Preference Based AHP and Fuzzy COPRAS for Machine Tool Evaluation. PLoS ONE 2015, 10, e0133599. [Google Scholar] [CrossRef] [PubMed] [Green Version]
  15. Gao, H.; Ju, Y.; Gonzalez, E.D.R.; Zhang, W. Green supplier selection in electronics manufacturing: An approach based on consensus decision making. J. Clean. Prod. 2020, 245, 118781. [Google Scholar] [CrossRef]
  16. Shete, P.C.; Ansari, Z.N.; Kant, R. A Pythagorean fuzzy AHP approach and its application to evaluate the enablers of sustainable supply chain innovation. Sustain. Prod. Consum. 2020, 23, 77–93. [Google Scholar] [CrossRef]
  17. Astanti, R.D.; Mbolla, S.E.; Ai, T.J. Raw material supplier selection in a glove manufacturing: Application of AHP and fuzzy AHP. Decis. Sci. Lett. 2020, 9, 291–312. [Google Scholar] [CrossRef]
  18. Nguyen, H.T.; Zawiah, S.; Dawal, M.; Nukman, Y.; Rifai, A.P.; Aoyama, H. An Integrated MCDM Model for Conveyor Equipment Evaluation and Selection in an FMC Based on a Fuzzy AHP and Fuzzy ARAS in the Presence of Vagueness. PLoS ONE 2016, 11, e0153222. [Google Scholar] [CrossRef]
  19. Deng, X.; Hu, Y.; Deng, Y.; Mahadevan, S. Supplier selection using AHP methodology extended by D numbers. Expert Syst. Appl. 2014, 41, 156–167. [Google Scholar] [CrossRef]
  20. Li, L.; Fan, F.F.; Ma, L.; Tang, Z.R. Energy utilization evaluation of carbon performance in public projects by FAHP and cloud model. Sustainability 2016, 8, 630. [Google Scholar] [CrossRef] [Green Version]
  21. Wang, Y.L.; Tzeng, G.H. Brand marketing for creating brand value based on a MCDM model combining DEMATEL with ANP and VIKOR methods. Expert Syst. Appl. 2012, 39, 5600–5615. [Google Scholar] [CrossRef]
  22. Lin, W.R.; Wang, Y.H.; Hung, Y.M. Analyzing the factors influencing adoption intention of internet banking: Applying DEMATEL-ANP-SEM approach. PLoS ONE 2020, 15, e227852. [Google Scholar] [CrossRef] [PubMed]
  23. Ordoobadi, S.M. Application of ANP methodology in evaluation of advanced technologies. J. Manuf. Technol. Manag. 2012, 23, 229–252. [Google Scholar] [CrossRef]
  24. Abdel-Maksoud, A.B.; Ahmed, B. Manufacturing in the UK: Contemporary characteristics and performance indicators. J. Manuf. Technol. Manag. 2004, 15, 155–171. [Google Scholar] [CrossRef]
  25. Yang, C.L.; Chuang, S.P.; Huang, R.H. Manufacturing evaluation system based on AHP/ANP approach for wafer fabricating industry. Expert Syst. Appl. 2009, 36, 11369–11377. [Google Scholar] [CrossRef]
  26. Yurdakul, M. Measuring a manufacturing system’s performance using Saaty’s system with feedback approach. Integr. Manuf. Syst. 2002, 13, 25–34. [Google Scholar] [CrossRef]
  27. Sun, C.C. A performance evaluation model by integrating fuzzy AHP and fuzzy TOPSIS methods. Expert Syst. Appl. 2010, 37, 7745–7754. [Google Scholar] [CrossRef]
  28. Pagone, E.; Salonitis, K.; Jolly, M. Automation weighted high-resolution mapping of multi-criteria decision analysis for sustainable manufacturing system. J. Clean. Prod. 2020, 257, 120272. [Google Scholar] [CrossRef]
  29. Saaty, T.L. Decision making by the analytic hierarchy process: Theory and applications How to make a decision: The analytic hierarchy process. Eur. J. Oper. Res. 1990, 48, 9–26. [Google Scholar] [CrossRef]
  30. Chung, S.H.; Lee, H.; Pearn, W.L. Product Mix Optimization for Semiconductor Manufacturing Based on AHP and ANP Analysis. Int. J. Adv. Manuf. Technol. 2005, 25, 1144–1156. [Google Scholar] [CrossRef]
  31. Büyüközkan, G.; Çifçi, G. Evaluation of the green supply chain management practices: A fuzzy ANP approach. Prod. Plan. Control 2012, 23, 405–418. [Google Scholar] [CrossRef]
  32. Abdi, M.R.; Ashraf, W.L. Performance evaluation of reconfigurable manufacturing systems via holonic architecture and the analytic network process. Int. J. Prod. Res. 2011, 49, 1319–1335. [Google Scholar] [CrossRef]
  33. Yang, C.L.; Chuang, S.P.; Huang, R.H.; Tai, C.C. Location Selection Based on AHP/ANP Approach. In Proceedings of the 2008 IEEE International Conference on Industrial Engineering and Engineering Management, Singapore, 8–11 December 2008. [Google Scholar]
Figure 1. Framework for performance measurement using a Multiple Criteria Decision Making (MCDM) method here.
Sustainability 12 05260 g001
Figure 2. Structural difference between the analytic hierarchical process (AHP) and the analytic network process (ANP).
Sustainability 12 05260 g002
Figure 3. Structure of the performance measurement.
Sustainability 12 05260 g003
Figure 4. Overall process of the proposed framework.
Sustainability 12 05260 g004
Figure 5. Processes of the assessment.
Sustainability 12 05260 g005
Figure 6. A graph of discrepancy.
Sustainability 12 05260 g006
Table 1. Summarize literature review of the accepted criteria and applied method.
AuthorCriteriaMethod
Yu and Hu [3]Productivity, Production Amount, Production Cost, Inventory Amount, Quality costFuzzy TOPSIS
Lin et al. [22]Perceived usefulness, Perceived ease of use, Risk, Trust, Satisfaction ANP
Ordoobadi [23]Cost, Flexibility, Productivity, Quality, Reliability, Human Resource ImpactANP
Abdel-Maksoud [24]Product Quality, Customer Satisfaction, On-time delivery, Employee morale, Efficiency and utilizationFramework
Yang et al. [25]Cost, Delivery Dependence, Employee, Flexibility, Quality, UtilizationAHP/ANP
Yurdakul [26]Dependability, Time, Flexibility, Quality, CostAHP
Sun [27]Manufacturing, Supply chain, Innovation, Financial, Service quality, Human ResourceAHP/Fuzzy TOPSIS
Pagone et al. [28]Cost, Quality, Environmental Sustainability, TimeFuzzy TOPSIS
Table 2. Characteristics of accepted criteria and included indicators.
CriteriaCharacteristicsIndicators
ProductionThis covers all of the manufacturing processes that take place on the shop floor. It considers the production system’s effectiveness and measures the manufacturing process efficiency.9
QualityThis is a measure of the reliability of a company’s control system, and it shows the trust level from the raw material to the finished product.18
FlexibilityCompanies try to match the variable nature of customer’s needs such that the product mix and production volumes need to be varied. For this reason, this criterion measures the manufacturing system’s flexibility performance.5
Overall WasteThis is excerpted from the Toyota Production System, which was mainly presented by Ohno Taiichi. It measures the expenses of the laboring force, time and other resources due to the inefficiency of the process or glut of inventory.10
Human ResourceThis is an imperative resource on the shop floor, even though automation facilities decrease its importance. It comprises individual performance measurement indicators as well as organizational performance measurement indicators.19
Continuous ImprovementThis is an ongoing effort to improve existing manufacturing processes and resources. Companies should encourage continuous improvement to promote manufacturing efficiency. It measures the organization wide approach to improvement activities.13
Table 3. Random Index (RI).
Attributes2345678910
RI00.580.901.121.241.321.411.451.49
Table 4. Weighted indicators considering production type.
Make to StockMake to OrderEngineer to Order
- Waste of inventory
- Rate of standardization
- Variation of process
- Rate of on-time delivery
- Rate of process comprehension
- Level of stock
- Flexibility of human resource
- Rate of on-time delivery
- Rate of process comprehension
Table 5. Example of a noticeable table of Gap and Discrepancy.
IndicatorsRelevancy and Difference Value
StrategicTacticalOperational
GapExcess in stock rate×
Rate of delegation of authority××
Cpk (Process capability index)
DiscrepancyStandardized rate0.44
Turnover rate0.29
Setup Time0.23
Table 6. Priority weights of the criteria after analytic network process (ANP).
CriteriaCriteria Weight (CW)
Strategic LevelTactical LevelOperational Level
Production0.0790.0870.089
Quality0.2070.2090.177
Flexibility0.0260.0590.077
Waste0.0610.0400.047
Human Resource0.4060.3750.300
Continuous Improvement0.2200.2300.313
Consistency0.173650.176650.10464
Table 7. Allotment table of scores of indicators in a criterion of quality after analytic hierarchical process (AHP).
IndicatorIndicator Weight (IW)Allotted Scores
StrategicTacticalOperationalStrategicTacticalOperational
Rate of process change by failure0.025××4.5××
On-time delivery compliance0.4520.1510.5264.54.34.0
Final product pass rate0.1390.5520.1765.04.33.5
Production schedule compliance rate0.203×0.1254.5×4.0
Correction measure0.0750.0850.1054.53.63.0
Inventory inspection0.0630.0490.0322.52.33.0
Rework rate××0.036××3.5
Load levelling status0.0420.16302.52.3×
Consistency0.164480.118400.20269
Table 8. Allotment of total weight criteria (TWC) of each criterion.
CriteriaTotal Weight Criteria (TWC)
Strategic LevelTactical LevelOperational Level
Production3.6584.1263.303
Quality4.3553.8173.257
Flexibility3.2643.1263.703
Waste3.7893.5613.148
Human Resource3.3523.7081.980
Continuous Improvement3.2103.1393.135
Table 9. Table of Gap analysis results.
CriteriaIndicatorStrategicTacticalOperational
QualityRate of process change by failure××
Production schedule compliance rate×
Inventory difference rate×
Standardization rate×
Overall wasteWaste of standby & allowance××
Waste of unnecessary motions×
Human resourcesTurnover rate×
Continuous improvementFrequency of production innovation activity×

