Article

Biotreatment of Poultry Waste Coupled with Biodiesel Production Using Suspended and Attached Growth Microalgal-Based Systems

by
Vasiliki Patrinou
1,
Olga N. Tsolcha
1,*,
Triantafyllos I. Tatoulis
1,
Natassa Stefanidou
2,
Marianna Dourou
3,
Maria Moustaka-Gouni
2,
George Aggelis
3 and
Athanasia G. Tekerlekopoulou
1
1
Department of Environmental Engineer, University of Patras, G. Seferi 2, 30100 Agrinio, Greece
2
School of Biology, Aristotle University of Thessaloniki, 54124 Thessaloniki, Greece
3
Department of Biology, University of Patras, 26500 Patras, Greece
*
Author to whom correspondence should be addressed.
Sustainability 2020, 12(12), 5024; https://doi.org/10.3390/su12125024
Submission received: 16 May 2020 / Revised: 11 June 2020 / Accepted: 15 June 2020 / Published: 19 June 2020

Abstract

:
Poultry litter extract (PLE) was treated using a microbial consortium dominated by the filamentous cyanobacterium Leptolyngbya sp. in synergy with heterotrophic microorganisms of the poultry waste. Laboratory- and pilot-scale experiments were conducted under aerobic conditions using suspended and attached growth photobioreactors. Different dilutions of the extract were performed, leading to different initial pollutant (nitrogen, phosphorus, dissolved chemical oxygen demand (d-COD), total sugars) concentrations. Significant nutrient removal rates, biomass productivity, and maximum lipid production were determined for all the systems examined. Higher d-COD, nitrogen, phosphorus, and total sugars removal were recorded in the attached growth reactors in both laboratory- (up to 94.0%, 88.2%, 97.4%, and 79.3%, respectively) and pilot-scale experiments (up to 82.0%, 69.4%, 81.0%, and 83.8%, respectively). High total biomass productivities were also recorded in the pilot-scale attached growth experiments (up to 335.3 mg L−1d−1). The produced biomass contained up to 19.6% lipids (w/w) on a dry weight basis, while the saturated and monounsaturated fatty acids accounted for more than 70% of the total fatty acids, indicating a potential biodiesel production system. We conclude that the processing systems developed in this work can efficiently treat PLE and simultaneously produce lipids suitable as feedstock in the biodiesel manufacture.

1. Introduction

The poultry industry generates large amounts of poultry litter (PL) rich in organic and inorganic nutrients such as carbon, nitrogen (mainly in the form of NH4+), phosphorus, potassium and calcium [1,2]. Traditionally poultry faeces are applied to soils as organic fertilizers. However, improper management and over-application may lead to the accumulation of various salts or metals (heavy metals contamination) or run-off into surface waters potentially causing eutrophication [3]. Inadequate treatment raises serious concerns for regional communities (odors, dust, and emission of ammonia) since leaching and runoff can result not only in contamination of surface water, but also of groundwater resources, thereby threatening public health. Nevertheless, PL can be used as a rich nutrient source for microalgae/cyanobacteria cultivation, while the produced biomass can serve as a biofuel feedstock [4]. Microalgal/cyanobacterial systems are considered for the treatment of municipal, industrial, and agro-industrial waste and wastewater, effluents from food processing factories, and manure wastes [5,6]. Despite the high interest of such systems, limited research has been carried out on the treatment of PL that comprises a mixture of manure, residual feed, bedding materials, feathers, and broken eggs [3]. Only a few studies have used PL as growth substrate for the cultivation of microalgae or cyanobacteria (Table S1). Additionally, limited research has been performed on PL extract (PLE) derived after sun drying, blending, and soaking the poultry faeces [7,8,9,10,11,12]. According to Table S1, pretreatment methods of PL including sterilization, centrifugation, dilution, or hydrolization are frequently applied to produce more favorable conditions that promote algal growth. It should be mentioned that most research applies poultry effluents after anaerobic digestion (ADE) and most of them use mainly Chlorella-based systems in laboratory-scale suspended growth systems [2,3,4,11,13,14,15,16,17,18].
Despite technological progress, the major drawback reducing the broad application of microalgae is the high cost of producing and collecting the algal biomass as well as extracting the valuable products [19,20]. Microalgal biomass can be used as third-generation feedstock due to the presence of adequate amounts of triglycerides (TAGs) that are suitable for biodiesel production [21,22]. Many studies conclude that microalgae cultivation to produce various by-products is unsustainable unless coupled with wastes as growth substrates [20,23]. Specific wastes can be a suitable growth medium for microalgal cultivation as they provide abundant biomass at low cost, without requiring additional nutrient input [24]. Therefore, waste recycling and biofuel production can be combined to significantly reduce operation costs.
The majority of microalgal cultivation systems possess open ponds or closed photobioreactors where algal cells are in suspension [25]. However, during the last decade, attached cultivation systems based on biofilms have gained considerable attention [26,27,28]. During biofilm formation, the microalgae release some soluble products (proteins, polysaccharides) into the culture medium while bacteria excrete extracellular polymeric substances [13,29,30] that act as a kind of “glue” and bind the cells to a certain solid support material or surface or fasten the cells together [26]. Attached cultivation systems can offer several advantages over conventional cultivation techniques in which microalgae are suspended in liquid medium, including higher biomass productivity, higher wastewater treatment efficiency, better light availability, and easier harvesting [26,28]. Biomass productivity can be affected by the surfaces of the support material provided for biofilm growth. Support materials must be chosen according to their physicochemical properties as well as their cost [31] and, typically, must have resistance to moist and salinity. The used materials also need to withstand physical forces in case of mechanical harvest, and present durability in long-term operations [25]. According to the bibliography, various support materials with different surface areas have been examined, including plates of polycarbonate and polyethylene, nylon, or stainless steel mesh, synthetic polymers (polystyrene foam, fabric, sponge cotton, plastic), glass rods, Teflon, silicon, and acrylic materials [27,31,32,33,34,35]. Specifically, the use of polystyrene foam, cardboard, polyethylene fabric, loofah sponge, or PVC plastic sheets can lead to biomass productivities of 2.57, 1.47, 0.58, 1.28, and 7.70 g m−2 d−1, respectively [33,36].
Taking into account the necessity of PLE treatment and the development of agro-industrial treatment systems (suspended or attached), it is apparent that the pairing PLE treatment and energy production is a very promising approach to handle these two challenges. Microalgae offer great potential as a third-generation biofuel feedstock, especially when grown on wastewater, as they have dual application for wastewater treatment and biofuel production. In particular, indigenous microalgae isolated from treated wastewaters can adapt and grow better than other commercially available algal strains. Leptolyngbya is a filamentous cyanobacterium species that is indigenous to several wastes and a very good candidate for biological treatment of agro-industrial wastes mainly due to their ability to sustain adverse environmental conditions.
In the present study, a Leptolyngbya-based microbial consortium (isolated from wastewater) was applied to treat PLE and simultaneously produce biodiesel using laboratory- and pilot-scale photobioreactors. To the best of our knowledge, PLE has not previously been treated by a cyanobacterial-bacterial consortium, nor have attached growth systems been used for this process. Laboratory- and pilot-scale experiments were conducted in suspended and attached growth systems to study their ability to remove organic load and nutrients in different photobioreactors at various operating conditions and simultaneously producing lipids for biodiesel. Biomass productivity, nutrient removal efficiency, and lipid content were determined and the Leptolyngbya-based microbial community was analyzed microscopically.

2. Materials and Methods

2.1. Characterization of Poultry Litter Extract (PLE)

PL was collected from an egg-laying chicken’s small poultry farm located around the city of Agrinio (western Greece). PL obtained in different seasons and at different times of the day with a view to examine a variety of unit’s operating conditions. A net was used to collect the faeces, while feathers and other bedding materials were avoided as much as possible. The litter was sun dried for 48h and then wet milled with tap water (15% w/v). After tulle netting filtration, the resulting poultry litter extract (PLE) was used in all the experiments. The physicochemical composition of the PLE is presented in Table S2.

2.2. The Microbial Consortium Used in the PLE Treatment and Treatment Conditions

A microbial consortium obtained from the secondary treatment tank of the municipal wastewater treatment plant of Agrinio city was used as inoculum for PLE treatment. The consortium was cultivated phototrophically under aerobic and stable conditions of continuous illumination (24/24 with fluorescent lamps 200 μmol m−2 s−1, 25–29 W m−2), temperature at 26 ± 2 °C, stirring with mini centrifugal air pumps (flow rate 380 L h−1), using a chemical substrate as a growth medium. The chemical medium consisted of (in g L−1): 0.2 KNO3, 0.1 MgSO4·7H2O, 0.05 CaCl2·2H2O, 0.108 K2HPO4, and 0.056 KH2PO4. The established cyanobacterial-based consortium (stock culture) was preserved phototrophically at rectangular glass aquariums of 5L working volume.
In all PLE treatment experiments (laboratory- or pilot- scale in suspended or attached growth photobioreactors), an inoculum of stock culture of concentration 75.1 ± 17.5 mg L−1 was added to all the growth media tested, employing the same conditions used for the stock culture (24/24 light, T = 26 ± 2 °C), under non-aseptic conditions. Initial pH was adjusted to 7.2 ± 0.3 using a 5 M NaOH solution. Throughout the bioprocess, pH values ranged from 7 to 9, suitable for phototrophic, mixotrophic, and heterotrophic growth.
Microscopy of the stock culture revealed the abundance of the filamentous cyanobacterium Leptolyngbya sp., which accounted for about 95% of the population, while a green coccoid alga accounted for the rest of the phototrophic biomass. The green coccoid alga was a Choricystis-like chlorophyte (Trebouxiophyceae) present as 5–8 μm cell length, round to bean-shaped, solitary cells. Choricystis-like green alga has been previously used for treatment of second cheese whey effluents by Tsolcha et al. [37]. The photosynthetic microorganisms present in the stock population were determined using inverted epifluorescence microscopy as described in Tsolcha et al. [38].
Increased levels of both organic and inorganic nutrients may have some toxic or negative effects on algal/cyanobacterial growth [18]. Therefore, considering the high nutrient levels and the intensive turbidity of the undiluted PLE (Table S2) that could inhibit light penetration and minimize or restrict the photosynthetic activity of cyanobacterial/algal cells, the PLE was diluted before application. Experiments were performed using different dilutions of PLE. The dilution range was achieved by using as less fresh water as possible to allow the phototrophic growth of Leptolyngbya consortium and examine different initial pollutant concentrations on PLE treatment for lab- and pilot-scale growth PBRs. Initial pollutant concentrations of the diluted PLE used in the laboratory- (LP) and pilot-scale (PP) experiments in the suspended (S) and attached (A) growth systems are presented in Table 1. Specifically, LP-S1,-S2,-S3 and LP-A1,-A2,-A3 correspond to laboratory-scale experiments in suspended and attached growth photobioreactors, respectively, while PP-S1,-S2,-S3,-S4 and PP-A1,-A2,-A3 correspond to pilot-scale experiments in suspended and attached growth systems, respectively. Control tests were also conducted using chemical media (C) in all the tested photobioreactors (PBR).

2.3. Experimental Set up

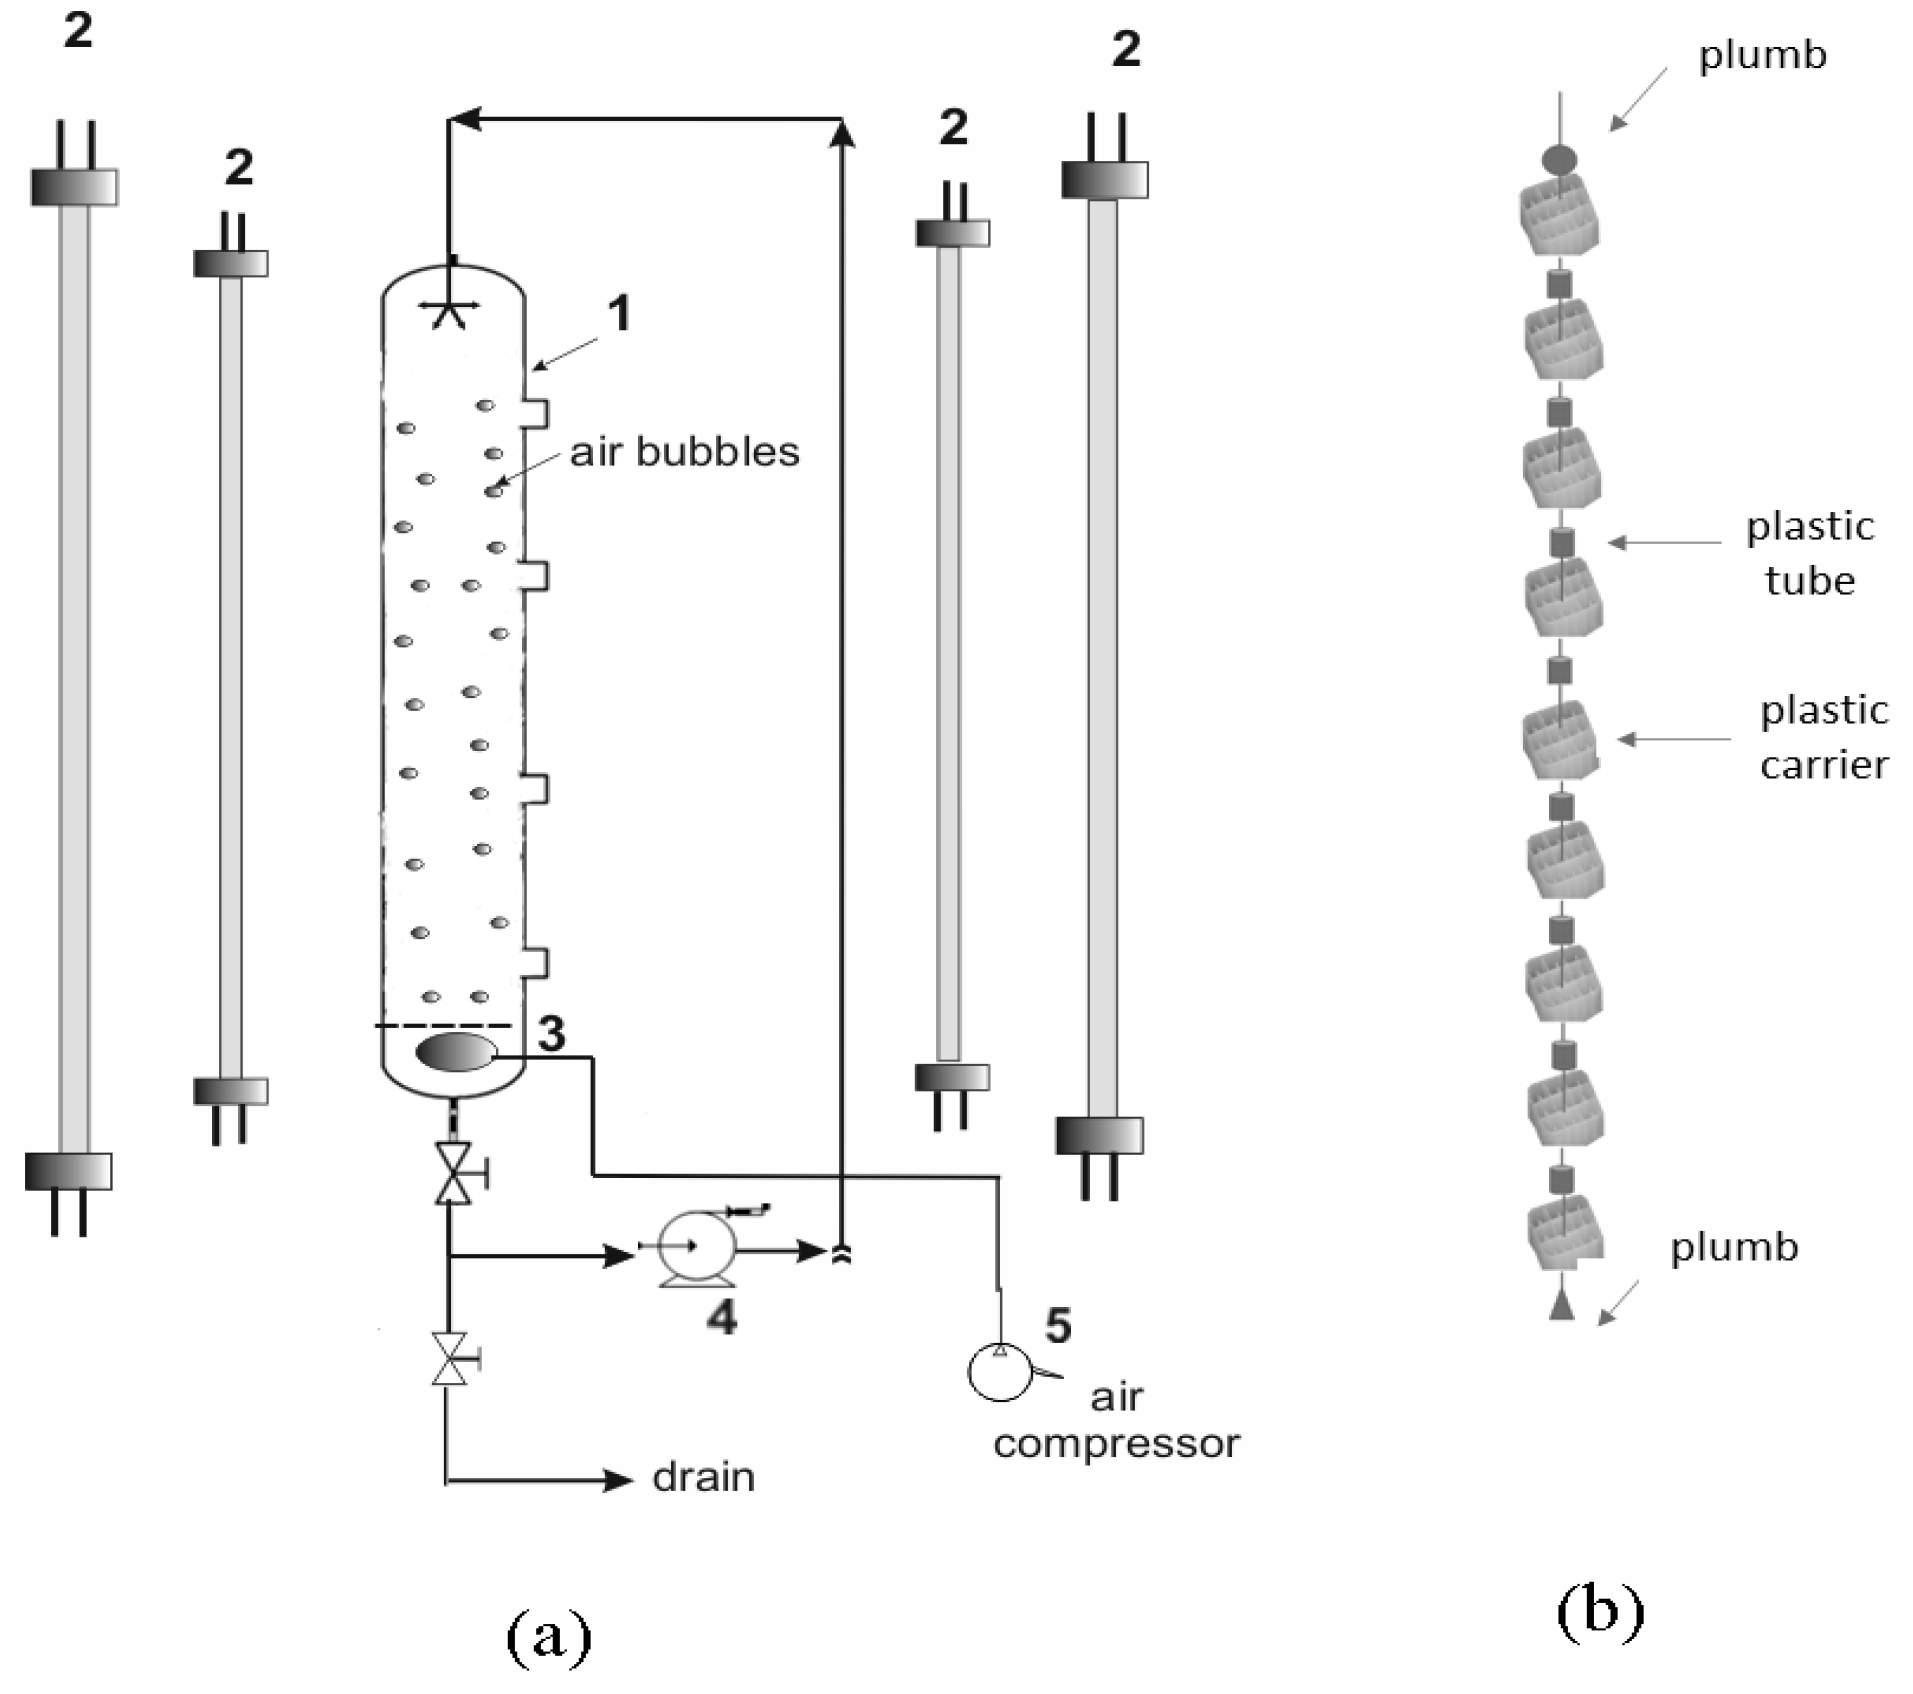
2.3.1. Laboratory-Scale Photobioreactors

The PBR used for suspended growth experiments was a rectangular aquarium with a working volume of 3.5 L and dimensions 29 × 10 × 15 cm (length × width × height). Recirculation of the medium was provided by a submerged centrifugal mini air pump (flow rate 380 L h−1) [39].
In the attached growth systems, a metallic grid was placed on top of the aquariums to support 36 transparent, cylindrical, glass rods in a vertical position. A scheme of the reactor is available in Economou et al. [40]. Each rod had a diameter of 0.5 cm providing a total surface area of 19.04 cm2 suitable for microbial attachment. The transparent glass rods and their vertical positioning allowed the light to penetrate across the whole PBR. The flow rate of the substrate medium was adjusted to 50 L h−1 to allow cells to attach onto the rods and the PBR walls [27,40].

2.3.2. Pilot-Scale Photobioreactors

As the experiments aimed to treat high volumes of PLE, a scale-up from laboratory-scale testing to pilot-scale site remediation was performed. The pilot-scale PBR used in the suspended growth process was a vertical, tubular, column of 167 cm in height with an internal diameter of 9 cm. The overall volume of the reactor was 11.0 L, while the working volume was 9.0 L (height of 127 cm) (Figure 1a). As mentioned in Section 2.2, the light intensity and temperature used in these experiments were the same as those used for the stock culture and the laboratory experiments. A recirculation flow rate of 1 L min−1 was applied using a recirculating pump to achieve homogeneity in the reactor. Since only the top of the column was open to the atmosphere and oxygen levels within the reactor were inadequate for microbial growth, an air pump connected to a diffuser was attached to the bottom of the PBR to provide an air supply.
A similar PBR was also used for the pilot-scale attached-growth experiments but with the addition of a support material. A combination of cubic plastic biofilm carrier (Type BWT-X, protected surface 650 m2/m3) and transparent plastic air tubes (Rislan PA11) was chosen as the support material. The biofilm carrier and air tubes were strung onto a fishing line as shown in Figure 1b. The stability was ensured with two plumbs, on top and at the bottom of the fishing line. Biofilm carriers and air tubes were fastened alternately onto the line until 55 carriers and 54 air tubes reached the working height of 127 cm. Each plastic carrier (14.5 × 14.5 × 8.22 mm) provided a surface area of 17.3 cm2 and each cylindrical air tube (1.5 cm height, external diameter 7.0 mm) provided a surface area of 128 cm2. The total surface area of each complete support media line was 1130 cm2. Six or more support media lines were placed inside the PBR depending on its predicted operational time.

2.4. Analytical Procedures

Samples (50–100 mL) were collected daily from all experiments and analyzed for different parameters. For the suspended growth systems, each sample was initially centrifuged at 4200 rpm for 20 min. The supernatant was separated and collected for chemical analysis while the biomass was harvested from the bottom of the centrifuge tubes.
In the attached growth systems, both attached and suspended microbial biomass was estimated from each experimental set. Attached biomass was harvested by scraping two randomly selected glass rods from the laboratory-scale PBRs or one random line in the pilot-scale PBRs. At the end of each experimental set, the biomass that had attached to the walls of the PBR was also harvested. Additionally, for the determination of suspended biomass, samples of 50 mL from the laboratory-scale PBR and 500 mL culture volume from the pilot-scale PBR were collected daily and centrifuged at 4200 rpm for 20 min. In the attached growth PBRs, total biomass was determined as the sum of suspended and attached biomass.
After harvesting, the biomass of each experiment was dried at 105 °C until constant weight. Dry biomass weight (DW), i.e., the sum of phototrophic and heterotrophic biomass, was determined gravimetrically as total suspended solids (TSS) according to APHA [41]. Biomass productivity (P) is expressed as mg DW L−1 d−1 and was calculated by the variation in biomass concentration through time according to Gonçalves et al. [42]. The maximum microbial specific growth rate (μ), as well as the nutrient removal efficiencies, were calculated according to Tsolcha et al. [38]. Total sugars were measured according to DuBois et al. [43] while the concentrations of total nitrogen (TN), NO3-N, NO2-N, orthophosphate (PO43−), and dissolved oxygen demand (d-COD) were determined in the supernatant following APHA [44].
Lipid content was also examined. Lipids were extracted from the dry biomass following Folch’s method using methanol (2:1 v/v) as solvent chloroform [45]. The extracted lipids were washed with 0.88% (w/v) KCL solution to separate proteins and other non-lipid components. The extract was then dried over anhydrous Na2SO4 and left to evaporate until the solvent dissipated entirely. After evaporation, the remaining oil was determined gravimetrically and the lipid yields were expressed as a percentage of the dry cell weight (% DWC) [46]. Fatty acid lipid profiles were obtained as fatty acid methyl esters (FAMES) using gas chromatography following AFNOR [47]. The apparatus was equipped with a HP-88 112-8867 capillary column (60 m length, internal diameter 0.32 mm) and helium as the gas carrier (flow rate 1 mL min−1). The analysis was conducted at 200 °C and the fatty acids were detected in an FID detector operating at 280 °C. FAME peaks were identified using known standards of fatty acid methyl esters.

2.5. Statistical Analysis

All experimental sets were performed in duplicate and the results are presented as mean values ± standard deviation (SD). Standard deviations are presented in the figures by error bars. Mean values derived from two samples taken from two different bioreactors with the same operating conditions. Statistically significant differences of physicochemical parameters, biomass production, and lipid yields were analyzed using one-way ANOVA analysis of variance. A value of p ≤ 0.05 was considered statistically significant.

3. Results and Discussion

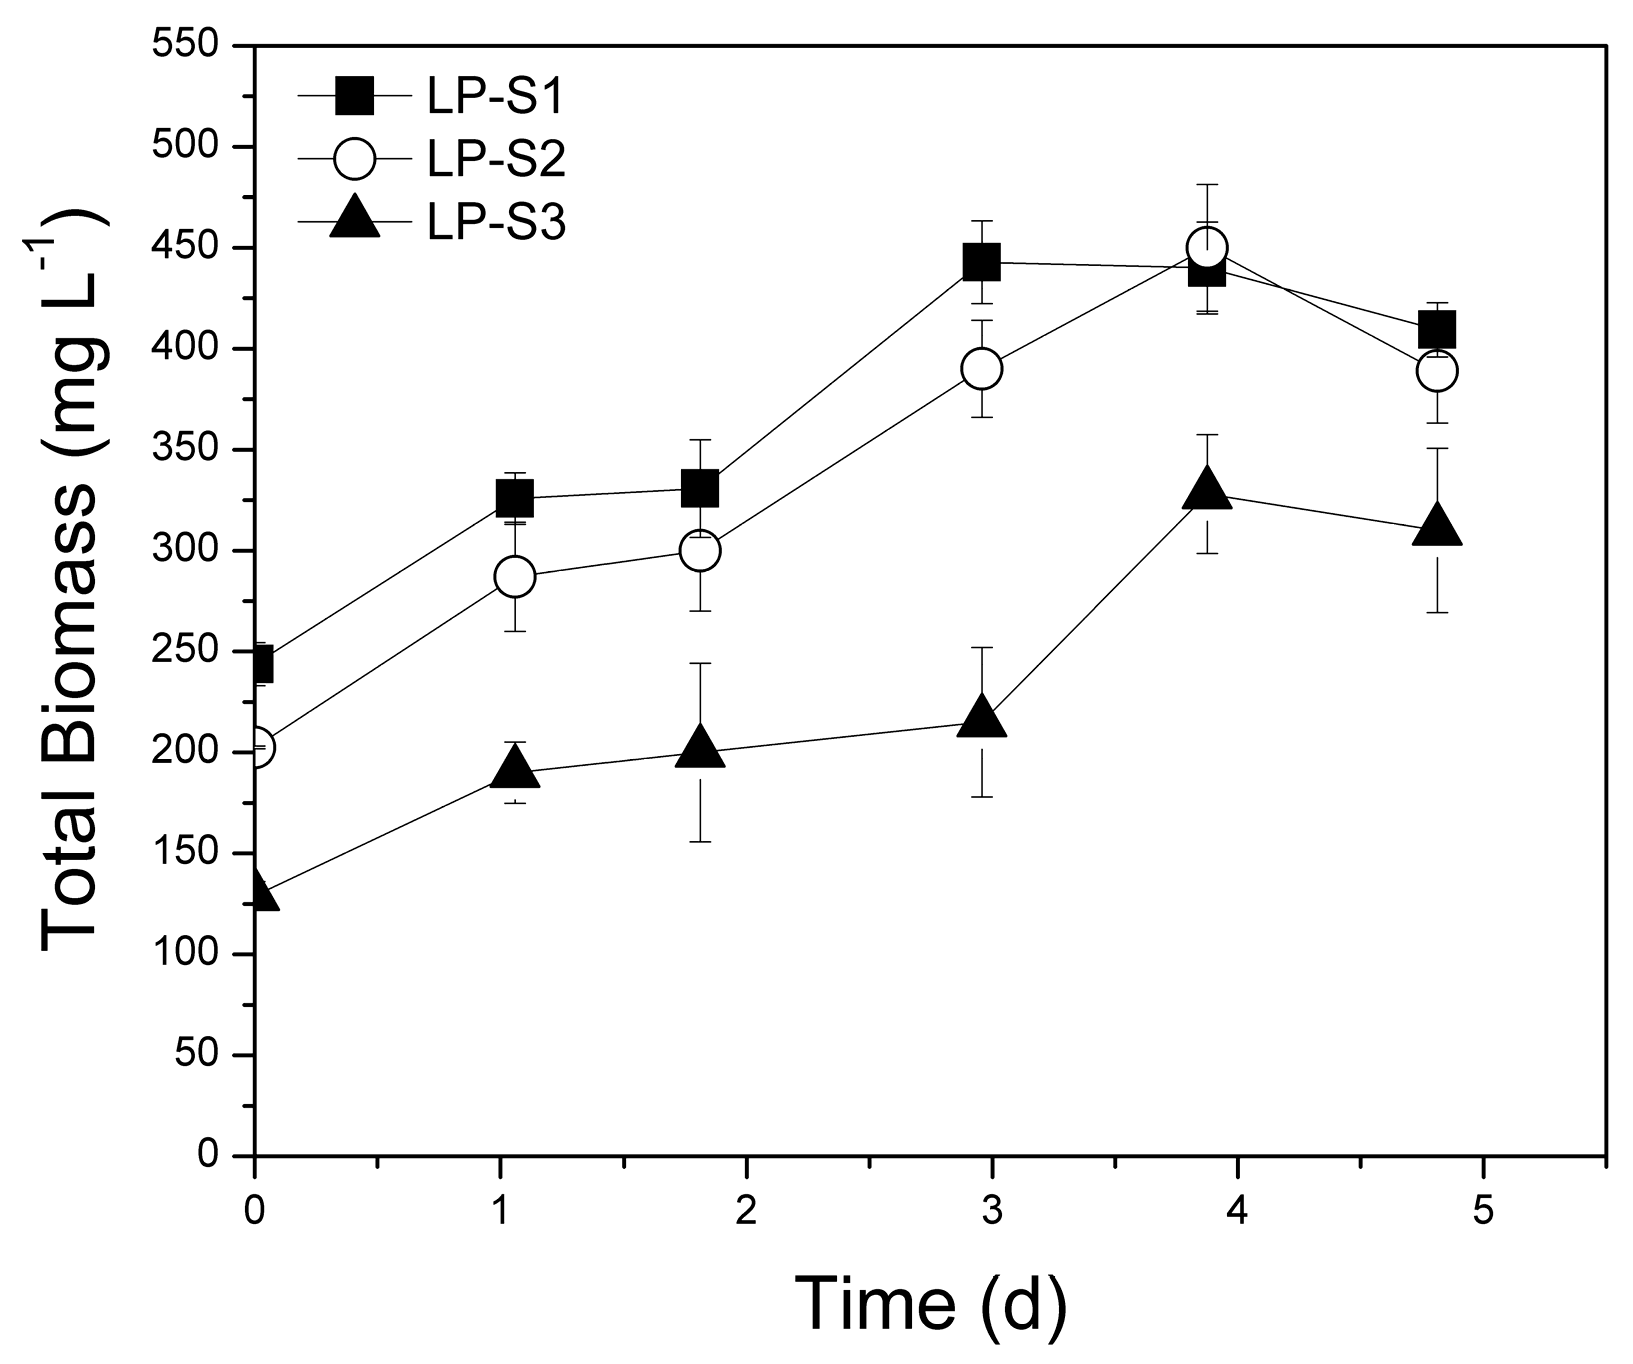
3.1. Laboratory-Scale Suspended Growth System

3.1.1. Biomass Production

Batch kinetic experiments were performed in laboratory-scale suspended PBRs using inoculum from stock culture and unsterilized PLE appropriately diluted with tap water to three different dilution ratios to achieve different initial pollutant concentrations (Table 1). Dilution was performed to achieve initial d-COD concentrations about 2000, 1000, and 500 mg L−1 for the experiments S1, S2, and S3, respectively. Following inoculum addition, a mixed consortium established itself, forming aggregates of phototrophic and heterotrophic microorganisms. It should be noted that experiments with initial d-COD concentrations exceeding 2500 mg L−1 could not be conducted because the high nutrient levels and turbidity of the PLE significantly inhibited light penetration into the PBR and the photosynthetic activity of the cyanobacterial/algal cells, which could lead to the dominance of only heterotrophic microorganisms.
Figure 2 presents the evolution of total biomass recorded. Biomass productivity ranged from 111.0 to 198.9 mg L−1 d−1 (Table 2) with maximum biomass productivity recorded in the LP-S2 set, which had a high N:P ratio (Table 1). It is known that biomass production is highly dependent on C:N:P ratios. Some reports indicate that a combination of high N and low P leads to enhanced biomass production and nutrient removal while the optimum N:P ratio recorded within the range of 8.2:1–45:1 [48,49]. However, it is generally accepted that the favorable N:P ratio is strain specific [50].
A review of research on poultry waste treatment (Table S1), shows that the biomass productivities achieved in this study are among the highest recorded [2,13], even though the majority of these works used extensively pretreated PL. In addition, the productivity of 198.9 mg L−1 d−1 greatly surpassed productivities recorded in studies using Chlorella or Scenedesmus species [4,13]. Tsolcha et al. [27,38,39] also recorded productivities similar to those of the present study (62-332 mg L−1 d−1), however they applied Leptolyngbya sp. culture for the treatment of other wastes such as dairy, winery, and raisin wastewater. Khemka and Saraf [51] also examined Leptolyngbya sp. as in the present study and reached biomass productivity approximately 90 mg L−1 d−1 by treating dairy wastewater. It is noteworthy that suspended biomass productivities achieved using PL as substrate exceed the productivity values recorded in other studies using microalgal-bacterial communities to treat raw municipal [52], secondary effluents of municipal [53], aquaculture, manure, and chemical industry wastewaters [54] (24.5, 30.0, 109.0, 98.0, 122.0 mg L−1 d−1, respectively).
The biomass specific growth rates of the suspended growth experimental sets reached 0.260 d−1 (LP-S1) surpassing the rates recorded in studies that used PLE or ADE poultry manure (Table S1). The control experiment (LC-S) using inoculum of stock culture and chemical medium as substrate (with the same initial total nitrogen and phosphorus concentrations as set LP-S2 that presented the highest biomass productivity) showed lower productivity (47.2 mg L−1 d−1) than that of set LP-S2 (and sets LP-S1 and LP-S3), thus proving that the cyanobacterial/bacterial enhanced biomass productivity. This was also observed by Ma et al. [55] in raw and autoclaved centrate wastewaters. Ma et al. [55] concluded that bacterial presence in raw centrate wastewater assisted algal growth and recorded a maximum biomass concentration of 2.0 g L−1. No statistically significant differences were observed between sets LP-S1, LP-S2, and LP-S3 (p = 0.079), although differences in biomass productivity were noted between sets LP-S1 and LP-S2 (p = 0.048) and sets LP-S2 and LP-S3 (p = 0.009).

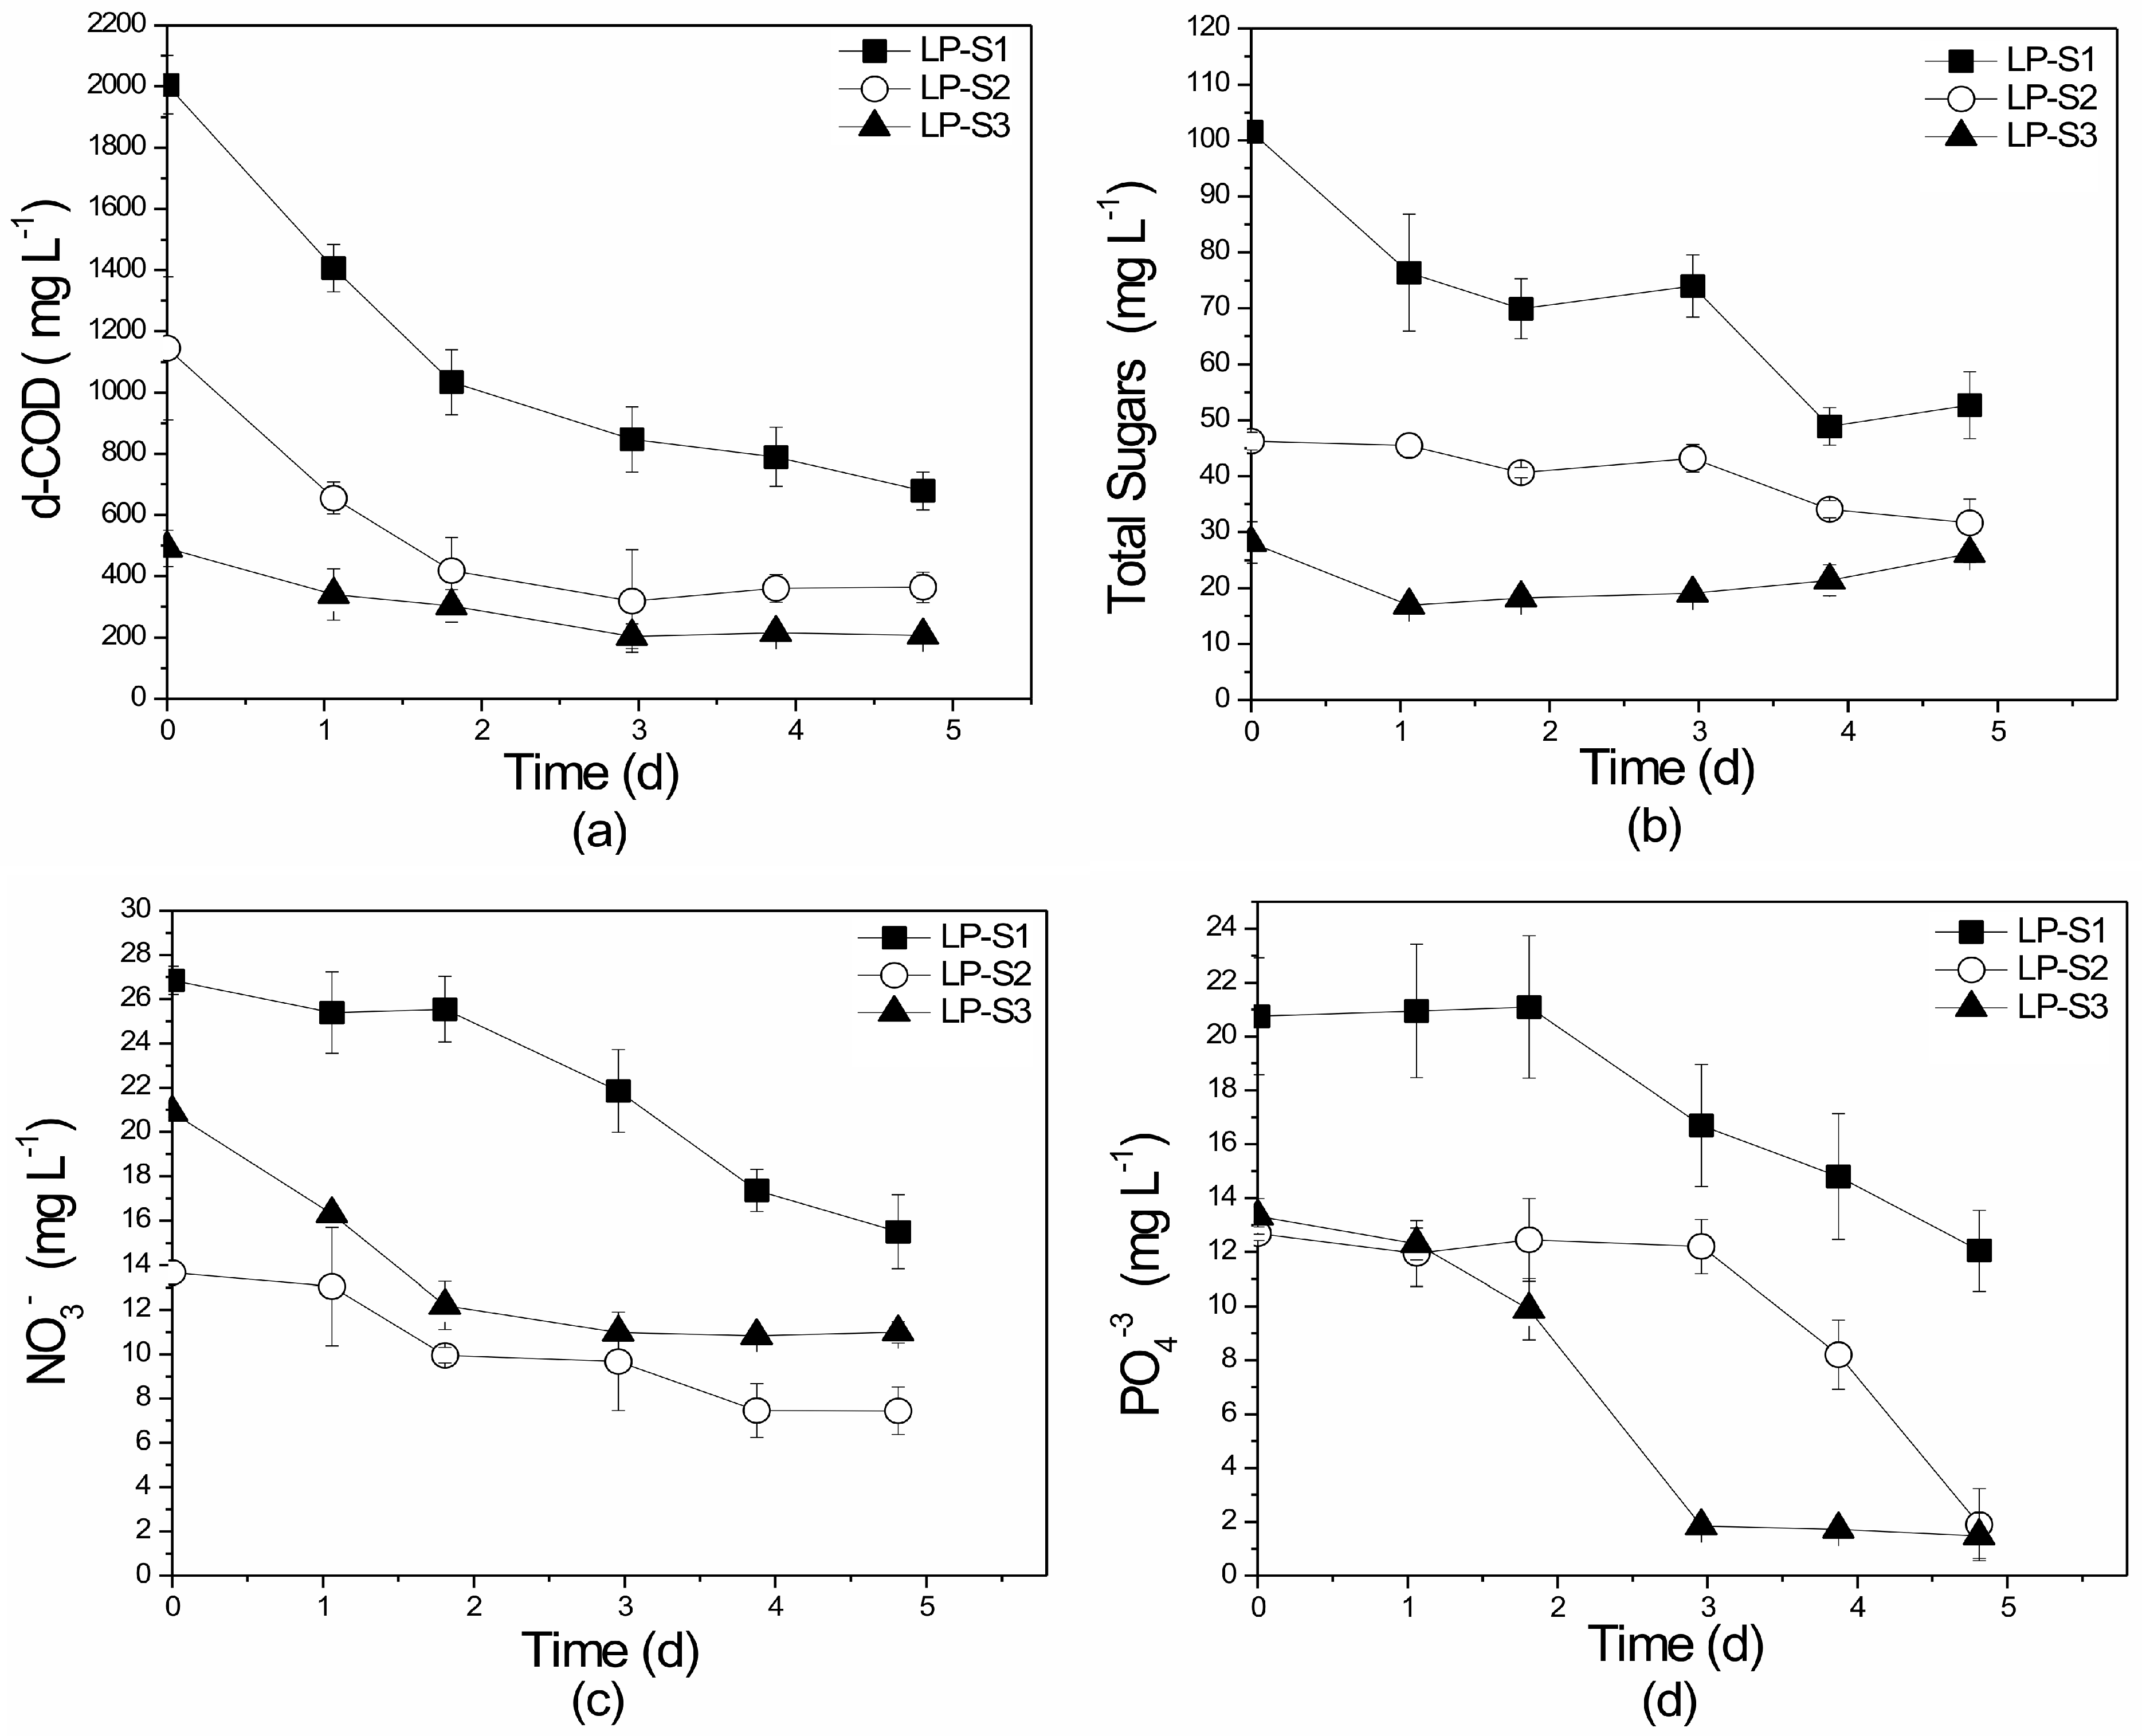
3.1.2. Nutrient and Organic Load Removal

The established consortium was also tested for its ability to remove organic and inorganic pollutant load from the substrates. In the suspended laboratory-scale experiments, the initial organic load, expressed by d-COD, ranged between 491.6 and 2005.5 mg L−1. In all sets, d-COD reduction was achieved within five days of treatment with uptake rates ranging from 58% to 68% (Figure 3a). The sharp decline in d-COD concentrations observed during the first day of all experiments is attributed to the rapid metabolism of the heterotrophic microorganisms. Statistically significant differences were not reported between sets LP-S1, LP-S2, LP-S3 (p = 0.092). As shown in Table S1, d-COD reduction has not been thoroughly examined in studies using poultry wastes, however the few removal rates recorded [2,3] are within the range of those of the present work. It should be mentioned that Leptolyngbya sp—bacteria cultures used for the treatment of other agro-industrial wastewaters [38] presented higher d-COD removal rates of between 88.7% and 94.0%.
Total sugars decreased through time due to heterotrophic metabolism. The highest total sugar removal of 48% (Figure 3b) was observed in set LP-S1 (the less diluted PLE), while lower percentage removals were recorded in the more diluted PLE. Statistically significant differences in total sugars removal were observed between experiments sets LP-S1, LP-S2, and LP-S3 (p = 0.024).
Nutrient removal efficiencies are presented in Figure 3c,d. Nitrate-nitrogen (NO3-N) removal efficiency was approximately 45% in all suspended growth experiments. However, the control experiment (LC-S) presented a higher NO3-N removal percentage of 75.2% (Table 2). This can be attributed to better light distribution within the reactor containing chemical media compared to those containing PLE substrates that are darker in color and have higher turbidity. It is worth mentioning that NO3-N assimilation is an energy-linked process, as also concluded by Tsolcha et al. [27]. In addition, no statistically significant differences were recorded for NO3-N removal between the LP-S1, LP-S2, and LP-S3 sets (p = 0.249).
Regarding nitrite (NO2-N), concentrations were constantly below 0.1 mg L−1 in all the laboratory-scale suspended growth experiments. TN presented higher removal rates (51.2–80.5%) than those of nitrates mainly because TN is assimilated by both the phototrophic and heterotrophic microorganisms (Table 2).
No statistically significant differences in TN removal were observed between sets LP-S1, LP-S2, and LP-S3 (p = 0.833). In the study of Bhati and Mallick [10], PLEs yielded a maximum NO3-N removal of 96-100%, higher than the values reported in the present study, however a different cyanobacterium (Nostoc muscorum) was applied. Khemka and Sarraf [51] dealt with the treatment of dairy wastewater using a Leptolyngbya sp. culture and recorded NO3-N and TN removals of 61.2% and 52.3%, respectively, which are lower than those recorded in the present study. It is noteworthy that the majority of research works applying microalgal/cyanobacterial-indigenous wastewater bacteria consortia commonly treat municipal wastewaters [55,56,57].
Orthophosphate (PO4−3, OP), as an important building material for macronutrients, is the most preferred and assimilated form of phosphorus by all microbial communities and is usually the limiting growth factor. For this reason, orthophosphates exhibited higher removal rates (up to 94.5%) than nitrates (about 45%) (Figure 3c). Statistically significant differences were not observed between experimental sets LP-S1, LP-S2, and LP-S3 (p = 0.095). Most of the available research studies treating poultry waste (Table S1) exhibit PO4−3 removals higher than 91%, a value similar to that recorded in the present study. Significant removal rates were recorded (95–99%, 92–98%) even in studies that applied lower initial PO4−3 concentrations (9.5, 16.3 mg L−1) [10,12]. Additionally, OP percentage removals achieved here were higher than those recorded by Tricolici et al. [58] (42%) and Su et al. [59] (64.8%) during the treatment of dairy and municipal wastewater using an algal-bacterial consortium.

3.2. Laboratory-Scale Attached Growth System

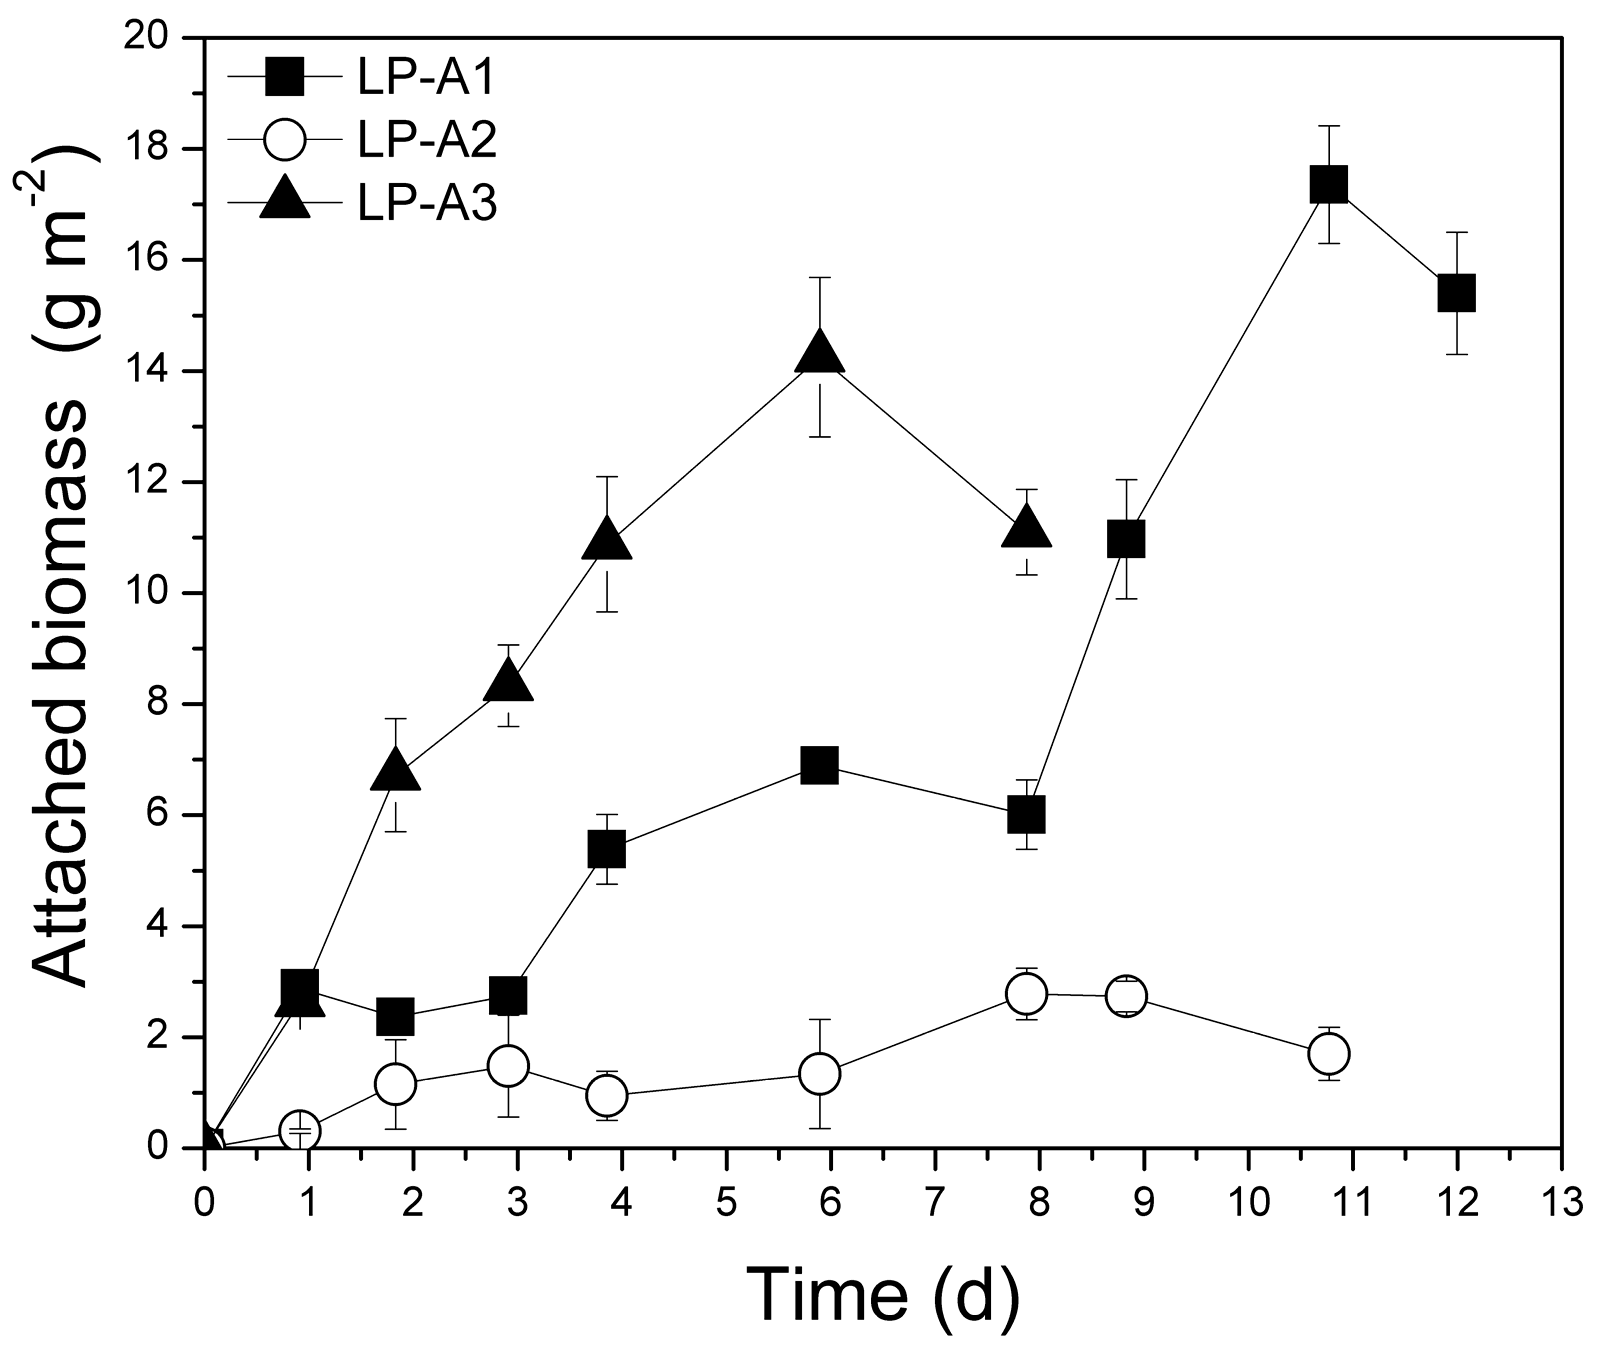
3.2.1. Biomass Production

The purpose of these experiments was to develop an attached photobioreactor system (using glass rods as support material to provide long-term operation conditions, allow light penetration, and facilitate biomass harvesting) and a robust mixed microbial consortium able to grow on PLE and efficiently remove organic load and nutrients. A series of batch kinetic experiments was performed using unsterilized PLE with initial d-COD concentrations similar to those examined in the suspended laboratory-scale growth systems. Following the addition of the inoculum into the attached growth PBR, a mixed consortium established and formed biofilm on the glass rods and PBR walls, indicating that the added microorganisms may have a synergistic relationship. Figure 4 presents the evolution of the attached biomass during all experiments conducted. Attached biomass productivities of the experimental sets ranged from 2.9 g to 5.2 g m−2 d−1, while specific growth rate values ranged from 0.140 to 0.187 d−1 (Table 2).
Although the data in the literature concerning the treatment of poultry waste with microalgae are not directly comparable, as all research was undertaken in suspended growth systems with different microalgal strains and operational conditions, the maximum specific growth rate (i.e., 0.187 d−1) observed in this study for the experiment LP-A1 (Table 2) is among the highest recorded in the literature for poultry litter (Table S1). Tsolcha et al. [27] studied a similar attached growth system (with glass rods as support material and Leptolyngbya sp.), however for the treatment of raw agro-industrial wastewaters such as dairy, winery, and mixed winery and raisin effluents. Tsolcha et al. [27] observed attached biomass productivities of about 1.23–5.03 g m−2 d−1, which are in the range of those reported in the present study (2.9–5.2 g m−2 d−1). Glass rods were also examined by Economou et al. [40] for the treatment of synthetic wastewater using Limnothrix sp., however much lower biomass productivities were reported (up to 1.11 g m−2 d−1). Leptolyngbya sp. in attached growth systems (mesh or marble slab incubators) was also autotrophically cultivated by Singh et al. [60] and Singh and Thakur [61] achieving maximum biomass productivities only up to 2.0 g m−2 d−1 and 2.93 g m−2 d−1, respectively.
It was observed that similar N:P ratios (near 6:1) for LP-A2 and LP-S2 yielded the maximum biomass productivity among all the LP-A (169.6 mg L−1 d−1) and all the LP–S experimental sets (198.9 mg L−1 d−1), respectively. It should be mentioned that experiments with initial d-COD concentrations above 2500 mg L−1 could not be conducted in the laboratory-scale attached growth PBR because the high organic matter levels and turbidity of the PLE significantly inhibited light penetration and consequently the activity of the cyanobacterial/algal cells.
Biomass production in attached growth systems depends on a variety of parameters (e.g., selected algal species, substrate properties, nutrient concentrations, operating conditions, attachment materials used etc.), therefore a wide range of biomass productivity values has been reported (1–30 g m−2 d−1) [25]. Support material is one of the most important parameters since for commercial use, materials should be inexpensive, water resistant, long-lived, low in weight, easy to inoculate, and able to maintain sufficient microorganisms for a fresh round of re-growth after harvesting [27]. The glass rods examined in this study fulfill many of the above-mentioned characteristics. In fact, the salts coating the surface of the glass rods create better adherence conditions for biofilm formation. Additionally, the rods are hard-wearing and do not need to be replaced. The filamentous cyanobacterium Leptolyngbya sp. in combination with the indigenous heterotrophic microorganisms of the PLE formed aggregates and showed a natural tendency to settle and to attach themselves to the immobilized material.
Statistically significant differences of total biomass productivities were observed between LP-A1, A2, and A3 experimental sets (p = 0.016). Significant differences were also detected between LP-S1 and LP-A1 (p = 0.013), while no differences were observed between LP-S2 and LP-A2 (p = 0.181) and LP-S3 and LP-A3 media (p = 0.056).

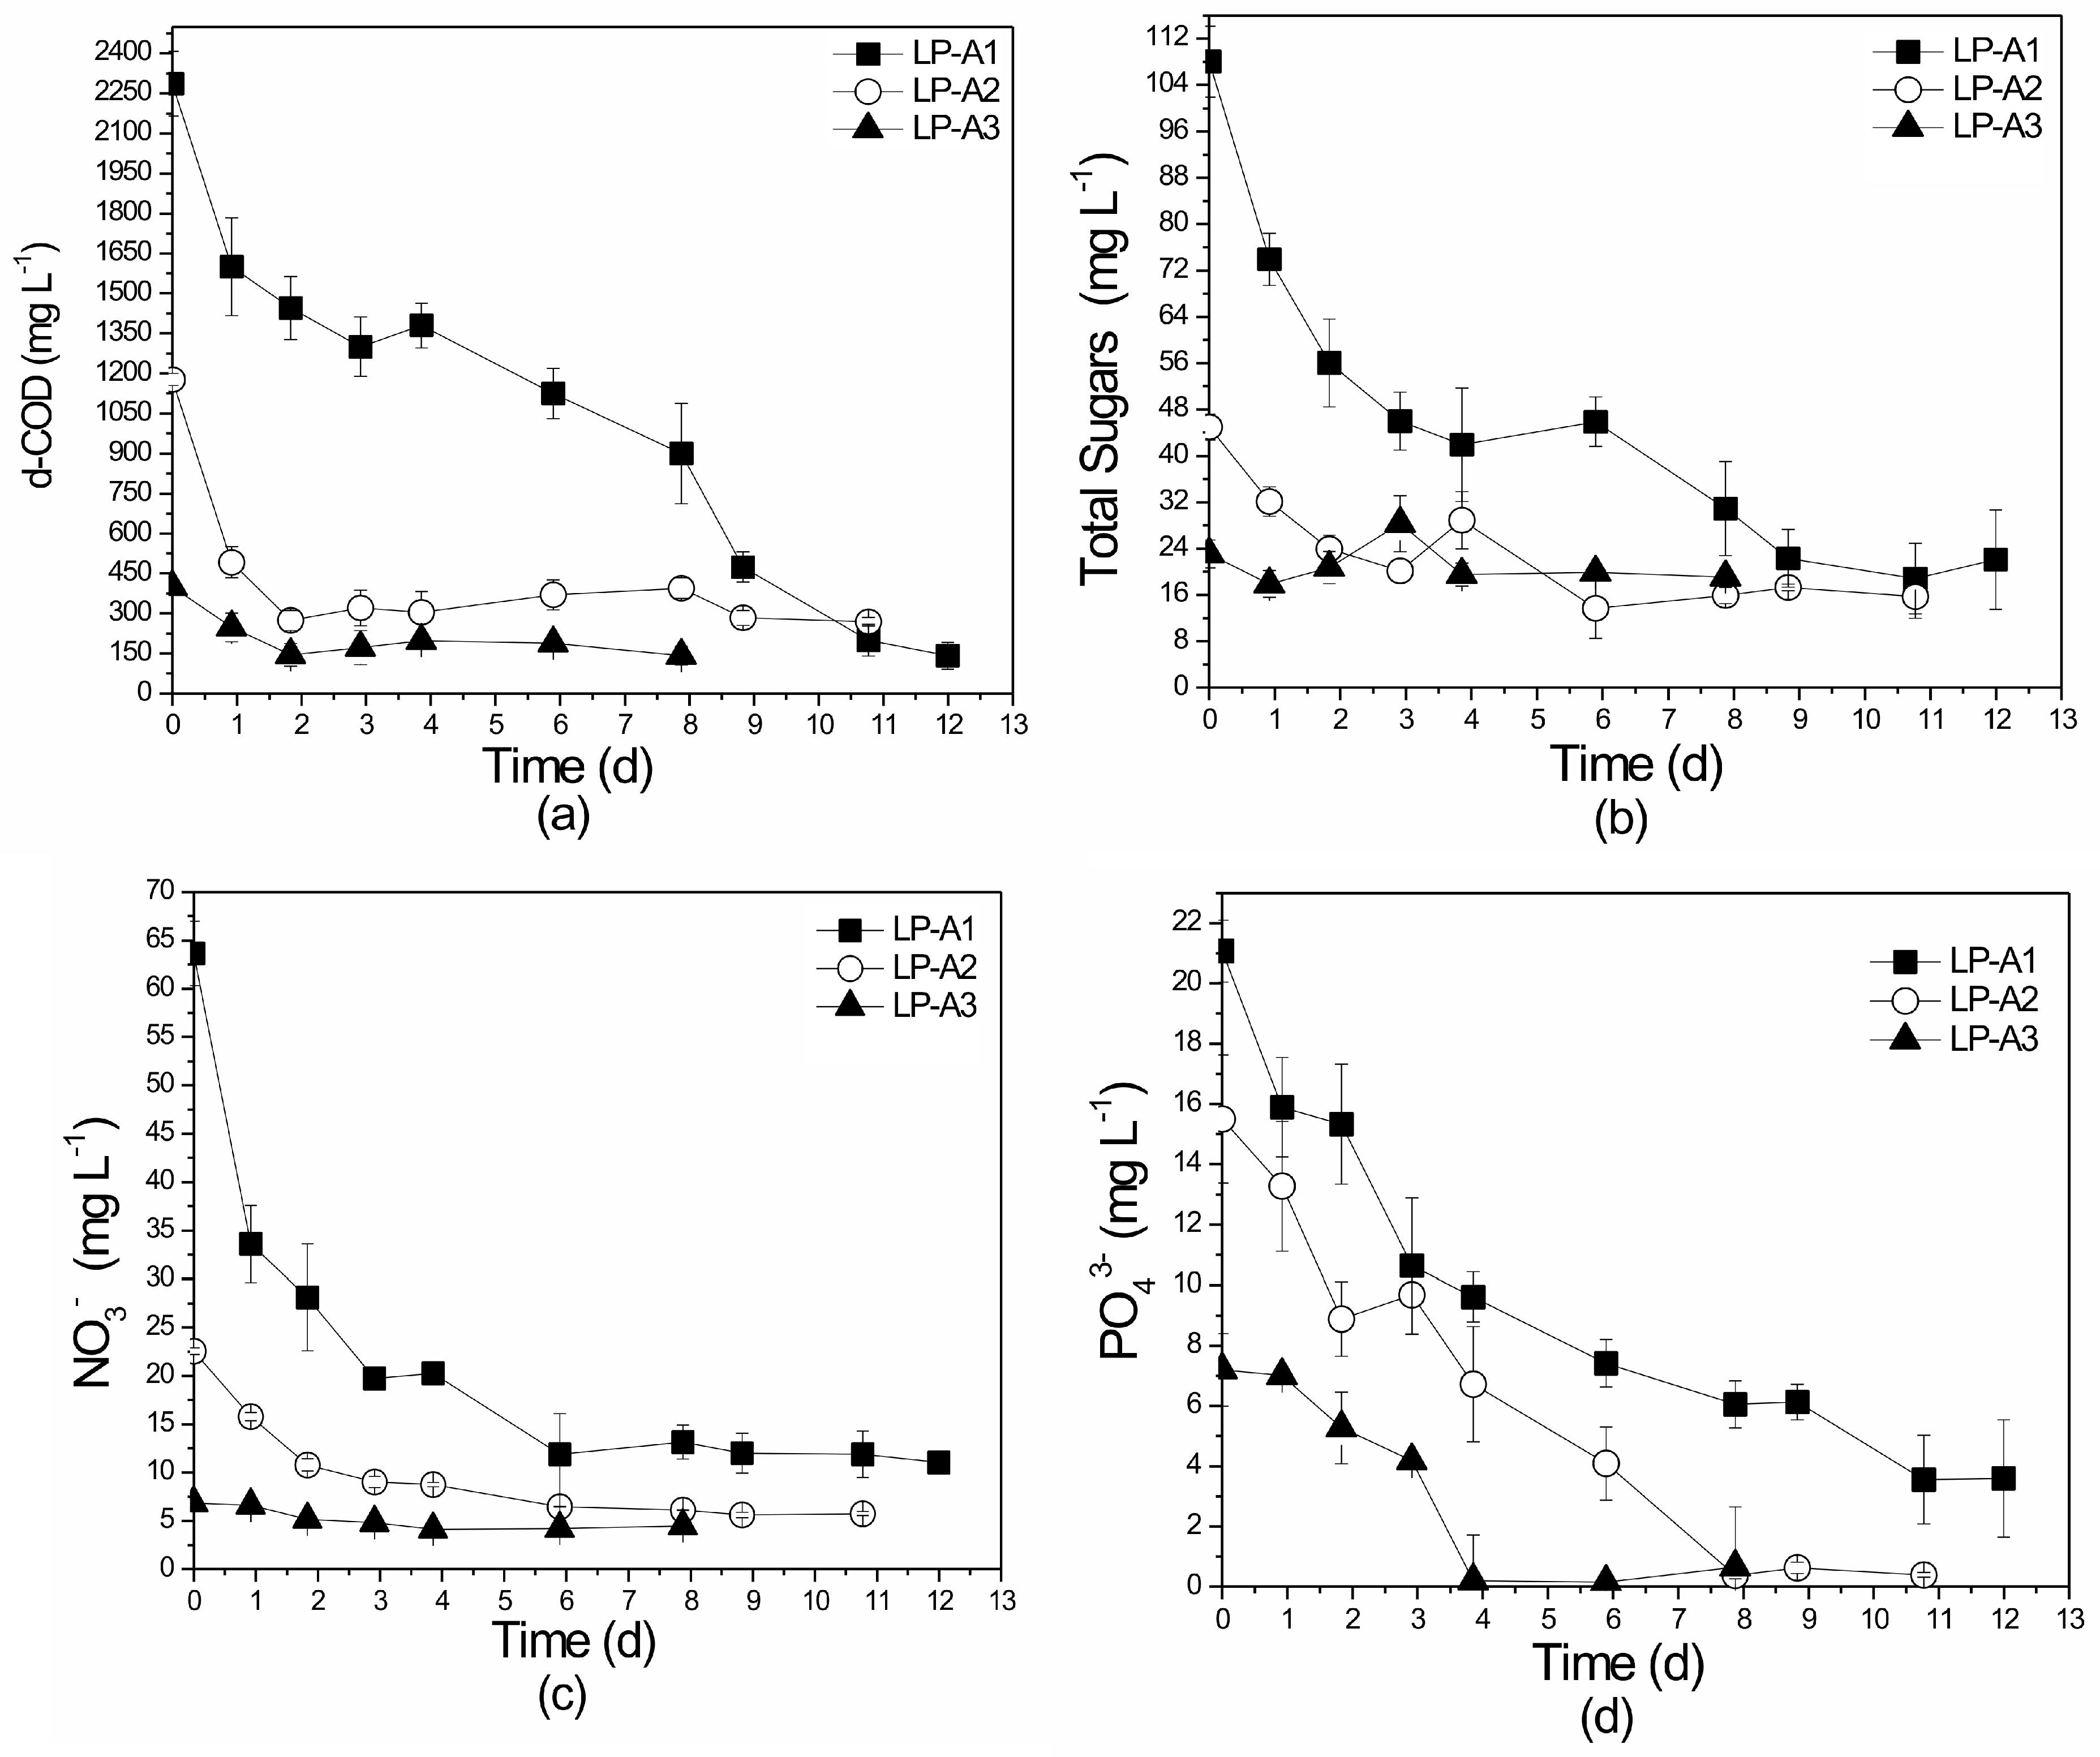
3.2.2. Nutrient and Organic Load Removal

According to Lee et al. [32] and Gutzeit et al. [62], mixotrophic cultivation not only enhances biomass production, but also nutrient removal. Indeed, nutrient uptake by the microbial consortium growing in the tested substrates was higher than that observed in the control experiment LC-A, thus proving the synergistic effect of cyanobacterial/microalgal-bacterial consortia.
COD is directly related to the total pollution load in the form of organic matter, thus making it a crucial parameter of effluent quality monitoring. Initial d-COD values ranged from 400 to 2300 mg L−1 in all experiments conducted. In all sets of laboratory-scale attached growth experiments, d-COD values decreased with time (Figure 5a) and the final removal rate was significantly high, reaching values from 64.5% to 94.0%. Both cyanobacteria/algae and bacteria were able to utilize organic carbon from the PLE through aerobic photoheterotrophic metabolism. However, it should be mentioned that higher d-COD removal rates were observed on the less diluted PLE since the presence of more heterotrophic microorganisms in the media enhanced the PLE bioremediation. No statistical differences on d-COD removal rates were recorded between the LP-A1, LP-A2, and LP-A3 experiment sets (p = 0.452).
Direct comparison with other research works applying poultry waste in attached systems is not feasible, since experiments have only focused on suspended growth systems and most have not examined organic load removal (Table S1). Comparable d-COD removal values have been achieved during the treatment of different agro-industrial waste (65.5–97.4%) when employing a microbial consortium dominated by Leptolyngbya sp. in an attached growth system with glass rods as support material [27]. In another study, 73% d-COD removal was achieved by using a parallel roof plate biofilm reactor for the treatment of raw domestic wastewater [63]. González et al. [64] also used an algal-bacterial community in a tubular biofilm PBR and recorded 75% d-COD removal. It is worth mentioning that the d-COD removal efficiencies achieved in the present laboratory-scale system are among the highest recorded in the literature, thus indicating that the present attached growth system is effective for d-COD removal from PLE [27,63,64].
Total sugars reduction rates presented the same trend as d-COD removal (Figure 5b). Lower removal rates were observed in the most diluted experiment of LP-A3 (17.3%), while higher removal rates (79.3%) were recorded in LP-A1. Statistically significant differences were noted between LP-A1, LP-A2, and LP-A3 experiment sets (p = 0.001), between LP-A3 and LP-A1 (p = 0.001), and between LP-A3 and LP-A2 (p = 0.001).
Removal efficiency of nitrate ranged from 35.0% to 82.5% (Figure 5c). Experiment LP-A3 produced the lowest nitrate removal (35%) and this can probably be attributed to the low initial NO3-N concentration of this media (6.8 mg L−1). Statistically significant differences were recorded between LP-A1, LP-A2, and LP-A3 experiments (p = 0.006) while no differences were observed between LP-A1 and LP-A2 (p = 0.407). NO2-N concentrations remained below 0.17 mg L−1 in all the laboratory-scale attached growth experiments. TN exhibited significant removal efficiencies with values ranging from 79.80% to 88.14%. No statistically significant differences in TN removal were observed between the sets LP-A1, LP-A2, and LP-A3 (p = 0.965). High removal efficiencies were also recorded for PO43− (Figure 5d). PO43− removal ranged from 83.0% to 97.4% while no statistically significant differences were recorded (p = 0.329). Taking into account the values obtained in previous research experiments (Table S1), it can be concluded that the nutrient removal efficiencies achieved in this attached system are very promising.
The polystyrene foam used by Johnson and Wen [33] for the treatment of dairy manure, resulted in lower TN and PO43− removals (78.0% and 79.6%, respectively) than those reported in the experiments of this study (88.2% and 97.4%, respectively). Rai et al. [65] examined four cyanobacterial mats in polyester mesh discs and achieved NO3-N and PO43− degradation rates of 60% and 69%, respectively, while the natural polymers (alginate beads) employed by De-Bashan et al. [34] exhibited lower efficiencies of 15% and 36%, respectively. The PVC biofilm reactor examined to treat centrates and domestic wastewaters produced 70% TN removal and 85% PO43− removal [66].
A survey of the bibliography shows that attached growth cultivation systems lead to higher biomass production and nutrient removal compared to standard suspended growth photobioreactors. Additionally, attached systems are more effective for large-scale units, have better light distribution within the reactor, lower water consumption demands, and improved operation control [67]. The laboratory-scale attached growth system examined in this study produced similar biomass productivities to those reported in laboratory-scale suspended growth systems (Section 3.2.1); however, its operation led to higher nutrient removal rates (Table 2).

3.3. Pilot-Scale Suspended Growth System

Pilot-scale experiments with PLE were conducted in both suspended and attached growth systems. A transparent Plexiglas column reactor was used (Figure 1, Section 2.3.2) applying the same conditions of light intensity, constant illumination, and temperature as those tested in the laboratory-scale experiments. The configuration of the column allowed media recirculation so that the nutrients and microbes were evenly distributed throughout the reactor. The reactor was initially examined in suspended growth mode with a recirculation rate of 1600 mL min−1 using chemical media (CS) and inoculum from the stock culture. Microscopy observations revealed that the filamentous cyanobacterium Leptolyngbya sp. could not maintain its morphology at this high recirculation rate and the filaments appeared broken. Therefore, different recirculation rates were tested in the experiments using PLE that presented similar initial d-COD concentrations (about 1000 mg L−1) and N:P ratios (about 3:1) (Table 3). Specifically, the pilot-scale experiments were performed using recirculation rates of 800 mL min−1 (PP-800), 1000 mL min−1 (PP-1000), and 1200 mL min−1 (PP-1200) (Table 3). The evolution of total microbial biomass resulting from these experiments is presented in Figure 6. Biofilm attachment through time was observed both on the walls of the bioreactor and in the circulation column.
High biomass productivities were recorded in the experiments PP-1000 and PP-1200 with values of 210.6 and 197.1 mg L−1 d−1, respectively (Figure 6), with respective maximum specific growth rates of 0.203 and 0.225 d−1. Recirculation rates of 800 mL min−1 resulted in lower biomass productivity (111.0 mg L−1 d−1) and also led to reactor operating problems, as dense biofilm blocked the holes at the base of the PBR and prevented normal operation of the recirculation pump. No statistically significant differences in biomass productivities were observed between experiments PP-1000 and PP-1200 (p = 0.075).
Regarding nutrient removal efficiencies, it was observed that as flow rates increased, slightly higher removal efficiencies were obtained (Figure 7a–d). Experiment PP-1200 presented marginally higher percentage removals of NO3-N, PO43−, and d-COD (65.0%, 90.0%, and 77.4%, respectively) than PP-1000 (53.0%, 63.5%, and 74.2%, respectively), however the recirculation rate of 1000 mL min−1 exhibited higher lipid content (8% d.w. compared to 6% d.w.). To determine whether initial nutrient concentration positively affected biomass and lipid productivity in experiment with 1200 mL min−1 recirculation rates, a different experiment was conducted (PP1-1200) with a flow rate of 1200 mL min−1 and higher initial nutrient concentrations (Table 3). Results revealed no further improvement on biomass productivity (177 mg L−1 d−1), lipid content (7.7% d.w.), or nutrient removal (NO3-N, PO43−, and d-COD percentage removals of 45.6%, 67.6%, and 60.0%, respectively) (Table 3). In conclusion, the volumetric flow rate of 1000 mL min−1 presented high biomass and lipid production as well as sufficient nutrient removal efficiencies. Based on the above-mentioned observations, the volumetric flow rate of 1000 mL min−1 was selected for the following experiments.
Regarding the lab-scale attached growth and pilot-scale suspended growth reactors, removal time was observed to differ significantly since in pilot-scale experiments the required time was almost 5 days in comparison with the 12 days required in the lab-scale experiments. However, higher d-COD removal efficiency was recorded in the lab-scale set LP-A1 (94%) than the pilot-scale set PP1-1200 (60%) despite both having a similar initial d-COD concentration.

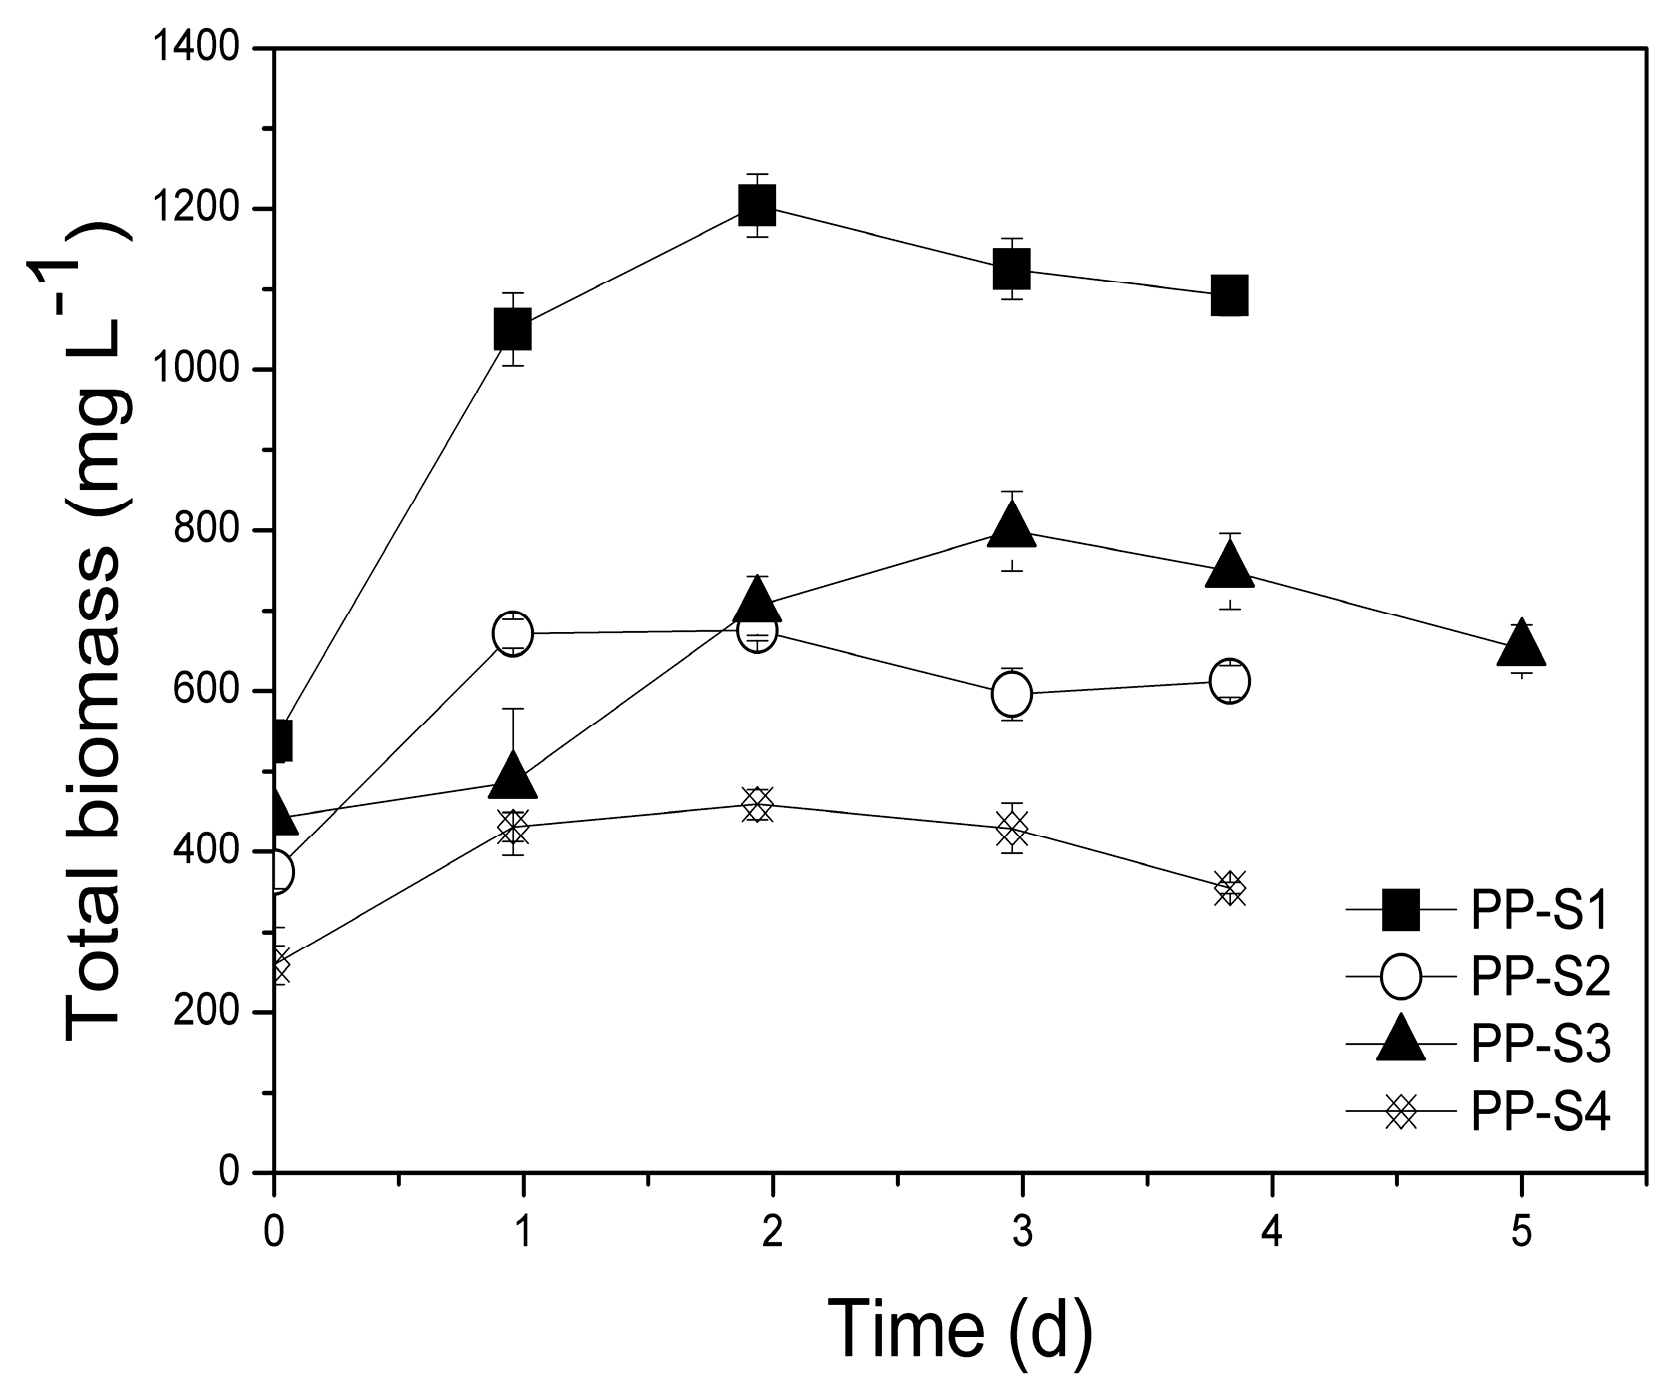
3.3.1. Biomass Production

Initial d-COD values were similar to those applied in the laboratory-scale experiments. Additionally, higher initial d-COD (3200 mg L−1) was also examined in this PBR without operating problems. It is likely that the configuration of this PBR, in combination with the recirculation rate used, enhanced mixed trophic cultivation even at such high initial d-COD concentrations. Significant biomass productivities (Figure 8, Table 2) were achieved in all pilot-scale suspended growth experiments ranging from 157.3 to 339.4 mg L−1 d−1, while specific growth rates ranged between 0.203–0.291 d−1. Compared to the laboratory-scale suspended growth PBRs, the pilot-scale PBRs presented higher biomass productivities apparently due to better light distribution throughout the column and the larger surface area of the reactor (Table 2). Control experiment PC-S presented lower biomass productivity (150.6 mg L−1 d−1) than PP-S2, PP-S1, PP-S3, and PP-S4 (although they did have similar N:P ratios), thus indicating that the cyanobacterial-bacterial consortia enhanced biomass productivity.
Statistically significant differences of biomass productivity were recorded between experiments PP-S1, PP-S2, PP-S3, and PP-S4 (p = 0.0002) and between all the pairs of laboratory- and pilot-scale experiments in suspended growth systems with the same initial d-COD concentrations (PP-S2 and LP-S1: p = 0.0006, PP-S3 and LP-S2: p = 0.002, PP-S4 and LP-S3: p = 0.002).
The use of pilot-scale PBRs has been mainly restricted to municipal, agro-industrial, and synthetic wastewaters. Reviews by Hoh et al. [31] and Gross et al. [25] refer that only a few studies have examined diluted animal manure wastewaters in pilot-scale reactors, therefore direct research comparisons are difficult. Comparison with studies on agro-industrial wastewaters shows that the biomass productivities achieved in this study are among the highest recorded in bibliography when using a mixed cyanobacterial-based consortium in pilot-scale systems. The combination of waste type (PLE), bioreactor type (pilot scale), developed microbial consortium, and operating conditions may have contributed to produce high biomass productivity yields. Travieso et al. [68] treated swine and sewage wastewaters in an open pond, achieving biomass productivities ranging from 93 to 98 mg L−1 d−1. Gao et al. [69] used a column reactor (similar to the pilot-scale suspended growth PBR examined in this study) for the treatment of aquaculture wastewater, and recorded lower biomass productivity (42.6 mg L−1 d−1) and specific growth (0.17 d−1). Anbalagan et al. [70] implemented a tubular PBR for the treatment of diluted centrate wastewater using a mixed algal-bacterial culture that resulted in a biomass productivity of 80 mg L−1 d−1. The membrane PBR used by Viruela et al. [71] achieved biomass productivity of about 66 mg L−1 d−1 when treating anaerobically digested sewage. To the best of our knowledge, Leptolyngbya species in consortium with heterotrophic bacteria has not been used in pilot-scale systems (suspended or attached) for the treatment of poultry or other agro-industrial wastes.

3.3.2. Nutrient and Organic Load Removal

The pilot-scale suspended growth experiments were conducted using similar initial organic load concentrations (d-COD) to those of the equivalent laboratory-scale experiments. Removal rates of d-COD (Figure 9a) and total sugars (Figure 9b) ranged from 74.0% to 88.4% and 59.1% to 73.8%, respectively. These values are significantly higher than those reported in the laboratory-scale experiments of this study (58.0–68.0 and 7.0–48.0%, respectively). According to Table S1, minimal research has been done in pilot- or full-scale systems using poultry wastes as substrate for microalgae growth. Bhowmick et al. [11] cultivated Chlorella minutissima in an open pond and recorded COD removal values of up to 85%. However, pilot-scale suspended reactors (open ponds) were also examined by Van de Hende et al. [72] to treat food industry and aquaculture wastewaters achieving d-COD reduction rates of just 67% and 28%, respectively, and by Ferrero et al. [73] who studied raw swine wastewaters and recorded d-COD removal values up to 77%. Statistically significant differences were not detected between experiment sets for either d-COD or total sugar removal rates (p = 0.79958 and p = 0.76306), respectively.
Removal rates of NO3-N (Figure 9c) and TN ranged from 44.0% to 54.2% and 36.4% to 61.6%, respectively, while NO2-N concentrations were constantly below 0.33 mg L−1 in all sets. Bhowmick et al. [11] also achieved very high NO3-N and PO43− removal rates, of up to 95.2% and 91.6%, respectively. Mandal and Mallick [9] recorded extremely high nutrient removal (100%), however their experiment treated PL with mixed fish discharge extracts. De Godos et al. [74] treated swine wastewater in a tubular biofilm reactor achieving TN and TP removal rates of 94–100% and 70–90%, respectively. Su et al. [75] also recorded high TN and PO43− removal rates of 91.0% and 93.5% when treating lower initial pollutant concentrations than those of the present study.
Statistically significant differences in NO3-N and TN removal rates were not observed between the PP-S1, PP-S2, PP-S3, and PP-S4 experimental sets (p = 0.884 for NO3-N and p = 0.947 for TN). PO43− percentage removals (Figure 9d) ranged from 51.0% to 67.8% and no statistical differences were observed between PP-S1, PP-S2, PP-S3, and PP-S4 (p = 0.128).

3.4. Pilot-Scale Attached Growth System

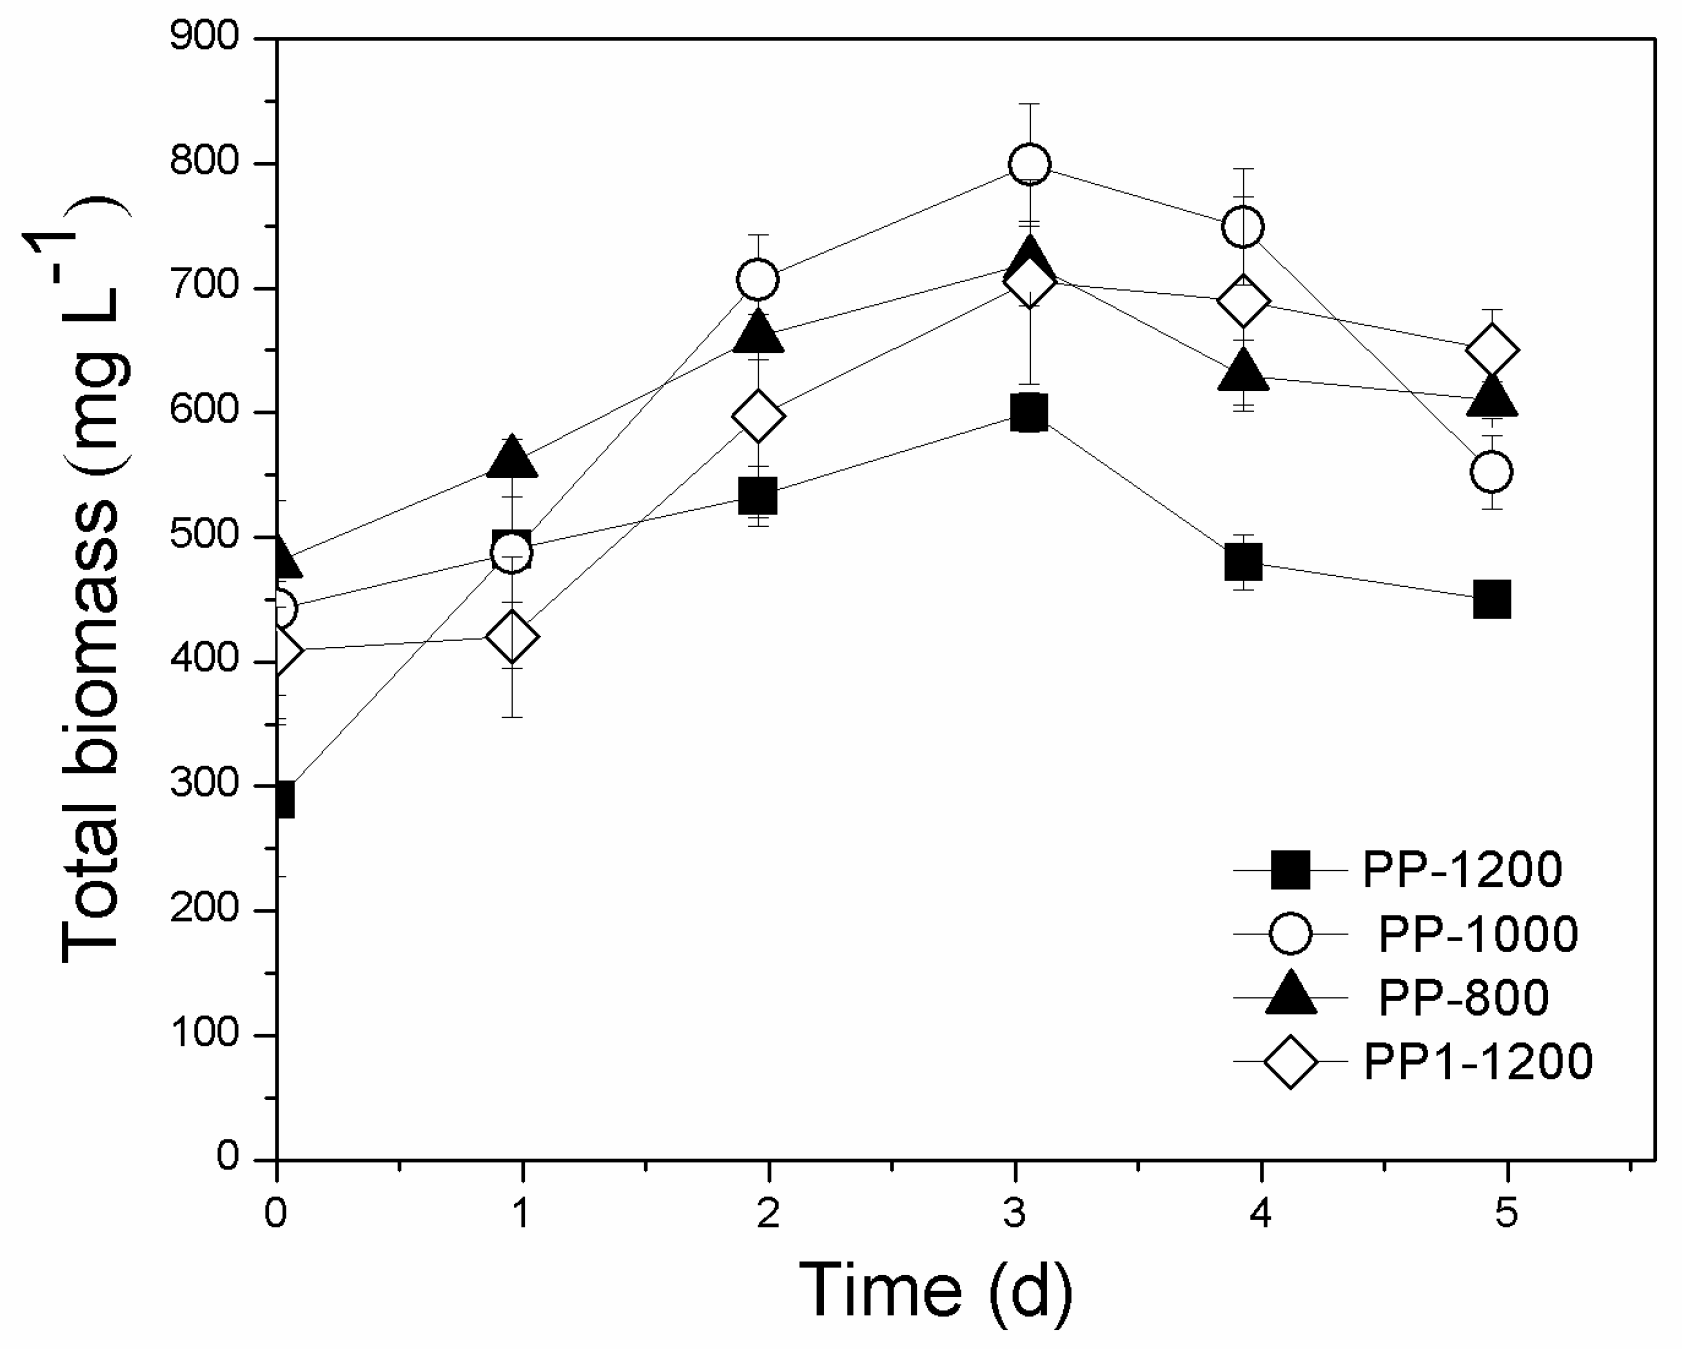
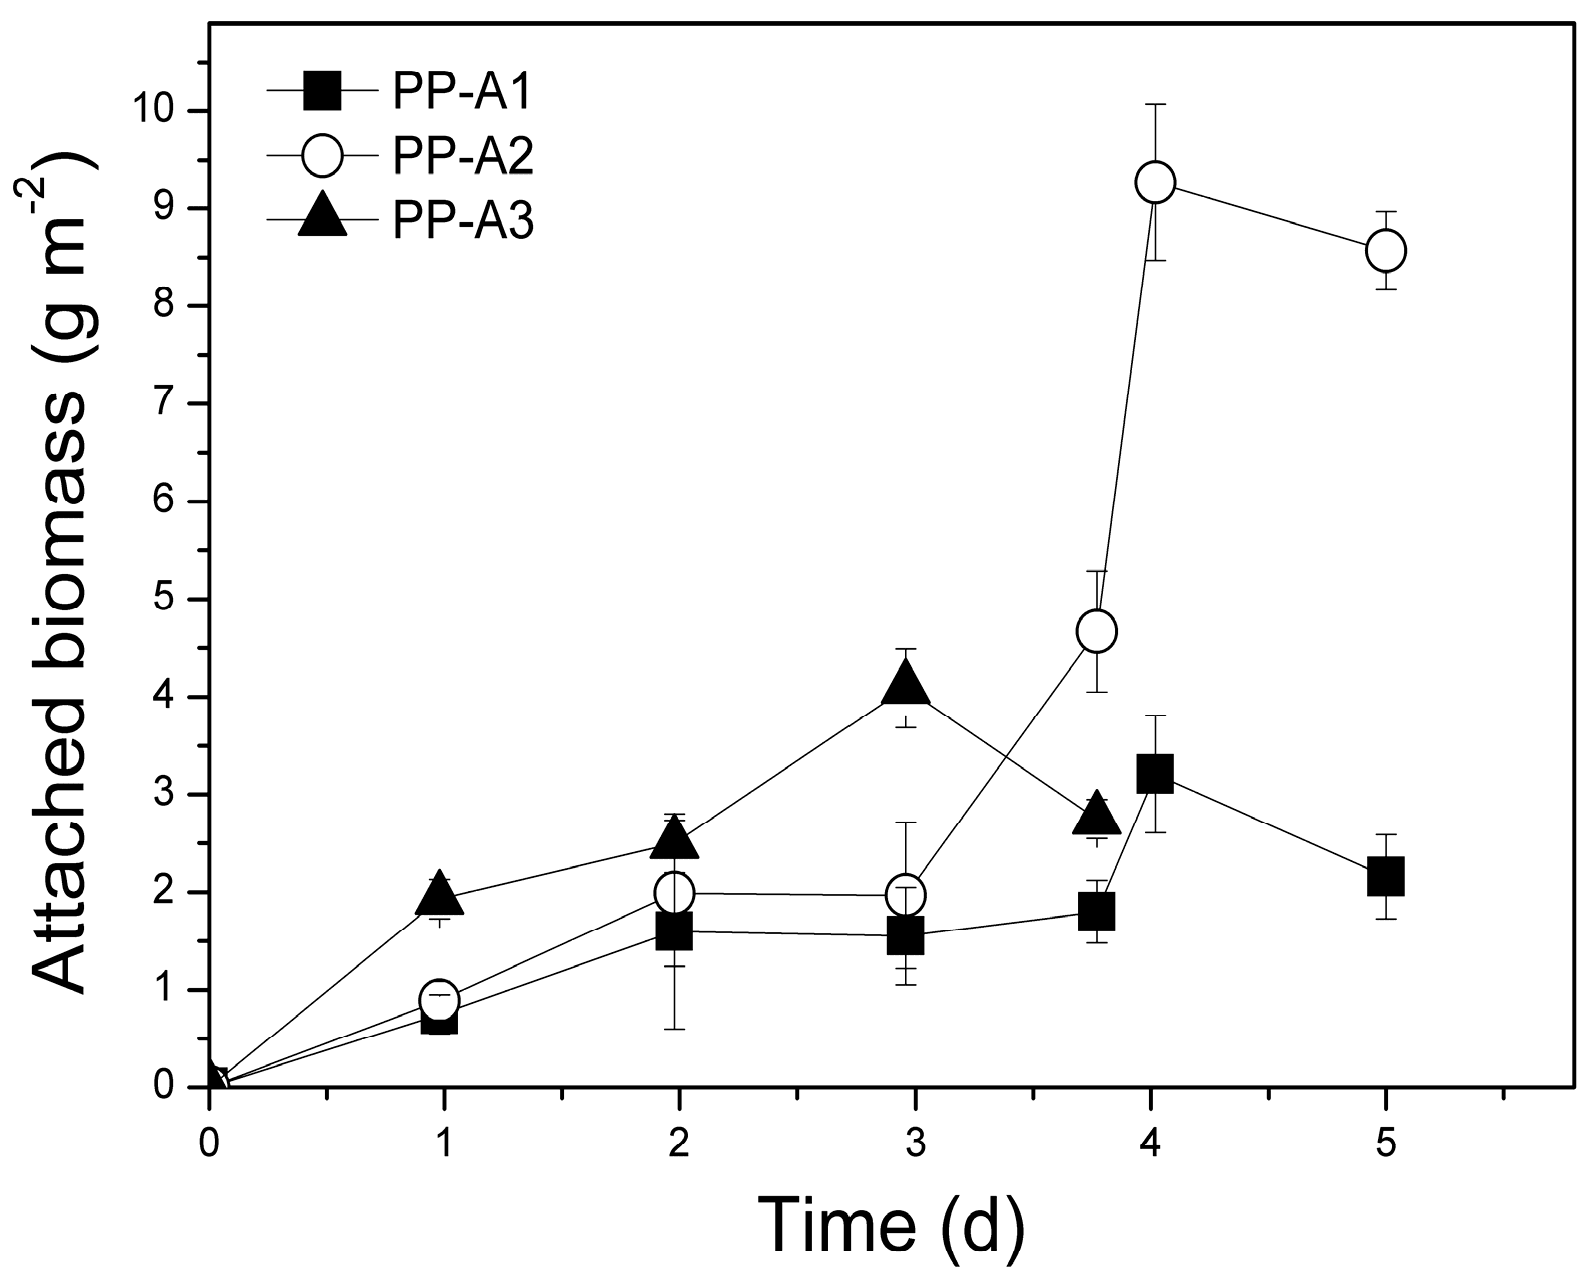
3.4.1. Biomass Production

Different types of reactors in combination with different support materials and substrates can significantly affect rates of biomass production and nutrient removal. Only a few research works have focused on pilot-scale attached growth systems, mainly for the treatment of synthetic or municipal wastewater. Specifically, Christenson and Sims [76] tested a rotating algal biofilm reactor (RABR) with cotton as attachment material for the treatment of municipal wastewater and chemical medium. These laboratory- and pilot-scale experiments achieved biomass productivities of about 3.5–5.5 g m−2 d−1 and 14.0–31.0 g m−2 d−1, respectively. Later, Sebestyen et al. [77] applied a multiple mixed algal disc reactor to treat flue gasses and recorded seasonal biomass productivities of 0.3–4.74 g m−2 d−1. An open pond reactor with mesh-type support material was used by Lee et al. [32] to treat municipal wastewater and produced biomass productivities between 9.2 and 13.5 g m−2 d−1. Boelee et al. [78] treated municipal effluents with a phototrophic biofilm reactor and woven geotextile as support material and observed productivities up to 4.5 g m−2d−1. Finally, Gross et al. [79] used an RABR reactor with cotton cords to treat synthetic medium and noted a maximum productivity of 1.99 g m−2d−1.
Different dilutions of PLE were examined in the pilot-scale attached growth PBRs in order to achieve initial d-COD concentrations similar to those used in the pilot-scale suspended growth reactors (about 3000, 2000, and 1000 mg L−1). The initial d-COD concentration of 500 mg L−1 was not examined as the pilot-scale PBR produced significantly lower nutrient removal rates and lipid production at this concentration. The pilot-scale attached growth experiments produced attached biomass productivities of up to 3.4 g m−2d−1 that falls within the range of previously recorded values [77,78,79] (Figure 10) (Table 2). The highest total biomass productivities were observed in experiment PP-A3 (335.3 mg L−1 d−1) and PP-A2 (316.5 mg L−1d−1). Specific growth rates of attached biomass ranged from 0.232 to 0.380 d−1. As shown in Table 2, the pilot-scale attached growth PBR presented significant total biomass productivities and attached specific growth rates. Significant differences of total biomass productivities were recorded (p = 0.005) between PP–A1 and PP-A2 (p = 0.043), and between PP-A1 and PP-A3 (p = 0.046). However, no significant differences were observed between PP-A2 and PP-A3 (p = 0.728). Statistically significant differences were also observed between PP-S1 and PP-A1 (p = 0.001), and PP-S3 and PP-A3 (p = 0.028), while no differences were observed between the PP-S2 and PP-A2 sets (p = 0.989).

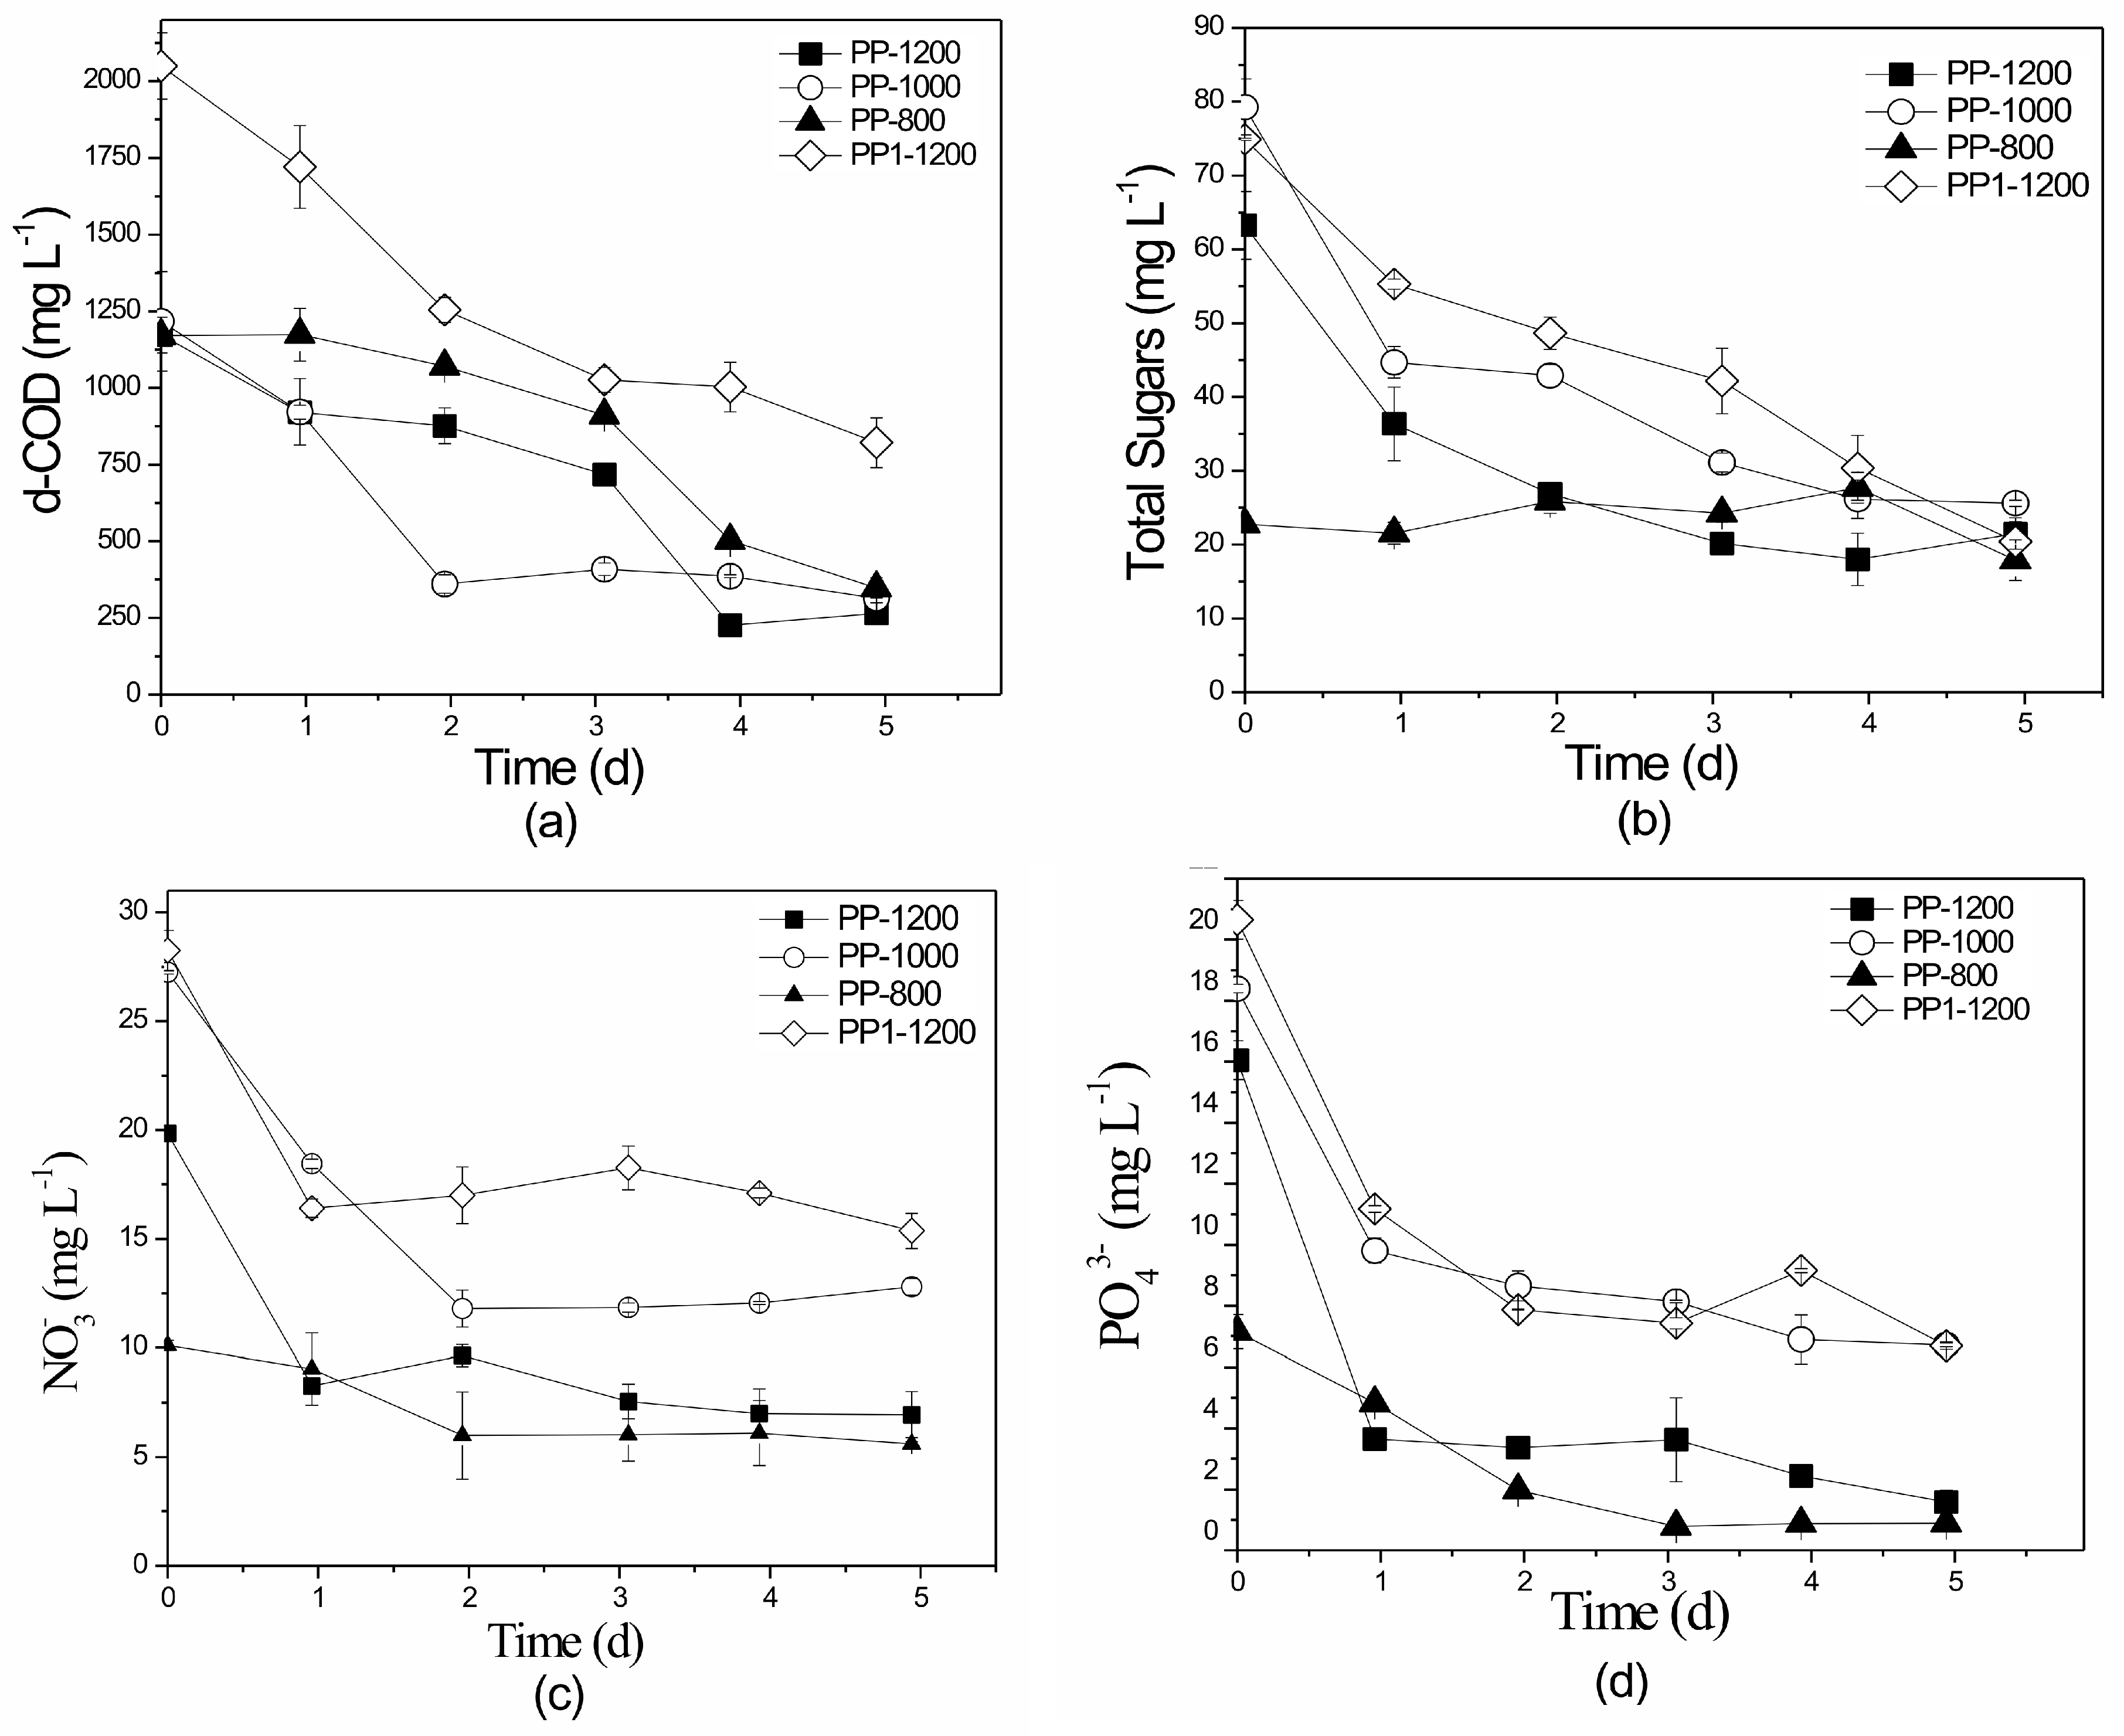
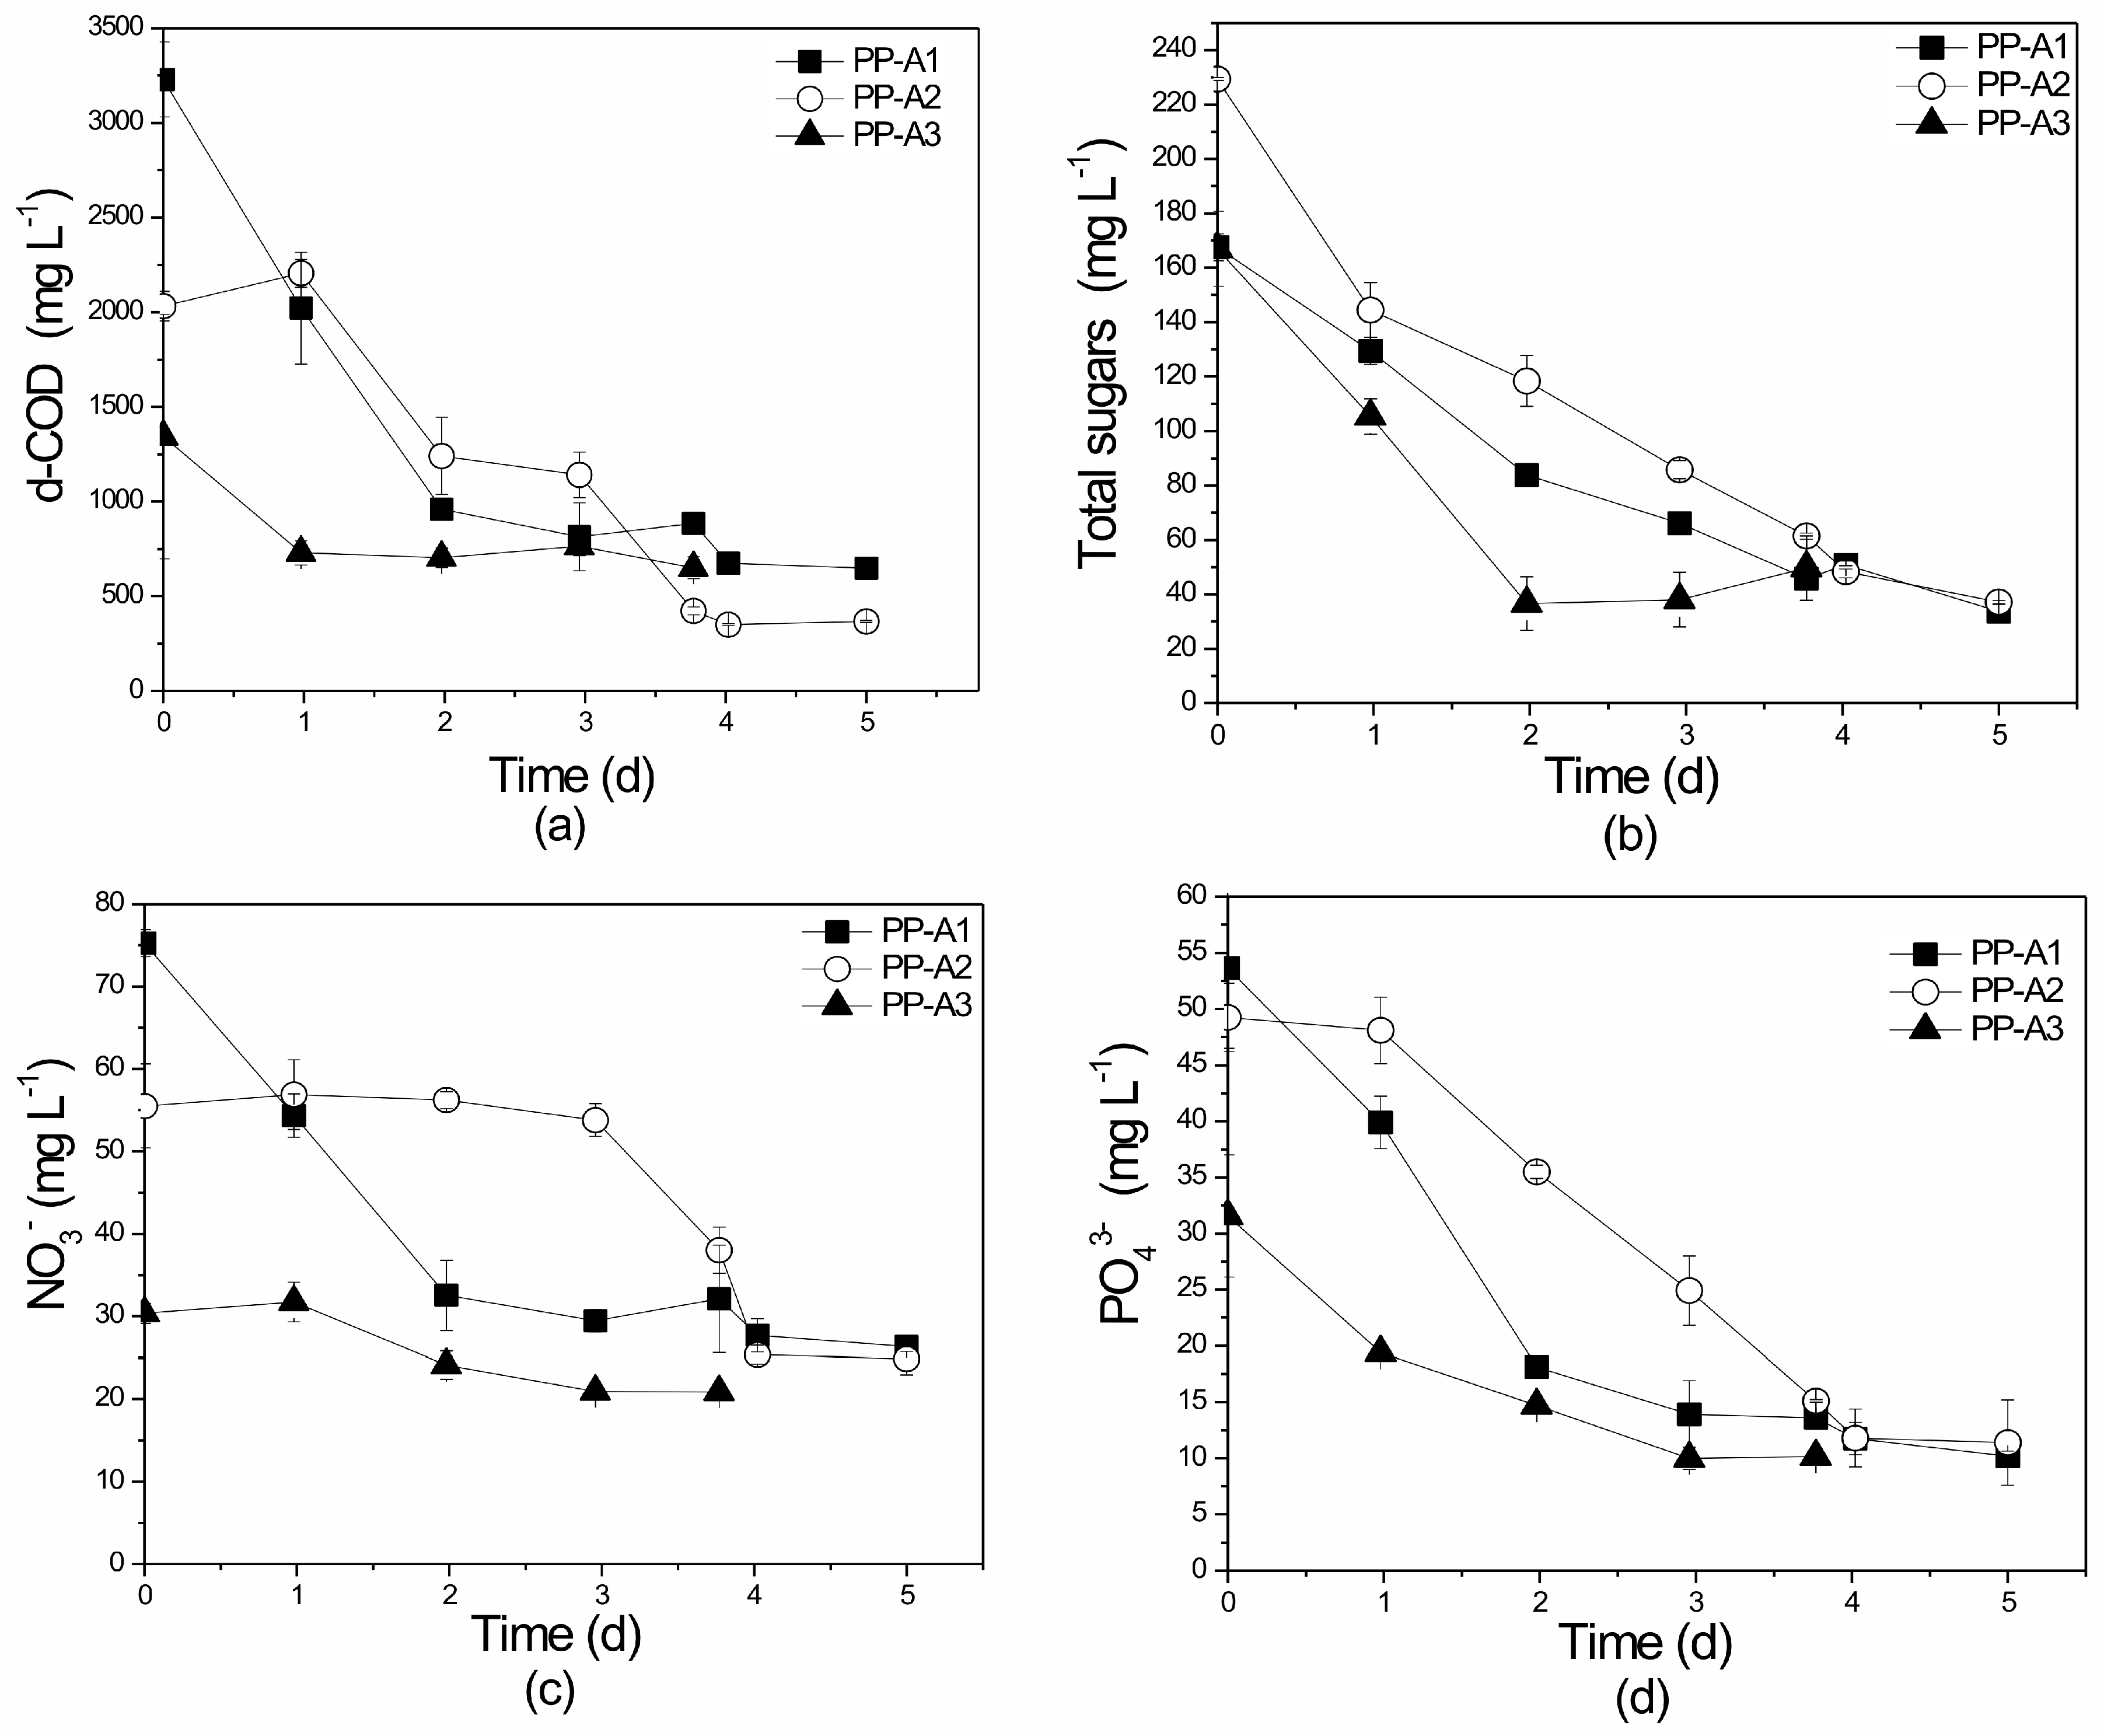
3.4.2. Nutrient and Organic Load Removal

The pilot-scale attached growth experiments using PLE as substrate presented slightly higher nutrient removal efficiencies than the pilot-scale suspended experiments (Table 2). This result is consistent with other researchers’ observations on attached cultivation systems (e.g., higher biomass production, better light distribution within the reactor, and improved operation) [32,64]. Comparison between pilot- and lab-scale attached growth systems shows that higher nutrient removal rates were achieved in the laboratory-scale PBRs. Presumably, the glass rods used in these reactors provided better ambient conditions for nutrient assimilation compared to the plastic cubes and tubes of the media line. Additionally, the recirculation rate may have affected the growth/treatment process. Values of d-COD removal ranged from 51.5% to 82.0% (Figure 11a). The pilot-scale attached growth experiments presented the highest percentages (70.2–83.8%) of total sugar removal of all PBRs tested (Figure 11b). No statistically significant differences in d-COD (p = 0.425) or total sugars (p = 0.962) reduction rates were observed between PP-A1, PP-A2, and PP-A3. In a similar study, Derakhasan et al. [80] used a Plexiglas PBR with a submerged membrane in the middle of a lab-scale reactor for the treatment of synthetic, raw, and secondary municipal effluents. This system achieved d-COD removal values of up to 99.2%, higher than those reported in the present study. However, it should be mentioned that Derakhasan et al. [80] examined very low initial d-COD concentrations of up to 51 mg L−1. He and Xue [81] treated domestic wastewater in a radial reactor using cylindrical propylene carrier material and recorded d-COD removal of just 48.0%. Higher d-COD removal (up to 97%) was achieved by Wei et al. [82] when applying a chamber reactor packed with radial PVC fillers to treat simulated wastewaters with an initial organic concentration of 493.3 mg L−1.
Removal rates of NO3-N ranged from 31% to 65%, while NO2-N concentrations remained consistently below the value of 1.6 mg L−1 (Figure 11c). TN percentage removals were recorded as between 63.5% and 69.4% in all experiments. Statistical differences of NO3-N removal rates were noted between PP-A1, PP-A2, and PP-A3 (p = 0.049), PP-A2 and PP-A3 (p = 0.042), and between PP-A1 and PP-A3 (p = 0.029). PO43− presented high assimilation rates (67.8–87.6%) that significantly exceeded the rates recorded in the suspended growth pilot-scale PBRs (Figure 11d). Significantly statistical differences in PO43− were not observed for PP-A1, PP-A2, and PP-A3 (p = 0.833). The nitrogen and phosphorus removal rates recorded in this PBR are in accordance with those recorded in the literature; however, direct comparison is not possible due to the variety of experimental support materials and reactors used. Additionally, the majority of these studies examined the treatment of secondary or synthetic wastewaters. Orfanos and Manariotis [83] applied cotton, polyethylene, and geotextile sheets (vertically immersed in ponds) for the treatment of secondary effluent municipal wastewater achieving NO3-N and PO43− removal rates of 48% and 84% (geotextile), 53.8–99.3% and 88.7–89.7% (cotton), 50.8–99.3% and 89.7-92.1% (polyethylene), respectively. An RABR used by Shayan et al. [84] for the treatment of mixed municipal wastewater and sludge, produced TN and TP uptake rates of 47–94% and 12–100%, respectively. Lastly, Shi et al. [85] used a vertical twin layer PBR to treat secondary wastewater and recorded average TN removal of 83.2% and TP removal of 73.2%.

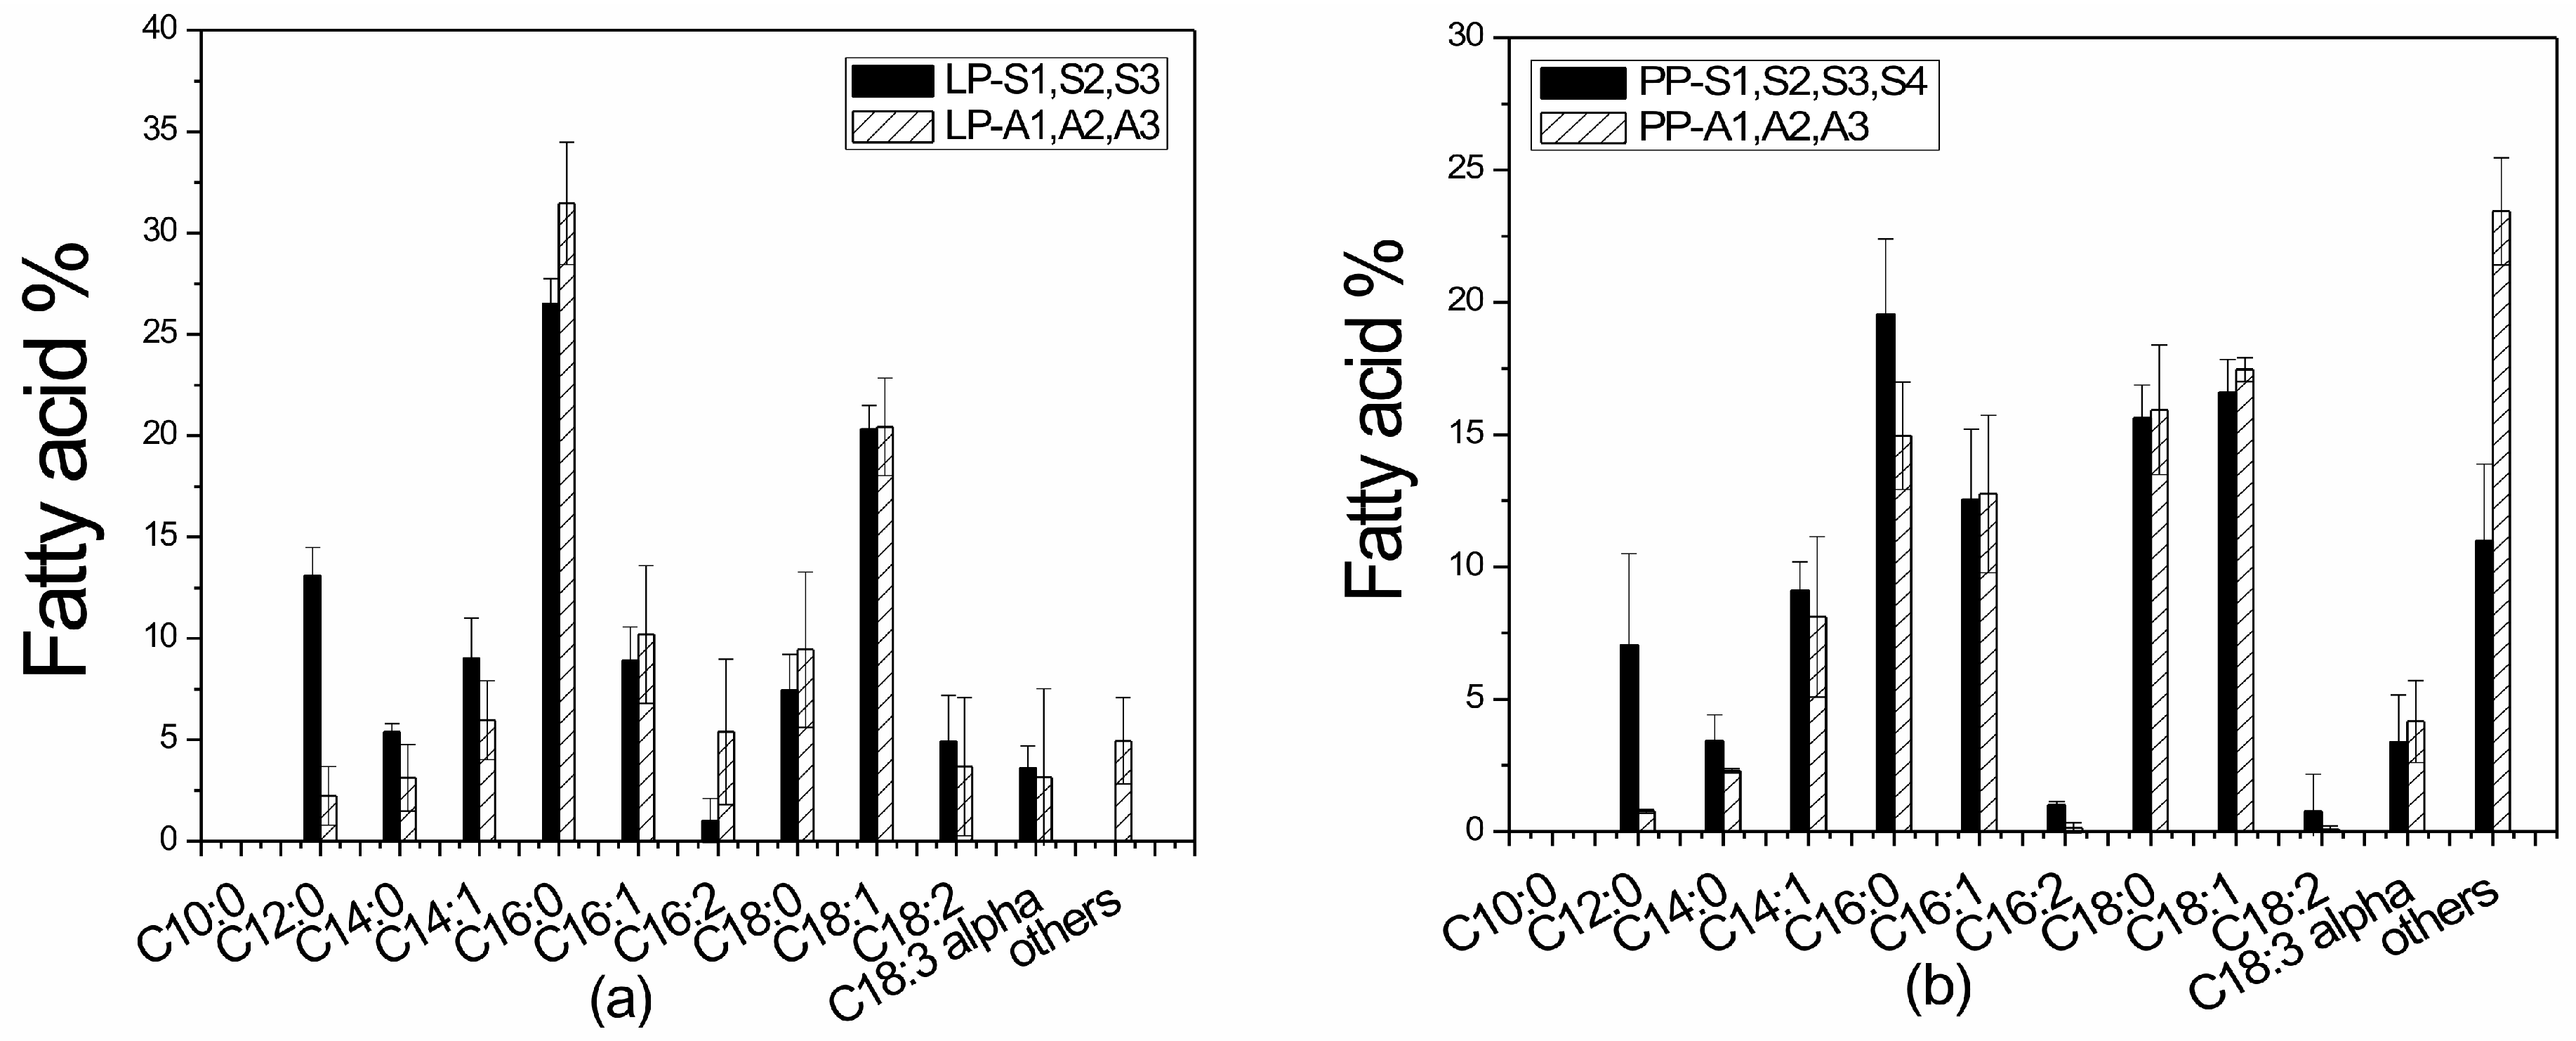
3.5. Lipid Production and Fatty Acid Profile

Microalgae synthesize fatty acids as building blocks for the formation of different types of lipids. Lipid alterations occur under unfavorable environmental conditions (nutrient deprivation, pH, salinity, temperature, light intensity, age, etc.) while the lipid production appears to be both strain specific and dependent on environmental stimuli [27,86].
In the current study, total lipid content was measured in all experiments (Table 2). Total lipid contents deriving from the laboratory-scale suspended experiments ranged from 8.3% to 15.5% d.w. (Table 2). The highest lipid content of 15.5% d.w. was observed in the experiment with the most diluted PLE (LP-S3), and lower values were observed in experiments with concentrated PLE. A similar observation has also been made by other researchers [37]. It appears that light penetration contributes to enhanced intracellular lipid accumulation [87]. Laboratory-scale attached growth experiments produced higher total lipid contents (14.3–18.4% d.w.) than suspended growth lab-scale experiments (9.8–19.6% d.w.). The highest total lipid content of 19.6% was also recorded in experiments with the most diluted substrate (LP-A3). The attached growth system produced higher lipid yields and this is in agreement with other comparable research where enhanced biomass and lipid productivities were recorded mainly due to better light availability compared to suspended growth systems [32,62]. Although the pilot-scale suspended growth experiments presented higher biomass productivities (157.3–339.4 mgL−1d−1) than the corresponding lab-scale experiments (111.0–198.9 mgL−1d−1), they resulted in lower total lipid contents (5.7–8.6% d.w.) than the latter experiments (8.3–15.5% d.w.). This inconsistency was also noted in comparable studies treating agro-industrial wastes in suspended growth systems [27,37,38] and may be explained by the high metabolic cost of lipid biosynthesis [88].
It is well known that C:N:P ratios have a decisive effect on microorganism growth, nutrient uptake rates, and lipid accumulation. The optimum C:N:P ratio for lipid accumulation in microalgal-bacterial populations depends on a variety of parameters such as micronutrient concentrations, pH, and the PBR used [18]. The highest lipid yield in the suspended growth pilot-scale reactor (8.6%) was recorded in experiment PP-S2 where the N:P ratio was 1.51:1. Statistically significant differences in total lipid content were observed between experiments PP-S1, PP-S2, PP-S3, and PP-S4 (p = 0.045).
Pilot-scale attached experiments presented total and attached lipid yields from 9.1% to 13.0% and 7.3% to 9.5%, respectively. Significant differences observed in total lipid content among pilot–scale attached sets PP-A1, PP-A2, and PP-A3 (p = 0.222).
The lipid content values achieved in this study (Table 2) are in accordance with those reported for Leptolyngbya species and within the range of 16–21% d.w. [60]. Similar lipid contents of Leptolyngbya sp.-based cultures have also been recorded in suspended (6.3–14.8% d.w.) [39] and attached systems (9.8–24.8% d.w.) [27,61]. Shabana et al. [7] recorded lipid content of 20.3% d.w., by cultivating Chlorella vulgaris in poultry waste extract with laboratory-scale experiments. The lipid contents achieved in the present study were lower than those recorded in previous research works applying poultry waste (Table S1), although it is worth mentioning that most of the substrates used in the literature had undergone some form of pretreatment.
Biodiesel quality was evaluated by analyzing the produced total lipids in each culture system. The lipid analysis was performed during the exponential and early stationary growth phases and the fatty acids (FAs) profiles are shown in Figure 12a,b. Typically, TAGs with high contents of saturated and monounsaturated FAs and particularly high C18:1 content, are reported to be the most suitable acids for biodiesel production [61]. In all the substrates tested, the major FAs were found to be: C16:0 (14.96–31.40%), C16:1 (8.91–12.76%), C18:0 (7.45–15.63%), C18:1 (16.60–21.43%), and C18:2 (0.09–4.91%), which are the most common FAs detected in biodiesel. Capric acid (C10:0) was not detected in any media, while methyl linoletate (C18:3) content was less than 12% as required by the European Biodiesel Standards EN14214 [89]. The FAMES detected in this study are in agreement with previous studies using Leptolyngbya sp. consortiums and also presented similar carbon chain lengths from C12:0 to C18 [27,39,61].
Carbon chain length and degree of unsaturation are key factors that significantly influence biodiesel properties, such as iodine value, cetane number, oxidative stability, cold flow properties, and kinematic viscosity [61]. High presences of unsaturated and monounsaturated FAs were recorded in both laboratory- and pilot-scale experiments, with values reaching 90.7% for LP-S1, LP-S2, and LP-S3, 77.4% for LP-A1, LP-A2, and LP-A3, 83.9% for PP-S1, PP-S2, PP-S3, and PP-S4, and 73.0% for PP-A1, PP-A2, and PP-A3 experiments, indicating suitability for biofuel production.
Based on the quantity and quality of the fatty acids obtained from the microbial biomass, the biodiesel properties were analyzed theoretically using Biodiesel Analyzer© software [89] (Table S3). The European standards for vehicular biodiesel state that iodine values must be lower than 120 gI2/100 g, while cetane numbers should be higher than 47 and oxidation stability a minimum of 6 h [27,90]. The properties of the FAs produced in this study showed iodine values between 46.0 and 70.2 gI2/100 g, cetane numbers ranging from 63.2 to 66.0, and oxidation stability between 16.4 and 37.7 h. These theoretical biodiesel properties indicate that the lipids produced in both bioreactor systems are suitable for biodiesel production.

4. Conclusions

Studies of waste treatment using microalgae have primarily focused on the removal of key nutrients such as nitrogen and phosphorus. However, mixed microbial populations are more efficient at removing organic loads from wastes than axenic cultures. In this study, laboratory- and pilot-scale experiments were performed in suspended and attached growth PBRs, using a microbial consortium dominated by the phototrophic filamentous cyanobacterium Leptolyngbya sp. in synergy with the heterotrophic microorganisms of poultry waste for the treatment of PLE. This is the first known attempt at poultry waste treatment using a mixed Leptolyngbya sp.-bacteria culture. Additionally, until present, poultry wastes have not previously been treated using cyanobacteria/microalgae in attached growth systems.
The effect of different initial pollutant concentrations on biomass production and lipid contents was examined. Concerning d-COD, percentage removals ranged between 58.0% and 88.4% for suspended systems and 51.5–94.0% for attached systems. In suspended and attached growth systems, total nitrogen removal ranged between 36.4–80.5% and 63.5–88.2%, respectively, while phosphorus percentage removal was 42.0–88.8% and 51.0–97.4%, respectively. The highest total biomass productivities were noted in pilot-scale reactors where values reached 339.4 mg L−1 d−1. The proposed attached growth reactors produced higher lipid yields than the suspended growth systems with maximum total and attached lipid concentrations reaching 19.6% and 18.4%, respectively. The produced lipid contained over 70% saturated and monounsaturated fatty acids, indicating that the produced biomass may potentially be used for biodiesel production. The above results reveal that the proposed laboratory- and pilot-scale systems can efficiently treat PLE and simultaneously reduce the operational costs via the recovery of lipids suitable for biofuel production. However, additional research is needed to further improve the efficiencies of nutrient uptake rates and biomass production, thus making the proposed systems more sustainable.

Supplementary Materials

The following are available online at https://www.mdpi.com/2071-1050/12/12/5024/s1, Table S1: Summary of available research applying poultry waste as a growth medium for microalgal growth, presenting substrates, cultivation modes, species, biomass-lipid productivities and nutrient removal efficiencies, Table S2: Physicochemical characterization of poultry litter extract (PLE), Table S3: Theoretical biodiesel properties of the fatty acids produced from the different substrates.

Author Contributions

Conceptualization, A.G.T. and O.N.T.; methodology, A.G.T., O.N.T., V.P., G.A., and M.M.-G.; validation, A.G.T., O.N.T., V.P., T.I.T., M.D., and N.S.; formal analysis, V.P., T.I.T., M.D., and N.S.; investigation, V.P. and N.S.; writing—original draft preparation, A.G.T., O.N.T., and V.P.; writing—review and editing, A.G.T., O.N.T., V.P., G.A., and M.M.-G.; supervision, A.G.T. All authors have read and agreed to the published version of the manuscript.

Funding

This research received no external funding.

Conflicts of Interest

The authors declare no conflict of interest.

References

  1. Nicholson, F.A.; Chambers, B.J.; Smith, K.A. Nutrient composition of poultry manures in England and Wales. Bioresour. Technol. 1996, 58, 279–284. [Google Scholar] [CrossRef]
  2. Markou, G.; Iconomou, D.; Muylaert, K. Applying raw poultry litter leachate for the cultivation of Arthrospira platensis and Chlorella vulgaris. Algal Res. 2016, 13, 79–84. [Google Scholar] [CrossRef]
  3. Markou, G. Fed-batch cultivation of Arthrospira and Chlorella in ammonia-rich wastewater: Optimization of nutrient removal and biomass production. Bioresour. Technol. 2015, 193, 35–41. [Google Scholar] [CrossRef]
  4. Singh, M.; Reynolds, D.L.; Das, K.C. Microalgal system for treatment of effluent from poultry litter anaerobic digestion. Bioresour. Technol. 2011, 102, 10841–10848. [Google Scholar] [CrossRef] [PubMed]
  5. Abdel-Raouf, N.; Al-Homaidan, A.A.; Ibraheem, I.B.M. Microalgae and wastewater treatment. Saudi J. Biol. Sci. 2012, 19, 257–275. [Google Scholar] [CrossRef] [PubMed] [Green Version]
  6. Liu, X.; Chen, G.; Tao, Y.; Wang, J. Application of effluent from WWTP in cultivation of four microalgae for nutrients removal and lipid production under the supply of CO2. Renew. Energy 2020, 149, 708–715. [Google Scholar] [CrossRef]
  7. Shabana, E.F.; Taofik, F.E.; Shalaby, H.S. Biodiesel production and nutrient removal by microalgae cultured on poultry waste. Egyptian J. Phycol. 2019, 20. Available online: https://scholar.cu.edu.eg/sites/default/files/hanaas/files/ejphycology-2019-08-09_1567622747.pdf (accessed on 15 May 2020).
  8. Bhatnagar, A.; Chinnasamy, S.; Singh, M.; Das, K.C. Renewable biomass production by mixotrophic algae in the presence of various carbon sources and wastewaters. Appl. Energy 2011, 88, 3425–3431. [Google Scholar] [CrossRef]
  9. Mandal, S.; Mallick, N. Biodiesel Production by the Green Microalga Scenedesmus obliquus in a Recirculatory Aquaculture System. Appl. Environ. Microbiol. 2012, 78, 5929–5934. [Google Scholar] [CrossRef] [Green Version]
  10. Bhati, R.; Mallick, N. Carbon dioxide and poultry waste utilization for production of polyhydroxyalkanoate biopolymers by Nostoc muscorum Agardh: A sustainable approach. J. Appl. Phycol. 2016, 28, 161–168. [Google Scholar] [CrossRef]
  11. De Bhowmick, G.; Sarmah, A.K.; Sen, R. Performance evaluation of an outdoor algal biorefinery for sustainable production of biomass, lipid and lutein valorizing flue-gas carbon dioxide and wastewater cocktail. Bioresour. Technol. 2019, 283, 198–206. [Google Scholar] [CrossRef] [PubMed]
  12. Mandal, S.; Mallick, N. Waste Utilization and Biodiesel Production by the Green Microalga Scenedesmus obliquus. Appl. Environ. Microbiol. 2011, 77, 374–377. [Google Scholar] [CrossRef] [PubMed] [Green Version]
  13. Wang, X.; Lin, L.; Lu, H.; Liu, Z.; Duan, N.; Dong, T.; Xiao, H.; Li, B.; Xu, P. Microalgae cultivation and culture medium recycling by a two-stage cultivation system. Front. Environ. Sci. Eng. 2018, 12, 14. [Google Scholar] [CrossRef]
  14. Mahadevaswamy, M.; Venkataraman, L.V. Bioconversion of Poultry Droppings for Biogas and Algal Production. Agric. Wastes 1986, 18, 93–101. [Google Scholar] [CrossRef]
  15. Iyovo, G.D.; Du, G.; Chen, J. Poultry Manure Digestate Enhancement of Chlorella Vulgaris Biomass under Mixotrophic Condition for Biofuel Production. J. Microb. Biochem. Technol. 2010, 2, 51–57. [Google Scholar] [CrossRef]
  16. Wang, M.; Wu, Y.; Li, B.; Dong, R.; Lu, H.; Zhou, H.; Cao, W. Pretreatment of poultry manure anaerobic-digested effluents by electrolysis, centrifugation and autoclaving process for Chlorella vulgaris growth and pollutants removal. Environ. Technol. 2015, 36, 837–843. [Google Scholar] [CrossRef]
  17. Wu, Y.; Wang, M.; Cao, W.; Li, B.; Liu, Z.; Lu, H. Optimization of Chlorella pyrenoidosa Y3 biomass production in poultry waste anaerobic-digested effluents using a response surface methodology. Desalin. Water Treat. 2016, 57, 8711–8719. [Google Scholar] [CrossRef]
  18. Markou, G.; Iconomou, D.; Sotiroudis, T.; Israilides, C.; Muylaert, K. Exploration of using stripped ammonia and ash from poultry litter for the cultivation of the cyanobacterium Arthrospira platensis and the green microalga Chlorella vulgaris. Bioresour. Technol. 2015, 196, 459–468. [Google Scholar] [CrossRef]
  19. Chisti, Y. Biodiesel from microalgae. Biotehnol. Adv. 2007, 25, 294–306. [Google Scholar] [CrossRef]
  20. Lowrey, J.; Brooks, M.S.; McGinn, P.J. Heterotrophic and mixotrophic cultivation of microalgae for biodiesel production in agricultural wastewaters and associated challenges—A critical review. J. Appl. Phycol. 2015, 27, 485–1498. [Google Scholar] [CrossRef]
  21. Kothari, R.; Prasad, R.; Kumar, V.; Singh, D.P. Production of biodiesel from microalgae Chlamydomonas polypyrenoideum grown on dairy industry wastewater. Bioresour. Technol. 2013, 144, 499–503. [Google Scholar] [CrossRef] [PubMed]
  22. Bellou, S.; Baeshen, M.N.; Elazzazy, A.M.; Aggeli, D.; Sayegh, F.; Aggelis, G. Microalgal lipids biochemistry and biotechnological perspectives. Biotechnol. Adv. 2014, 32, 1476–1493. [Google Scholar] [CrossRef] [PubMed]
  23. Dourou, M.; Tsolcha, O.; Tekerlekopoulou, A.; Bokas, D.; Aggelis, G. Fish farm effluents are suitable growth media for Nannochloropsis gaditana, a polyunsaturated fatty acid producing microalga. Eng. Life Sci. 2018, 18, 851–860. [Google Scholar] [CrossRef] [Green Version]
  24. Kothari, R.; Pathak, V.V.; Kumar, V.; Singh, D.P. Experimental study for growth potential of unicellular alga Chlorella pyrenoidosa on dairy wastewater: An integrated approach for treatment and biofuel production. Bioresour. Technol. 2012, 116, 466–470. [Google Scholar] [CrossRef]
  25. Gross, M.; Jarboe, D.; Wen, Z. Biofilm-based algal cultivation systems. Appl. Microbiol. Biotechnol. 2015, 99, 5781–5789. [Google Scholar] [CrossRef]
  26. Mantzorou, A.; Ververidis, F. Microalgal biofilms: A further step over current microalgal cultivation techniques. Sci. Total Environ. 2019, 651, 3187–3201. [Google Scholar] [CrossRef]
  27. Tsolcha, O.N.; Tekerlekopoulou, A.G.; Akratos, C.S.; Aggelis, G.; Genitsaris, S.; Moustaka-Gouni, M.; Vayenas, D.V. Agro-industrial wastewater treatment with simultaneous biodiesel production in attached growth systems using a mixed microbial culture. Water 2018, 10, 1693. [Google Scholar] [CrossRef] [Green Version]
  28. Zhang, B.; Li, W.; Guo, Y.; Zhang, Z.; Shi, W.; Cui, F.; Lens, P.N.L.; Tay, J.H. Microalgal-bacterial consortia: From interspecies interactions to biotechnological applications. Renew. Sustain. Energy Rev. 2020, 118, 109563. [Google Scholar] [CrossRef]
  29. Shen, Y.; Zhu, W.; Chen, C.; Nie, Y.; Lin, X. Biofilm formation in attached microalgal reactors. Bioprocess Biosyst. Eng. 2016, 39, 1281–1288. [Google Scholar] [CrossRef]
  30. Katarzyna, L.; Gu, S.; Singh, O.A. Non-enclosure methods for non-suspended micro- algae cultivation: Literature review and research needs. Renew. Sustain. Energy Rev. 2015, 42, 1418–1427. [Google Scholar] [CrossRef] [Green Version]
  31. Hoh, D.; Watson, S.; Kan, E. Algal biofilm reactors for integrated wastewater treatment and biofuel production: A review. Chem. Eng. J. 2016, 287, 466–473. [Google Scholar] [CrossRef] [Green Version]
  32. Lee, S.H.; Oh, H.M.; Jo, B.H.; Lee, S.A.; Shin, S.Y.; Kim, H.S.; Lee, S.H.; Ahn, C.Y. Higher biomass productivity of microalgae in an attached growth system, using wastewater. J. Microbiol. Biotechnol. 2014, 24, 1566–1573. [Google Scholar] [CrossRef]
  33. Johnson, M.B.; Wen, Z. Development of an attached microalgal growth system for biofuel production. Appl. Microbiol. Biotechnol. 2010, 85, 525–534. [Google Scholar] [CrossRef] [PubMed]
  34. De-Bashan, L.E.; Hernandez, J.P.; Morey, T.; Bashan, Y. Microalgae growth-promoting bacteria as “helpers” for microalgae: A novel approach for removing ammonium and phosphorus from municipal wastewater. Water Res. 2004, 38, 466–474. [Google Scholar] [CrossRef] [PubMed]
  35. Hoffmann, J.P. Wastewater treatment with suspended and non-suspended algae. J. Phycol. 1998, 34, 757–763. [Google Scholar] [CrossRef]
  36. Boelee, N.C.; Temmink, H.; Janssen, M.; Buisman, C.J.N.; Wijffels, R.H. Nitrogen and phosphorus removal from municipal wastewater effluent using microalgal biofilms. Water Res. 2011, 45, 5925–5933. [Google Scholar] [CrossRef] [PubMed]
  37. Tsolcha, O.N.; Tekerlekopoulou, A.G.; Akratos, C.S.; Bellou, S.; Aggelis, G.; Katsiapi, M.; Vayenas, D.V. Treatment of second cheese whey effluents using a Choricystis-based system with simultaneous lipid production. J. Chem. Technol. Biotechnol. 2016, 91, 2349–2359. [Google Scholar] [CrossRef]
  38. Tsolcha, O.N.; Tekerlekopoulou, A.G.; Akratos, C.S.; Aggelis, G.; Genitsaris, S.; Moustaka-Gouni, M.; Vayenas, D.V. Biotreatment of raisin and winery wastewaters and simultaneous biodiesel production using a Leptolyngbya-based microbial consortium. J. Clean. Prod. 2017, 148, 185–193. [Google Scholar] [CrossRef]
  39. Tsolcha, O.N.; Tekerlekopoulou, A.G.; Akratos, C.S.; Antonopoulou, G.; Aggelis, G.; Genitsaris, S.; Moustaka-Gouni, M.; Vayenas, D.V. A Leptolyngbya-based microbial consortium for agro-industrial wastewaters treatment and biodiesel production. Environ. Sci. Pollut. Res. 2018, 25, 17957–17966. [Google Scholar] [CrossRef]
  40. Economou, C.N.; Marinakis, N.; Moustaka-Gouni, M.; Kehayias, G.; Aggelis, G.; Vayenas, D.V. Lipid production by the filamentous cyanobacterium Limnothrix sp. growing in synthetic wastewater in suspended- and attached-growth photobioreactor systems. Ann. Microb. 2015, 65, 1941–1948. [Google Scholar] [CrossRef]
  41. American Public Health Association. Standard Methods for the Examination of Water and Wastewater, 20th ed.; American Public Health Association: Washington, DC, USA, 1998.
  42. Gonçalves, A.L.; Pires, J.C.M.; Simões, M. Wastewater polishing by consortia of Chlorella vulgaris and activated sludge native bacteria. J. Clean. Prod. 2016, 133, 348–357. [Google Scholar] [CrossRef]
  43. DuBois, M.; Gilles, K.A.; Hamilton, J.K.; Rebers, P.A.; Smith, F. Colorimetric method for determination of sugars and related substances. Anal. Chem. 1956, 28, 350–356. [Google Scholar] [CrossRef]
  44. American Public Health Association. Standard Methods for the Examination of Water and Wastewater, 21st ed.; American Public Health Association: Washington, DC, USA, 2005.
  45. Folch, J.; Lees, M.; Sloane-Stanley, G.A. A simple method for the isolation and purification of total lipids from animal tissues. J. Biol. Chem. 1957, 226, 497–509. [Google Scholar] [PubMed]
  46. Economou, C.N.; Aggelis, G.; Pavlou, S.; Vayenas, D.V. Single cell oil production from rice hulls hydrolysate. Bioresour. Technol. 2011, 102, 9737–9742. [Google Scholar] [CrossRef] [PubMed]
  47. Association Francaise de Normalisation. Collection of French Standards for Fats, Oleaginous Grains and Derived Products, 3rd ed.; French Association for Standardization, Paris (AFNOR): Paris, France, 1984; p. 95.
  48. Choi, H.J.; Lee, S.M. Effect of the N/P ratio on biomass productivity and nutrient removal from municipal wastewater. Bioprocess Biosyst. Eng. 2015, 38, 761–766. [Google Scholar] [CrossRef] [PubMed]
  49. Shashirekha, V.; Sivakumar, M.; Seshadri, S. Effective C–N–P ratio for growth and nutrient removal efficiency of Scenedesmus obliquus in sugar mill effluent. Energy Ecol. Environ. 2016, 1, 283–295. [Google Scholar] [CrossRef]
  50. Geider, R.; La Roche, J. Redfield revisited: Variability of C:N:P in marine microalgae and its biochemical basis. Eur. J. Phycol. 2002, 37, 1–17. [Google Scholar] [CrossRef] [Green Version]
  51. Khemka, A.; Saraf, M. Phycoremediation of dairy wastewater coupled with biomass production using Leptolyngbya sp. J. Environ. Sci. Water Res. 2015, 4, 104–111. [Google Scholar]
  52. Cho, H.U.; Park, J.M.; Kim, Y.M. Enhanced microalgal biomass and lipid production from a consortium of indigenous microalgae and bacteria present in municipal wastewater under gradually mixotrophic culture conditions. Bioresour. Technol. 2017, 228, 290–297. [Google Scholar] [CrossRef]
  53. Solmaz, A.; Işık, M. Polishing the secondary effluent and biomass production by microalgae submerged membrane photo bioreactor. Sustain. Energy Technol. Assess. 2019, 34, 1–8. [Google Scholar] [CrossRef]
  54. Van Den Hende, S.; Carré, E.; Cocaud, E.; Beelen, V.; Boon, N.; Vervaeren, H. Treatment of industrial wastewaters by microalgal bacterial flocs in sequencing batch reactors. Bioresour. Technol. 2014, 161, 245–254. [Google Scholar] [CrossRef] [PubMed]
  55. Ma, X.; Zhou, W.; Fu, Z.; Cheng, Y.; Min, M.; Liu, Y.; Zhang, Y.; Chen, P.; Ruan, R. Effect of wastewater-borne bacteria on algal growth and nutrients removal in wastewater-based algae cultivation system. Bioresour. Technol. 2014, 167, 8–13. [Google Scholar] [CrossRef] [PubMed]
  56. Lee, C.S.; Lee, S.A.; Ko, S.R.; Oh, H.M.; Ahn, C.Y. Effects of photoperiod on nutrient removal, biomass production, and algal-bacterial population dynamics in lab-scale photobioreactors treating municipal wastewater. Water Res. 2015, 68, 680–691. [Google Scholar] [CrossRef] [PubMed]
  57. Gupta, S.K.; Ansari, F.A.; Shriwastav, A.; Sahoo, N.K.; Rawat, I.; Bux, F. Dual role of Chlorella sorokiniana and Scenedesmus obliquus for comprehensive wastewater treatment and biomass production for bio-fuels. J. Clean. Prod. 2016, 115, 255–264. [Google Scholar] [CrossRef] [Green Version]
  58. Tricolici, O.; Bumbac, C.; Postolache, C. Microalgae—Bacteria System for Biological Wastewater Treatment. J. Environ. Prot. Ecol. 2015, 15, 268–276. [Google Scholar]
  59. Su, Y.; Mennerich, A.; Urban, B. Municipal wastewater treatment and biomass accumulation with a wastewater-born and settleable algal-bacterial culture. Water Res. 2011, 45, 3351–3358. [Google Scholar] [CrossRef]
  60. Singh, J.; Tripathi, R.; Thakur, I.S. Characterization of endolithic cyanobacterial strain, Leptolyngbya sp. ISTCY101, for prospective recycling of CO2 and biodiesel production. Bioresour. Technol. 2014, 166, 345–352. [Google Scholar] [CrossRef]
  61. Singh, J.; Thakur, I.S. Evaluation of cyanobacterial endolith Leptolyngbya sp. ISTCY101, for integrated wastewater treatment and biodiesel production: A toxicological perspective. Algal Res. 2015, 11, 294–303. [Google Scholar] [CrossRef]
  62. Gutzeit, G.; Lorch, D.; Weber, A.; Engels, M.; Neis, U. Bioflocculent algal–bacterial biomass improves low-cost wastewater treatment. Water Sci. Technol. 2005, 52, 9–18. [Google Scholar] [CrossRef]
  63. Zamalloa, C.; Boon, N.; Verstraete, W. Bioresource Technology Decentralized two-stage sewage treatment by chemical—Biological flocculation combined with microalgae biofilm for nutrient immobilization in a roof installed parallel plate reactor. Bioresour. Technol. 2013, 130, 152–160. [Google Scholar] [CrossRef]
  64. González, C.; Marciniak, J.; Villaverde, S.; León, C.; García, P.A.; Muñoz, R. Efficient nutrient removal from swine manure in a tubular biofilm photo-bioreactor using algae-bacteria consortia. Water Sci. Technol. 2008, 58, 95–102. [Google Scholar] [CrossRef]
  65. Rai, J.; Kumar, D.; Pandey, L.K.; Yadav, A.; Gaur, J.P. Potential of cyanobacterial biofilms in phosphate removal and biomass production. J. Environ. Manag. 2016, 177, 138–144. [Google Scholar] [CrossRef] [PubMed]
  66. Posadas, E.; García-Encina, P.; Soltau, A.; Domínguez, A.; Díaz, I.; Muñoz, R. Carbon and nutrient removal from centrates and domestic wastewater using algal—Bacterial biofilm bioreactors. Bioresour. Technol. 2013, 139, 50–58. [Google Scholar] [CrossRef] [PubMed]
  67. Adey, W.H.; Kangas, P.C.; Mulbry, W. Algal Turf Scrubbing: Cleaning Surface Waters with Solar Energy while Producing a Biofuel. BioScience 2011, 61, 434–441. [Google Scholar] [CrossRef] [Green Version]
  68. Travieso, L.; Benítez, F.; Sánchez, E.; Borja, R.; Colmenarejo, M.F. Production of Biomass (Algae-Bacteria) by Using a Mixture of Settled Swine and Sewage as Substrate. J. Environ. Sci. Health Part A Tox. Hazard Subst. Environ. Eng. 2006, 41, 415–429. [Google Scholar] [CrossRef] [PubMed]
  69. Gao, F.; Li, C.; Yang, Z.H.; Zeng, G.M.; Feng, L.J.; Liu, J.; Liu, M.; Cai, H. Continuous microalgae cultivation in aquaculture wastewater by a membrane photobioreactor for biomass production and nutrients removal. Ecol. Eng. 2016, 92, 55–61. [Google Scholar] [CrossRef]
  70. Anbalagan, A.; Toledo-Cervantes, A.; Posadas, E.; Rojo, E.M.; Lebrero, R.; González-Sánchez, A.; Nehrenheim, E.; Muñoz, R. Continuous photosynthetic abatement of CO2 and volatile organic compounds from exhaust gas coupled to wastewater treatment: Evaluation of tubular algal-bacterial photobioreactor. J. CO2 Util. 2017, 21, 353–359. [Google Scholar] [CrossRef]
  71. Viruela, A.; Robles, Á.; Durán, F.; Ruano, M.V.; Barat, R.; Ferrer, J.; Seco, A. Performance of an outdoor membrane photobioreactor for resource recovery from anaerobically treated sewage. J. Clean. Prod. 2018, 178, 665–674. [Google Scholar] [CrossRef]
  72. Van Den Hende, S.; Beelen, V.; Julien, L.; Lefoulon, A.; Vanhoucke, T.; Coolsaet, C.; Sonnenholzner, S.; Vervaeren, H.; Rousseau, D.P.L. Technical potential of microalgal bacterial floc raceway ponds treating food-industry effluents while producing microalgal bacterial biomass: An outdoor pilot-scale study. Bioresour. Technol. 2016, 218, 969–979. [Google Scholar] [CrossRef]
  73. Ferrero, E.M.; de Godos, I.; Rodríguez, E.M.; García-Encina, P.A.; Muñoz, R.; Bécares, E. Molecular characterization of bacterial communities in algal-bacterial photobioreactors treating piggery wastewaters. Ecol. Eng. 2012, 40, 121–130. [Google Scholar] [CrossRef]
  74. De Godos, I.; González, C.; Becares, E.; García-Encina, P.A.; Muñoz, R. Simultaneous nutrients and carbon removal during pretreated swine slurry degradation in a tubular biofilm photobioreactor. Appl. Microbiol. Biotechnol. 2009, 82, 187–194. [Google Scholar] [CrossRef] [PubMed]
  75. Su, Y.; Mennerich, A.; Urban, B. Synergistic cooperation between wastewater-born algae and activated sludge for wastewater treatment: Influence of algae and sludge inoculation ratios. Bioresour. Technol. 2012, 105, 67–73. [Google Scholar] [CrossRef]
  76. Christenson, L.B.; Sims, R.C. Rotating Algal Biofilm Reactor and Spool Harvester for Wastewater Treatment with. Biotechnol. Bioeng. 2012, 109, 1674–1684. [Google Scholar] [CrossRef] [PubMed]
  77. Sebestyén, P.; Blanken, W.; Bacsa, I.; Tóth, G.; Martin, A.; Bhaiji, T.; Dergez, A.; Kesseru, P.; Koos, A.; Kiss, I. Upscale of a laboratory rotating disk biofilm reactor and evaluation of its performance over a half-year operation period in outdoor conditions. Algal Res. 2016, 18, 266–272. [Google Scholar] [CrossRef]
  78. Boelee, N.C.; Janssen, M.; Temmink, H.; Taparavičiute, L.; Khiewwijit, R.; Jánoska, Á.; Busiman, C.J.N.; Wijffels, R.H. The effect of harvesting on biomass production and nutrient removal in phototrophic biofilm reactors for effluent polishing. J. Appl. Phycol. 2014, 26, 1439–1452. [Google Scholar] [CrossRef]
  79. Gross, M.; Henry, W.; Michael, C.; Wen, Z. Development of a rotating algal biofilm growth system for attached microalgae growth with in situ biomass harvest. Bioresour. Technol. 2013, 150, 195–201. [Google Scholar] [CrossRef]
  80. Derakhshan, Z.; Mahvi, A.H.; Ehrampoush, M.H.; Mazloomi, S.M.; Faramarzian, M.; Dehghani, M.; Yousefinejad, S.; Ghaneian, M.T.; Abtahi, S.M. Studies on influence of process parameters on simultaneous biodegradation of atrazine and nutrients in aquatic environments by a membrane photobioreactor. Environ. Res. 2018, 161, 599–608. [Google Scholar] [CrossRef] [Green Version]
  81. He, S.; Xue, G. Algal-based immobilization process to treat the effluent from a secondary wastewater treatment plant (WWTP). J. Hazard. Mater. 2010, 178, 895–899. [Google Scholar] [CrossRef]
  82. Wei, Q.; Hu, Z.; Li, G.; Xiao, B.; Sun, H.; Tao, M. Removing nitrogen and phosphorus from simulated wastewater using algal biofilm technique. Front. Environ. Sci. Eng. China 2008, 2, 446–451. [Google Scholar] [CrossRef]
  83. Orfanos, A.G.; Manariotis, I.D. Algal biofilm ponds for polishing secondary effluent and resource recovery. J. Appl. Phycol. 2019, 31, 1765–1772. [Google Scholar] [CrossRef]
  84. Shayan, S.I.; Agblevor, F.A.; Bertin, L.; Sims, R.C. Hydraulic retention time effects on wastewater nutrient removal and bioproduct production via rotating algal biofilm reactor. Bioresour. Technol. 2016, 211, 527–533. [Google Scholar] [CrossRef] [Green Version]
  85. Shi, J.; Podola, B.; Melkonian, M. Application of a prototype-scale twin-layer photobioreactor for effective N and P removal from different process stages of municipal wastewater by immobilized microalgae. Bioresour. Technol. 2014, 154, 260–266. [Google Scholar] [CrossRef] [PubMed]
  86. Hu, Q.; Sommerfeld, M.; Jarvis, E.; Ghirardi, M.; Posewitz, M.; Seibert, M.; Darzins, A. Microalgal triacylglycerols as feedstocks for biofuel production: Perspectives and advances. Plant J. 2008, 54, 621–639. [Google Scholar] [CrossRef] [PubMed]
  87. Wahidin, S.; Idris, A.; Raehanah, S.; Shaleh, M. The influence of light intensity and photoperiod on the growth and lipid content of microalgae Nannochloropsis sp. Bioresour. Technol. 2013, 129, 7–11. [Google Scholar] [CrossRef]
  88. Rodolfi, L.; Zittelli, G.C.; Bassi, N.; Padovani, G.; Biondi, N.; Bonini, N.; Tredici, M.R. Microalgae for Oil: Strain Selection, Induction of Lipid Synthesis and Outdoor Mass Cultivation in a Low-Cost Photobioreactor. Biotechnol. Bioeng. 2009, 102, 100–112. [Google Scholar] [CrossRef] [PubMed]
  89. Talebi, A.F.; Tabatabaei, M.; Chisti, Y. BiodieselAnalyzer©: A user-friendly software for predicting the properties of prospective biodiesel. Biofuel Res. J. 2015, 1, 55–57. [Google Scholar] [CrossRef]
  90. Knothe, G. Dependence of biodiesel fuel properties on the structure of fatty acid alkyl esters. Fuel Process Technol. 2005, 86, 1059–1070. [Google Scholar] [CrossRef]
Figure 1. Schematic diagrams of: (a) The pilot-scale reactor (1: Photobioreactor (PBR), 2: Fluorescence light tubes placed peripherally of the PBR, 3: Air diffuser, 4: Recirculator, 5: Air compressor) and (b) the support material lines used inside the pilot-scale PBR.
Sustainability 12 05024 g001
Figure 2. Evolution of total biomass using poultry litter extract (PLE) as substrate in the laboratory-scale (L), suspended growth (S) system. LP: Lab-scale experiment using PLE of different dilutions (S1, S2, S3).
Sustainability 12 05024 g002
Figure 3. Profile of (a) d-COD, (b) total sugars, (c) NO3-N, and (d) PO43− removal over time in the different substrates of the laboratory-scale (L), suspended growth (S) system. LP: Lab-scale experiments using PLE of different dilutions (S1, S2, S3). All initial concentrations are given in Table 1.
Sustainability 12 05024 g003
Figure 4. Evolution of total biomass using PLE as substrate in the laboratory-scale (L), attached growth (A) system. LP: Lab-scale experiment using PLE of different dilutions (A1, A2, A3).
Sustainability 12 05024 g004
Figure 5. Profile of (a) d-COD, (b) total sugars, (c) NO3-N, and (d) PO43− removal over time in the different substrates of the laboratory-scale (L) attached growth (A) system. LP: Lab-scale experiments using PLE of different dilutions (A1, A2, A3). All initial concentrations are given in Table 1.
Sustainability 12 05024 g005
Figure 6. Evolution of total biomass in the pilot-scale suspended growth photobioreactor using different recirculation flow rates of: 800 (PP-800), 1000 (PP-100), and 1200 mL min−1 (PP-1200). PP1-1200: recirculation rate of 1200 mL min−1 with initial nutrient and d-COD concentrations exceeding those of PP-1200. All initial concentrations are given in Table 3.
Sustainability 12 05024 g006
Figure 7. Profile of: (a) d-COD, (b) total sugars, (c) NO3-N, and (d) PO43− removal over time in the pilot-scale suspended growth photobioreactor using different recirculation flow rates of: 800 (PP-800), 1000 (PP-1000), and 1200 mL min −1 (PP-1200). PP1-1200: recirculation rate of 1200 mL min−1 with initial nutrient and d-COD concentrations exceeding those of PP-1200. All initial concentrations are given in Table 3.
Sustainability 12 05024 g007
Figure 8. Evolution of total biomass using poultry litter extract (PLE) as substrate in the pilot-scale (P), suspended growth (S) system. PP: Pilot-scale experiment using PLE of different dilutions (S1, S2, S3, S4).
Sustainability 12 05024 g008
Figure 9. Profile of (a) d-COD, (b) total sugars, (c) NO3-N, and (d) PO43− removal over time in the different substrates of the pilot-scale (P), suspended growth (S) system. PP: Pilot-scale experiments using PLE of different dilutions (S1, S2, S3, S4). All initial concentrations are given in Table 1.
Sustainability 12 05024 g009
Figure 10. Evolution of total biomass using poultry litter extract (PLE) as substrate in the pilot-scale (P), attached growth (A) system. PP: Pilot-scale experiment using PLE at different dilutions (A1, A2, A3).
Sustainability 12 05024 g010
Figure 11. Profile of (a) d-COD, (b) total sugars, (c) NO3-N, and (d) PO43 removal over time in the different substrates of the pilot-scale (P) attached growth (A) system. PP: Pilot-scale experiment using PLE of different dilutions (A1, A2, A3). All initial concentrations are given in Table 1.
Sustainability 12 05024 g011
Figure 12. Fatty acid profiles of lipids produced in: (a) Laboratory-scale experiments (L) for suspended (S) and attached (A) growth systems using PLE of different dilutions (LP–S1, S2, S3 and LP–A1, A2, A3), and (b) pilot-scale experiments (P) for suspended (S) and attached (A) growth systems using PLE of different dilutions (PP–S1, S2, S3, S4 and PP–A1, A2, A3).
Sustainability 12 05024 g012
Table 1. Initial pollutant concentrations of all substrates used in the photobioreactors.
Initial Pollutant Concentrations (mg L−1)
Experimental Substrated-CODNO3-NTotal NitrogenPO43−Total SugarsTotal BiomassN:PC:N
LP-S1 a2005.5 ± 95.526.9 ± 0.63122.5 ± 0.720.8 ± 4.1101.6 ± 0.1243.7 ± 10.63.5216.4
LP-S2 a1145.0 ± 133.213.7 ± 0.573.2 ± 5.412.7 ± 0.346.3 ± 1.5202.5 ± 0.75.7615.6
LP-S3 a491.6 ± 59.420.9 ± 0.2127.8 ± 2.413.3 ± 0.728.1 ± 3.6129.0 ± 7.19.603.85
LC-S bN/D i68.0 ± 3.168.1± 1.411.7 ± 2.34.9 ± 2.970.0 ± 22.65.82-
LP-A1 c2287.0 ± 122.063.7 ± 3.3101.3 ± 10.521.1 ± 1.1108.1 ± 6.1480.0 ± 40.54.8022.8
LP-A2 c1177.0 ± 22.522.6 ± 0.492.2 ± 8.615.5 ± 2.145.0 ± 2.2246.4 ± 83.85.9512.8
LP-A3 c400.0 ± 38.06.8 ± 0.538.4 ± 5.57.2 ± 0.223.1 ± 2.4365.0 ± 20.95.3310.42
LC-A dN/D i99.6 ± 2.7100.817.8 ± 0.33.4 ± 0.173.5 ± 42.05.66-
PP-S1 e3232.5 ± 226.041.7 ± 4.448.7 ± 2.243.6 ± 9.5111.8 ± 3.8538.0 ± 26.51.1166.4
PP-S2 e1873.3 ± 10.535.2 ± 0.942.5 ± 0.528.2 ± 5.586.1 ± 5.2374.0 ± 67.01.5144.1
PP-S3 e1217.0 ± 162.027.2 ± 0.148.5 ± 2.318.4 ± 0.179.3 ± 3.8442.0 ± 67.02.6325.1
PP-S4 e638.8 ± 25.220.1 ± 1.921.7 ± 4.615.3 ± 0.139.0 ± 1.1259.0 ± 24.01.4229.4
PC-S fN/D i67.0 ± 4.167.1 ± 0.042.1 ± 1.530.05 ± 0.188.0 ± 56.51.60-
PP-A1 g3229.3 ± 197.075.3 ± 1.6152.4 ± 1.153.6 ± 7.1167.5 ± 4.8446.3 ± 36.02.8421.2
PP-A2 g2032.0 ± 78.855.5 ± 5.1199.0 ± 5.349.3 ± 3.0229.4 ± 0.6454.0 ± 48.04.0410.2
PP-A3 g1343.0 ± 44.030.6 ± 1.265.9 ± 1.231.6 ± 5.4167.1 ± 13.7316.0 ± 62.22.0820.4
PC-A hN/D i75.8 ± 0.175.85 ± 0.040.0 ± 2.07.5 ± 0.198.0 ± 16.01.90-
a LP-S1,S2,S3 = Laboratory-scale experiments in suspended growth reactors using poultry litter extract at different dilutions, b LC-S = Laboratory-scale experiment in a suspended growth reactor using chemical medium, c LP-A1,A2,A3 = Laboratory-scale experiments in attached growth reactors using poultry litter extract at different dilutions, d LC-A = Laboratory-scale experiment in an attached growth reactor using chemical medium, e PP-S1,S2,S3,S4 = Pilot-scale experiments in suspended growth reactors using poultry litter extract at different dilutions, f PC-S = Pilot-scale experiment in a suspended growth reactor using chemical medium, g PP-A1,A2,A3 = Pilot-scale experiments in attached growth reactors using poultry litter extract at different dilutions, h PC-A = Pilot-scale experiment in an attached growth reactor using chemical medium, i N/D = Not Detected.
Table 2. Nutrient removal rates, lipid content, biomass productivity, and specific growth rate for all PBR experiments.
Experimental
Set
% Removal Rate% Maximum Lipid ContentBiomass
Productivity
Specific
Growth Rate (d−1)
NO3-NTotal NitrogenPO43−Total Sugarsd-CODTotalAttachedTotal
mg L−1 d−1
Attached
g m−2d−1
LP-S1 a42.2 ± 0.774.0 ± 3.442.0 ± 2.148.0 ± 6.066.1 ± 3.58.3 ± 1.0-153.7-0.260
LP-S2 a45.5 ± 0.551.2 ± 5.085.0 ± 0.531.5 ± 3.068.0 ± 7.810.3 ± 1.5-198.9-0.206
LP-S3 a47.5 ± 0.280.5 ± 3.388.8 ± 0.47.0 ± 2.558.0 ± 5.015.5 ± 3.5-111.0-0.184
LC-S b75.2 ± 3.0N/D i94.5 ± 1.2-N/D i16.6 ± 1.2-47.2-0.111
LP-A1 c82.5 ± 3.388.2 ± 9.083.0 ± 2.079.3 ± 1.294.0 ± 1.314.8 ± 2.517.7 ± 3.3152.05.20.187
LP-A2 c74.3 ± 0.482.3 ± 4.297.4 ± 1.165.1 ± 1.877.0 ± 19.59.8 ± 2.414.3 ± 1.2169.62.90.153
LP-A3 c35.0 ± 5.679.8 ± 5.091.0 ± 0.117.3 ± 2.264.5 ± 0.419.6 ± 0.118.4 ± 2.9109.54.10.140
LC-A d93.7 ± 1.4N/D i95.0 ± 0.4-N/D i15.1 ± 4.015.9 ± 2.2119.01.60.246
PP-S1 e46.3 ± 2.254.0 ± 1.262.3 ± 4.873.8 ± 2.688.4 ± 3.76.5 ± 0.07-157.3-0.287
PP-S2 e54.2 ± 0.561.6 ± 2.867.8 ± 3.259.1 ± 3.688.4 ± 12.88.6 ± 1.1-339.4-0.291
PP-S3 e53.0 ± 0.259.2 ± 3.163.5 ± 0.167.7 ± 1.874.2 ± 14.08.0 ± 2.5-210.6-0.203
PP-S4 e44.0 ± 1.2336.4 ± 0.151.0 ± 0.265.4 ± 1.774.0 ± 12.05.7 ± 2.2-175.7-0.224
PC-S f59.0 ± 2.6N/D i98.8 ± 1.1-N/D i18.2 ± 3.7-150.6-0.130
PP-A1 g65.0 ± 1.168.5 ± 0.681.0 ± 3.880.0 ± 3.780.0 ± 11.313.0 ± 1.87.5 ± 0.1227.01.50.292
PP-A2 g55.2 ± 3.069.4 ± 0.976.8 ± 2.883.8 ± 0.582.0 ± 6.210.1 ± 0.87.3 ± 1.3316.53.40.380
PP-A3 g31.0 ± 2.363.5 ± 3.567.8 ± 2.870.2 ± 3.751.5 ± 4.49.1 ± 1.29.5 ± 0.1335.32.00.232
PC-A h67.0 ± 0.2N/D i87.6 ± 1.1-N/D i16.1 ± 0.215.3 ± 0.3112.00.50.112
a–h Abbreviations of experiment sets follow those of Table 1. i N/D = Not Detected.
Table 3. Effect of recirculation rate on nutrient removal from poultry litter extract, biomass productivity, lipid content, and specific growth rate.
Experimental
Set—Recirculation Rate
(mL min−1 )
N:PC:NInitial
NO3-N (mg L−1)
NO3-N Removal
(%)
Initial
Total Nitrogen
(mg L1)
Total Nitrogen Removal
(%)
Initial PO43
(mg L1)
PO43−
Removal
(%)
Initial
d-COD
(mg L1)
d-COD Removal
(%)
Initial Total Sugars
(mg L1)
Total Sugars Removal
(%)
Maximum Lipid
Content
(mg L1)
Maximum Biomass Productivity
(mg L1 d1)
Specific Growth Rate
(d1)
PP-800 a2.948.910.1 ± 0.244.524.0 ± 0.31008.2 ± 0.687.41173.4 ± 226.070.022.7 ± 1.0321.47.5111.00.07
PP-1000 b2.625.127.2 ± 0.153.048.5 ± 0.459.218.4 ± 0.163.51217.0 ± 162.074.279.3 ± 3.867.78.0210.60.203
PP-1200 c2.924.519.8 ± 0.165.047.9 ± 2.254.216.1 ± 0.690.01172.3
± 57.0
77.463.3 ± 4.566.06.0197.10.225
PP1-1200 d1.3622.528.2 ± 0.945.691.4 ± 1.683.220.7 ± 0.667.62050.0 ± 108.060.074.9 ± 0.1472.77.7177.00.19
a PP-800 = Recirculation rate of 800 mL min−1, b PP-1000 = Recirculation rate of 1000 mL min−1, c PP-1200 = Recirculation rate of 1200 mL min−1, d PP1-1200 = Recirculation rate of 1200 mL min−1 and higher initial nutrient concentrations.

