Article

Temporal-Spatial Variations and Influencing Factor of Land Use Change in Xinjiang, Central Asia, from 1995 to 2015

1
Xinjiang Institute of Ecology and Geography, Chinese Academy of Sciences, Urumqi 830011, China
2
University of Chinese Academy of Sciences, Beijing 100049, China
*
Author to whom correspondence should be addressed.
Sustainability 2019, 11(3), 696; https://doi.org/10.3390/su11030696
Submission received: 11 December 2018 / Revised: 24 January 2019 / Accepted: 26 January 2019 / Published: 29 January 2019

Abstract

:
In this study, we analyzed the temporal-spatial variations of the characteristics of land use change in central Asia over the past two decades. This was conducted using four indicators (change rate, equilibrium extent, dynamic index, and transfer direction) and a multi-scale correlation analysis method, which explained the impact of recent environmental transformations on land use changes. The results indicated that the integrated dynamic degree of land use increased by 2.2% from 1995 to 2015. The areas of cropland, water bodies, and artificial land increased, with rates of 1047 km2/a, 39 km2/a, and 129 km2/a, respectively. On the other hand, the areas of forest, grassland, and unused land decreased, with rates of 54 km2/a, 803 km2/a, and 359 km2/a, respectively. There were significant increases in cropland and water bodies from 1995 to 2005, while the amount of artificial land significantly increased from 2005 to 2015. The increased areas of cropland in Xinjiang were mainly converted from grassland and unused land from 1995 to 2015, while the artificial land increase was mainly a result of the conversion from cropland, grassland, and unused land. The area of cropland rapidly expanded in south Xinjiang, which has led to centroid position to move cropland in Xinjiang in a southwest direction. Economic development and the rapid growth of population size are the main factors responsible for the cropland increases in Xinjiang. Runoff variations have a key impact on cropland changes at the river basin scale, as seen in three typical river basins.

1. Introduction

Land cover and land use change is a result of the combined effects of climate change and human activities [1]. Types of land use are different in different climatic conditions. For example, wet areas are dominated by forest [2], arid and semi-arid areas are dominated by grassland [3], while arid areas are dominated by desert [4]. Climate warming and wetting changes will correspondingly result in further land use changes [5].
Global environmental changes are gradually causing changes in land cover and land use [6]. Climate change drives the grasslands vegetation communities to become shrub-encroached grasslands in arid and semi-arid regions, which has attracted the attention of researchers [7,8,9]. Changes in dry and wet conditions can also lead to changes in land use types [10,11], especially in arid regions, where water resources from river runoff mainly come from glaciers, snow melt, and precipitation in mountainous regions, which are significantly affected by climate change [12]. Global warming has been observed to accelerate in glaciers and snow melt [13], thus runoff will increase in a short period [14], but may not continue. This feature will impact the changes in oasis land use types in arid regions.
In arid areas, the main land use type is unused land, whereas cropland is distributed in oasis regions, while forest land and grassland are mainly located in mountainous areas [15]. In arid and semi-arid regions, there is a consistent performance showed that when cropland increased, the forest and grassland decreased. This occurred in South Asian [16], Central Asian [17], and the Mongolian plateau [18]. The stability of land use structure is relatively fragile and water resources are the basis and key factor for the changes of land use structure in arid regions. When glaciers and snow melt water runoff increase [17], cultivated land will also increase [19]. In the middle and later periods of glacier melt, the river outflow will be reduced and when the amounts of available water cannot support the levels of water use required by croplands, this can be followed by the desertification of cropland, such as in the Shiyang River Basin [20]. At the same time, human activities have also driven land use changes [21,22] and this anthropogenic role will increase with economic development or technology. The impact of human activities on land use types is multifaceted.
Therefore, it is important to study the impacts of climate change and human activities on land use changes in arid regions. In this study, we focused on temporal-spatial variations of land use under climate change, in addition to human activities in arid regions from 1995 to 2015, based on land use data, runoff, climate data, and socioeconomic data.

2. Materials and Methods
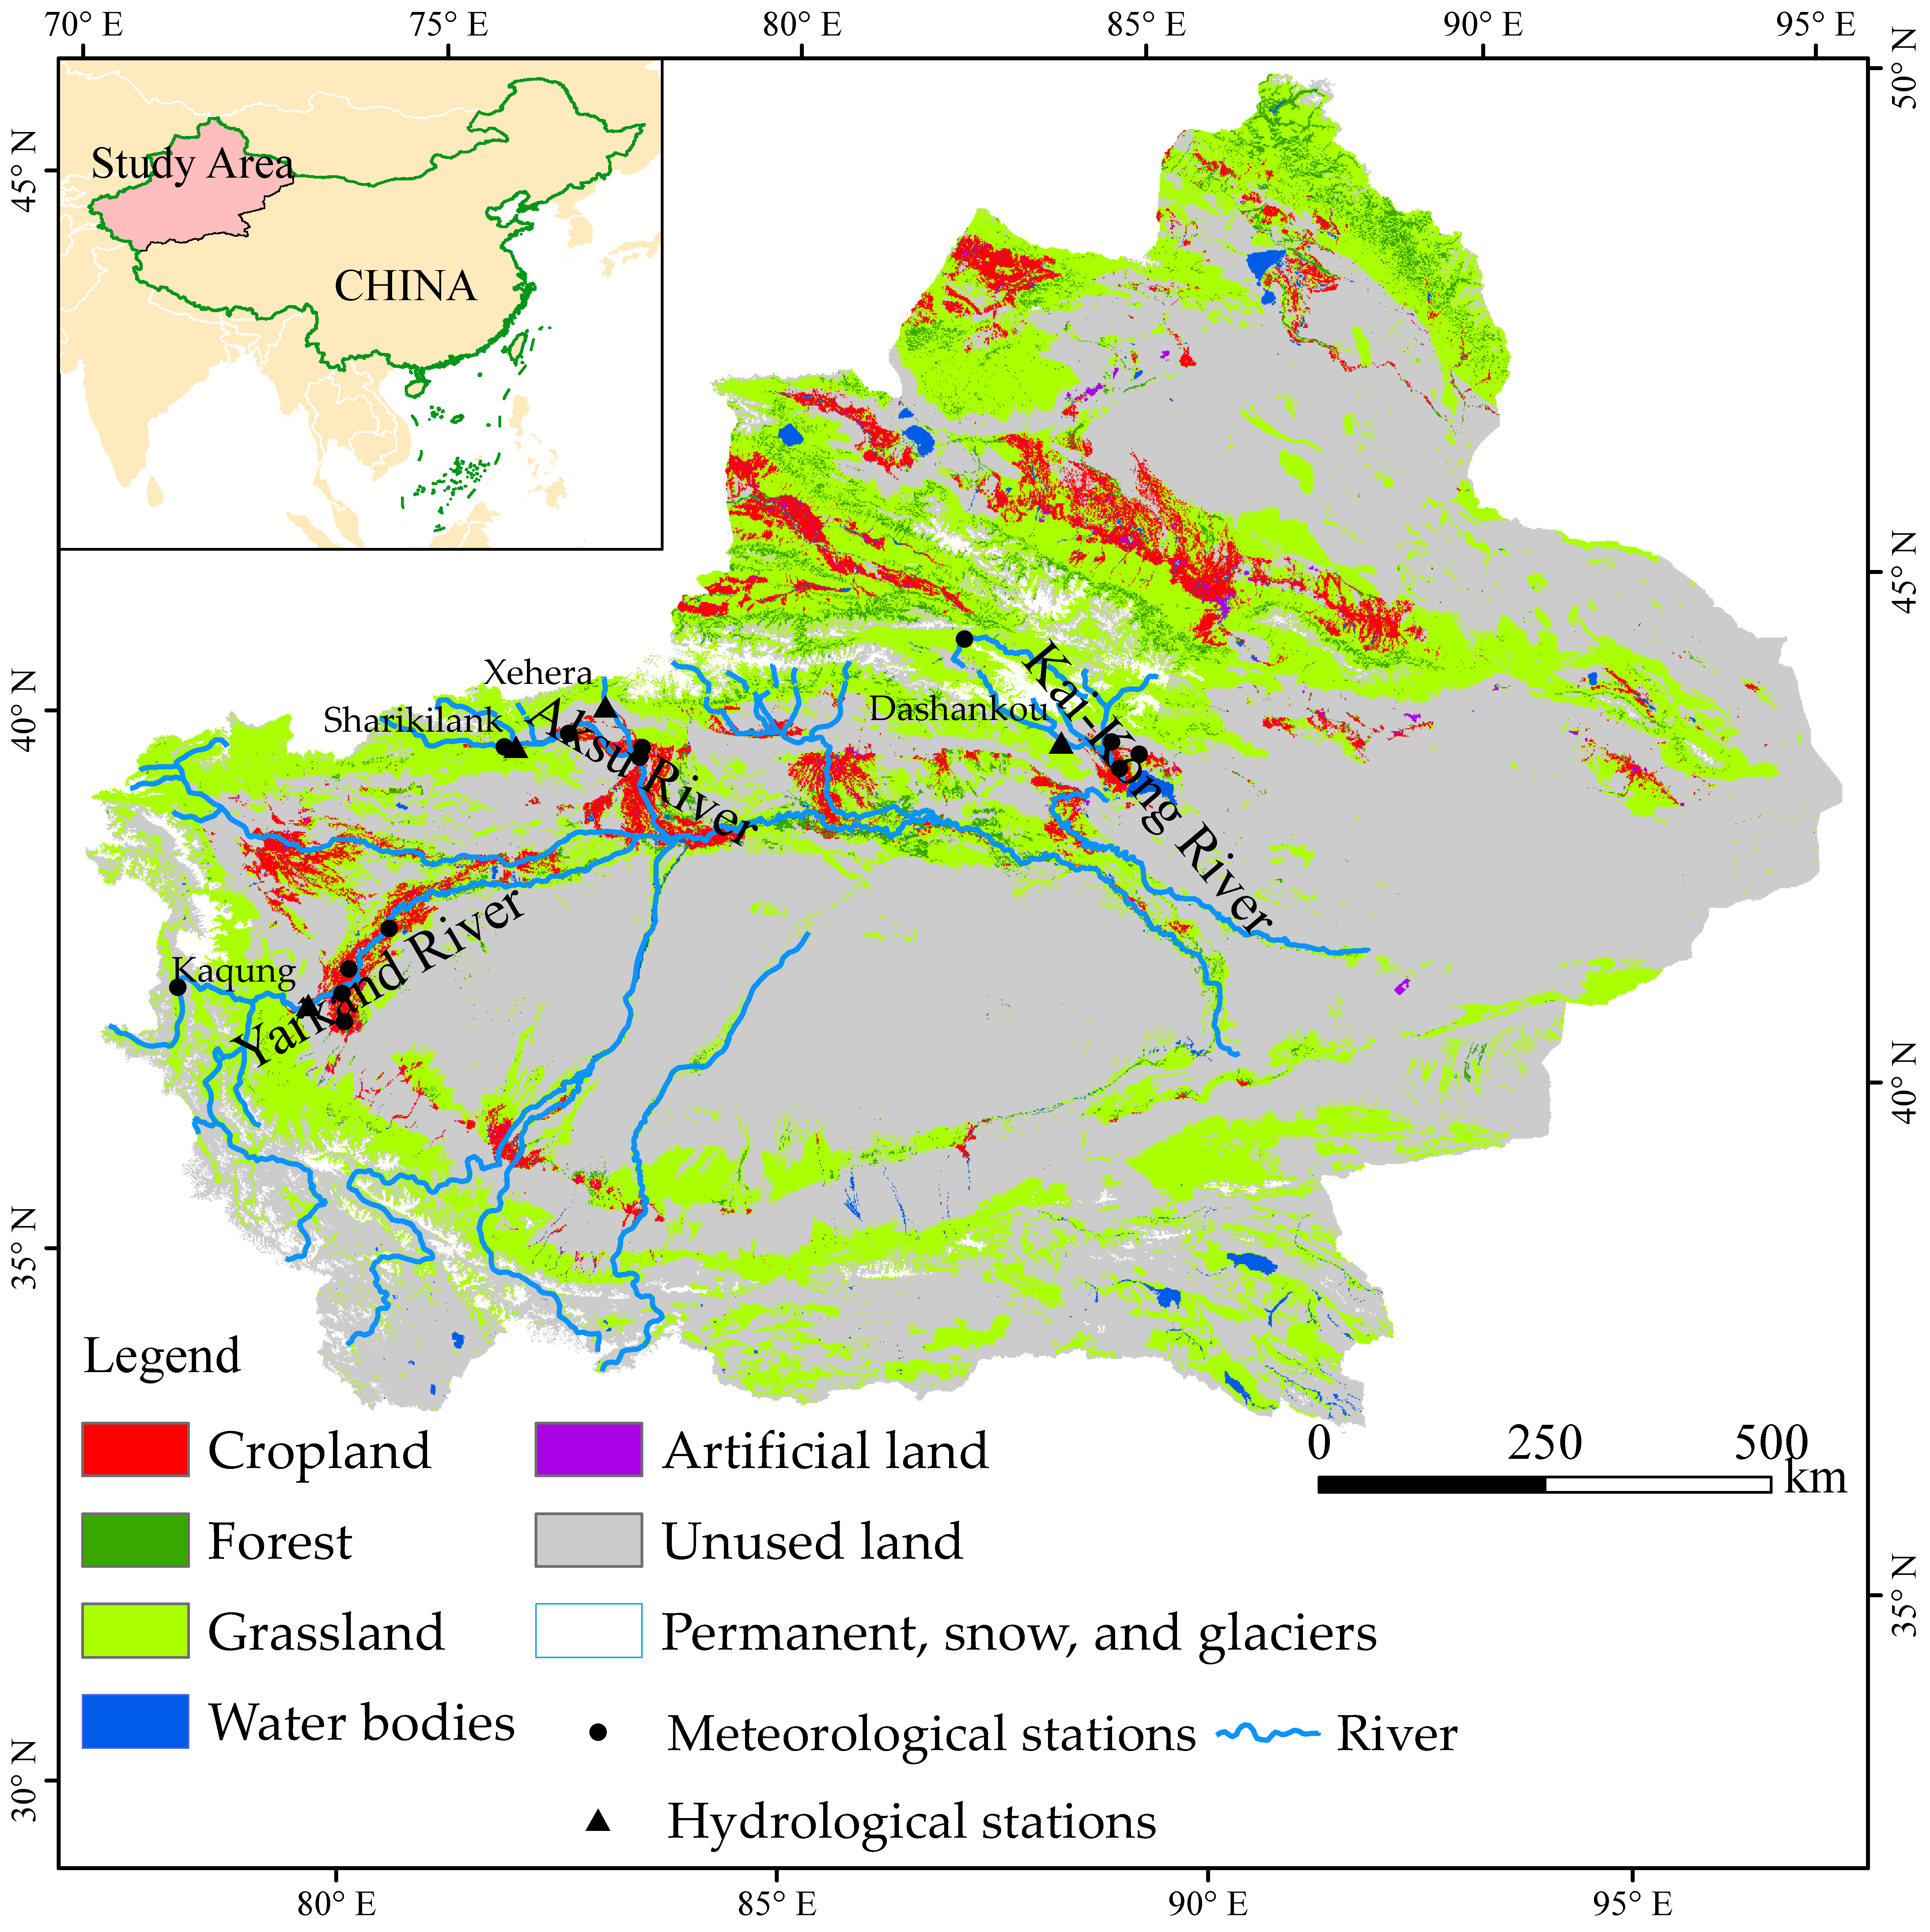
2.1. Study Area

Xinjiang region is located in Northwest China, far away from the sea, belonging to the innermost part of Asia. It is largely confined within 34°54’4–9°19’N and 73°44’–96°22’E (Figure 1). The Xinjiang is split by the Tien Shan Mountain, which divides it into two large basins: the Junggar Basin in the north and the Tarim Basin in the south. The Xinjiang has a typical continental subtropical climate, with less precipitation and a large daily temperature range. Therefore, this area is mostly covered with desert and dry grasslands. The dotted oasis is located at the foot of the Tienshan Mountains, the Kunlun Mountains, and the Altai Mountains, because glaciers and snow melt from mountainous areas are the main water sources for agricultural production and social and economic activities in Xinjiang. The Kai-Kong River Basin, the Aksu River Basin, and the Yarkand River Basin are located in Southern Xinjiang (Figure 1) and glaciers and snow melt are main parts of the river outflow [23]. Therefore, the three river basins are typical watersheds in the study area. The downstream areas of the three basins are oasis areas.

2.2. Data

The land use data are provided by the Data Center for Resources and Environmental Sciences, Chinese Academy of Sciences (RESDC), which includes five years: 1995, 2000, 2005, 2010, and 2015, respectively. The years 1995, 2000, 2005, and 2010 are used Landsat ET/ETM images; 2015 used Landsat 8 images. The datasets are gridded at 1 by 1 km. The land use types mainly contain six categories (i.e., cropland, forest, grassland, water bodies, artificial land, and unused land). This is the basic dataset for research on land use changes of the past half century in China [1,24,25].
The temperature and precipitation datasets are from 13 meteorological stations in three river basins (Figure 1), provided by the China Meteorological Administration (CMA) from 1960 to 2012, which are used to analyze the correlation between temperature/precipitation changes and land use changes. The runoff data in this study are derived from hydrological stations of the three typical river basins between 1960 and 2012, which were provided by hydrological bureau of Xinjiang province. The locations of hydrological stations in this study are shown in the Figure 1.
The social and economic data of Xinjiang between 1995 and 2015 were provided by the National Bureau of Statistics of China. In this study, we used the GDP and population size to analyze the impacts of human activities on land use changes in Xinjiang.

2.3. Methods

The sensitivity of temperature effects on runoff is more significant than precipitation in Xinjiang, because the proportion of glaciers and snow meltwater in total runoff is greater than that of rainfall runoff [23]. The multi-scale correlation analysis is very helpful to explain the responses of runoff changes to climate fluctuation [26,27]. In this study, the multi-scale correlation analysis was used to detect the correlation between runoff and climate factors (i.e., precipitation and temperature). The original runoff/temperature/precipitation series that exist create a scale-mixing problem, while the Ensemble Empirical Mode Decomposition (EEMD) method can overcome it [28]. Therefore, we used the EEMD method to separate inter-annual and inter-decadal runoff/precipitation/temperature variation signals from the original data series. The correlation coefficient was estimated by Pearson’s method with a two-tailed test. Meanwhile, the Mann-Kendall (M-K) nonparametric trend test [29,30] was used to detect the trend of temperature, precipitation, and runoff. The slope of the trend is estimated by using Sen’s nonparametric trend estimator [31].
The river runoff source mainly comes from mountain precipitation and glacier meltwater in Xinjiang [32]. Regional warming and increased precipitation in mountainous areas are the main reasons for the increase in runoff in Xinjiang during the last half century [33]. Therefore, we selected three typical watersheds (the Kai-Kong River Basin, the Aksu River Basin, and the Yarkand River Basin) (Figure 1) to analyze the impacts of climate on cropland changes based on the relationship between temperature, precipitation, runoff, and cropland area.
In this study, we selected four indicators, including land use change rate [25], equilibrium extent [34], dynamic index [35], and transfer direction [35], to describe the characteristics of land use changes in Xinjiang from 1995 to 2015. According to the five periods of land use data, we calculated the centroid position of cropland in different periods using the ArcGIS spatial analysis tool.
The land use change rate is described by a comprehensive index model of land use, as follows:
I = 100 × i = 1 n ( A i × C i )
where I represents the comprehensive index of land use change in this study area, Ai represents the classes index of the i class type of land use (unused land is classes 1, grassland and water bodies are classes 2, forest and cropland are classes 3, and artificial land is classes 4), and Ci represents the ratio between the area of the i class land use and total area of land use in the study area.
Therefore, the land use change model (Equation (1)) can be quantitatively expressed using the comprehensive levels and trends of land use:
Δ I b a = ( i = 1 n A i × C i b i = 1 n A i × C i a ) × 100
where a and b represent different periods.
The Entropy and the second law of thermodynamics are important indicators to revel land use processes and structures [36,37] and the information entropy has been widely used as an indicator to evaluate the equilibrium balance of land use. In this study, we used the equilibrium extent of a structure of land use [34] to evaluate the structures of land use in the Xinjiang from 1995 to 2015. The range of E is between 0 and 1. The larger the E value, the stronger is the homogeneity of the system. E = 0 and E = 1 indicates that the land use structure is unbalanced and in an ideal state, respectively.
H = i = 1 n P i log P i
where H represent information entropy and n and Pi represent the number of land use types and the ratio between the area of the i class land use and total area of land use in the study area, respectively.
E = i = 1 n ( P i × log P i ) / log n
where E represents the equilibrium extent of land use structure.
The regional differences of land use change can be expressed by the integrated dynamics index of land use and the dynamic index of single land use types and it can be calculated by the dynamic degree model of land use [1]. The integrated dynamics index of land use is an indicator that can depict the regional difference in land use changes and also reflects the comprehensive influence of human activities on the change in regional land use.
S = ( i = 1 n ( Δ S i j / S i ) ) × 1 t × 100 %
where S represents the integrated dynamic index of land use at time t in the study area, ∆Si−j represents the area of the i class of land use type converted to other types of land use types from the beginning to the end of the monitoring period, Si represents the total area of the i class of land use type at the monitoring start time, and t is the time in years.
The dynamic index of single land use types describes the change rates and amplitude of different land use types during a certain time.
k i = S i t 2 S i t 1 S i t 1 × 1 t 2 t 1 × 100 %
where ki represents the dynamics index of the i class of land use type between periods t1 and t2, and Sit1 and Sit2 represent the area of the i class of land use type during the period of t1 and t2, respectively.
The transfer direction of land use can be described by the land use change transfer matrix. The land use state transfer matrix comprehensively and concretely depicts the structural characteristics of regional land use change and reflects the direction of land use change, to better reveal the spatiotemporal evolution process of land use change.
S i j = [ S 11 S 12 S 1 n S 21 S 22 S 2 n S n 1 S n 2 S n n ]
where Sij is the land use state at the beginning and end of the study period, n is the type of land use, and the vector in the state transfer matrix of the land use is the land use area in this study.

3. Results

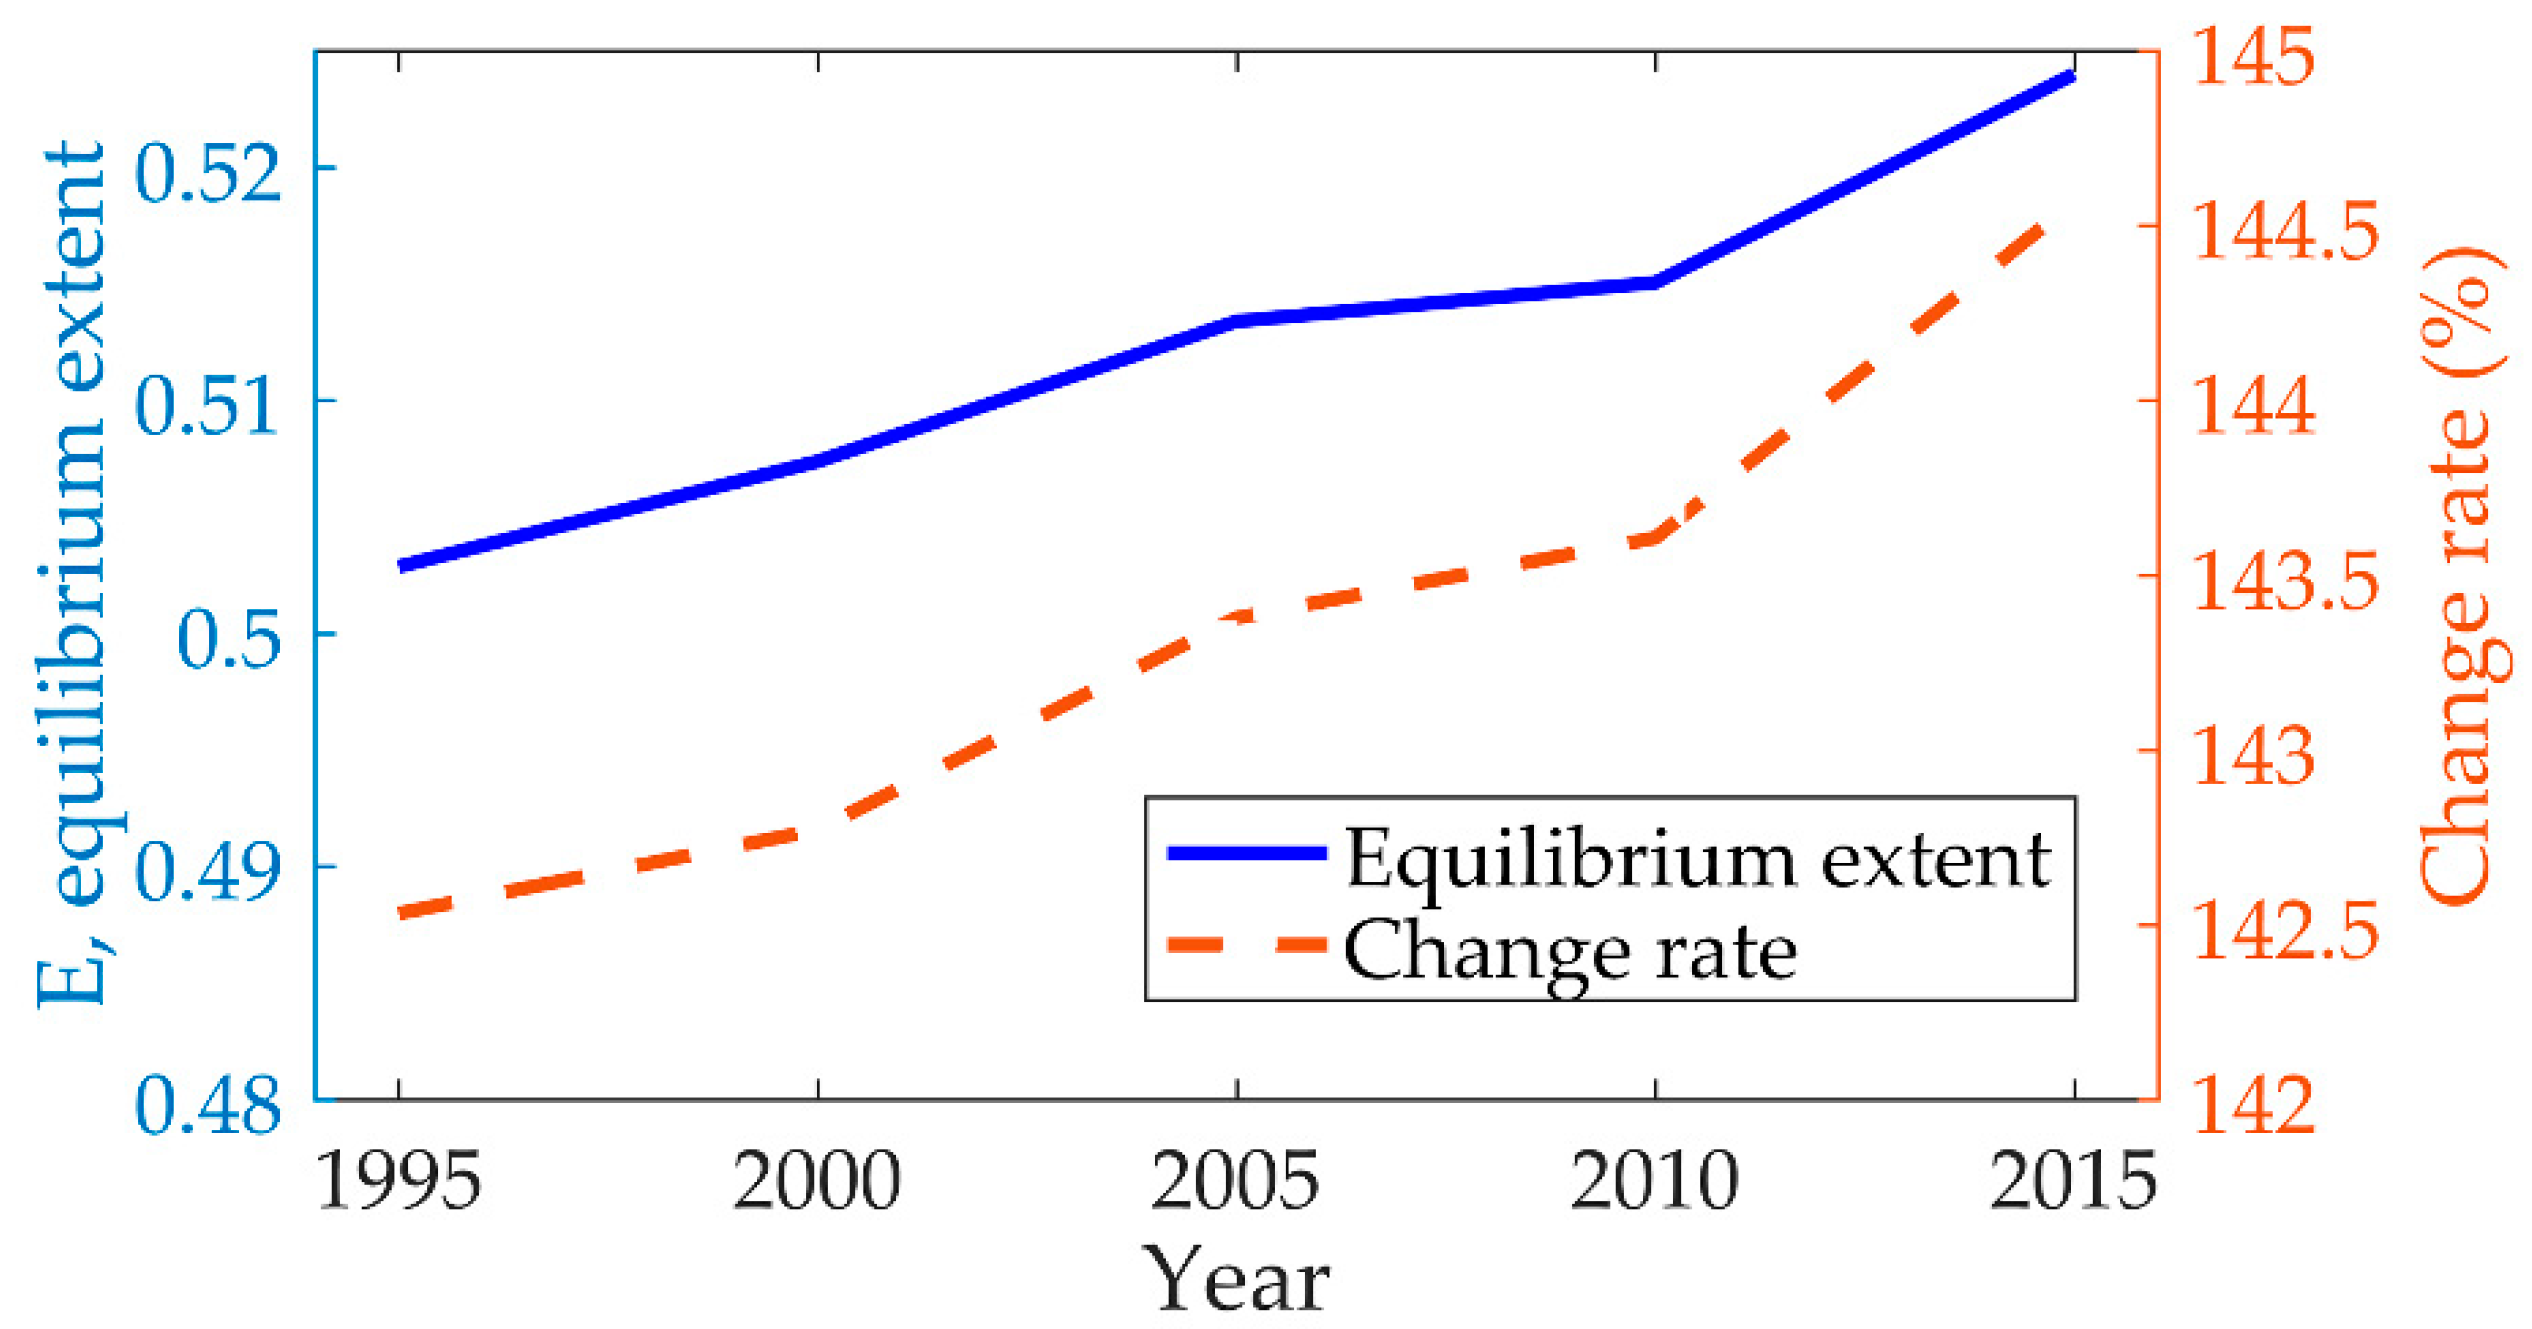
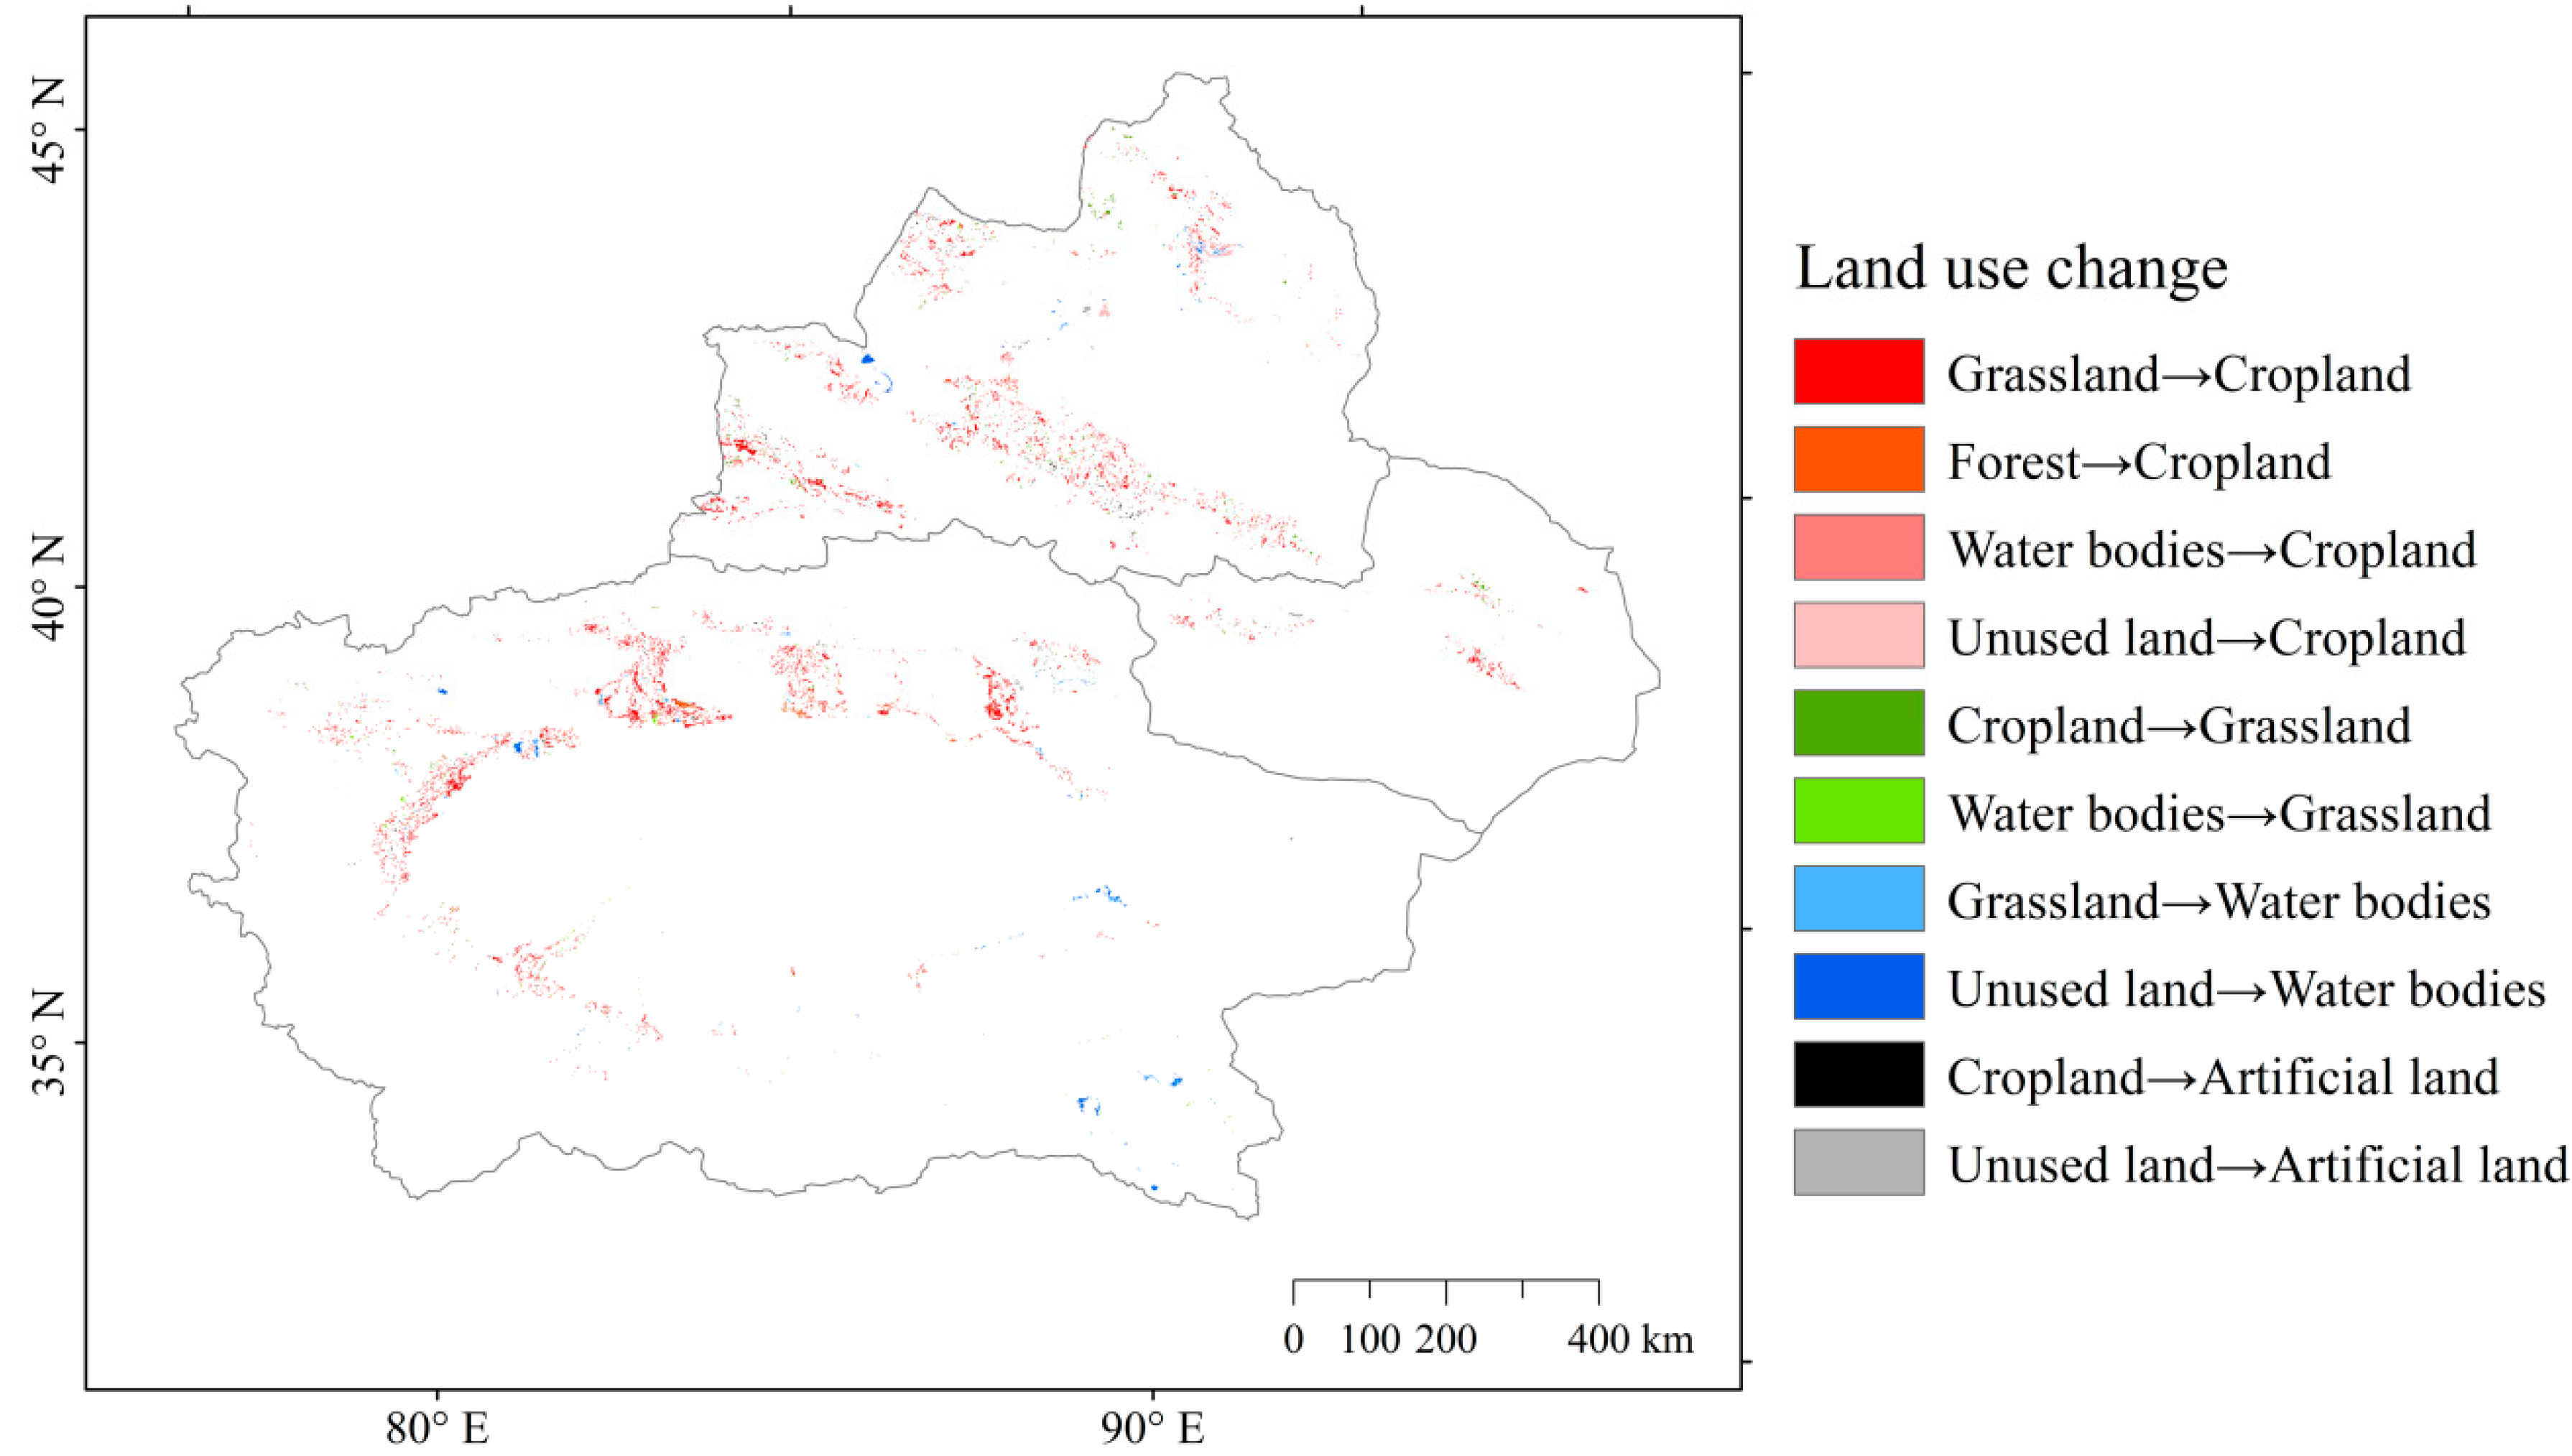
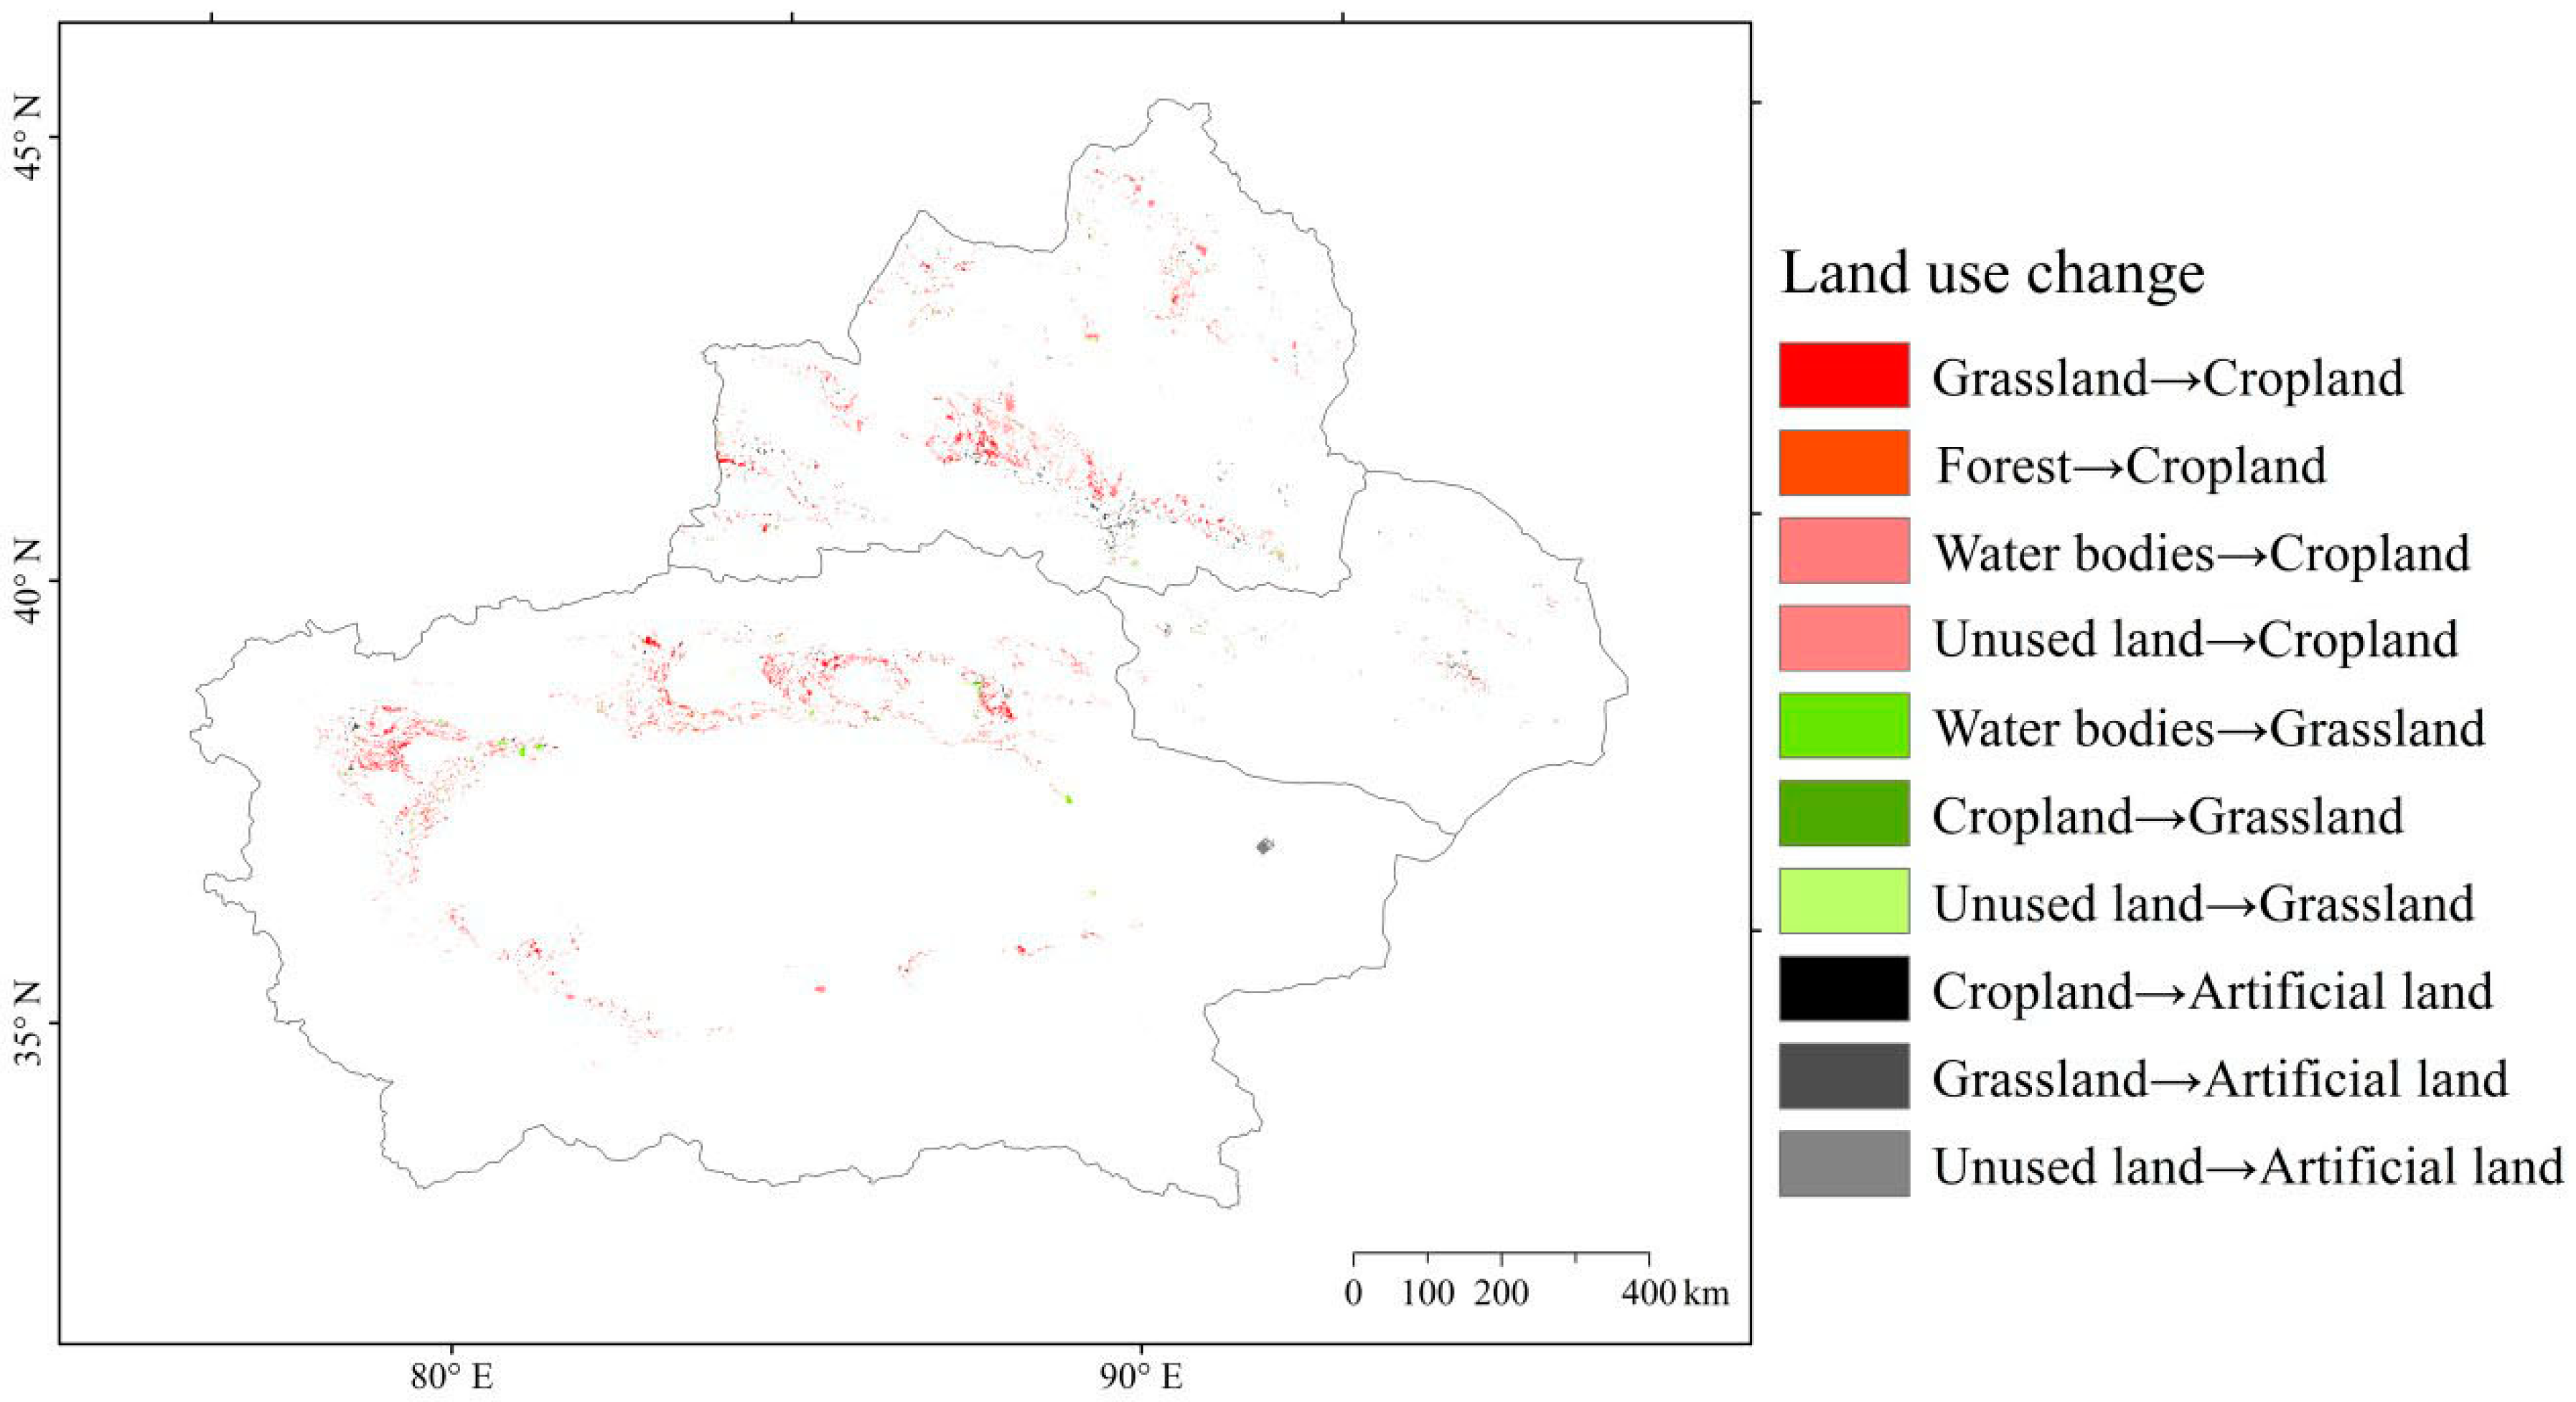
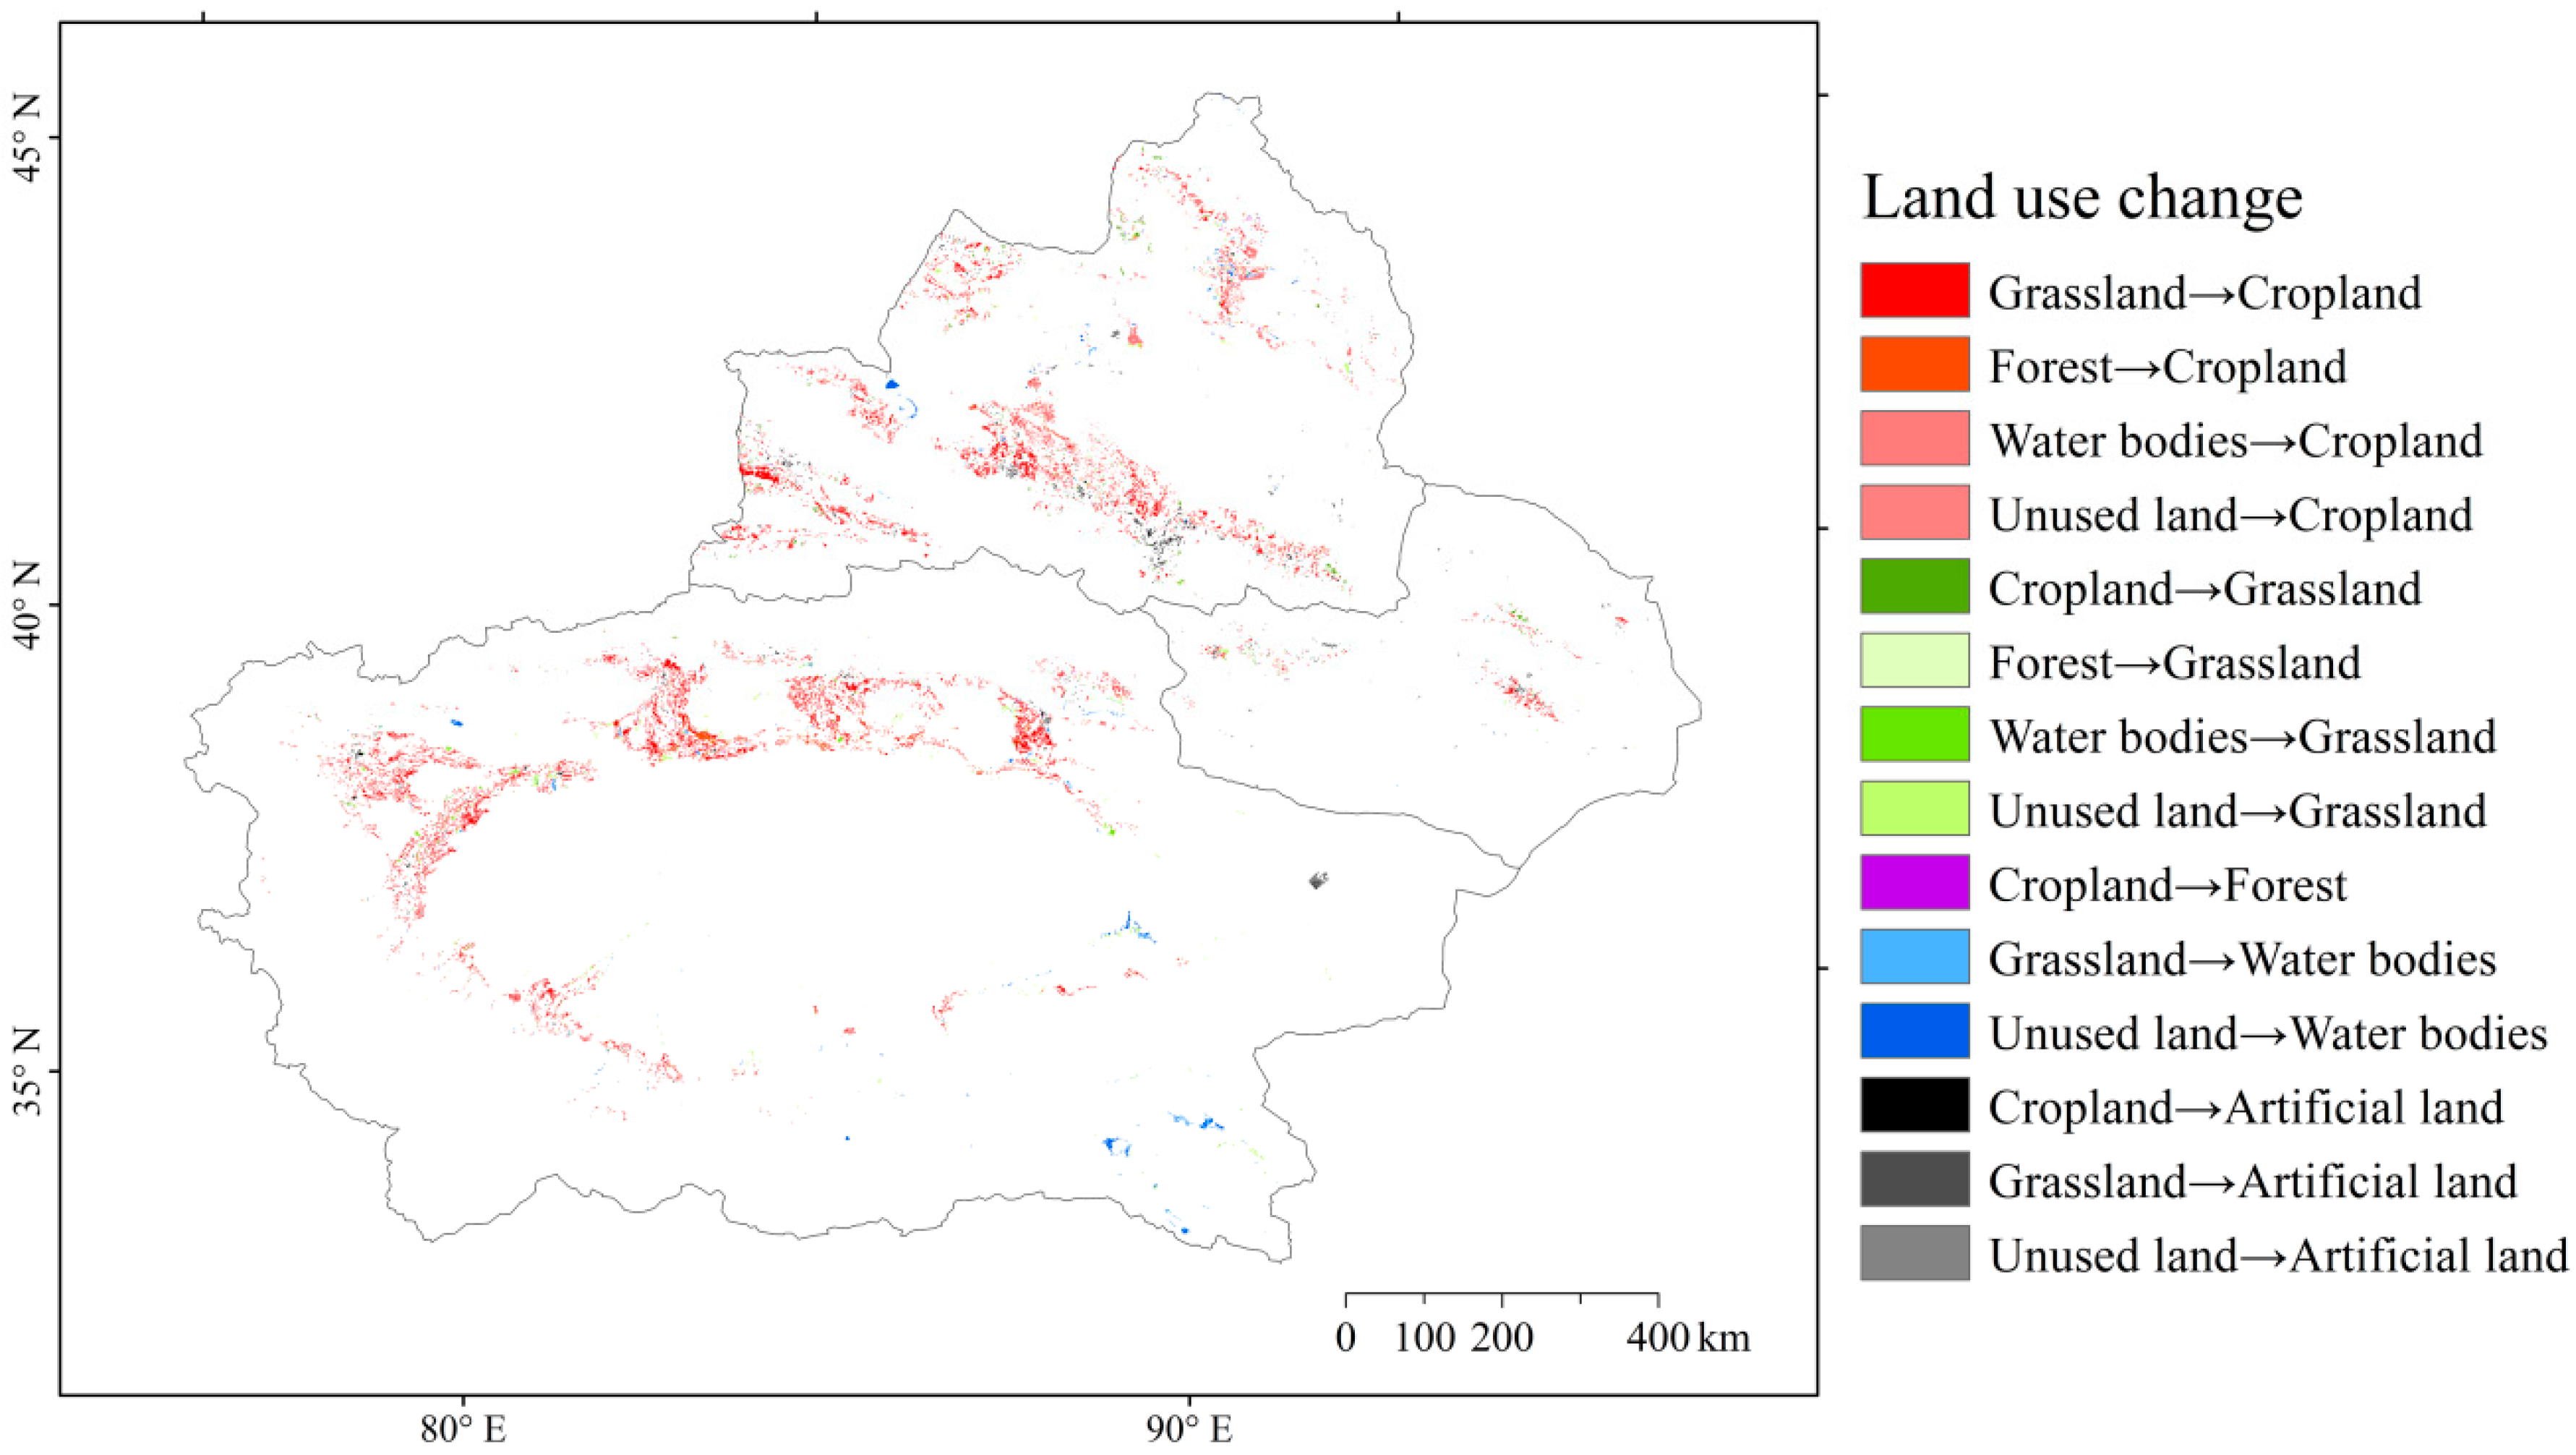
3.1. The Temporal-Spatial Patterns of Land Use Change

Between 1995 and 2015, the rate of land use change in Xinjiang increased by 2.2%. Figure 2 shows that the equilibrium extent of land use structure increased with the increase in the land use change rate. It indicated that the structure equilibrium balance of land use decreased over the past two decades.
The area of cropland, water bodies, and artificial land increased in Xinjiang during the period of 1995–2015, while forest, grassland, and unused land decreased (Table 1). Among them, the increase in artificial areas was large, with a rate of 7.92%/a, followed by cropland, with a rate of 3.86%/a, and water bodies, with a rate of 0.81%/a. The forest, grassland, and unused land decreased, with decline rates of −0.26%/a, −0.36%/a, and −0.07%/a, respectively. The characteristics of land use changes during different periods (Table 1) include a large increase in cropland and water bodies from 1995 to 2005 and a large increase in artificial areas during 2005–2015. The decrease in forest mainly occurred during the period of 2005–2015 and the grassland decreased obviously between 1995 and 2005. Therefore, the changes in land use types in different periods require further analysis.
The characteristics of the transfer direction of land use changes are also different throughout the years. Table 2 and Figure 3 show how cropland was mainly converted into grassland and artificial areas from 1995–2005, with the conversion areas being 835 km2 and 481 km2, respectively. Meanwhile, the amount of forest converted into cropland was 676 km2, the amount of grassland converted to cropland was 9808 km2, and the amount of grassland transformed into artificial land was 177 km2. The amounts of unused land converted into cropland and artificial land were 2147 km2 and 333 km2, respectively. Figure 3 shows that the conversion of land use changes mainly occurred in oasis, due to local concentrated human activities.
The results in Table 3 and Figure 4 show that the areas of cropland that were transformed into artificial land and grassland were 566 km2 and 501 km2, from 2005 to 2015, respectively. And the amount of forest that was mainly transformed into cropland was around 695 km2. Meanwhile, grassland were mainly converted into cropland, with an amount of around 6724 km2, followed by conversion to artificial land, totaling 470 km2. The unused land was mainly converted into cropland and artificial land, in the amount of 4276 km2 and 893 km2, respectively. Therefore, the area of artificial land rapidly increased in Xinjiang during this period, because of the acceleration of urbanization.
From 1995 to 2015, results in Table 4 and Figure 5 showed that the cropland was mainly transformed into artificial land and grassland. Forest was mainly converted into cropland, with a total area of around 1335 km2, and grassland was converted into cropland and artificial land, with totals of 16,266 km2 and 752 km2, respectively. Meanwhile, water bodies converted into grassland and cropland were 475 km2 and 212 km2, respectively. Unused land converted into cropland, grassland, water bodies, and artificial land were in the amount of 6294 km2, 1308 km2, 1003 km2, and 1118 km2, respectively. From 1995–2015, the area of cropland and artificial land increased the most. The area of cropland was mainly transformed from grassland and unused land, while the type of artificial land was mainly transformed from cropland, grassland, and unused land. At the same time, this also shows that Xinjiang’s social and economic development directly impacts the expansion of the Oasis scale and the acceleration of urbanization speed.
The centroid of cropland migrated to the southwest of Xinjiang, because of the rapid expansion of cropland in the south of Xinjiang. The results indicated that the migration direction of the centroid position of cropland moves southward and then to the southwest (Figure 6). This also shows that the increase in area of cropland in Southern Xinjiang is faster than the increases in Northern and Eastern Xinjiang. The area of cropland rapidly increasing in South Xinjiang was mainly a result of global warming-accelerated glacier and snow melt, which lead to runoff increases, a driving factor. On the other hand, social and economic development, which has promoted the increased reclamation of other land use types into cropland, is the economic driving factor.

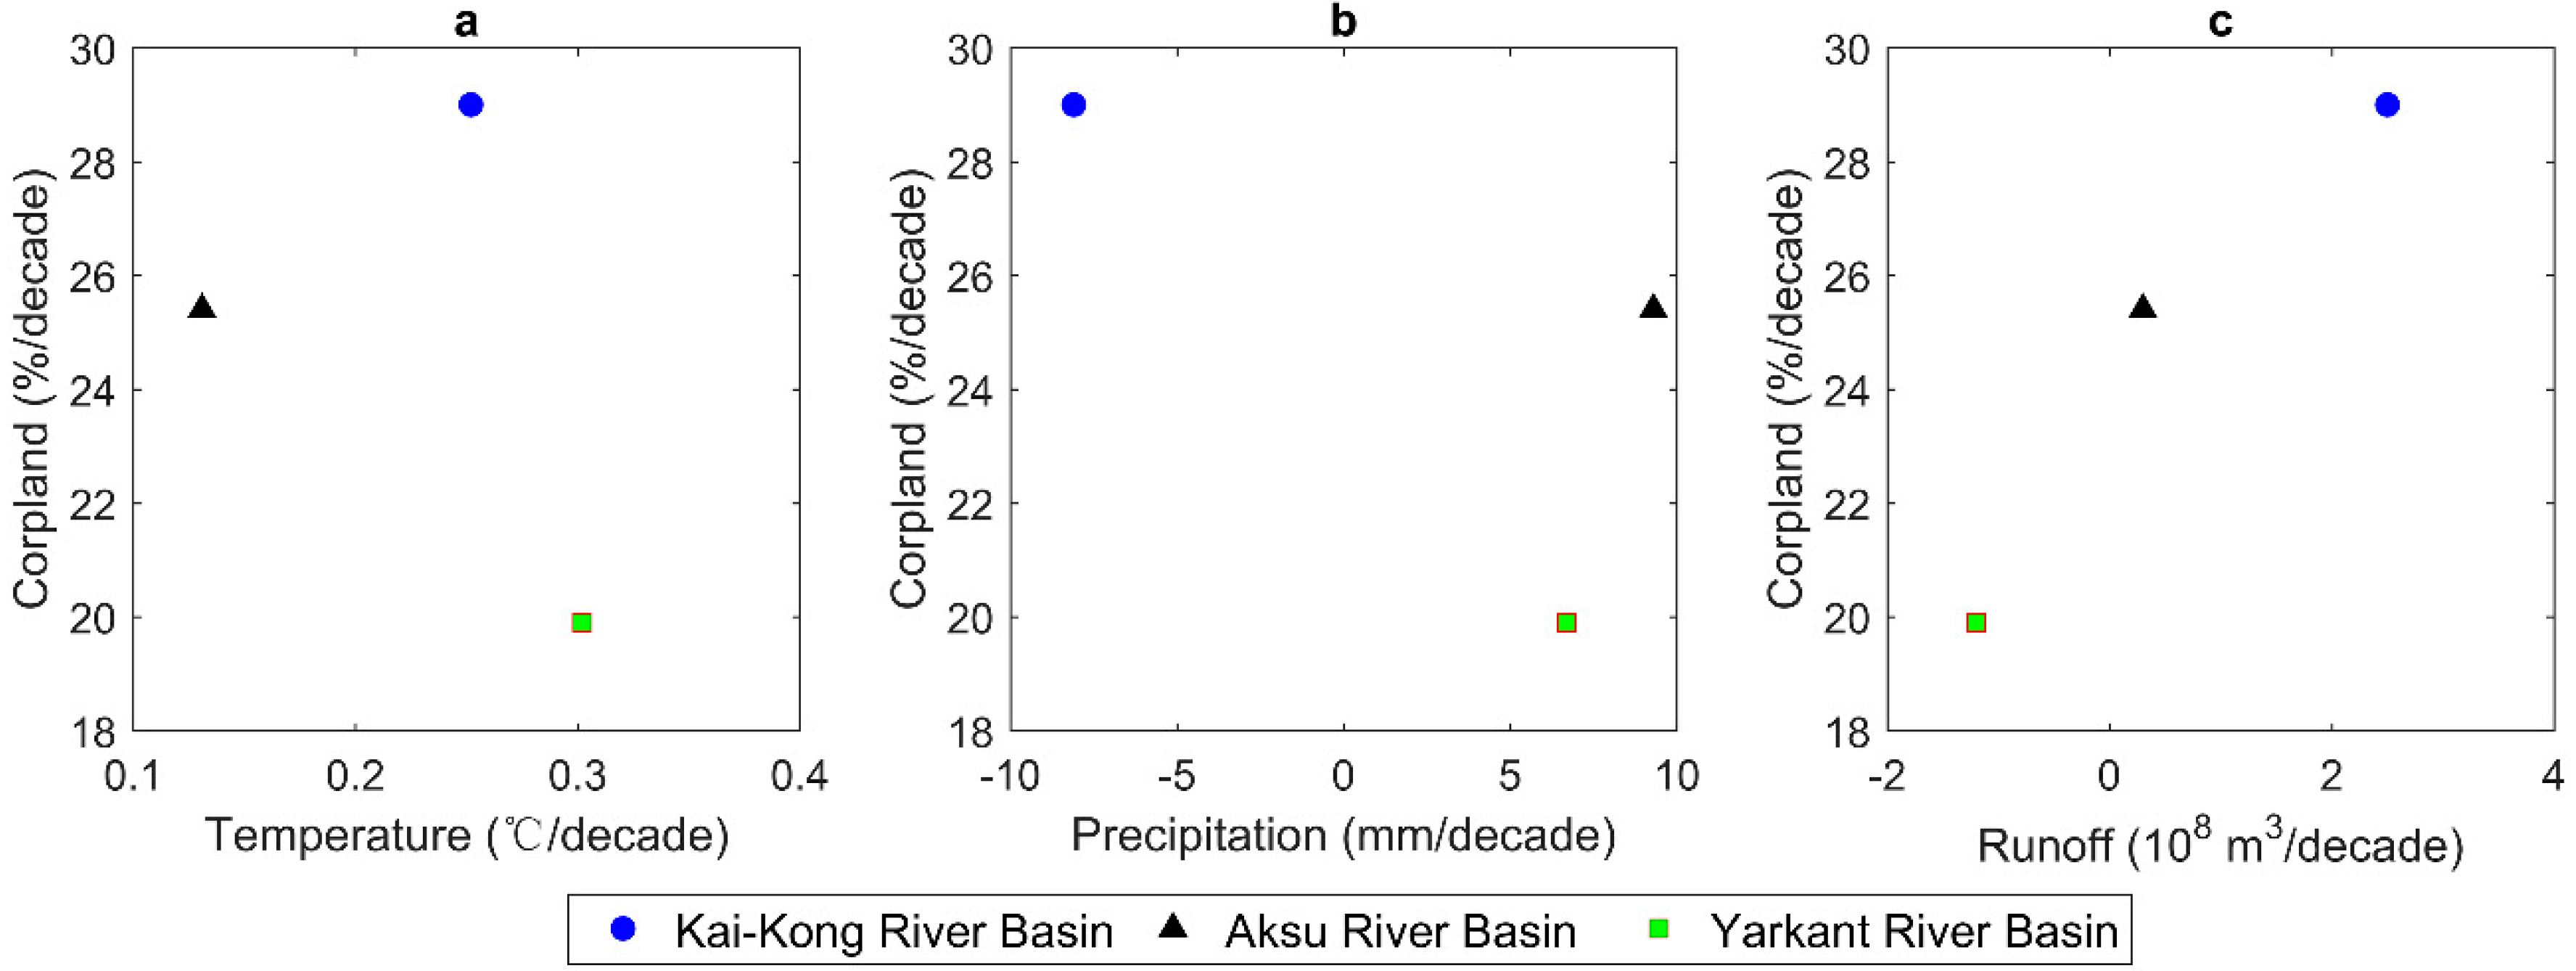
3.2. The Influence of Recent Climate Change on Land Use Change

The results of multi-scale correlation analyses between runoff and precipitation/temperature in the Kai-Kong River Basin shows how runoff has a positive correlation to precipitation and temperature at inter-annual and inter-decadal scales (Table 5). We find that the correlation between runoff and precipitation at inter-annual scale is higher than that at inter-decadal scale, while the correlation between runoff and temperature at inter-annual scale is lower than that at inter-decadal scale. It is very interesting to find that runoff has a negative correlation to precipitation at inter-annual vs. decadal scale. The runoff of the Aksu River Basin has a positive correlation to precipitation at inter-decadal vs. inter-annual, while a negative correlation at inter-annual scale (Table 5). Furthermore, runoff has a positive correlation to temperature at inter-decadal. In the Yarkand River Basin, the runoff has a negative correlation to precipitation, but a positive correlation to temperature at inter-decadal scale (Table 5). The multi-scale correlation between runoff and climate factors are complex, because other than precipitation and temperature, there are many factors that impact runoff changes, such as meteorological station location, glaciers, snow cover, a 0 ℃ level high (FLH), and temperature lapse rate [38,39].
The increase in cropland area in the Kai-Kong River Basin was the fastest, around 29%/decade, followed by the Aksu River Basin and the Yarkand River Basin (Figure 7). Meanwhile, the relationship between climate factors (temperature, precipitation, and runoff) and cropland changes has been analyzed in the three typical watersheds. The results are shown in Figure 7a,b, which indicates how the relationship between temperature, precipitation, and cropland are not very clear due to the influence of temperature and precipitation changes on cropland alterations as a result of the impact on runoff change. Figure 7c shows a large increase rate in cropland responses when there is a large increase in runoff rate. Therefore, the quantity of runoff is closely related to the cropland area in oasis regions in Central Asia.

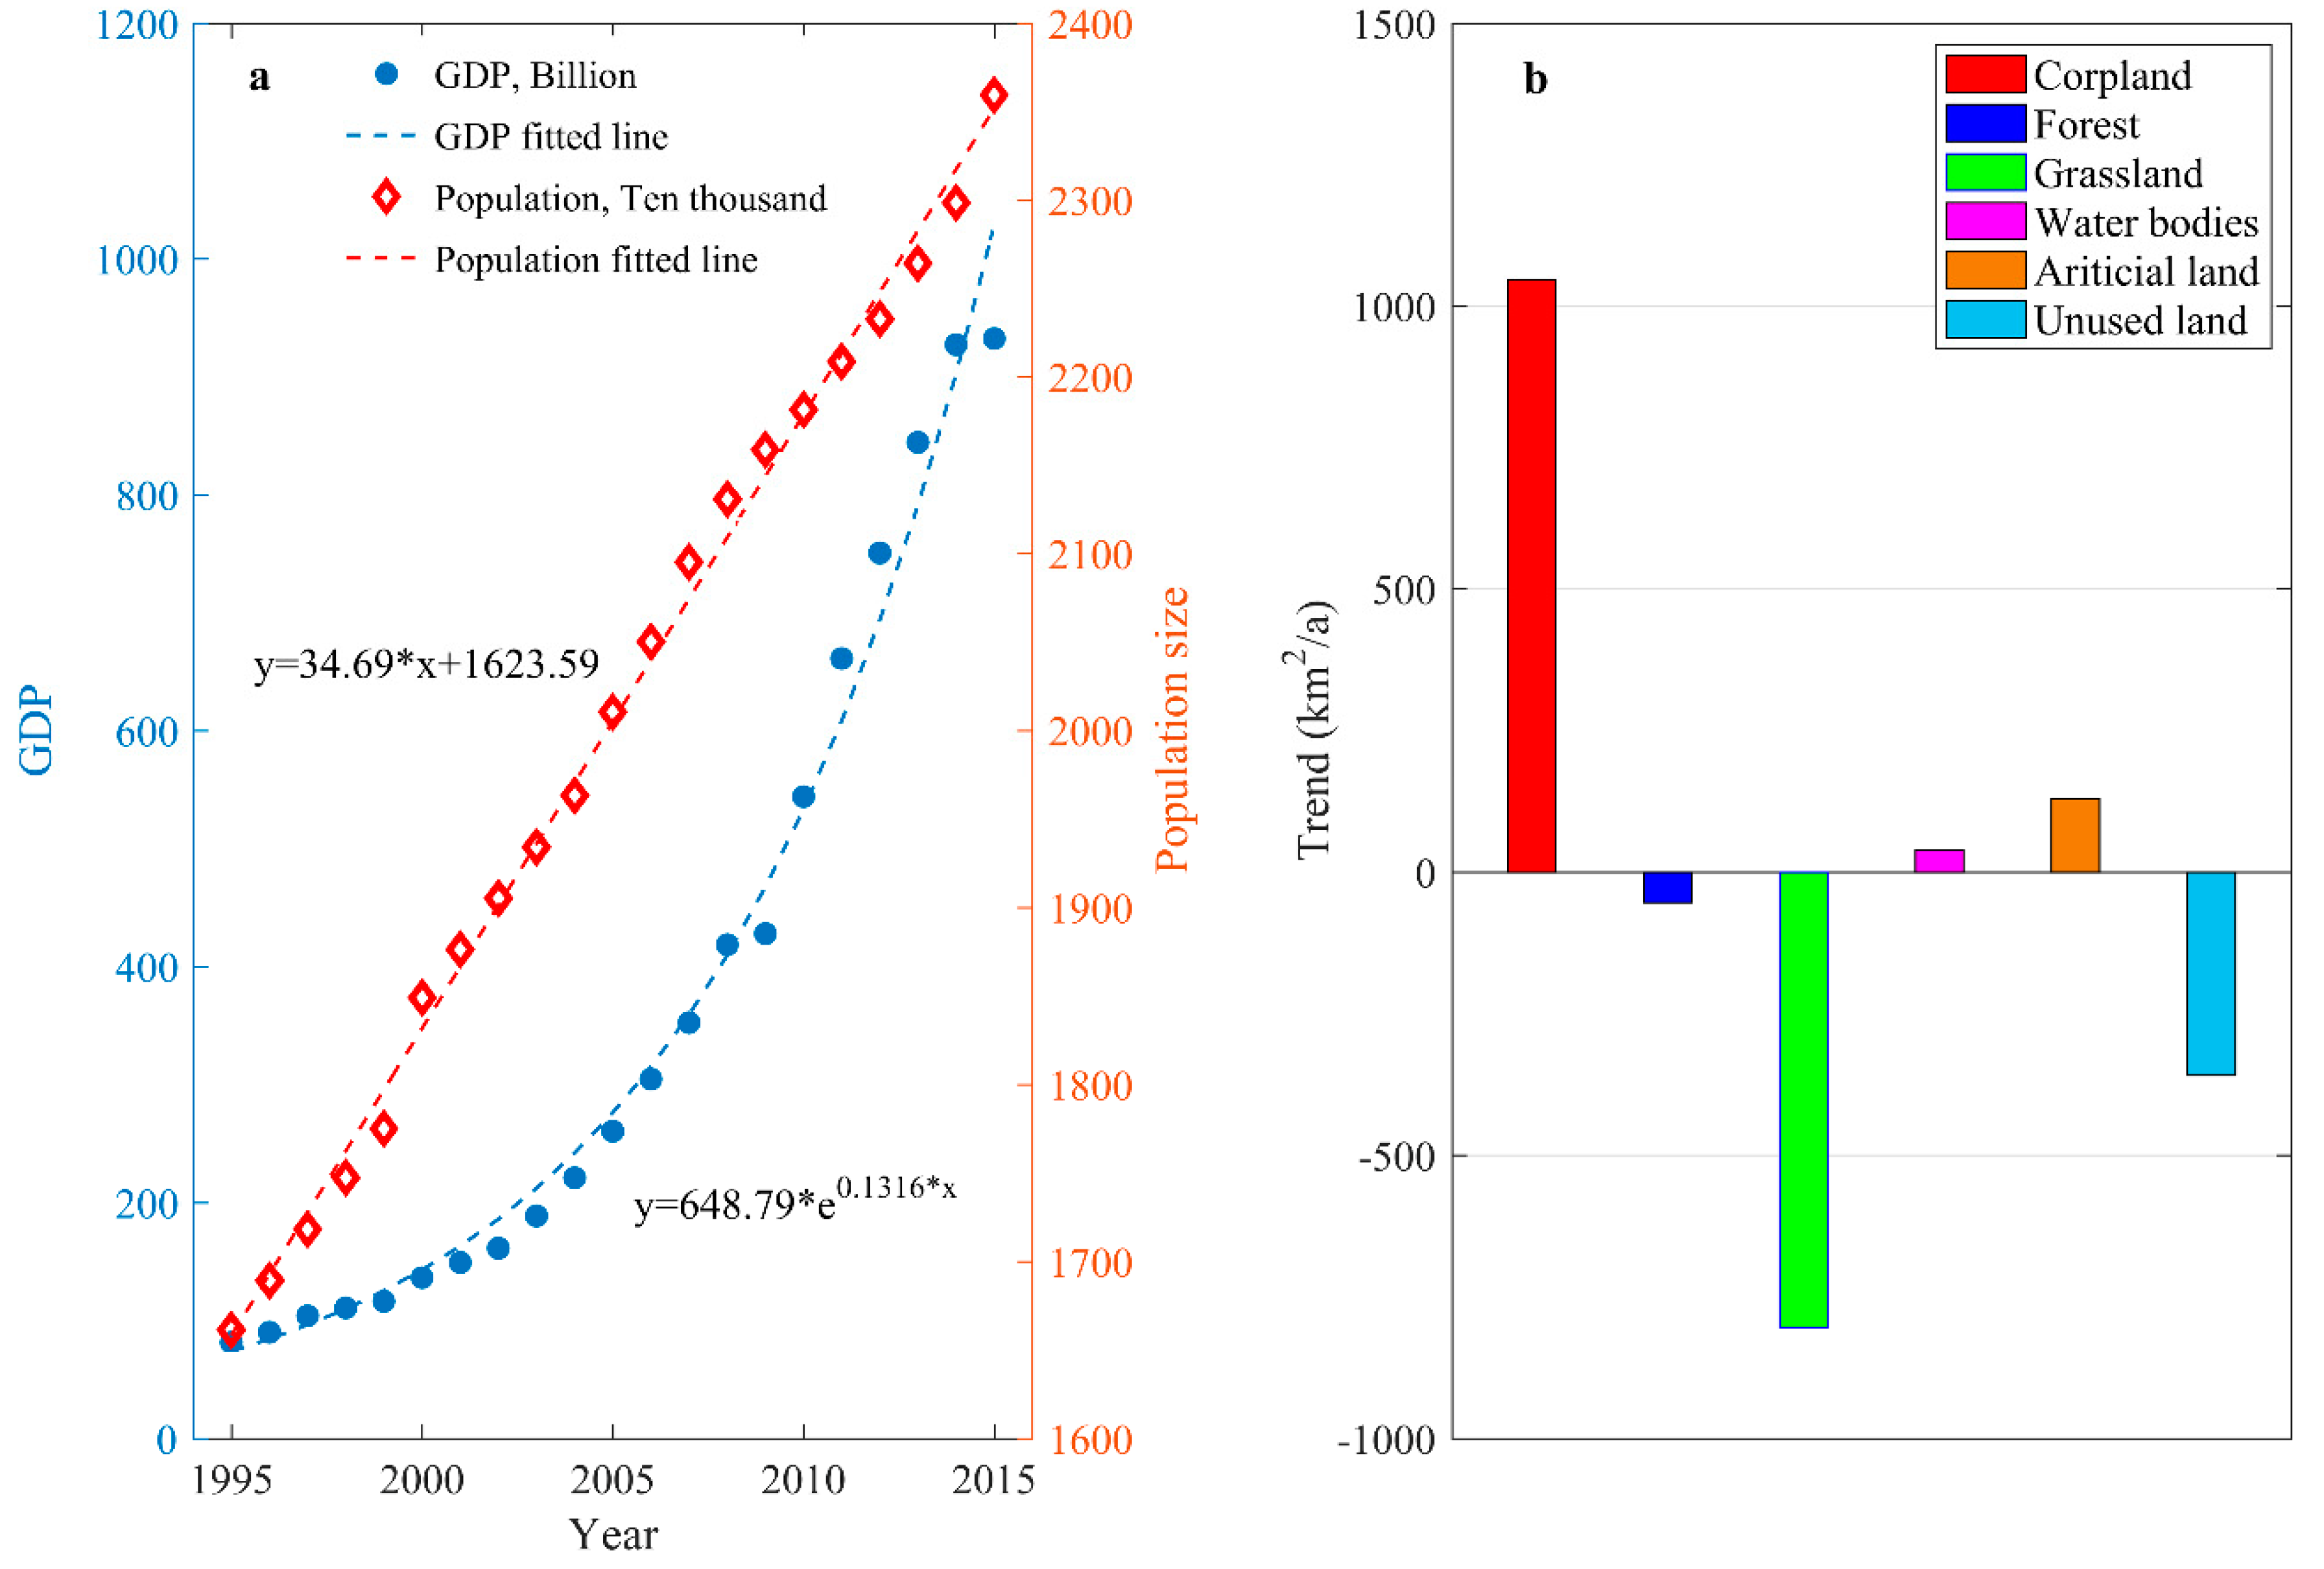
3.3. The Influence of Social and Economic Factors on Land Use Change

Figure 8a shows that social and economic factors have developed rapidly in Xinjiang during the past 20 years, especially since 2005. The GDP development can be simulated by an exponential model (y = 648.79 × e 0.1316 × x); it is shown that GDP increased with a rate of 649 × 108 RMB/a. Meanwhile, the population size has been rapidly expanding (y = 34.69 × x + 1623.59) and increased by approximately seven million people over the past 20 years (Figure 8a). With rapid growth of the economic development and population size, more cropland areas are needed to support Xinjiang. Moreover, there are obvious changes in land use types in Xinjiang from 1995 to 2015 (Figure 8b), of which the increase rate of cropland was the largest, with a rate of over 1000 km2/a, followed by the artificial land increase of about 130 km2/a. However, the forest, grassland, and unused land showed a decreasing trend, in which grassland had the largest reduced rate of about 800 km2/a. Human activities may have been an important factor in driving Xinjiang cropland increases from 1995 to 2015. Furthermore, there is a need to consider the impact of the migration processes, as rural area depopulation and city growth are related with this an abandonment of cropland. Obviously, it is necessary to deeply analyze impact of economic development on land use change in our next step research agenda.

4. Discussion

Water conditions are the main limiting factor of agricultural in arid areas [40], such as Xinjiang. The water sources in arid areas mainly come from river, lake, and underground water, which are dominated by glaciers and snow meltwater. As a result, croplands are mainly distributed in the middle and lower course of rivers, which are rich in surface and groundwater resources with adequate access to irrigation water. Warmer and wetter climates [41] will contribute to the cropland expanding. During the past half century, runoff significantly increased in Xinjiang [38], which was caused by regional warming that accelerated the glaciers and snow melt. Thus, the cropland rapidly expanded (Figure 8). However, with glacier storage decreasing, the glaciers and snow meltwater will also decrease, which will then lead to a reduction in runoff [5,12,42]. At this time, the runoff decrease will impact oasis development and perhaps some cropland will gradually experience desertification [17]. Therefore, the determining factor of cropland area in oasis is the glaciers and snow storage, as well as the annual ablation rate in mountainous areas; otherwise, it will lead to oasis development being unsustainable.
Climate change is one of the main factors that drives land-use change [43], especially in arid areas. The change in cropland is significantly affected by climate change. The water use of cropland is mainly provided by river runoff in Xinjiang [44]. The increased rate of runoff is largest in the Kai-Kong River Basin, when compared with other river basins. Meanwhile, the increase in cropland is also largest in the Kai-Kong River Basin (Figure 7). Since 2000, the runoff has been decreasing in the Kai-Kong River Basin [39], but the cropland area is still large, so it will place a large amount of pressure on irrigation water sources. If this situation continues for a long time, it will lead to groundwater being overdrawn and the water level falling, in addition to the lake drying and other environmental problems. The largest annual runoff in the Aksu River Basin is compared with the Kai-Kong River Basin and Yarkand River Basin, although a slight warming rate in the Aksu River Basin has resulted in the rate of runoff increasing at a smaller rate than the Kai-Kong River Basin. However, runoff showed a decreasing trend in the Yarkand River Basin, while temperature increased, perhaps due to the temperature data provided by meteorological stations being in low altitude regions. Then, we analyzed the change of 0 ℃ level high (FLH), which showed a decrease in the head of the Yarkand River Basin [39], which was limited by the ablation rate of glaciers and snow and then led to a reduction in runoff.
Human activities are important factors that may induced regional land use changes [32], mainly including the economy, while population size plays a dominant role in land use changes in Xinjiang [45,46,47,48], especially cropland changes [49]. The social and economic development has driven the unused land transfer into cropland in the middle and lower reaches of the river basin. However, if croplands expand than water usage will rise, and there will be a crowding out of ecological water, leading to the shrinkage of riparian forest in arid regions. Driven by economic interest, it is difficult to find a balance point between irrigation and ecological water use. Therefore, our next focus will be to systematically analyze the impact of human activities on land use change, expound the role of human activities in the relationship between humans and nature in arid areas from an economic view, and put forward a reasonable development strategy to maintain a sustainable development relationship between humans and nature in arid areas.
This paper has taken the equilibrium extent of land use to evaluate land use changes (Figure 2). However, as the land use types were only classified into six categories (i.e., cropland, forest, grassland, water bodies, artificial land, and unused land), the equilibrium extent index can reflect macrostate structural changes of land use, while it remains difficult to reveal the microstate structural changes of land use [50]. Therefore, for our future study, we will consider the use of configurational entropy [51,52], which is calculated using Fragstats software. It captures the microstate changes of the land use in a specific river basin, such as the Kai-Kong River Basin, the Aksu River Basin, or the Yarkand River Basin.

5. Conclusions

Our study has summarized the changes in land use in Xinjiang between 1995 and 2015. These changes were based on datasets and analyzed the influences of climate change on cropland transformation in three typical river basins. The main results are as follows:
Between 1995 and 2015, the largest increase in artificial land was 7.92%/a, followed by an increase of 3.86%/a in cropland and an increase of 0.81%/a in water bodies. The decreases in forestland, grassland, and unused land were −0.26%/a, −0.36%/a, and −0.07%/a, respectively. There were different transfer directions of land use changes during different periods. The forest, grassland, and unused land were transferred into cropland from 1995 to 2005. While, the area of artificial land increased rapidly due to urbanization, which accelerated between 2005 and 2015. Economic development and population expansion are the main factors for the cropland and artificial land increases in Xinjiang. Cropland expanded rapidly in southern Xinjiang between 1995 and 2015, which led to the migration of the centroid of cropland in the southwest direction.
The temperature and precipitation determined the cropland changes by influencing runoff in arid areas. The results of our multi-scale correlation explains the relationship between runoff and precipitation/temperature in the three river basins. The runoff changes were closely related to the cropland changes. The runoff increase was the largest in the Kai-Kong River Basin, corresponding with the increase in cropland being the fastest, reaching 29%/decade. Meanwhile, human activities maybe important factors for cropland increased in Xinjiang.

Author Contributions

Data curation, C.W. and F.H.; Funding acquisition, C.W.; Methodology, Q.L.; Supervision, Z.Y.; Visualization, Q.L.; Writing—original draft, Q.L.; Writing—review and editing, Z.Y. and F.H.

Funding

The research was supported by the Western Young Scholars Project, Chinese Academy of Sciences (2016-QNXZ-B-18).

Acknowledgments

Special thanks are owed to editors and anonymous reviewers for giving valuable suggestions and comments to improve this article. The authors also wish to express gratitude to the Chinese Meteorology Administration (http://data.cma.cn/) for providing air temperature and precipitation data, the Data Center for Resources and Environmental Sciences, Chinese Academy of Sciences (RESDC) (http://www.resdc.cn) for providing the land use data.

Conflicts of Interest

The authors declare no conflict of interest.

References

  1. Liu, J.; Liu, M.; Zhuang, D.; Zhang, Z.; Deng, X. Study on spatial pattern of land-use change in China during 1995–2000. Sci. China Ser. D Earth Sci. 2003, 46, 373–384. [Google Scholar]
  2. Nemani, R.R.; Keeling, C.D.; Hashimoto, H.; Jolly, W.M.; Piper, S.C.; Tucker, C.J.; Myneni, R.B.; Running, S.W. Climate-driven increases in global terrestrial net primary production from 1982 to 1999. Science 2003, 300, 1560–1563. [Google Scholar] [CrossRef] [PubMed]
  3. Zelikova, T.J.; Williams, D.G.; Hoenigman, R.; Blumenthal, D.M.; Morgan, J.A.; Pendall, E. Seasonality of soil moisture mediates responses of ecosystem phenology to elevated CO2 and warming in a semi-arid grassland. J. Ecol. 2015, 103, 1119–1130. [Google Scholar] [CrossRef]
  4. Jeong, S.J.; Ho, C.H.; Brown, M.E.; Kug, J.S.; Piao, S. Browning in desert boundaries in Asia in recent decades. J. Geophys. Res. Atmos. 2011, 116, D02103. [Google Scholar] [CrossRef]
  5. Aizen, V.B.; Aizen, E.M.; Melack, J.M.; Dozier, J. Climatic and hydrologic changes in the Tien Shan, central Asia. J. Clim. 1997, 10, 1393–1404. [Google Scholar] [CrossRef]
  6. Ojima, D.S.; Galvin, K.A.; Turner, B.L. The global impact of land-use change. BioScience 1994, 44, 300–304. [Google Scholar] [CrossRef]
  7. Foley, J.A.; DeFries, R.; Asner, G.P.; Barford, C.; Bonan, G.; Carpenter, S.R.; Chapin, F.S.; Coe, M.T.; Daily, G.C.; Gibbs, H.K.; et al. Global consequences of land use. Science 2005, 309, 570–574. [Google Scholar] [CrossRef]
  8. Havstad, K.M.; James, D. Prescribed burning to affect a state transition in a shrub-encroached desert grassland. J. Arid Environ. 2010, 74, 1324–1328. [Google Scholar] [CrossRef]
  9. Li, X.Y.; Zhang, S.Y.; Peng, H.Y.; Hu, X.; Ma, Y.J. Soil water and temperature dynamics in shrub-encroached grasslands and climatic implications: Results from Inner Mongolia steppe ecosystem of north China. Agric. For. Meteorol. 2013, 171, 20–30. [Google Scholar] [CrossRef]
  10. Chen, L.; Li, H.; Zhang, P.; Zhao, X.; Zhou, L.; Liu, T.; Hu, H.; Bai, Y.; Shen, H.; Fang, J. Climate and native grassland vegetation as drivers of the community structures of shrub-encroached grasslands in Inner Mongolia, China. Landsc. Ecol. 2015, 30, 1627–1641. [Google Scholar] [CrossRef]
  11. Fu, R.; Li, W. The influence of the land surface on the transition from dry to wet season in Amazonia. Theor. Appl. Climatol. 2004, 78, 97–110. [Google Scholar] [CrossRef]
  12. Sorg, A.; Bolch, T.; Stoffel, M.; Solomina, O.; Beniston, M. Climate change impacts on glaciers and runoff in Tien Shan (Central Asia). Nat. Clim. Chang. 2012, 2, 725–731. [Google Scholar] [CrossRef]
  13. Chen, Y.; Li, W.; Deng, H.; Fang, G.; Li, Z. Changes in central Asia’s water tower: Past, present and future. Sci. Rep. 2016, 6, 35458. [Google Scholar] [CrossRef] [PubMed]
  14. Deng, H.; Chen, Y.; Li, Y. Glacier and snow variations and their impacts on regional water resources in mountains. J. Geogr. Sci. 2019, 29, 84–100. [Google Scholar] [CrossRef]
  15. Farinotti, D.; Longuevergne, L.; Moholdt, G.; Duethmann, D.; Mölg, T.; Bolch, T.; Vorogushyn, S.; Güntner, A. Substantial glacier mass loss in the Tien Shan over the past 50 years. Nat. Geosci. 2015, 8, 716–722. [Google Scholar] [CrossRef]
  16. Ram, B.; Kolarkar, A. Remote sensing application in monitoring land-use changes in arid Rajasthan. Int. J. Remote Sens. 1993, 14, 3191–3200. [Google Scholar] [CrossRef]
  17. Li, Y.; Zhao, M.; Motesharrei, S.; Mu, Q.; Kalnay, E.; Li, S. Local cooling and warming effects of forests based on satellite observations. Nat. Commun. 2015, 6, 6603. [Google Scholar] [CrossRef] [Green Version]
  18. Nendel, C.; Hu, Y.; Lakes, T. Land-use change and land degradation on the Mongolian Plateau from 1975 to 2015—A case study from Xilingol, China. Land Degrad. Dev. 2018, 29, 1595–1606. [Google Scholar]
  19. Xu, C.; Chen, Y.; Chen, Y.; Zhao, R.; Ding, H. Responses of surface runoff to climate change and human activities in the arid region of Central Asia: A case study in the Tarim River Basin, China. Environ. Manag. 2013, 51, 926–938. [Google Scholar] [CrossRef]
  20. Ma, Z.; Kang, S.; Zhang, L.; Tong, L.; Su, X. Analysis of impacts of climate variability and human activity on streamflow for a river basin in arid region of northwest China. J. Hydrol. 2008, 352, 239–249. [Google Scholar] [CrossRef]
  21. Meyer, W.B.; Turner, B.L. Human population growth and global land-use/cover change. Annu. Rev. Ecol. Syst. 1992, 23, 39–61. [Google Scholar] [CrossRef]
  22. Lambin, E.F.; Meyfroidt, P. Global land use change, economic globalization, and the looming land scarcity. Proc. Natl. Acad. Sci. USA 2011, 108, 3465–3472. [Google Scholar] [CrossRef] [PubMed] [Green Version]
  23. Fan, Y.; Chen, Y.; Liu, Y.; Li, W. Variation of baseflows in the headstreams of the Tarim River Basin during 1960–2007. J. Hydrol. 2013, 487, 98–108. [Google Scholar] [CrossRef]
  24. Liu, J.; Liu, M.; Deng, X.; Zhuang, D.; Zhang, Z.; Luo, D. The land use and land cover change database and its relative studies in China. J. Geogr. Sci. 2002, 12, 275–282. [Google Scholar]
  25. Liu, J.; Liu, M.; Tian, H.; Zhuang, D.; Zhang, Z.; Zhang, W.; Tang, X.; Deng, X. Spatial and temporal patterns of China’s cropland during 1990–2000: An analysis based on Landsat TM data. Remote Sens. Environ. 2005, 98, 442–456. [Google Scholar] [CrossRef]
  26. Bai, L.; Chen, Z.; Xu, J.; Li, W. Multi-scale response of runoff to climate fluctuation in the headwater region of Kaidu River in Xinjiang of China. Theor. Appl. Climatol. 2016, 125, 703–712. [Google Scholar] [CrossRef]
  27. Chen, Z.; Chen, Y.; Bai, L.; Xu, J. Multiscale evolution of surface air temperature in the arid region of Northwest China and its linkages to ocean oscillations. Theor. Appl. Climatol. 2017, 128, 945–958. [Google Scholar] [CrossRef]
  28. Wu, Z.; Huang, N. Ensemble empirical mode decomposition: A noise-assisted data analysis method. Adv. Adapt. Data Anal. 2009, 1, 1–41. [Google Scholar] [CrossRef]
  29. Hirsch, R.; Slack, J. A nonparametric trend test for seasonal data with serial dependence. Water Resour. Res. 1984, 20, 727–732. [Google Scholar] [CrossRef]
  30. Hamed, K. Trend detection in hydrologic data: The Mann–Kendall trend test under the scaling hypothesis. J. Hydrol. 2008, 349, 350–363. [Google Scholar] [CrossRef]
  31. Sen, P. Estimates of the Regression Coefficient Based on Kendall’s Tau. J. Am. Stat. Assoc. K 1968, 63, 1379–1389. [Google Scholar] [CrossRef]
  32. Chen, Y.; Xu, C.; Chen, Y.; Li, Z.; Pan, Z. Response of snow cover to climate change in the periphery mountains of Tarim river basin, China, over the past four decades. Ann. Glaciol. 2008, 49, 166–172. [Google Scholar] [Green Version]
  33. Wang, Y.; Chen, Y.; Ding, J.; Fang, G. Land-use conversion and its attribution in the Kaidu–Kongqi River Basin, China. Quat. Int. 2015, 380, 216–223. [Google Scholar] [CrossRef]
  34. Chen, Y.; Liu, J. An index of equilibrium of urban land-use structure and information dimension of urban form [in Chinese with English abstract]. Geogr. Res. 2001, 20, 146–152. [Google Scholar]
  35. Liu, J.; Zhang, Z.; Xu, X.; Kuang, W.; Zhou, W.; Zhang, S.; Li, R.; Yan, C.; Yu, D.; Wu, S.; et al. Spatial patterns and driving forces of land use change in China during the early 21st century. J. Geogr. Sci. 2010, 20, 483–494. [Google Scholar] [CrossRef]
  36. Wu, J.; Marceau, D. Modeling complex ecological systems: An introduction. Ecol. Model. 2002, 153, 1–6. [Google Scholar] [CrossRef]
  37. Vranken, I.; Baudry, J.; Aubinet, M.; Visser, M.; Bogaert, J. A review on the use of entropy in landscape ecology: Heterogeneity, unpredictability, scale dependence and their links with thermodynamics. Landsc. Ecol. 2015, 30, 51–65. [Google Scholar] [CrossRef]
  38. Deng, H.; Chen, Y.; Wang, H.; Zhang, S. Climate change with elevation and its potential impact on water resources in the Tianshan Mountains, Central Asia. Glob. Planet. Chang. 2015, 135, 28–37. [Google Scholar] [CrossRef]
  39. Chen, Z.; Chen, Y.; Li, W. Response of runoff to change of atmospheric 0 C level height in summer in arid region of Northwest China. Sci. China Earth Sci. 2012, 55, 1533–1544. [Google Scholar] [CrossRef]
  40. Deng, X.P.; Shan, L.; Zhang, H.; Turner, N.C. Improving agricultural water use efficiency in arid and semiarid areas of China. Agric. Water Manag. 2006, 80, 23–40. [Google Scholar] [CrossRef] [Green Version]
  41. Shi, Y.F.; Shen, Y.P.; Hu, R.J. Preliminary study on signal, impact and foreground of climate shift from warm–dry to warm–humid in northwest China [in Chinese with English abstract]. J. Glaciol. Geocryol. 2002, 3, 219–226. [Google Scholar]
  42. Li, Z.; Wang, W.; Zhang, M.; Wang, F.; Li, H. Observed changes in streamflow at the headwaters of the Urumqi River, eastern Tianshan, central Asia. Hydrol. Processes 2010, 24, 217–224. [Google Scholar] [CrossRef]
  43. Liu, Q.; Yang, Z.; Han, F.; Wang, Z.; Wang, C. NDVI-based vegetation dynamics and their response to recent climate change: A case study in the Tianshan Mountains, China. Environ. Earth Sci. 2016, 75, 1189. [Google Scholar] [CrossRef]
  44. Yang, X.; Chen, C.; Luo, Q.; Li, L.; Yu, Q. Climate change effects on wheat yield and water use in oasis cropland. Int. J. Plant Prod. 2011, 5, 83–94. [Google Scholar]
  45. Chen, Z.; Chen, Y.; Li, W. Land use/cover change and their driving forces in Hotian river basin of Xinjiang [in Chinese with English abstract]. J. Desert Res. 2010, 30, 326–333. [Google Scholar]
  46. Zhou, L.; Tian, Y.; Myneni, R.B.; Ciais, P.; Saatchi, S.; Liu, Y.Y.; Piao, S.; Chen, H.; Vermote, E.F.; Song, C.; et al. Widespread decline of Congo rainforest greenness in the past decade. Nature 2014, 509, 86–90. [Google Scholar] [CrossRef] [PubMed]
  47. Feng, X.; Fu, B.; Piao, S.; Wang, S.; Ciais, P.; Zeng, Z.; Lü, Y.; Zeng, Y.; Li, Y.; Jiang, X.; et al. Revegetation in China’s Loess Plateau is approaching sustainable water resource limits. Nat. Clim. Chang. 2016, 6, 1019–1022. [Google Scholar] [CrossRef]
  48. Kang, C.; Zhang, Y.; Wang, Z.; Liu, L.; Zhang, H.; Jo, Y. The Driving Force Analysis of NDVI Dynamics in the Trans-Boundary Tumen River Basin between 2000 and 2015. Sustainability 2017, 9, 2350. [Google Scholar] [CrossRef]
  49. Liu, J.; Hertel, T.W.; Lammers, R.B.; Prusevich, A.; Baldos, U.L.C.; Grogan, D.S.; Frolking, S. Achieving sustainable irrigation water withdrawals: Global impacts on food security and land use. Environ. Res. Lett. 2017, 12, 104009. [Google Scholar] [CrossRef]
  50. Cushman, S.A. Calculation of configurational entropy in complex landscapes. Entropy 2018, 20, 298. [Google Scholar] [CrossRef]
  51. Gao, P.; Zhang, H.; Li, Z. A hierarchy-based solution to calculate the configurational entropy of landscape gradients. Landsc. Ecol. 2017, 32, 1133–1146. [Google Scholar] [CrossRef]
  52. Cushman, S.A. Calculating the configurational entropy of a landscape mosaic. Landsc. Ecol. 2016, 31, 481–489. [Google Scholar] [CrossRef]
Figure 1. Map of land use in study area. The land use dataset from 2010 was supported by the Data Center for Resources and Environmental Sciences, Chinese Academy of Sciences (RESDC).
Sustainability 11 00696 g001
Figure 2. The equilibrium extent of land use structure and land use change rate of land use in Xinjiang from 1995 to 2015.
Sustainability 11 00696 g002
Figure 3. The spatial transfer direction of land use change in Xinjiang from 1995 to 2005.
Sustainability 11 00696 g003
Figure 4. The spatial transfer direction of land use changes in Xinjiang from 2005 to 2015.
Sustainability 11 00696 g004
Figure 5. The spatial transfer direction of land use change in Xinjiang from 1995 to 2015.
Sustainability 11 00696 g005
Figure 6. The migration direction of the centroid position of cropland in Xinjiang from 1995 to 2015.
Sustainability 11 00696 g006
Figure 7. The relationship between climate factors and cropland changes in the three typical river basins from 1995 to 2015 (a) is temperature, (b) precipitation, and (c) runoff. The cropland change rate is calculated by Equation (6).
Sustainability 11 00696 g007
Figure 8. (a) GDP and population size of Xinjiang from 1995 to 2015, with the units of GDP being RMB. (a) Land use changes in Xinjiang from 1995 to 2015.
Sustainability 11 00696 g008
Table 1. Land use change rates in Xinjiang from 1995 to 2015 (units: %/a).
1995–20052005–20151995–2015
Cropland1.931.613.86
Forest−0.05−0.21−0.26
Grassland−0.23−0.13−0.36
Water bodies0.760.050.81
Artificial land2.714.107.92
Unused land−0.01−0.06−0.07
Table 2. The transfer matrix of land use change from 1995 to 2005 (units: km2).
CroplandForestGrasslandWater BodiesArtificial LandUnused Land
Cropland53,77013983586481407
Forest67637,096146491655
Grassland9808390472,8496941772298
Water bodies872527511,64716318
Artificial land1013136874
Unused land2147187842837333999,879
Table 3. The transfer matrix of land use change from 2005 to 2015 (units: km2).
CroplandForestGrasslandWater BodiesArtificial LandUnused Land
Cropland65,357195012756628
Forest69536,884181243815
Grassland672456467,273249470143
Water bodies126142312,659897
Artificial land3104946660
Unused land427673491330893996,859
Table 4. The transfer matrix of land use change from 1995 to 2015 (units: km2).
CroplandForestGrasslandWater BodiesArtificial LandUnused Land
Cropland53,07014510451021002354
Forest133536,191320645473
Grassland16,266422465,7198227522200
Water bodies2122047511,30554302
Artificial land3216236614
Unused land6294254130810031118994,209
Table 5. Correlation between runoff and climate factors from 1960 to 2012.
River BasinsTime ScalePrecip. vs. RunoffTemp. vs. Runoff
Kai-Kong River BasinInter-annual0.703 ***0.382 ***
Inter-annual vs. inter-decadal−0.273 **−0.076
Inter-decadal vs. inter-annual−0.177−0.111
Inter-decadal0.542 ***0.516 ***
Aksu River BasinInter-annual−0.297 **−0.060
Inter-annual vs. inter-decadal0.178−0.128
Inter-decadal vs. inter-annual0.255 *−0.119
Inter-decadal−0.0610.494 ***
Yarkand River BasinInter-annual−0.0600.214
Inter-annual vs. inter-decadal0.073−0.044
Inter-decadal vs. inter-annual0.0690.027
Inter-decadal−0.594 ***0.393 ***
*** correlation is significant at the 0.01 level; ** correlation is significant at the 0.05 level; * correlation is significant at the 0.1 level.

