1. Introduction
Recent decades have witnessed a rapid growth in the construction industry due to social and economic development. This industry has brought about significant impacts on the economy, environment and society [
1] as it exerts expressive demand and great influence on the total consumption of natural resources and emissions released into the atmosphere [
2]. It is responsible for environmental impacts, both from the viewpoint of the materials and the energy consumed [
3]. Globally, this industry consumes 60% of raw materials extracted from the lithosphere [
4] and requires up to 40% of the total energy demand in industrialized countries [
5].
As a response to the impacts derived from construction activities, the change from the traditional construction industry to a sustainable development model capable of balancing the economic, social and environmental dimensions has received global attention [
6]. For Balaguera et al. [
7], the insertion of environmental aspects in the evaluation of sustainability guarantees the reduction of impacts, reducing the use of traditional materials by replacing them with alternative materials.
According to Perez and Cabeza [
3], potent tools should be used to treat these environmental issues. Life Cycle Assessment (LCA), when applied to the construction sector, is a technique that allows the evaluation of the impact of the construction process in all its phases. It can be applied to different scales and for different purposes [
3]. LCA is a fundamental tool in measuring detailed environmental impacts, especially in the building industry [
8]. This method considers environmental aspects and potential environmental impacts throughout a products lifecycle, including the production, use and final disposal phases [
9].
The construction industry is responsible for the exploration and use of natural resources around the world [
10,
11,
12]. In addition, many countries have faced water scarcity problems and several measures have been taken continuously to reduce the depletion of global water resources [
13]. In the building sector, this concern may lead to the choice of strategies for saving water, such as the adoption of water-saving technologies, as well as the use of alternative sources of water supply [
14,
15,
16]. Among the alternative sources of water supply, several studies evaluate the use of rainwater harvesting systems [
13,
17,
18,
19] and water reuse systems [
20,
21].
This study aims to analyze, through Life Cycle Assessment, three scenarios with different solutions for toilet water supply in a classroom building at a University in Southern Brazil. The environmental impact includes impact categories, such as water consumption, energy consumption, and global warming potential. Additionally, an economic analysis of the scenarios is performed, according to the following method.
2. Materials and Methods
Life Cycle Assessment was performed in three scenarios (
Figure 1). In the first scenario, single-flush valve devices were operated on all toilets of a campus building. In the second scenario, dual-flush valve devices were operated and in the third scenario, the installation of dual-flush valve devices and a greywater reuse system from the lavatories in the toilets were analyzed. This analysis occurred in all restrooms of a classroom building at a university in Southern Brazil.
Initially, in-situ measurements were taken to determine the volume of water consumed in the plumbing fixtures installed in the male and female toilets using smart meters. Measurements of the existing plumbing fixtures were performed in two phases: single-flush devices installed in all toilets of the building in the first period and with dual-flush valve devices in the second period. The necessary data for applying the LCA methodology were supplied by the flush valve device manufacturer, taken from databases such as Ecoinvent Centre [
22] and in the literature. An environmental impact assessment was carried out by running the SimaPro 8.3.0 software.
The measurement period for the single flush valve device was from 27 March 2017 to 17 July 2017 and the measurement period for the dual-flush valve device was from 8 August 2017 to 22 October 2017. In the two measurement periods, weekends and school holidays were excluded. The measurements in lavatories occurred during the same period. In order to avoid any interference from leaks measured by smart meters, 5% and 95% percentiles were used as cut-off points [
23,
24].
The greywater generated in the building was obtained by the volume of water consumed in lavatories installed in the male and female restrooms. The use of the subsurface wetland vertical flow system for wastewater treatment was chosen based on its high treatment efficiency [
25], as it does not require very specialized operational skills for its maintenance and displays low energy consumption [
26]. The subsurface wetland vertical flow system used with a chlorine dosing pump was adopted by Marinoski et al. [
14] and Marinoski and Ghisi [
21].
According to Avery et al. [
27], wetland systems are a low-tech option, useful for treatment of domestic greywater for reuse purposes. The area of the wetland treatment system was calculated according to Equation (1) [
28].
whereas:
is the surface area of the constructed wetland system (m
2),
is the amount of greywater produced (l/d);
is the hydraulic retention time (d);
is the fraction of water added to the system due to precipitation (dimensionless);
is the fraction of water losses due to evapotranspiration (dimensionless);
is the fraction of void volume and pore space of the filter medium (dimensionless);
is the depth of the wetland deducted from the freeboard (mm).
The following were the characteristics of the wetland system: the hydraulic detention time of greywater was 2 days, the fraction of void volume and pore space was 40% and the depth of wetlands was 50 cm as employed by Vieira and Ghisi [
28]. The loss rate employed for evapotranspiration was 10% of the effluent volume, according to a study conducted by Headley et al. [
29] for humid subtropical regions. There was a 7% increase in the effluent volume from rainfall as calculated by Vieira and Ghisi [
28].
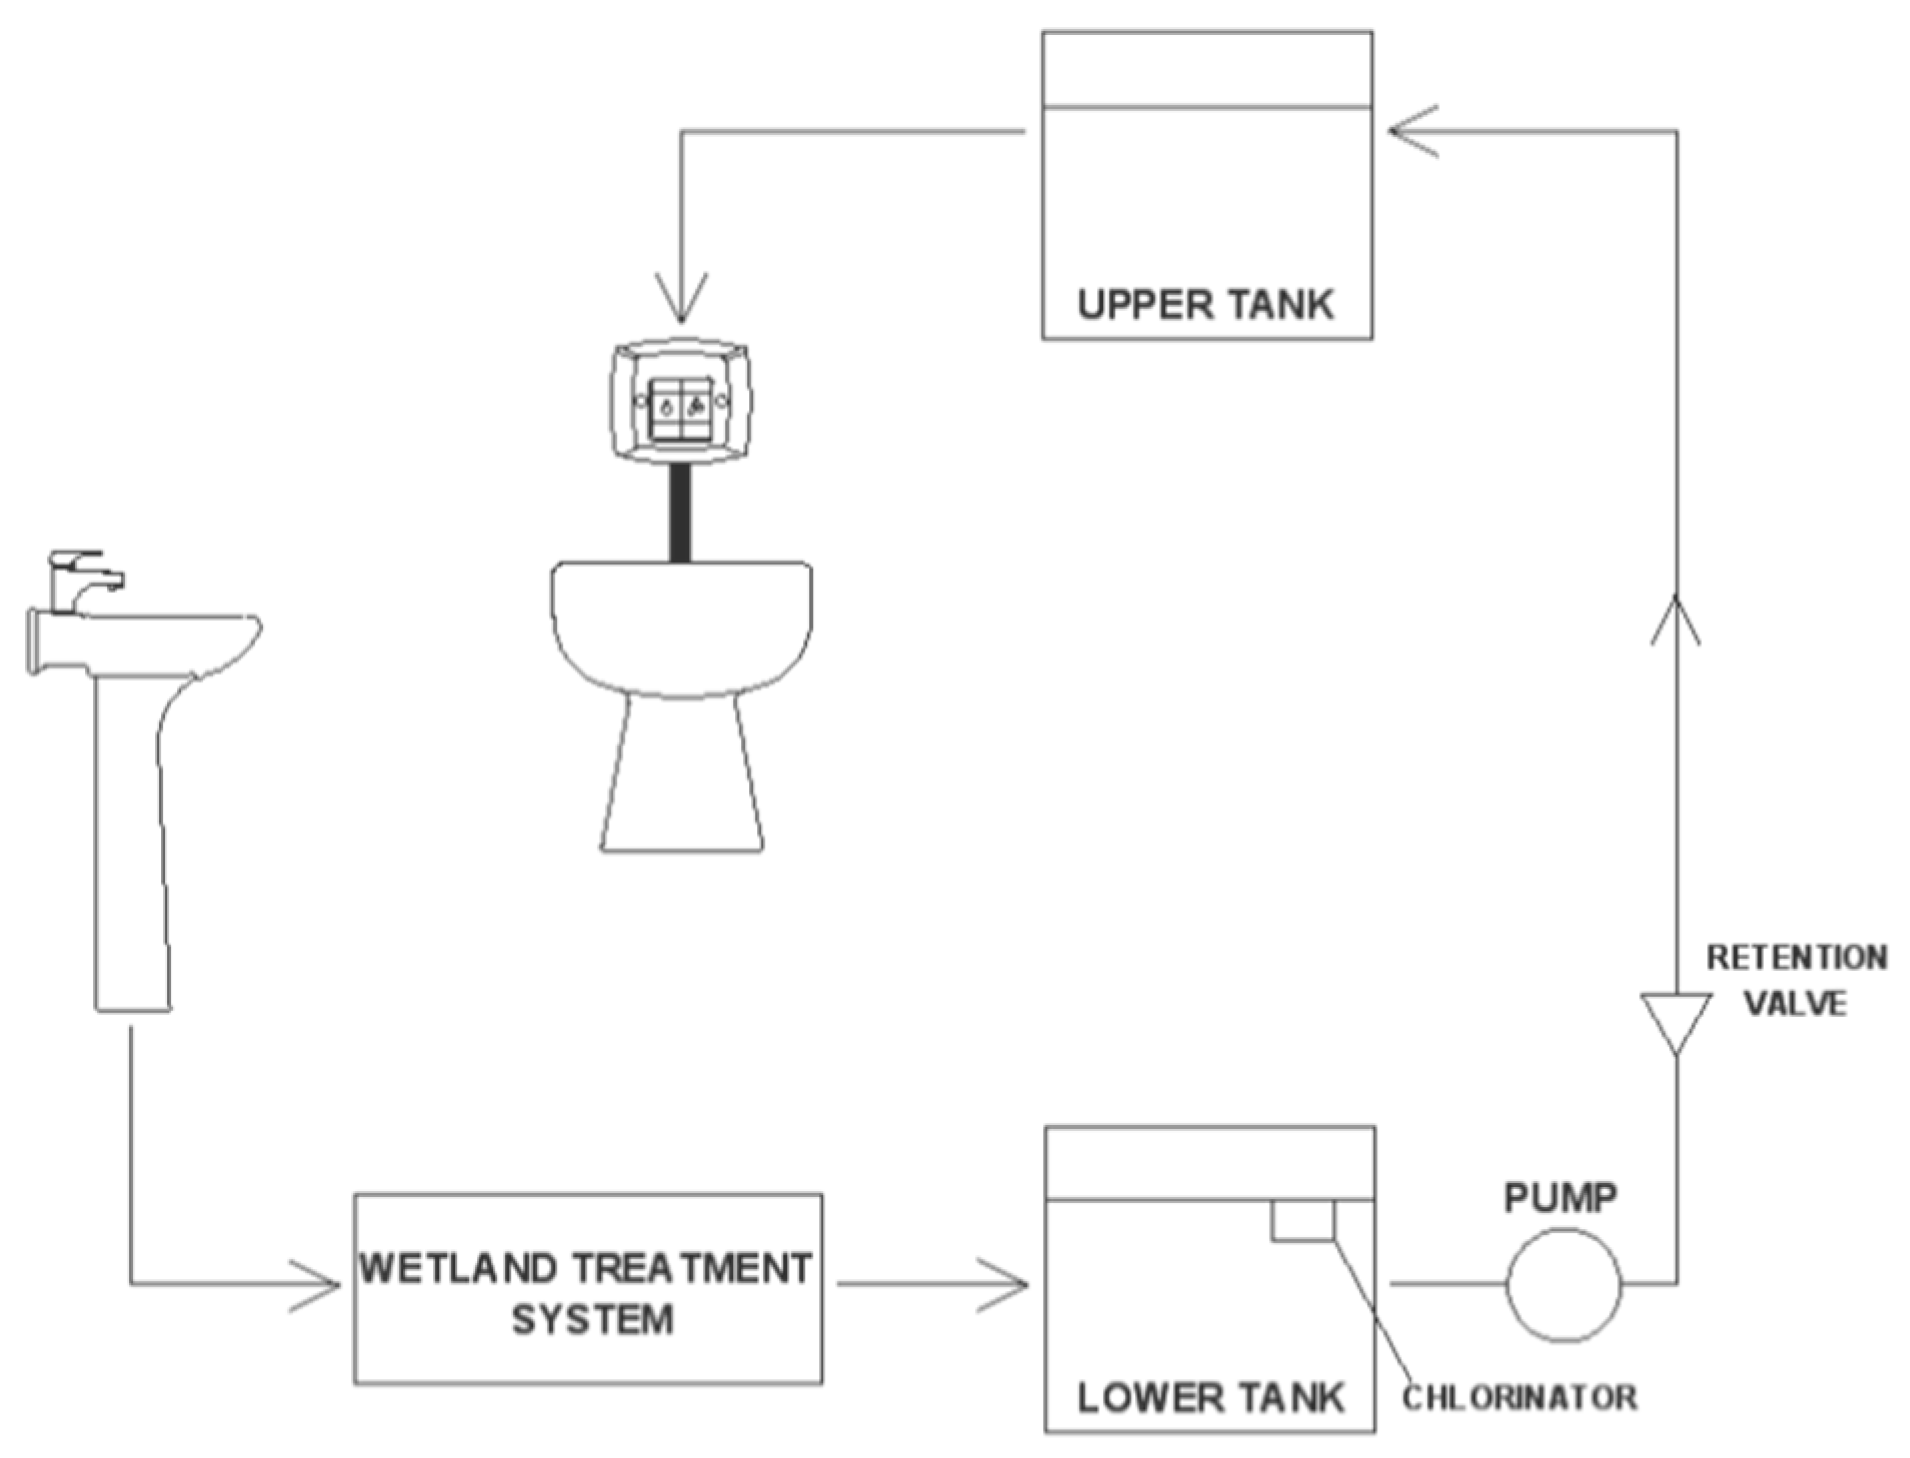
The greywater reuse system was composed of: upper and lower tanks, a wetland treatment system; a disinfection system (chlorinator), a motor pump, horizontal and vertical piping, hydraulic fittings, retention valve, and a float level valve [
14,
21] (
Figure 2).
2.1. Environmental Impacts Considered in This Study
The adopted method was developed by Kalbusch and Ghisi [
30], whereas the considered phases of the life cycle were divided into production, use and final disposal. In the production phase, the extraction of the materials and their processing were taken into account. The use phase involved the impacts caused by the operation and possible maintenance until the final disposal, including the impacts related to the disposal of the systems after the end of their lifespan.
The inputs included water flow, energy, raw materials, and air emission. The analyzed impact categories were water consumption, total energy consumption, and global warming potential. The categories were selected according to the application in previous LCA studies in the civil construction sector and their environmental importance. The water consumption was evaluated since the purpose of replacing flush valve devices is to save water. Additionally, other authors have also analyzed using water-saving equipment to save water in universities [
31,
32,
33]. Energy consumption is one of the most commonly analyzed impact categories [
34]. Several studies have related energy consumption with water saving [
35,
36,
37]. The global warming potential, according to studies performed by Corominas et al. [
38] and Vilches et al. [
39] is one of the most considered impact categories in studies involving Life Cycle Assessment.
2.2. Quantification of Environmental Impacts
The quantification of water, energy and atmospheric emissions was done according to the method adopted by Kalbusch and Ghisi [
30] where the water consumption considered the total volume of water consumed throughout all life cycle phases in plumbing systems, including the volume of water used in the transportation phase. The energy quantities used throughout all phases of the life cycle of the plumbing systems were considered for the total energy consumption, which includes the necessary energy for transporting these devices.
According to Houghton et al. [
40] future global warming caused by a greenhouse gas during the course of a given time horizon can be estimated by multiplying the atmospheric emission of that substance in kg based on its corresponding global warming potential, resulting in kg of CO
2 equivalent (Equation (2)) [
41].
whereas
is the index of the global warming potential category (kg of CO
2 equivalent);
n is the number of analyzed substances;
is the global warming potential of each analyzed substance (kg of CO
2 equivalent/kg of substance);
are the atmospheric emissions of the analyzed substances (kg).
2.3. Scenarios
The boundary of the system being studied begins by extracting the raw material for producing the components and ends by disposing the parts in appropriate places at the end of the lifespan. Thus, this study can be considered a cradle-to-grave study [
42]. The system employed a 20-year time horizon based on studies carried out in the field of hydraulic building systems [
14,
28,
43].
The three scenarios were analyzed according to the same functional unit: the water used in the building for the toilet flush valves during a 20-year time horizon. In scenario 1, single-flush valve devices were installed in the building. In scenarios 2 and 3 dual-flush valve devices were installed. In the reuse system, energy consumption for water supply, greywater retention, and collection, and treatment of the sewage generated [
14] were considered. The average energy consumption for the city of Joinville from 2010 to 2015 for the water supply systems was 0.55 kWh/m
3 and in sewage systems, it was 0.34 kWh/m
3 [
44].
Scenarios 1 and 2 in this study considered the water and energy consumption in the extraction and processing phases of the raw materials composing the flush valve devices, as well as the transportation of the raw materials from the source to the factory. However, for the reuse system, the materials constituting the components of this system and the transport from the plant to the University were also considered. For the final disposal phase, the components with a shorter lifespan than the time horizon of this study were considered, yet not taking into account the recycling of materials as adopted by Kalbusch and Ghisi [
30]. As the scenarios considered landfill disposal at the end of the lifespan of the flush devices, water consumption and transportation are considered in this step.
Wilcoxon-Mann-Whitney nonparametric test was used to compare the differences between the consumption and the number of times the toilets are operated in both periods (single and dual-flush valve devices installed), based on a significance level equal to 5%. This test was chosen because the data were not normally distributed. Statistical analysis was performed by running the software R [
45].
2.4. Life Cycle Cost
In order to evaluate the present value of the investment of the three analyzed scenarios, the Net Present Value (NPV) was adopted as a criterion consisting of discarding all future cash flows at the present time [
46]. The NPV was calculated according to Equation (3).
whereas
NPV is the Net Present Value,
n is the lifespan of the installed system,
t is the time period of each cash flow,
Ct is the cash flow at time t, and r is the discount rate.
For this analysis, only the acquisition of materials for refurbishing the plumbing system in each evaluated scenario was considered, but labor costs were not included. Thus, in scenario 1, the acquisition of the single-flush valve devices was considered, in scenario 2, the acquisition of the dual-flush valve devices was considered, and in scenario 3, besides the acquisition of the dual-flush valve devices, an upper and lower tanks, a wetland treatment system (concrete, sand, gravel, solid bricks, brick mortar and waterproofing mortar); a disinfection system with a chlorine dosing pump, a motor pump, horizontal and vertical piping, fittings, retention valve, and a level float valve were included.
As the lifespan of the flush valves was 4 years, the acquisition of new replacement equipment at the end of the lifespan, as well as the costs for landfill of equipment that reached the end of its lifespan were considered. Some materials (motor pump, floating chlorinator and feedback) presented a shorter lifespan than the time horizon considered and required replacement. Therefore, costs for replacement and disposal of these components in the landfill were also considered.
3. Results and Discussion
The highest water consumption was 3112.568 L/day including all the plumbing fixtures in the classroom building. Water consumption was 22.94% higher in the building in the second measurement period. This decrease in consumption can be explained by the adoption of water-saving flush valve devices in the second measurement period.
The average consumption for the female and male toilets from the two measurement periods is described in
Table 1. There was a decrease in water consumption in both women’s (
p-value < 0.05) and men’s (
p-value < 0.05) toilets. Although water consumption declined in toilets, the number of activations did not change significantly (
Table 2). This fact emphasizes the performance of the dual-flush valve devices in the reduction of water consumption on toilets.
3.1. Application of LCA Methodology in the Analyzed Scenarios
The information regarding the flush valve devices raw material composition was obtained from an industry located in Southern Brazil. In the use phase, the average volume of water consumed per day by single-flush valve devices was 1485.359 L/day (s = 528.456 L/day) and the average volume consumed by dual-flush valve devices was 1081.204 L/day (s = 379.260 L/day). The replacement of the flush valve device reduced the water consumption on average 26.97% in the use phase of the toilets. The average values for the daily water consumption in the lavatory faucets in the second measurement period were 336.815 L/day (s = 128.766 L/day). This represents 31.15% of the total water needed to meet the daily demand of toilets with dual-flush valve devices (scenario 3).
The electricity consumption in the manufacturing phase was 0.28 kWh/unit for single-flush valve devices and 1.25 kWh/unit for the dual-flush valve devices. The energy source used for the production of the studied flush valve devices is exclusively electric. The mechanical power of the motor pump used in the conventional system is equal to 0.75 HP. The average daily consumption of building restrooms in the initial period was 2.09 m3/day operated 4 h/day. The energy consumption for water pumping is 4.3 MJ/m3. The pump in the second scenario was the same as the one used in scenario 1, and its energy consumption was 5.37 MJ/m3 for an average daily water consumption of 1.70 m3. The motor pump used in the reuse system is 0.25 HP, operated 2 h/day, and the energy consumption for pumping 0.34 m3/day was considered in this study as 4.52 MJ/m3.
3.2. Water Consumption
The total water consumption was 6342.67 m3 during a 20-year period in the first scenario, presenting the highest water consumption among the three analyzed scenarios. The second scenario presented total water consumption of 4634.51 m3, and in the third scenario, the consumption was 3624.01 m3 for the same period. The replacement of the single-flush valve devices by dual-flush valve devices represented an annual saving of 85.41 m3 of water and the implementation of the reuse system achieved 135.93 m3 of water savings per year, considering 16 toilets installed in the building and 207 school days per year.
The water consumption for the three scenarios divided in production, use and final disposal phases (
Figure 3) is presented in logarithmic scale in a dot plot. The use phase presents the highest water consumption in all three scenarios, consuming 99.96% of the water in the first scenario, 99.90% in the second scenario and 87.75% in the third scenario, corroborating with the study by Kalbusch and Ghisi [
30], whereas the use phase presented the greatest contribution in the two analyzed scenarios.
Although the first scenario consumes a smaller amount of water in the production and final disposal phases in the use phase water consumption exceeds the second and the third scenario by 26.97% and 49.84%, respectively. One of the reasons for the decrease in water consumption in scenarios 2 and 3 is the first scenario utilizes single-flush valve devices and the second and the third scenarios utilize double-flush valve devices.
The reuse system reduced the volume of water consumed in scenario 3 since part of the water needed for the use of the toilets came from the lavatories. In the third scenario, the production phase presented higher consumption compared to the other two scenarios due to the number of components in the reuse system.
3.3. Energy Consumption
The total energy consumption in scenarios 1, 2, and 3, respectively, is equal to 66,845.04, 55,591.06 and 36,520.12 MJ. The energy consumption, subdivided in the production, use and final disposal phases for scenarios 1, 2 and 3 is presented in logarithmic scale (
Figure 4). In the production phase, the energy required in the processing of raw materials and energy consumption transport requirements to the production site was considered.
In the use phase, the energy consumption related to transport to the University and the energy consumption involved in water supply in the building and subsequent sewage treatment are considered. Additionally, the pumping of the reuse water was also considered in the third scenario. In the disposal phase, the energy consumption resulting from the transport of the system at the end of its lifespan to the landfill site is considered.
The lower energy consumption for 20-year time horizon occurred in the third scenario, due to the lower consumption of water. The highest consumption occurred in scenario 1, followed by scenario 2. Scenario 1, among the three analyzed, was the one that presented the highest water consumption, resulting in higher energy expenditure for the pumping and treatment of the water used and sewage produced. The highest energy consumption occurred in the use phase for all the analyzed scenarios, representing 99.78% of all energy consumed in the first scenario, 98.94% in the second scenario and 91.73% in the third scenario.
In the production phase, scenario 3 presented the highest energy expenditure because a reuse system is inserted in this scenario which required a large amount of energy for the production of its components. In the study developed by Lee and Tansel [
35], the production phase consumes more energy for both conventional and water-saving toilets. Additionally, the production phase of the water-saving toilet presented superior consumption when compared to the production phase of the conventional toilet. In the present study, the production phase did not consume the most energy, but the production of the dual-flush valve device consumed more energy when compared to the production phase of the single-flush valve device, similarly to the result obtained in the study developed by Lee and Tansel [
35].
3.4. Global Warming Potential
The global warming potential was calculated for scenarios 1, 2, and 3, respectively, equal to 3022.99, 2540.13, and 4031.01 kg CO
2 equivalent. The results presented in
Figure 5 (log scale) show the use phase, except in the third scenario, accounts for the largest share of contribution to the global warming potential in the studied scenarios.
Scenario 3 presented a greater environmental impact during the production phase due to the energy expenditure for the production of the components in the system, mainly the wetland system components. The installation of a greywater reuse system requires a series of equipment and components and therefore more extraction and manufacturing processes of these materials were required. The mortar and cement used in the wetland system contributed directly to this impact category in this scenario.
3.5. Comparison of the Life Cycle Impacts of the Three Scenarios
The first scenario presented the greatest impacts related to the environmental impact categories studied except for the global warming potential (
Figure 6). In this category, the third scenario presented the greatest impacts due to the consumption of cement used in the wetland treatment system.
The results showed that the replacement of the single-flush valve devices by dual-flush valve devices in the flush valves of the toilets reduced water consumption, energy consumption, and global warming potential in the analyzed scenarios. This was demonstrated in the study by Lee and Tansel [
35] for other plumbing fixtures (toilets, washing machines, and showers) in residential buildings.
The third scenario presented a smaller volume of water consumed during a 20-year period but presented the higher global warming potential due to the reuse system, including new pipes, a second motor pump, tanks, as well as other materials, especially the presence of concrete and mortar in the greywater treatment system. If the amount of water available from reuse was greater, better results would be achieved in all environmental impact categories for this scenario. In addition, other treatments for greywater could be tested to reduce that environmental impact.
3.6. Economic Analysis Results
The initial investment for the 20-year period for calculating the Net Present Value was R
$ 966.72 for the first scenario, equipped with single-flush valve devices, R
$ 1421.28 for the second scenario (with dual-flush valve devices), and R
$ 8633.90 for the third scenario, equipped with a greywater reuse system. A discount rate of 10% per year was considered Kalbusch and Ghisi [
30]. The adopted water fee was R
$ 7.80/m
3. The energy requirements for toilet water supply were calculated using 0.55 KWh/m
3 and energy expenditures were based on energy fees for the Brazilian public sector (R
$ 0.39/kWh). The amount considered for the energy expenditure of the motor pump in the third scenario was R
$ 0.24/m
3. Expenses related to landfill rates and transportation fuel consumption were also considered in the disposal phase.
The life cycle costs for all scenario according to the NPV are R$ 23,575.71, R$ 19,091.41, and R$ 22,500.55, for first, second and third scenario, respectively. This result corroborates with the others found for the environmental impact analyzed categories, emphasizing that although the initial value is higher for the scenario with dual-flush valve devices when compared to single-flush valve devices, the water saving provided by the dual-flush valve devices are noteworthy in the final value. The third scenario did not present the lowest NPV in the current situation of the analyzed building, mainly due to the initial cost of the reuse system. However, this scenario may be an economically feasible option in new constructions, as it is important to evaluate this scenario in these cases.
4. Conclusions
The replacement of the flush valve device implied an average reduction of 26.97% in the water consumption in the toilet use phase. The combination of the water-saving flush valve device with the greywater reuse further reduced water consumption by 42.86% in the use phase. The analysis showed that it is environmentally feasible to replace single-flush valve devices by dual-flush in the analyzed impact categories. As the cost of the water-saving flush valve device is not much higher than the cost of the single-flush valve device and this type of device plays a fundamental role in reducing water consumption in toilets, the water-saving model should be encouraged in Brazilian public institutions.
The largest costs were water and energy in the use phase in the three scenarios. The scenario including the reuse system presented smaller environmental impacts compared to the first scenario; where single-flush devices were used, except for the global warming potential. This study emphasizes the importance of considering environmental issues and water consumption for choosing building plumbing systems. A water management system is essential for saving water in buildings; however, other environmental impacts derived from adopting water-saving equipment should not be neglected. Finally, the assessment of scenarios that include rainwater harvesting systems can be cited as a suggestion for future work.


