Article

Conjunctive Water Resources Management in Densely Urbanized Karst Areas: A Study in the Sete Lagoas Region, State of Minas Gerais, Brazil

by
Hugo Henrique Cardoso de Salis
1,
Adriana Monteiro da Costa
1,
Annika Künne
2,
Luís Filipe Sanches Fernandes
3 and
Fernando António Leal Pacheco
4,*
1
Departamento de Geografia, Universidade Federal de Minas Gerais, Av. Antônio Carlos, 6.627-Pampulha-CEP, Belo Horizonte 31270-901, Minas Gerais, Brazil
2
Geographic Information Science Group, Institute of Geography, Friedrich Schiller University, 07749 Jena, Germany
3
Centro de Investigação e Tecnologias Agroambientais e Biológicas, Universidade de Trás-os-Montes e Alto Douro, Ap 1013, 5001–801 Vila Real, Portugal
4
Centro de Química de Vila Real, Universidade de Trás-os-Montes e Alto Douro, Ap 1013, 5001–801 Vila Real, Portugal
*
Author to whom correspondence should be addressed.
Sustainability 2019, 11(14), 3944; https://doi.org/10.3390/su11143944
Submission received: 31 May 2019 / Revised: 15 July 2019 / Accepted: 17 July 2019 / Published: 19 July 2019

Abstract

:
Headwater catchments store valuable resources of quality water, but their hydraulic response is difficult to assess (model) because they are usually deprived of monitoring stations, namely hydrometric stations. This issue becomes even more pertinent because headwater catchments are ideal for the practice of conjunctive water resources management involving the supply of towns with groundwater and surface water, a solution that can be used to mitigate overexploitation of groundwater resources in densely urbanized and populated areas. In this study, a stepwise approach is presented whereby, in a first stage, a gauged basin was modeled for stream flow using the JAMS J2000 framework, with the purpose to obtain calibrated hydraulic parameters and ecological simulated stream flow records. Having validated the model through a comparison of simulated and measured flows, the simulated record was adjusted to the scale of an ungauged sub-basin, based on a new run of JAMS J2000 using the same hydraulic parameters. At this stage, a second validation of modeled data was accomplished through comparison of the downscaled flow rates with discharge rates assessed by field measurements of flow velocity and water column height. The modeled basin was a portion of Jequitiba River basin, while the enclosed sub-basin was the Marinheiro catchment (state of Minas Gerais, Brazil). The latter is a peri-urban watershed located in the vicinity of Sete Lagoas town, a densely urbanized and populated area. This town uses 15.5 hm3 year−1 of karst groundwater for public water supply, but the renewable resources were estimated to be 6.3 hm3 year−1. The impairment between abstraction and renewable resources lasts for decades, and for that reason the town experiences systemic water table declines and sinkhole development. The present study claims that the storage of quality water in the Marinheiro catchment, in a dam reservoir, would help alleviate the depletion of groundwater resources in the karst aquifer because this catchment could deliver 4.73 hm3 year−1 of quality surface water to the municipality without endangering ecologic flows. The construction of a small dam at the outlet of Marinheiro catchment could also improve aquifer recharge. Presently, the annual recharge in this catchment approaches 1.47 hm3 but could be much larger if the small dam was installed in the water course and the captured stream water managed properly.

1. Introduction

Karst aquifers are valuable groundwater resources and therefore managed for public and private water supply in many regions around the globe [1,2,3]. In densely urbanized areas, the annual abstraction through pumping may exceed the renewable resources provided by recharge, leading the karst system to water table declines and subsidiary development of geo hazards (sinkholes). The relationship between overexploitation, water table declines, and sinkhole development has been reported in numerous studies [4,5,6,7,8] and described as follows: Excessive abstractions generate steep cones of depression that accelerate groundwater flow toward them, while slow phreatic recharge is replaced by more rapid downward percolation favoring suffosion, especially when the water table is lowered below the rock head. These two processes are accompanied by increases in the effective weight of the sediments due to loss of buoyant support that ultimately lead to sinkhole formation. Overcoming the impairment between abstraction and resource renewability could be accomplished through storm water infiltration. This is practiced in many urbanized areas to promote recharge and reestablish hydrology to pre-urbanization patterns [9,10]. However, the implementation of storm water infiltration in urban areas overlying karst aquifers is not recommended. Usually, urban storm water is significantly loaded with sediments and transports dissolved contaminants (metals, hydrocarbons), which can rapidly move through preferential flow paths and high permeability zones, reaching the karst aquifer in a short period of time [11,12,13,14,15,16]. In addition to groundwater contamination, storm water infiltration can also promote the development of new suffosional sinkholes.
A route to mitigate recharge declines and consequent groundwater resource reductions can be through the conjunctive management of water resources. This concept involves the combined use of groundwater and surface water to achieve public policy and management goals, and a few other cases consider the use of other sources such as recycled water [17]. Conjunctive water resources management enables greater water supply security and stability, helps adaptation to climate variation and uncertainty, and reduces depletion and degradation of water resources [18,19]. The implementation of conjunctive water resources management requires the selection of small catchments to store quality water in dam reservoirs. Forested headwater catchments can effectively accomplish the task [20]. Besides, if they overlay an overexploited karst aquifer, they can be used to promote diffuse recharge and improve water table recovery in the long term.
A successful selection of catchments to install dam reservoirs requires an evaluation of water resources usually accomplished through hydrologic modeling [21,22]. In general, hydrologic models simulate flow and routing processes at catchment and sub-catchment scales, based on spatially distributed relief, soils, and land use data, as well as on precipitation, temperature, and other climate records, and are validated for stream flow using available discharge records measured in hydrometric stations [23,24,25,26]. Hydrometric monitoring of rivers is practiced at the national scale in many countries and financially supported by public authorities but is usually restricted to a relatively small number of medium to large catchments because maintenance costs are large. Headwater catchments are barely included in the monitoring networks because their associated drainage basins are small. So, despite the importance of these basins as quality water sources ideal for the practice of conjunctive water resources management, they cannot be robustly characterized for hydrologic response, unless a stream discharge record is obtained in the field using portable velocity meters, while the hydrologic model is validated on the basis of that record. Validation of hydrologic models based on hydrometric station data are widespread in the literature [27,28], but that is not the case when the studies are developed in ungauged streams. The general purpose of this study is therefore to help improving hydrologic modeling of ungauged watersheds. The specific purposes include (1) use a spatially distributed hydrologic model (JAMS J2000 framework) to estimate stream discharge in a monitored catchment, (2) calibrate and validate the model using stream flow data obtained from a hydrometric station, (3) use the calibrated parameters to model stream discharges in an ungauged headwater sub-catchment, (4) validate the model using discharges measured in the field with a portable velocity meter, and (5) evaluate water resources and recharge capacity in the headwater catchment. The rationale underlying the proposed research is portrayed in Figure 1.
The study area is the Marinheiro catchment, a headwater tributary catchment of Jequitiba River basin where the Sete Lagoas town is installed (state of Minas Gerais, Brazil). This town grew from 150.000 to 220.000 habitants in a period of 25 years (1993–2008). In that period, these people consumed 200 L habitant−1 day−1 of groundwater that was withdrawn from a karst aquifer. Groundwater was pumped from the aquifer using a significant number (≈ 100) of large yield (≈ 8.0 L s−1) drilled wells that worked 16 h every day [29,30]. In 2014, Galvão et al. [31] evaluated the long standing effects of pumping in the geometry of hydraulic heads. A depressed area was delineated around the older wells (1942), where depths to the water have ranged from 14 m post drilling to 62 m in 2012 (48 m drawdown in 70 years). The study also suggested the link of this hydraulic head depression to the development of various suffosional sinkholes. It is therefore pertinent to study this area and help the Sete Lagoas Municipality to resolve the problem, suggesting the alleviation of pumping through the conjunctive use of karst groundwater and surface water from the Marinheiro stream in the public water supply. In this context, the Marinheiro catchment is a peri-urban basin of Sete Lagoas town whose recent master plan directs the region toward urban sprawl. These political guidelines make the Marinheiro catchment vulnerable to real estate speculation and soil sealing by the construction of houses and asphalt paving, as well as other impacts. It is also worth recalling that the Marinheiro main watercourse is ecologically relevant, acting as thinner of polluted waters flowing into the Jequitibá River.

2. Materials and Methods

2.1. Study Area

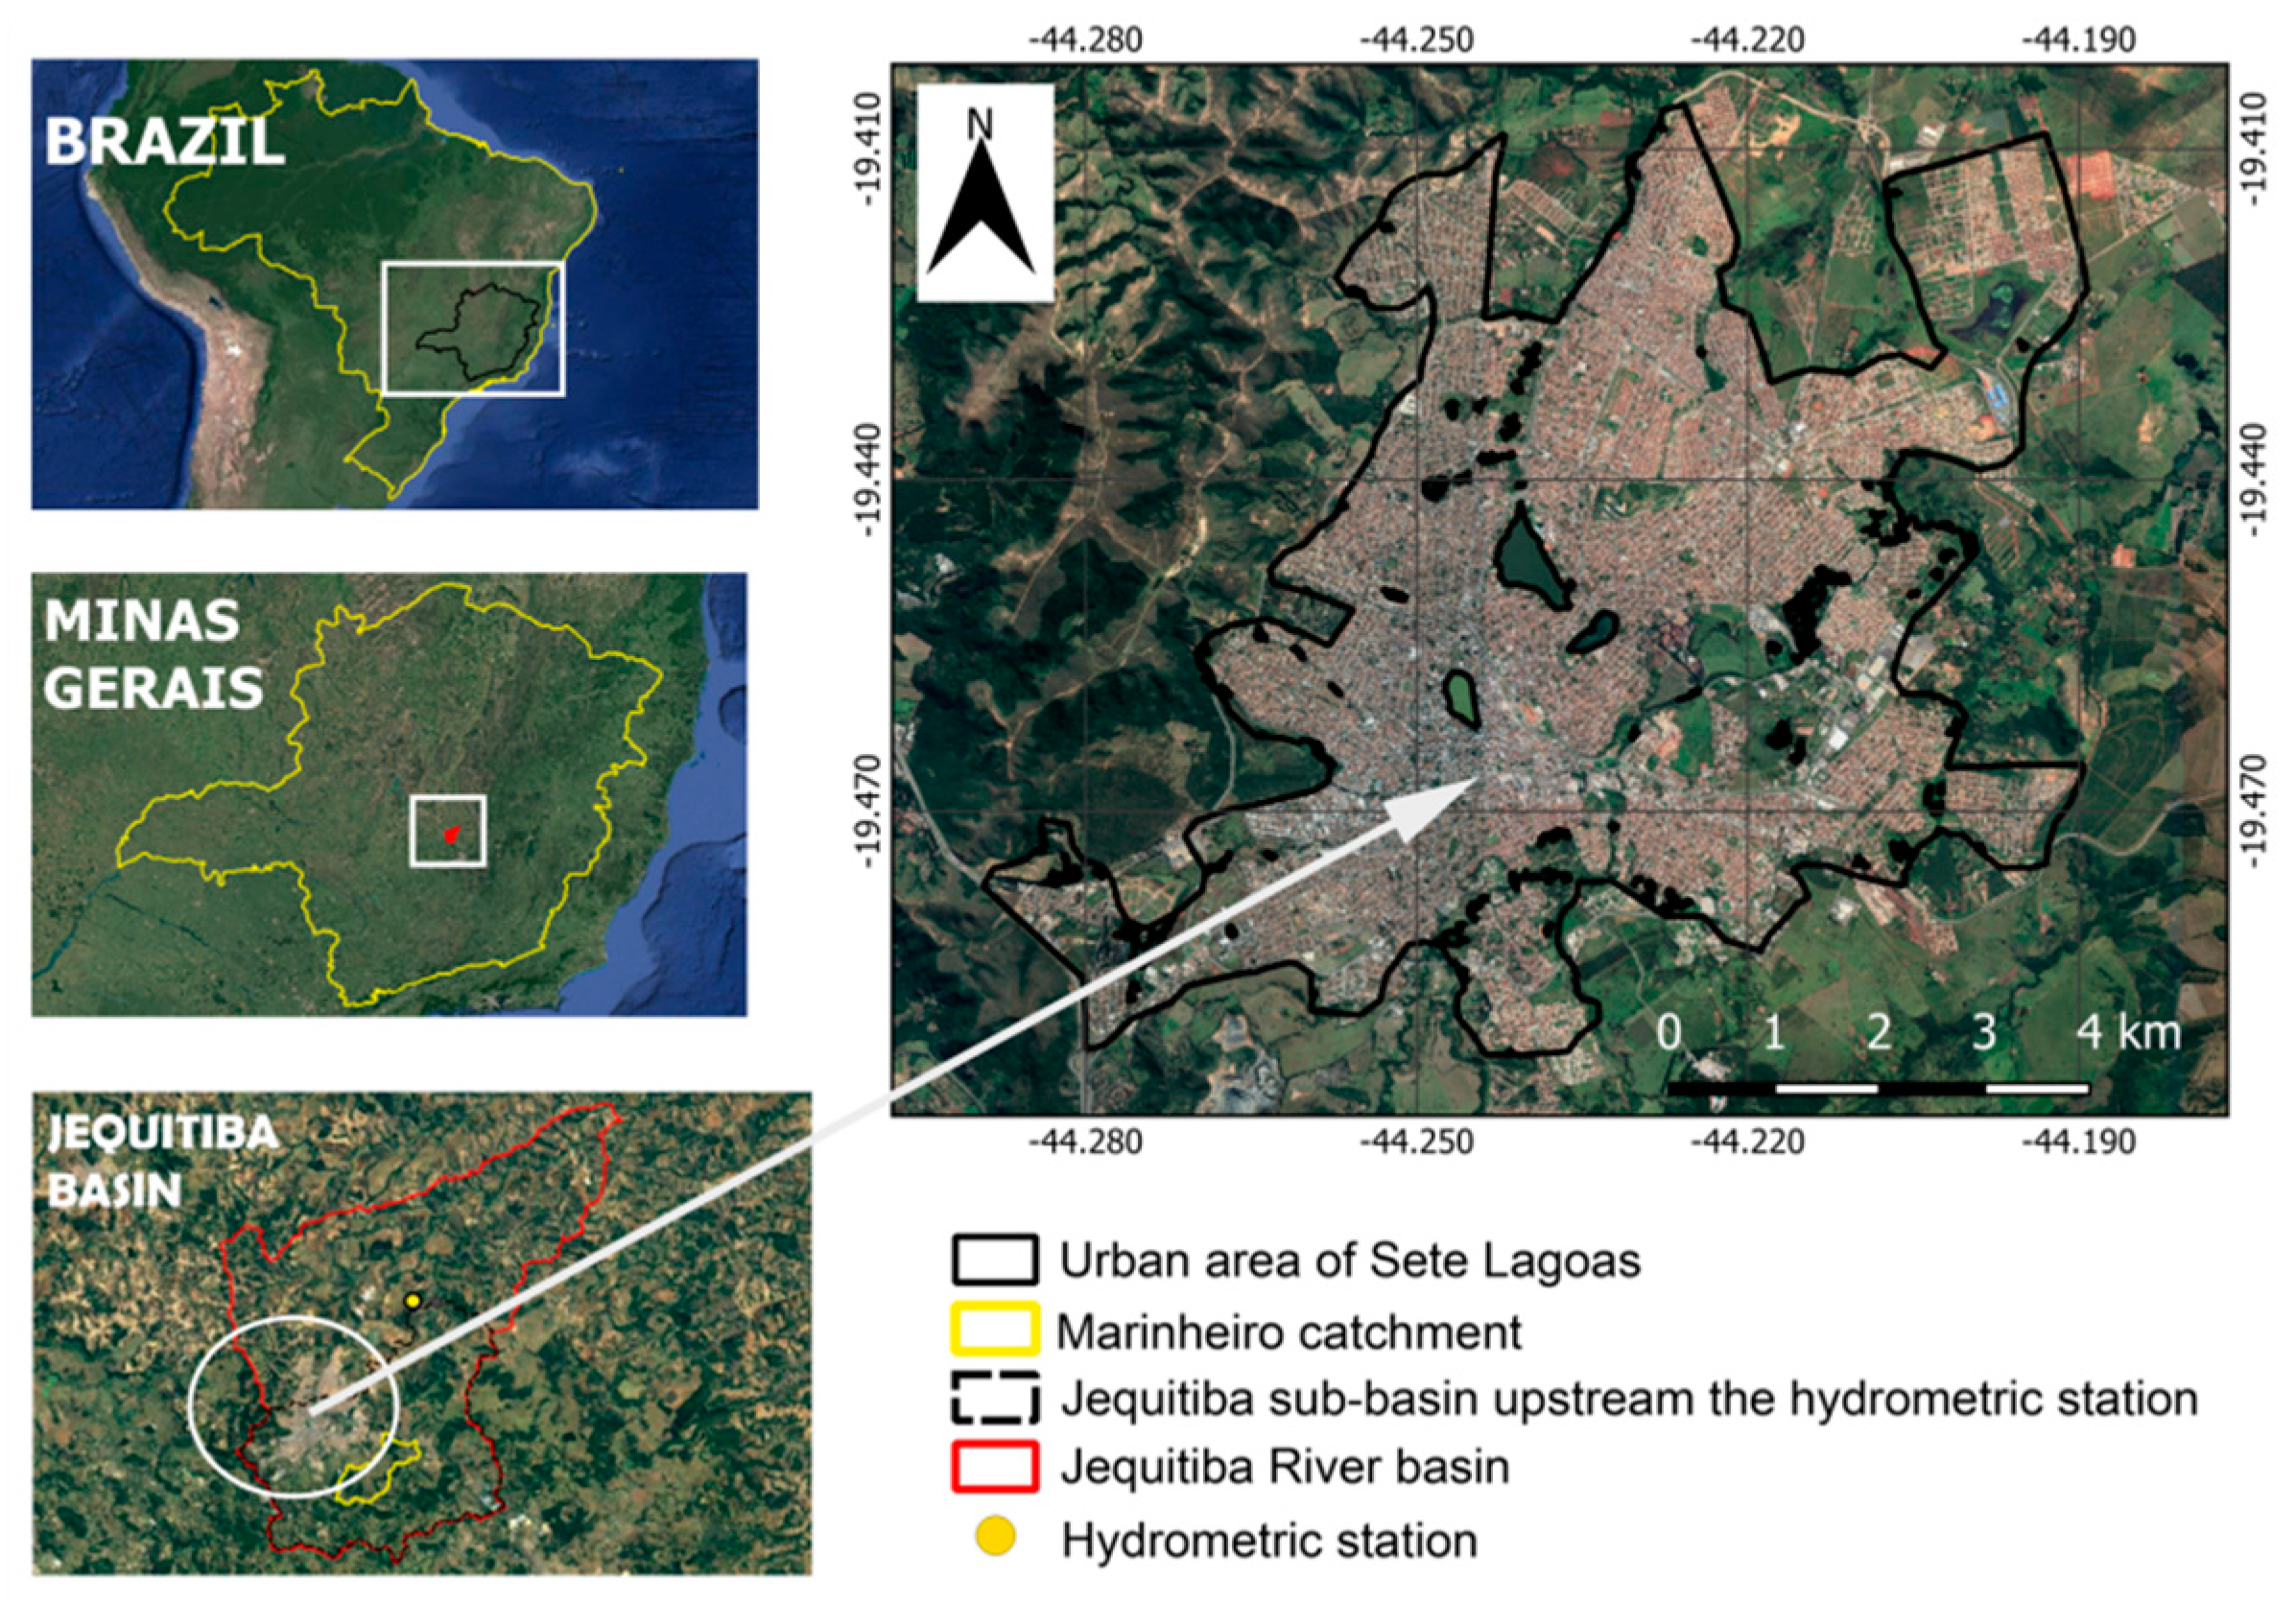
The Jequitiba River basin (area: 57,148 he) is located in the central region of Minas Gerais state (Brazil; Figure 2), and is characterized by rural environment, except in Sete Lagoas town, which is densely urbanized and populated. The study area comprises the Marinheiro catchment (1480 he), which a small tributary headwater catchment of the Jequitiba River basin located in the neighborhood of Sete Lagoas. The Jequitiba basin is located between the geographic coordinates X = 573,198 to 594,872 m and Y = 7,859,607 to 7,836,875 m, referred to the SIRGAS 2000 geodetic datum and UTM 23 South projection, while the Marinheiro catchment fits within the coordinates X = 581,100.3 to 587,493.5 m and Y = 7,841,747.5 to 7,847,420.3 m.
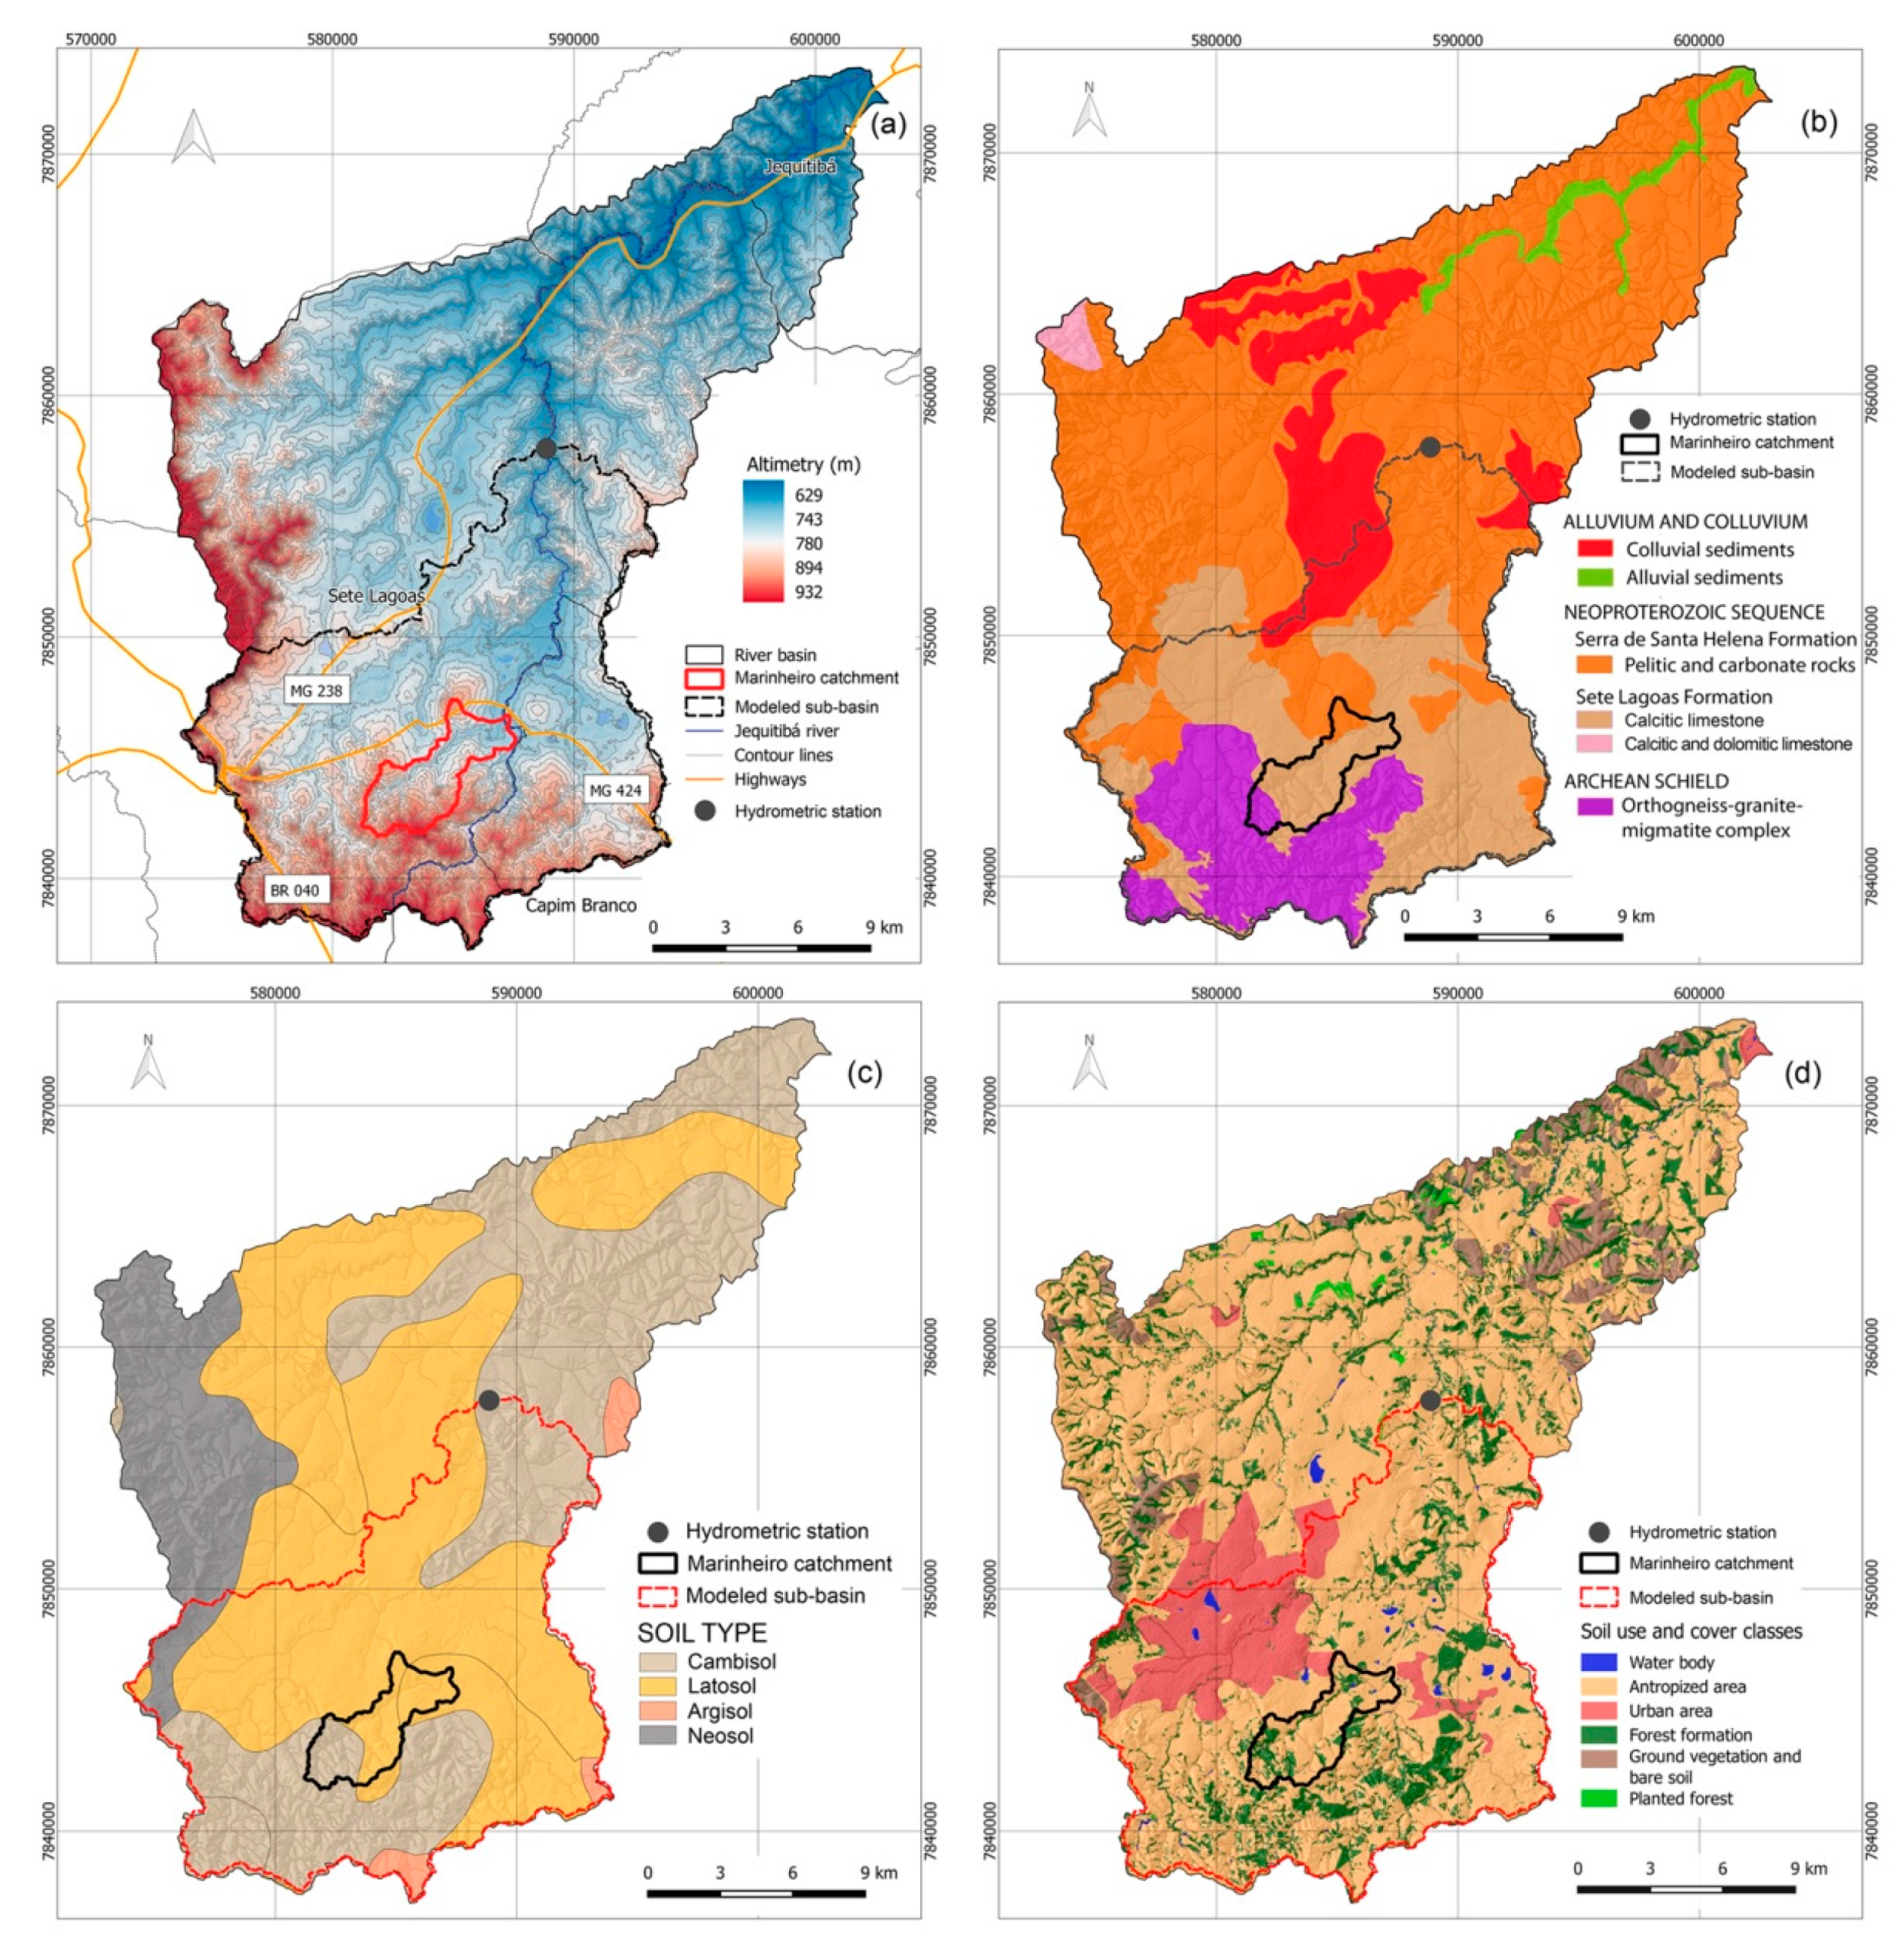
According to Koppen’s classification, the climate is subtropical (Cwa), characterized by dry winters and hot summers. The mean annual rainfall was 1291.2 mm in the 2000–2018 period, while the mean temperatures ranged between 18 ºC and 24 ºC from July to January–February, and showed a mean annual value of 21.8 °C. The altitudes range from 629 to 932 m in the Jequitiba River basin and between 717 and 918 m in the Marinheiro catchment (Figure 3a). The geologic substratum (Figure 3b) of the Jequitiba River basin comprises an Archean crystalline basement composed of orthogneisses, granites, and migmatites (24.3%) that were overlaid by Neoproterozoic carbonate rocks of the Bambuí Group, namely calcite and dolomite limestones from the Sete Lagoas Formation (42.7%), and pelitic rocks with interlayered carbonates from the Serra de Santa Helena Formation (28.7%). Later, this sequence was covered by alluvium, colluvium, and terrace sediments (4.4%) along and lateral to the main water courses [32,33]. The Marinheiro catchment is dominated by carbonate rocks from the Sete Lagoas formation, with a small area of Archean rocks cropping out around the catchment headwaters. The comparison of Figure 3b with Figure 3c (soil map [34]) reveals that Archean rocks as well as pelitic rocks cropping out in the catchment lowlands are overlaid with cambisols (36.7% coverage within the Jequitiba River basin), pelitic rocks cropping out in the catchment highlands are overlaid with neosols (12.2%), and limestones and terrigenous rocks are overlaid with latosols (49.6%). Accordingly, the Marinheiro catchment is mostly covered with latosols and cambisols (along the headwaters). Land in the Jequitiba River basin is mostly used for anthropogenic activities, such as livestock pasturing or agriculture, which are distributed along the drainage network (Figure 3d). Forests occupy 15.8% of the area, and urban areas 14.4% [35]. Agriculture is also dominant in the Marinheiro catchment, but native vegetation is kept dense in some areas, especially along the headwaters.
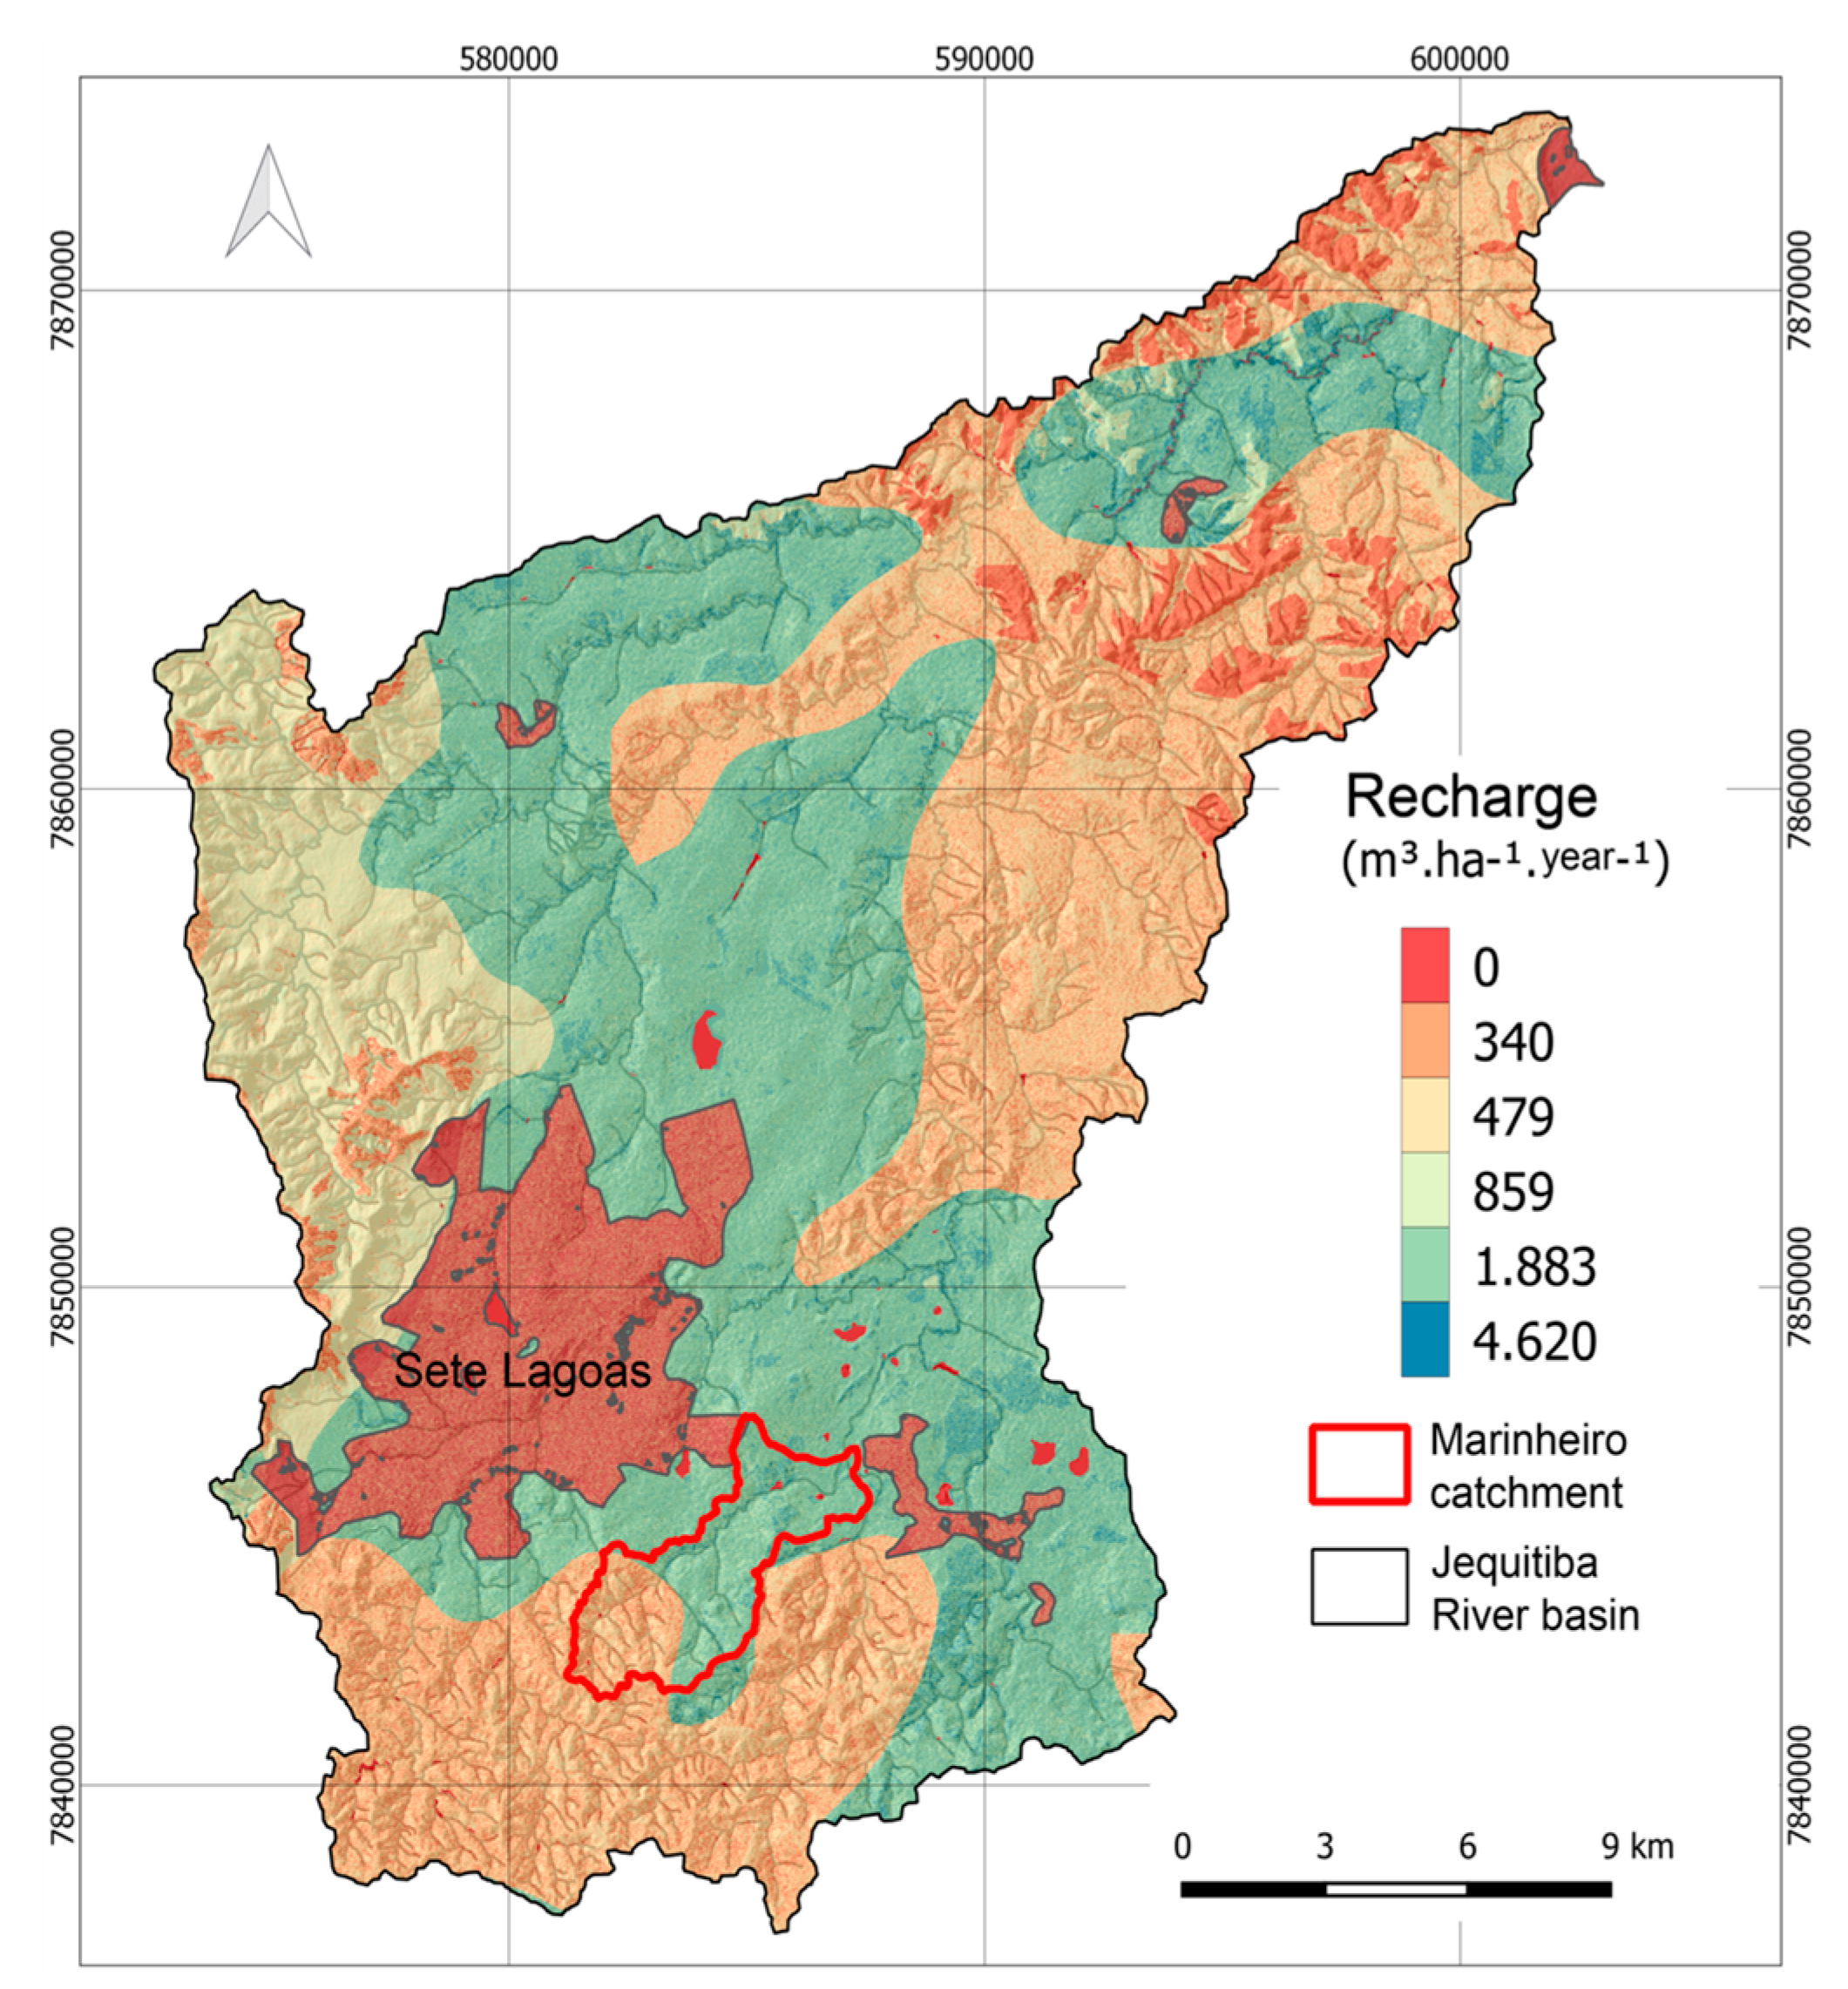
The hydrogeology is characterized by fractured aquifers, developed in the Archean rocks. Fractured-karst aquifers developed in the pelitic rocks interlayered with carbonates from the Serra de Santa Helena formation, karst aquifers developed in the limestones from the Sete Lagoas formation, and porous aquifers developed in the terrigenous rocks and soil layer [
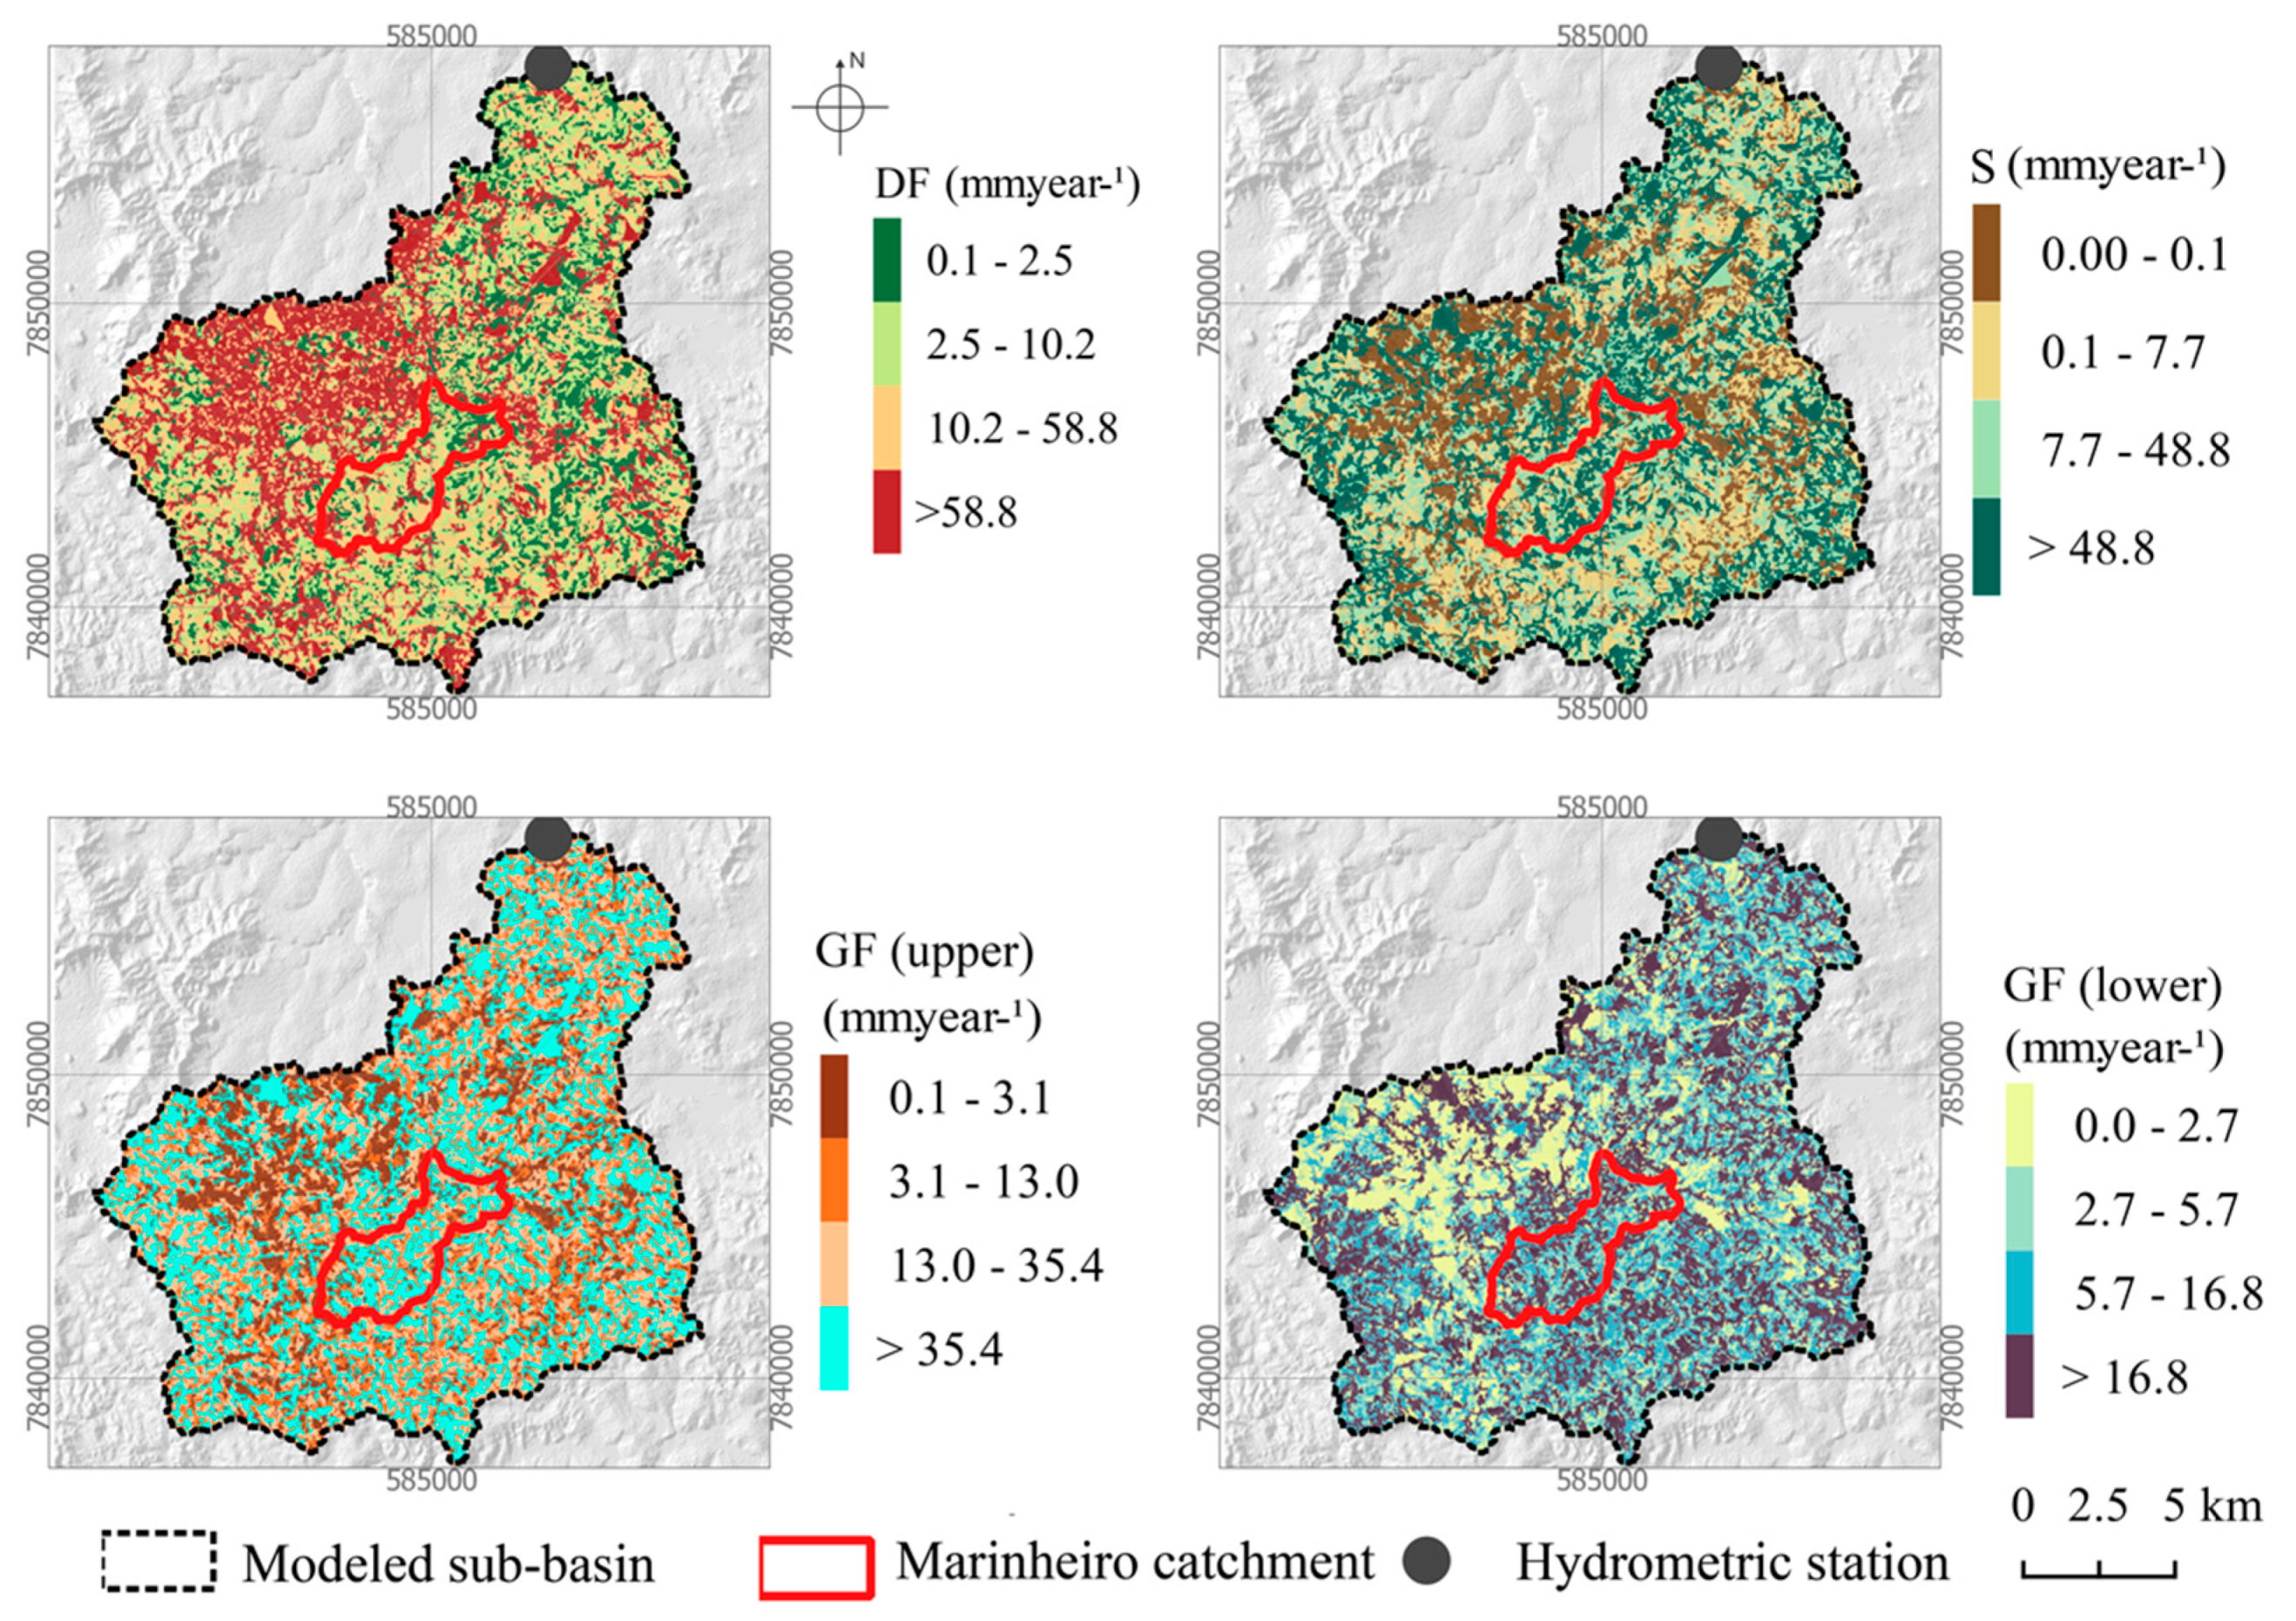
36]. Recently, Monteiro et al. [37] estimated the recharge within the Jequitiba River basin (Figure 4) and derived average values for the various aquifer types (m3 ha−1 year−1): 829.3–1357.0 (porous), 829.3 (karst and fractured-karst), and 539.3 (fractured crystalline). According to Figure 4, average recharge within the Marinheiro catchment is 340 m3 ha−1 year−1 within the fractured aquifer (≈ 30% of the catchment) and 1883 m3 ha−1 year−1 within the karst aquifer (≈ 70%), which means 1420 m3 ha−1 year−1 on average.
The town of Sete Lagoas has been supplied with groundwater from the karst aquifer since the 1950s [29], when the population was less than 25,000 inhabitants and groundwater was extracted from cisterns. These sites became obsolete as the population grew, being progressively replaced by drilled wells to satisfy the public water demand. In 1993, 65 drilled wells were pumped every day for 16 h, extracting 8.0 L s−1 each to satisfy the consumption of 150,000 people living in Sete Lagoas [29,38]. The situation was re-evaluated in 2008 by Botelho [30], who counted 94 drilled wells (44% increase), keeping a similar mean abstraction (7.8 L s−1) to satisfy the consumption of 220,000 habitants (47% increase).

2.2. Digital Data, Numerical Records and Software

The materials used in this study are indicated in Table 1 and comprised (a) a Digital Elevation Model (DEM) ALOS PALSAR with a spatial resolution of 12.5 m [39]; (b) Sentinel-2 satellite images with a spatial resolution of 10 m [40]; (c) the soil map of Minas Gerais state at scale of 1:650,000 and corresponding data on hydraulic conductivity [34]; (d) the geological map of Minas Gerais state at scale 1:1,000,000 [33]; (e) Climatic data from weather stations in the municipalities of Belo Horizonte (BH), Sete Lagoas (SL), Conceição do Mato Dentro (CMD), and Florestal (FLT) [41]; and (f) Hydrometric data of station 41410000 [42].
The software Hydrus 1D (https://www.pc-progress.com) was used to estimate hydraulic conductivity of soils based on soil texture data released with the soil map. The SPRING software, version 4.3.5 (http://www.dpi.inpe.br/spring/english/), was used to interpret the satellite images and delineate land uses and occupations. The JAMS J2000 framework (http://jams.uni-jena.de) was used to perform the hydrologic modeling, including the calibration and validation procedures. The Quantum GIS (https://www.qgis.org) and ArcMap (https://www.esri.com/) were used to produce the thematic maps (e.g., Figure 3), given its visualization capabilities exposed in numerous environmental studies [43,44,45,46,47,48,49,50,51,52,53,54,55,56,57,58,59,60,61,62,63].

2.3. Hydrologic Modeling

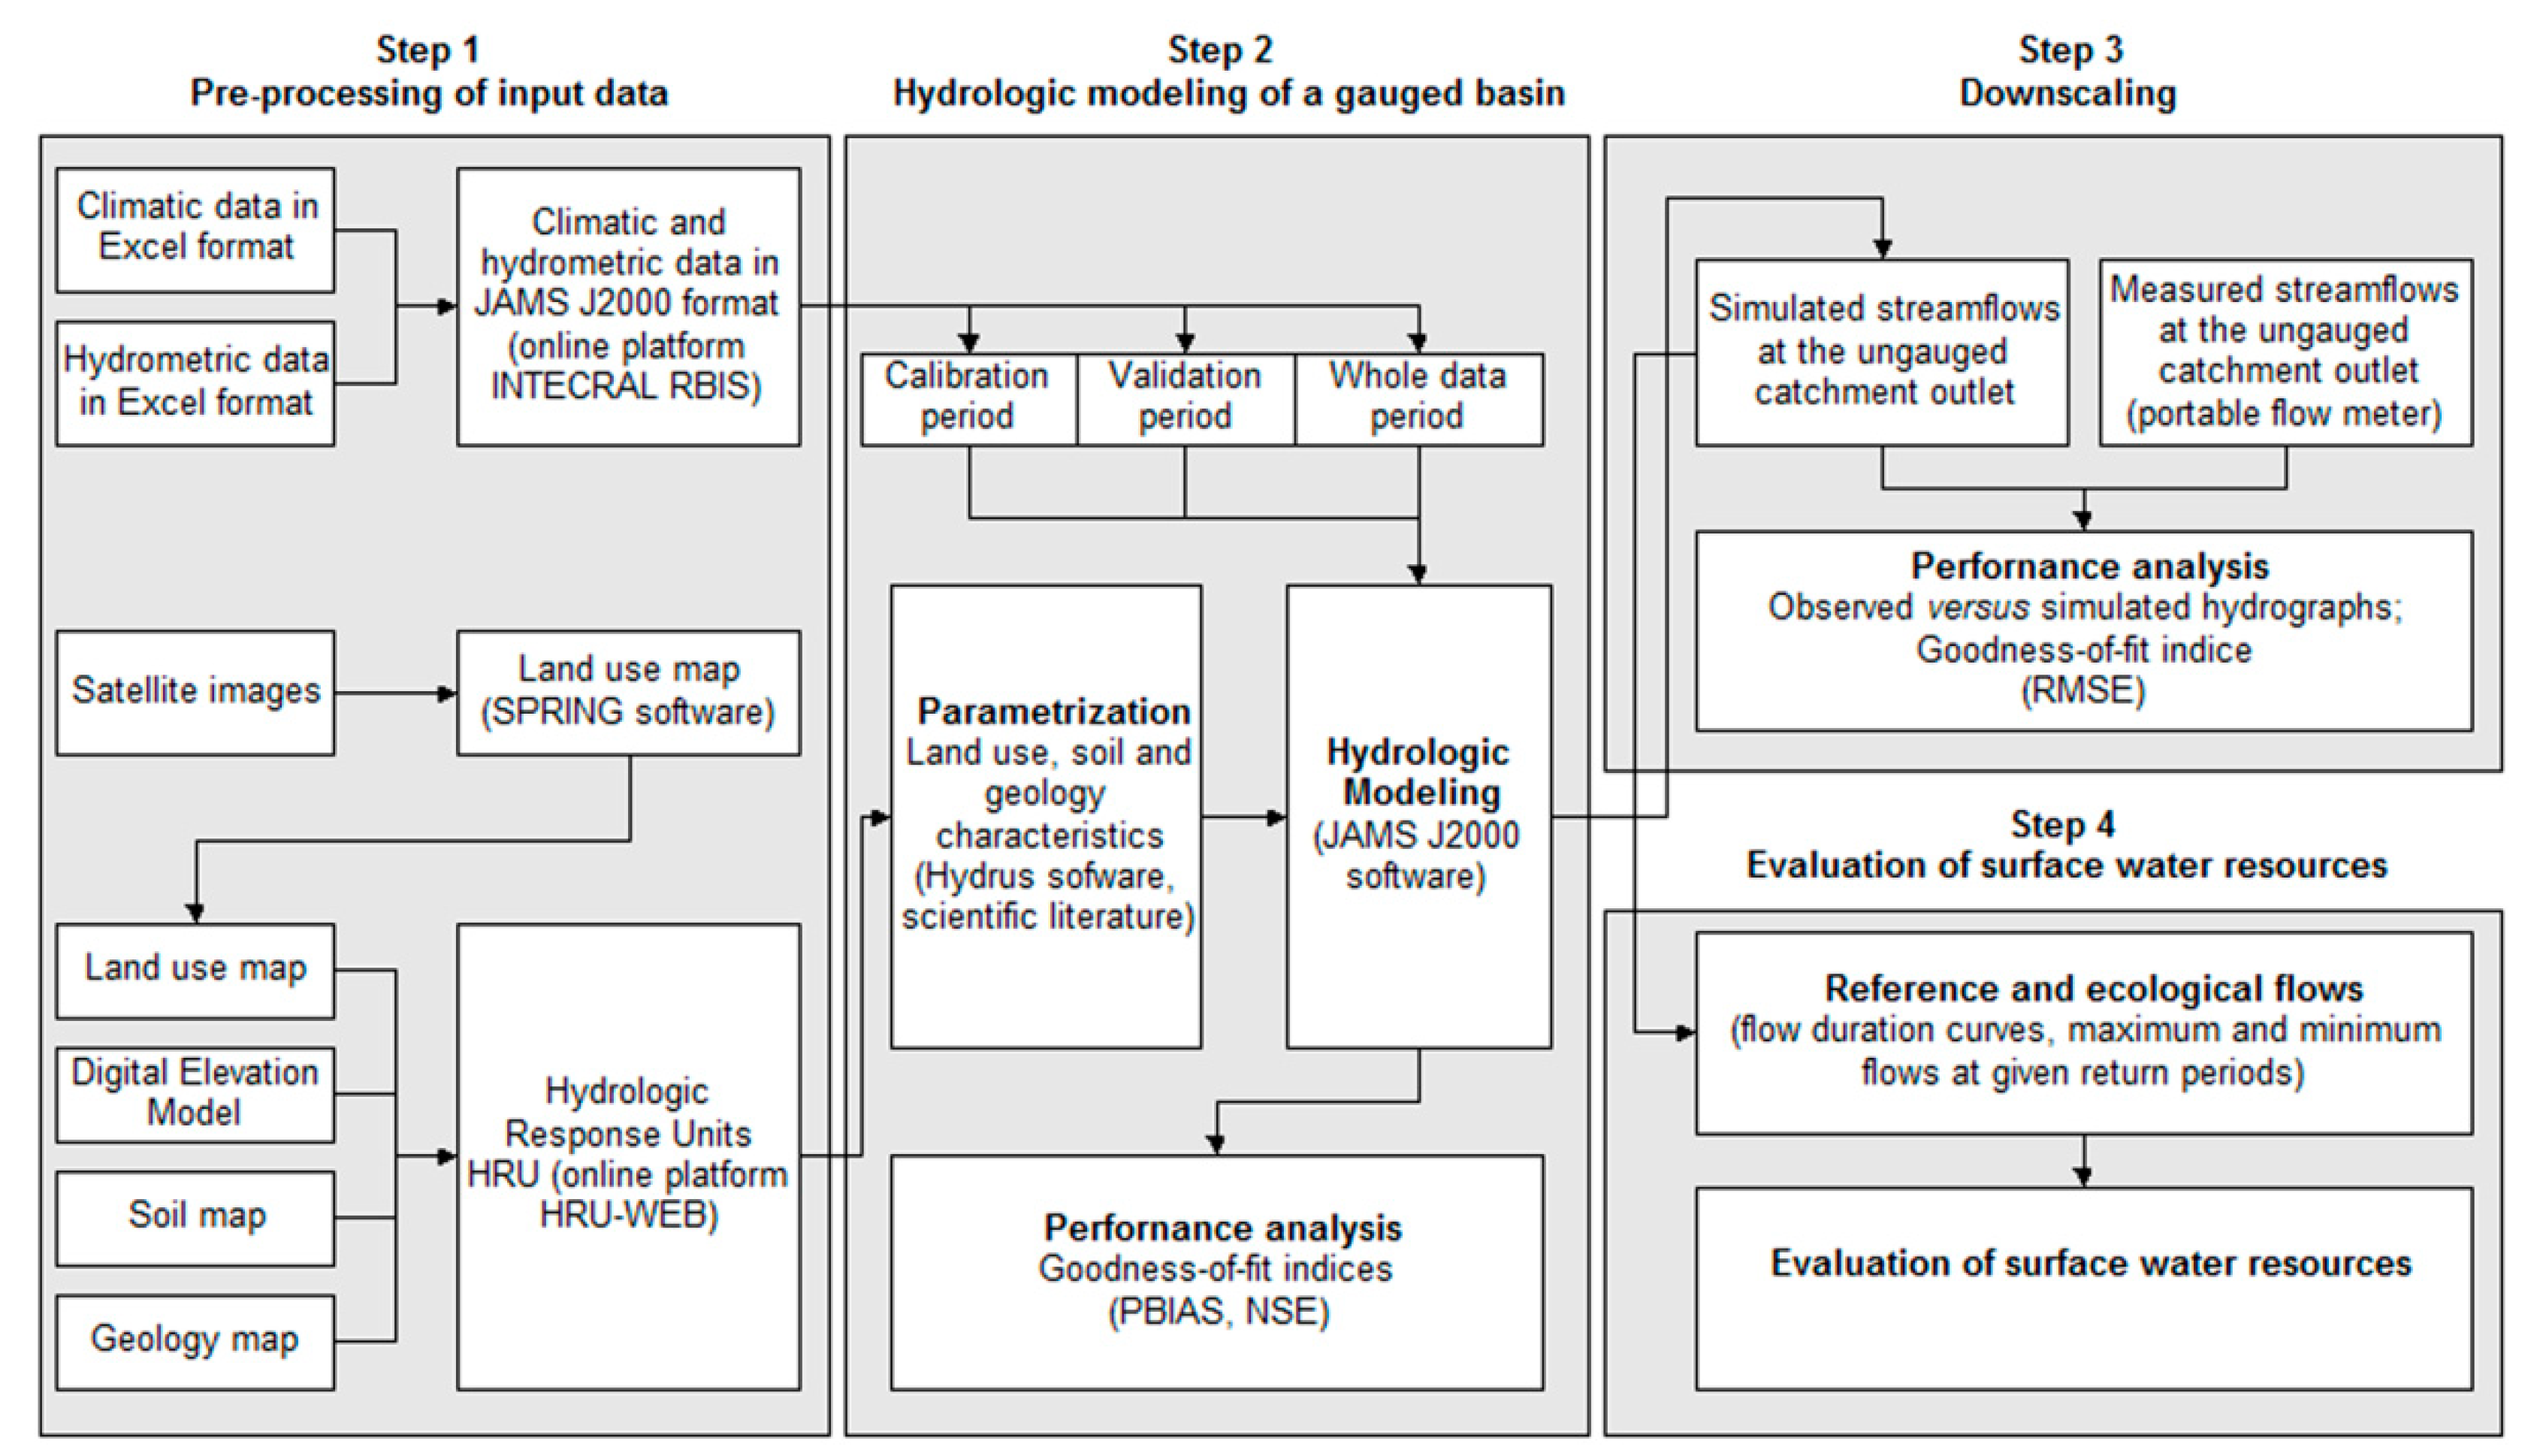
The hydrologic modeling was developed in the following four main steps (Figure 5): (1) pre-processing of climatic, stream flow, and cartographic data, followed by delineation of hydrologic response units as detailed below, based on the overlay analysis of relief, soils, and land use maps. The data records comprised the 2003–2016 period; (2) hydrologic modeling of a catchment monitored for stream discharge, namely a sub-basin of Jequitiba River basin monitored at the hydrometric station 41410000. The modeling was based on the JAMS J2000 framework developed by Krause [64] and comprehended a calibration (2003–2011) and a validation (2012–2016) period. This step was preceded by parameterization of input data and followed by the performance analysis of calibrated models based on goodness-of-fit indices; (3) “Downscaling” of stream flow discharges to the scale of an ungauged catchment enclosed in the monitored sub-basin, namely the Marinheiro catchment (study area). The “downscaling” was based on a second run of JAMS J2000, keeping the previous parameterization but adjusting the hydrologic analysis to the area, associated hydrologic response units, and climatic characterization of the Marinheiro catchment. The “downscaling” step was validated through comparison of discharge rates simulated by the JAMS J2000 framework and rates assessed in the field at the catchment outlet using a portable flow meter, as well as on the basis of a goodness-of-fit index; (4) Evaluation of reference and ecological stream flows aiming the assessment of surface water resources within the Marinheiro catchment. The four steps are detailed in the next paragraphs.
In the first step, the variables precipitation, temperature, relative humidity, hours of sunshine, wind speed, and daily stream flow data, compiled from the weather and hydrometric stations, were organized in a series of Excel spreadsheets, namely listed in ascending order of time. In turn, these spreadsheets were submitted to the online platform INTECRAL RBIS—river Basin Information System (http://leutra.geogr.uni-jena.de/intecralRBIS)—developed by Zander and Kralisch [65], for the conversion of the Excel spreadsheets into files in the specific format of the JAMS J2000 framework.
The cartographic data were cropped to the area of interest and verified for geometric and geographic consistency. In addition, the satellite images were submitted to supervised classification of land use or cover using the SPRING software. The classification comprised classes for cultivated area, water bodies, pastures, forest and exposed soil.
The online platform HRU-WEB (http://intecral.uni-jena.de/hruweb-qs/) was used to delineate the homogeneous hydrologic response units (HRUs). The HRUs are used as modeling entities that have the same pedological, lithological, topographical, and land use/land cover characterizations and are heterogeneous from each other. They are connected by a topological routing scheme [66]. The lateral water flow is simulated allowing a fully explicit spatial discretization of hydrologic response within the modeled catchment. However, the delineation of HRUs may not account for karst heterogeneity. Nevertheless, the model can be calibrated so that the observed and modeled stream flows match well. This HRU-WEB platform is embedded with tools to intersect the digital elevation model with soil, geology and land use and cover maps producing the HRUs as output. Each HRU holds a specific identification number, centroid coordinates, and connection codes to adjacent HRUs or specific water lines [67].
In the second step, the JAMS J2000 framework model was applied to simulate hydrological processes at the scale of a sub-basin of the Jequitiba River basin located upstream of hydrometric station 41410000, which encloses the Marinheiro catchment. The J2000 is a process-based spatially explicit hydrological model, which simulates eco-hydrological processes on the river basin scale. The method is a part of a modular and object-oriented modeling system called JAMS. Altogether, the JAMS J2000 framework contains different environmental models and a plethora of components to create custom tailored models for different research questions. In addition, JAMS possesses modules for data preparation, analysis, and visualization. The full inventory of hydrologic modules used in this study is listed in Appendix A. It is beyond the scope of this paper to describe them all in detail, especially for their mechanics. Readers are invited to consult the original works.
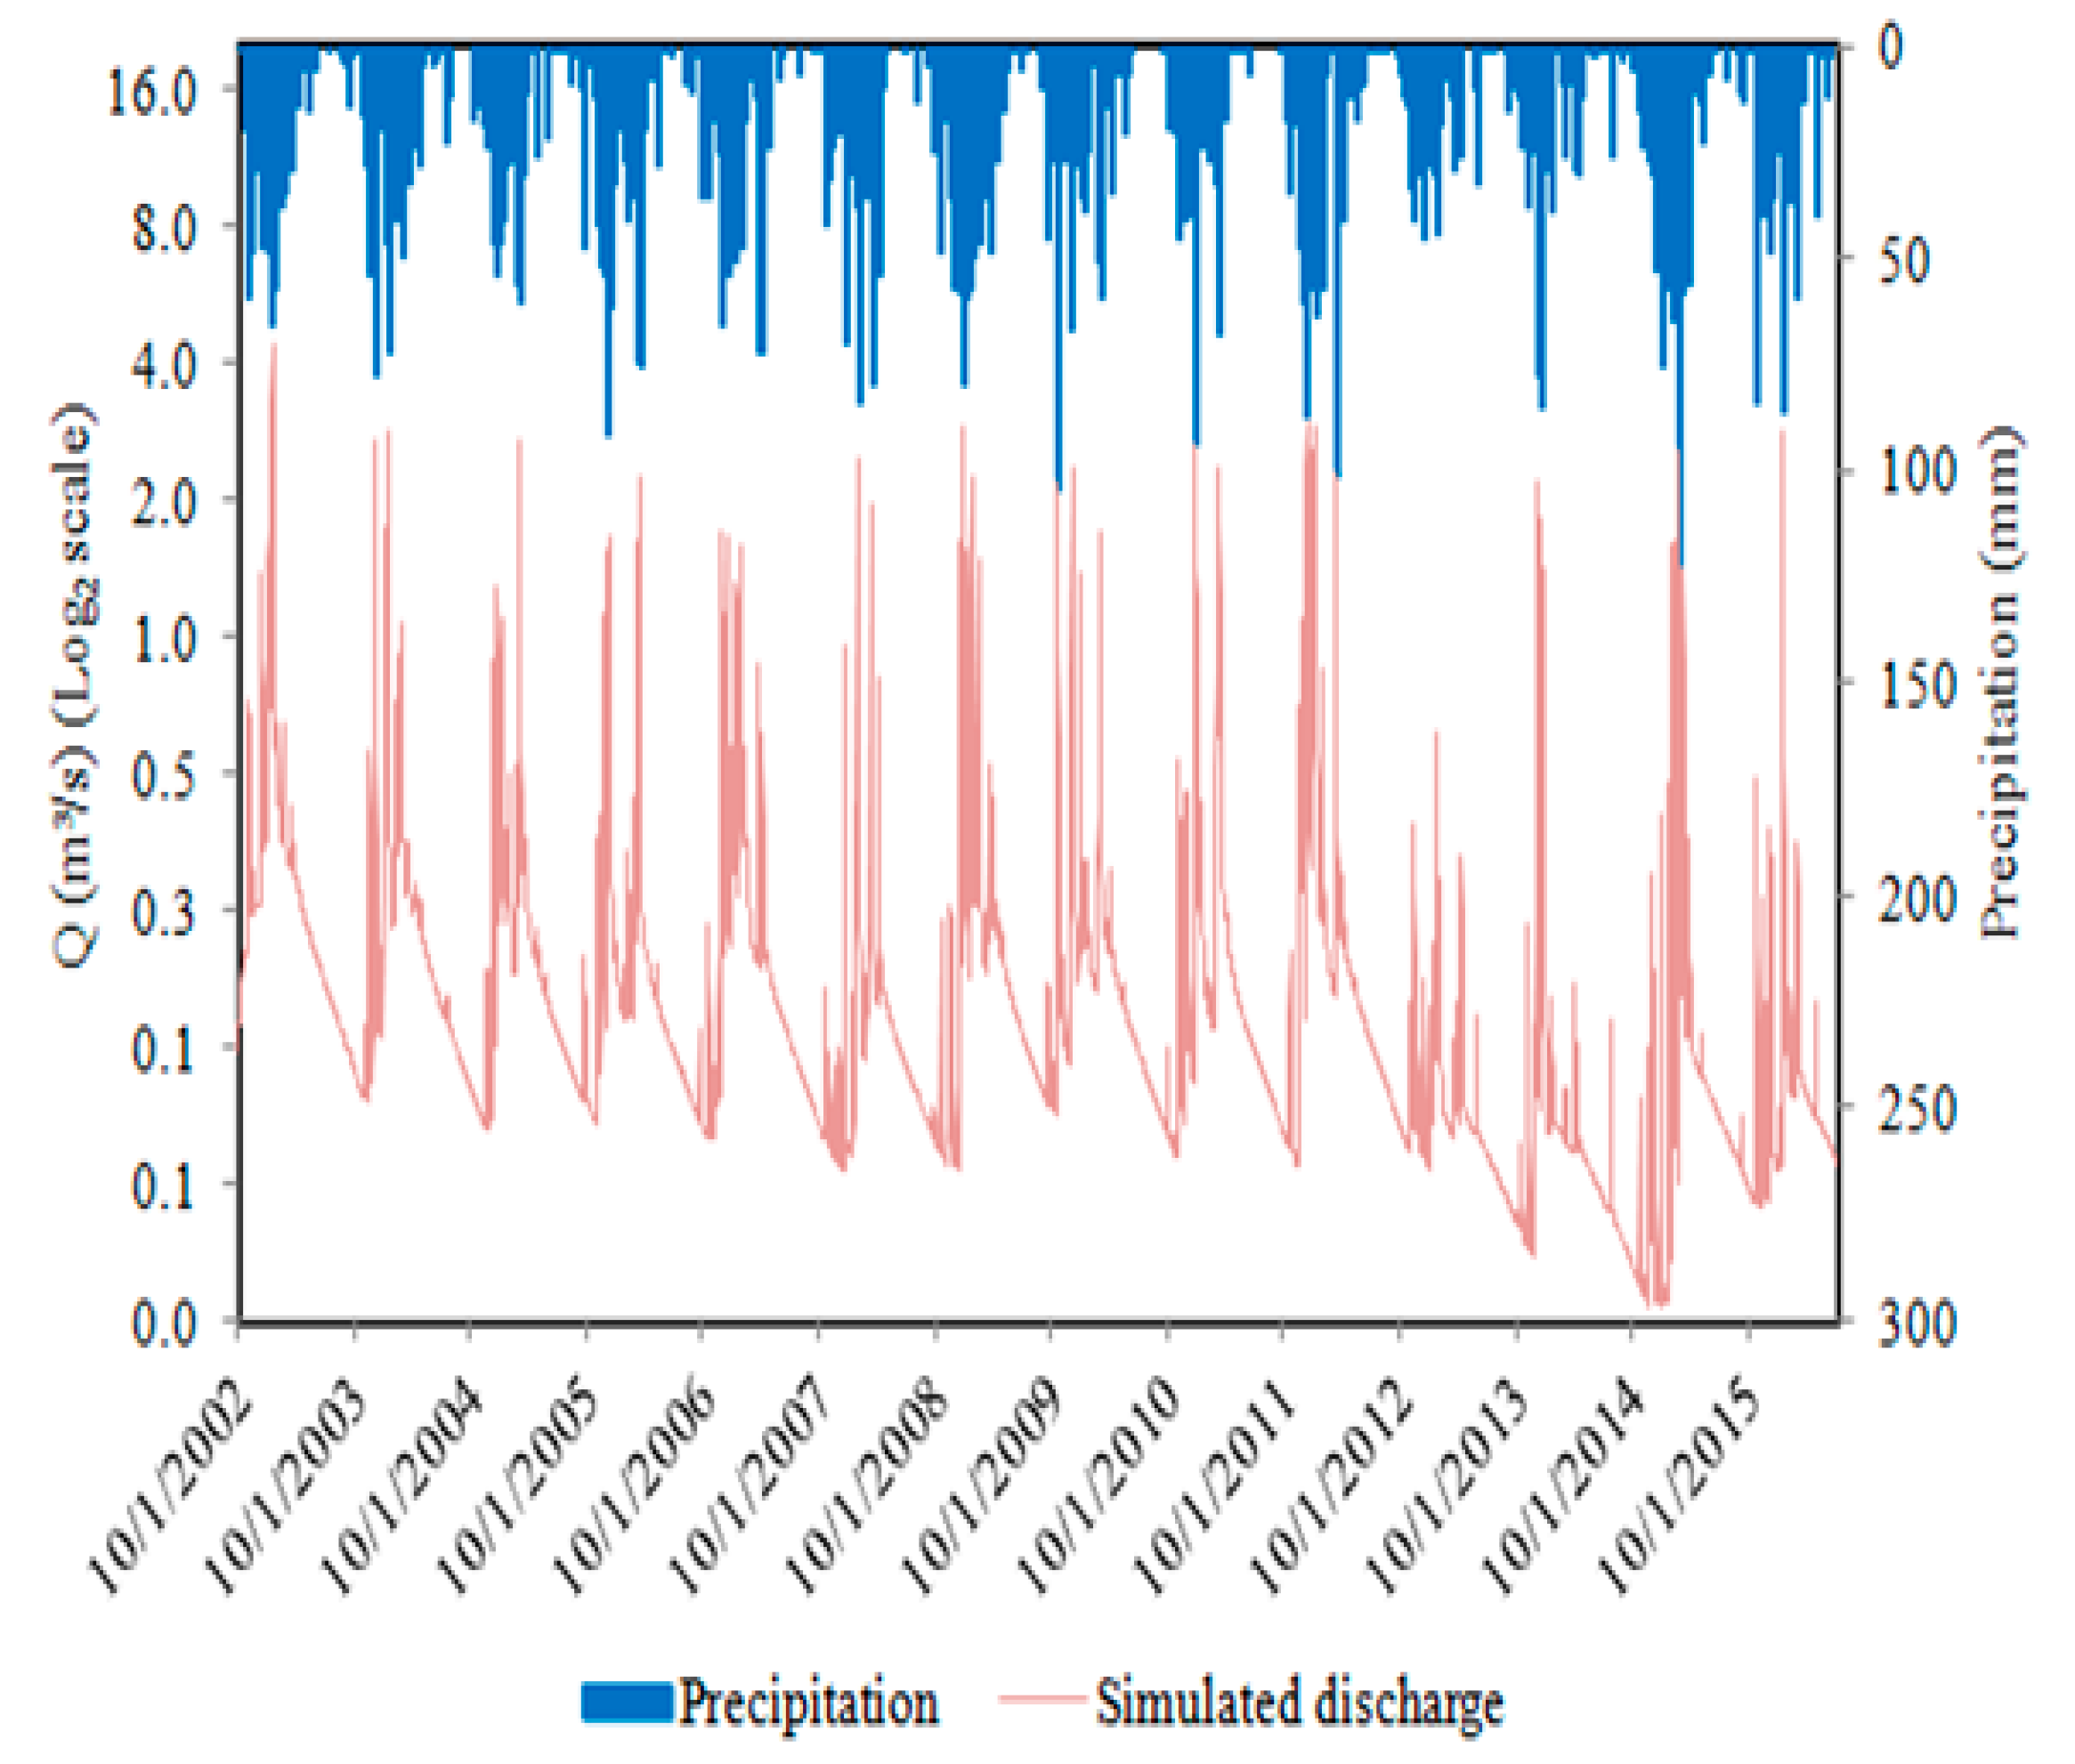
The JAMS J2000 framework simulated discharge rates, on a daily time step, between the calendar years 2003 and 2016. Using water balances and routing algorithms, the model also simulated flow components (surface flow, percolation in soil layers, shallow and deep underground flow). The simulated discharge rates were compared with the homologous rates measured at the hydrometric station for the sake of calibration and validation. Calibration encompassed the 2003–2011 period while validation the 2012–2016 period. Besides the measured discharge rates, other parameters were used in the hydrologic modeling, which are listed in Table A2, Table A3 and Table A4 of Appendix B. These parameters were processed in the various JAMS J2000 modules (Appendix A), which were run until optimized values (calibrated) were obtained. The calibration procedure was based on the NSIN II algorithm (Genetic Multi-objective II) with daily time step, while adopting 5000 iterations as the stopping rule [68]. The calibrated parameters are indicated in Appendix C. Following the calibration procedure, the hydrological model was tested for performance through assessment of goodness-of-fit indices (a) percentage of bias (PBIAS) [69] and (b) Nash-Sutcliffe (NSE) efficiency coefficient [70]. The performance intervals are provided as Appendix D. According to Gupta et al. [69], the PBIAS estimates the percentage trend of simulated data to be higher or lower than the observed data and can be described by the following equation:
P B I A S =   [ t = 1 n ( y i o i ) t = 1 n o i ] ×   100
where PBIAS is the percentage of bias (%), yi is the simulated flow (m3 s−1), and oi is the observed flow (m3 s−1). A PBIAS = 0 occurs for a hydrological model with optimal performance. Positive or negative values indicate, respectively, that the model overestimates or underestimates the simulated flows. The NSE and LNSE coefficients are equated as follows [70]:
N S E = 1 i = 1 n ( o i y i ) 2 i = 1 n ( o i   O m e d ) 2
L N S E = 1 i = 1 n ( l n o i l n y i ) 2 i = 1 n ( l n o i   l n O m e d ) 2
where “ln” represents the natural logarithm and oi, omed, yi, and ymed represent, respectively, the observed flow, the average observed flow, the simulated flow, and the average simulated flow (m3 s−1). The values of NSE and LNSE (dimensionless) can vary from –∞ to 1. The closer to 1, the greater the adjustment between the simulated and observed values. Results below 0 indicate that the mean observed values are more representative than the values predicted by the model.
In the third step, the calibrated stream flows (2003–2016 series) were “downscaled” to the Marinheiro catchment scale and estimated at the corresponding outlet. To accomplish the “downscaling,” the JAMS J2000 framework was run using the previously calibrated parameters (Appendix C) and the HRUs enclosed in the Marinheiro catchment. Then, the discharge rates estimated at the Marinheiro catchment’s outlet using the JAMS J2000 framework were compared with homologous rates estimated on the basis of flow velocities and water column heights, measured with a portable flow meter in the period June of 2015 and February of 2018 (142 evaluations).
Q = A v
where Q (m3 s−1) is the discharge rate, A (m2) is the wet area of a circular stream section and v (m s−1) is the measured flow velocity. The value of A was estimated as follows:
A =   1 8 ( θ s e n   ( θ ) )   D 2
with
θ = 2   c o s 1 ( 1   2 h D )
where h (m) is the water column height measured at the stream section’s center, while D (m) and θ (radians) are the stream section’s diameter and the angle between the stream section central point and the stream water surface, respectively.
The performance of “downscaling” was checked through comparison of measured and simulated hydrographs and calculation of the RMSE estimator.
R M S E =   i = 1 n ( O i   E i ) 2 n 1
where Oi and Ei represent the observed (measured Q) and estimated (with JAMS J2000 framework) values of a target variable, while n represents the number of measurements and corresponding estimations (142 in the present case).
In the fourth (and last) step, reference stream flows were evaluated within the Marinheiro catchment, based on the simulated series of discharge (JAMS J2000 framework, period 2003–2016). A reference stream flow launches the upper limit of water uses in a water course. According to Harris et al. [71], the legal application of a reference flow favors the protection of rivers, because the grants for stream water diversion in that context are based on low risk base flows. However, the setup of reference flows is also an obstacle to the implementation of a grant system [72]. The most common reference values are [73] Q7,10, which is the minimum flow of seven days duration and 10 years return period, with a 10% risk of not being reached, and Q90, which corresponds to a flow with 90% probability of being exceeded in time. They are both seen as ecological flows, meaning that any granted stream water diversion needs to permanently ensure these or larger flows in the target river [74,75]. In Brazil, states have adopted different criteria for setting up reference flows for granting but did not present justifications for the adoption of specific values. In Minas Gerais state, the Mining Institute of Water Management (IGAM; http://www.igam.mg.gov.br/) defined threshold values for the Marinheiro catchment, namely Q7,10 = 0.029 m3 s−1 and Q90 = 0.075 m3 s−1. The comparison of IGAM values with counterparts determined by the JAMS J2000 framework represents additional performance criterion.
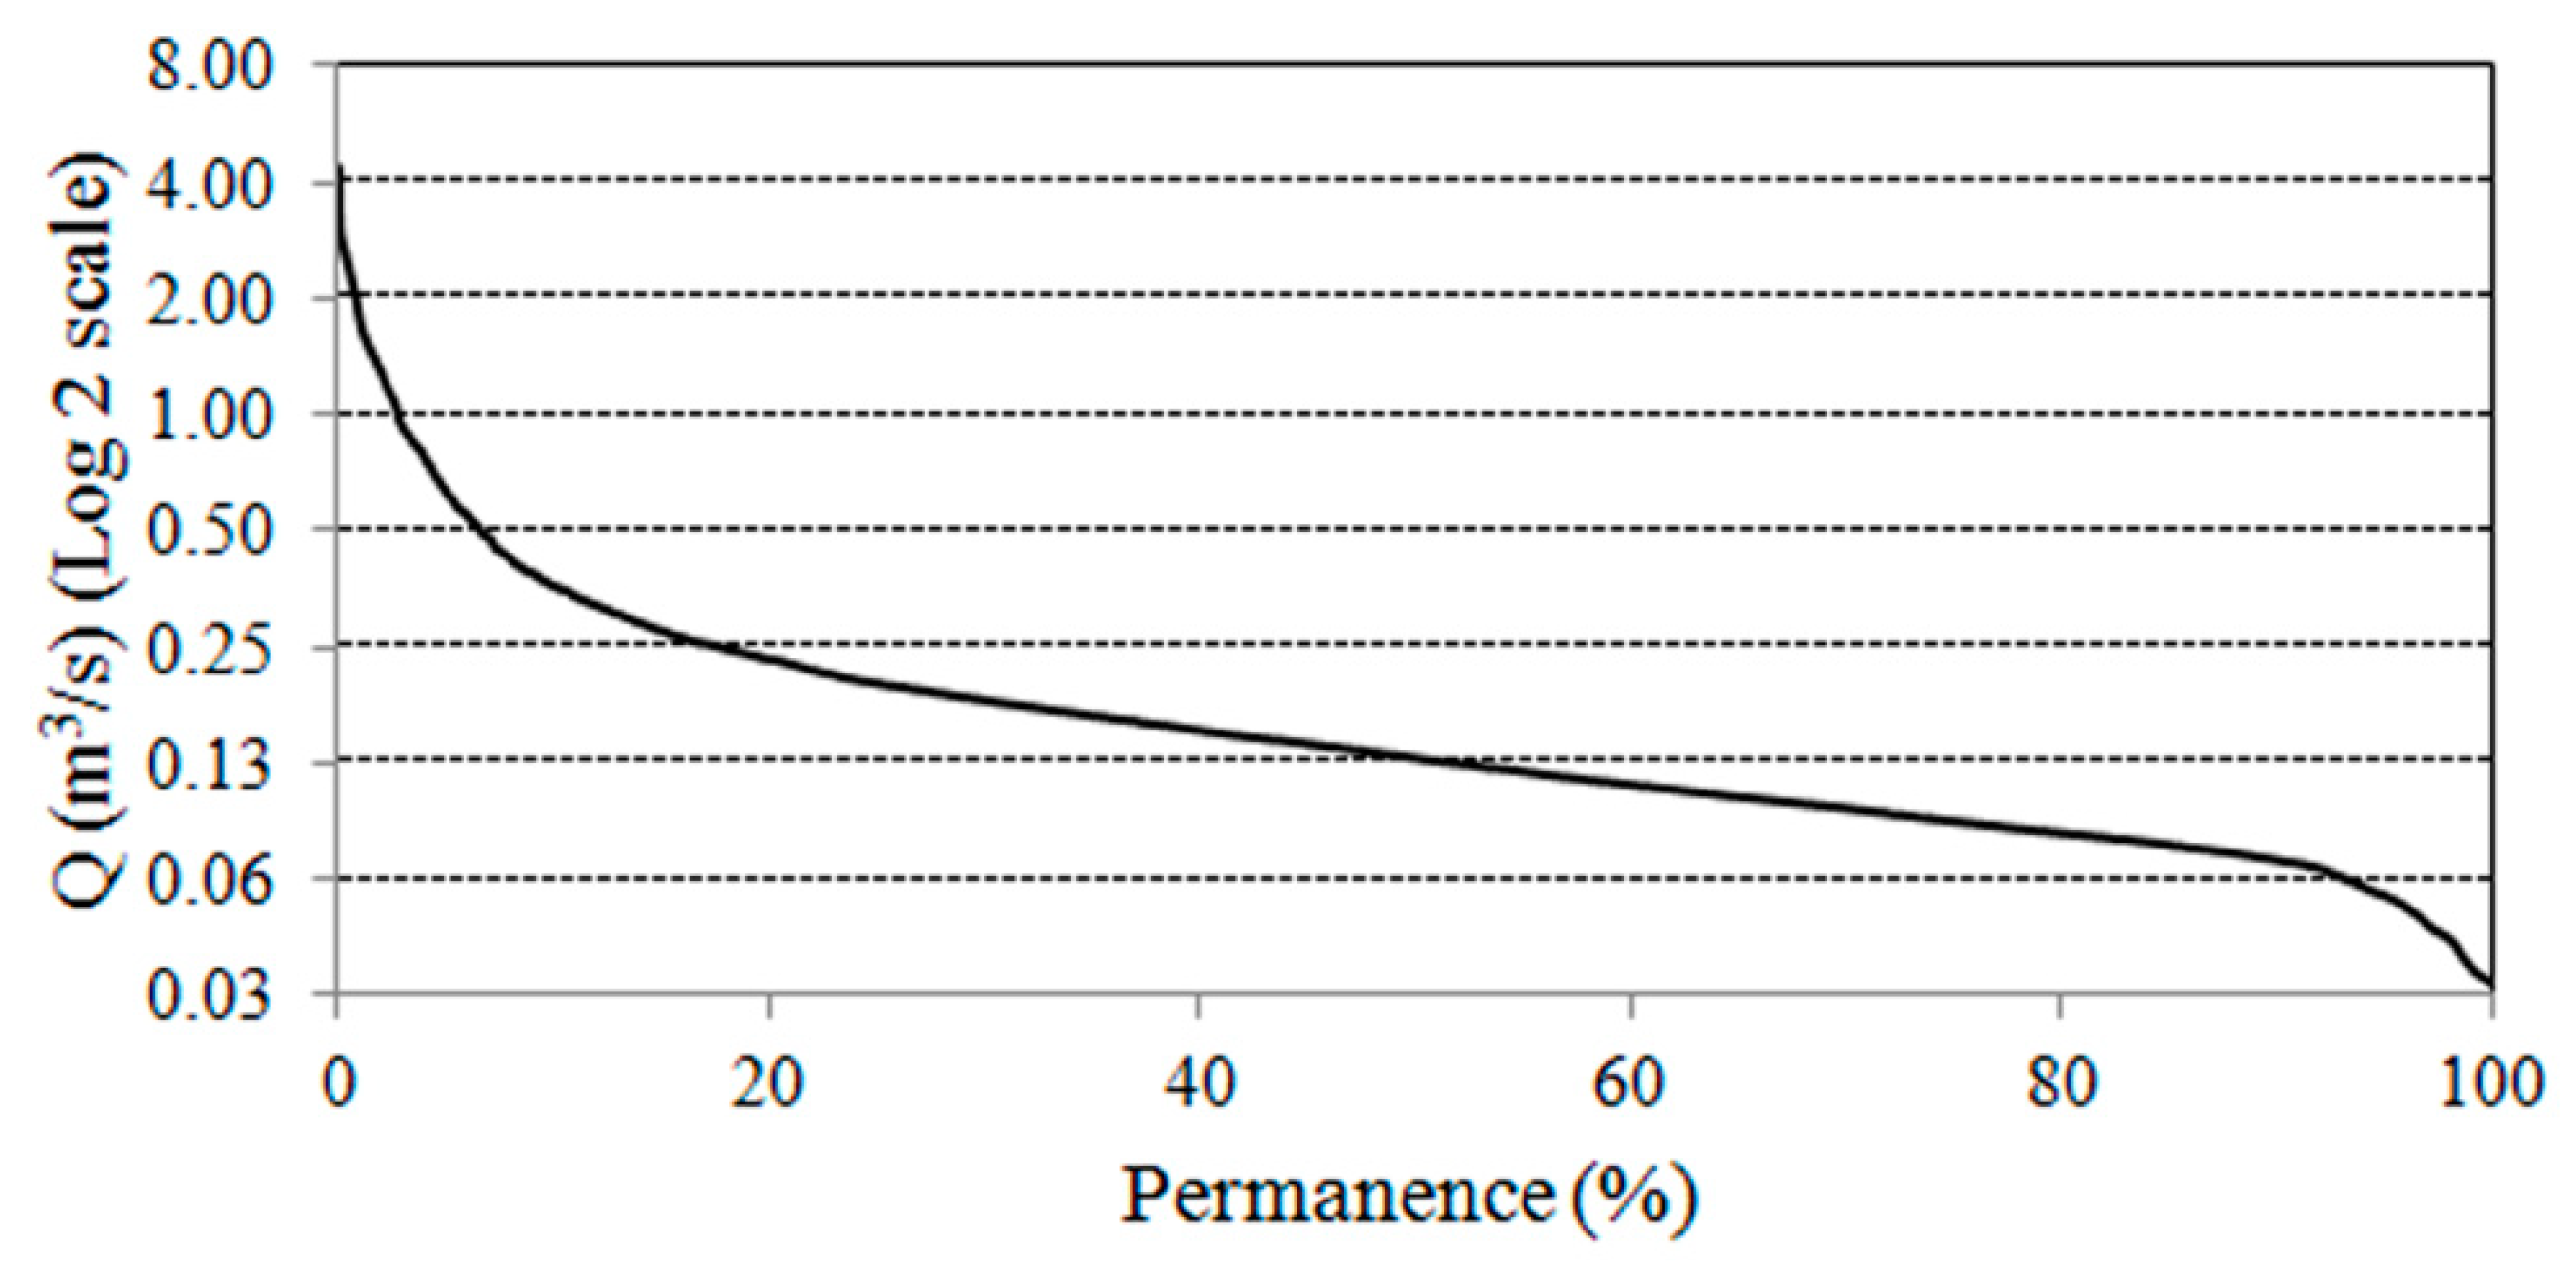
Besides the use in model performance assessment, the reference stream flows were used in the evaluation of water resources aiming the proposed conjunctive use of karst groundwater and surface water in the supply to Sete Lagoas town. Their calculation involved the definition of a flow duration curve for the Marinheiro stream that was based on a probabilistic model [76,77],
p i   = i n + 1
where pi is the probability of reaching or exceeding a stream flow, i is the order of the ith sorted flow (descending order), and 
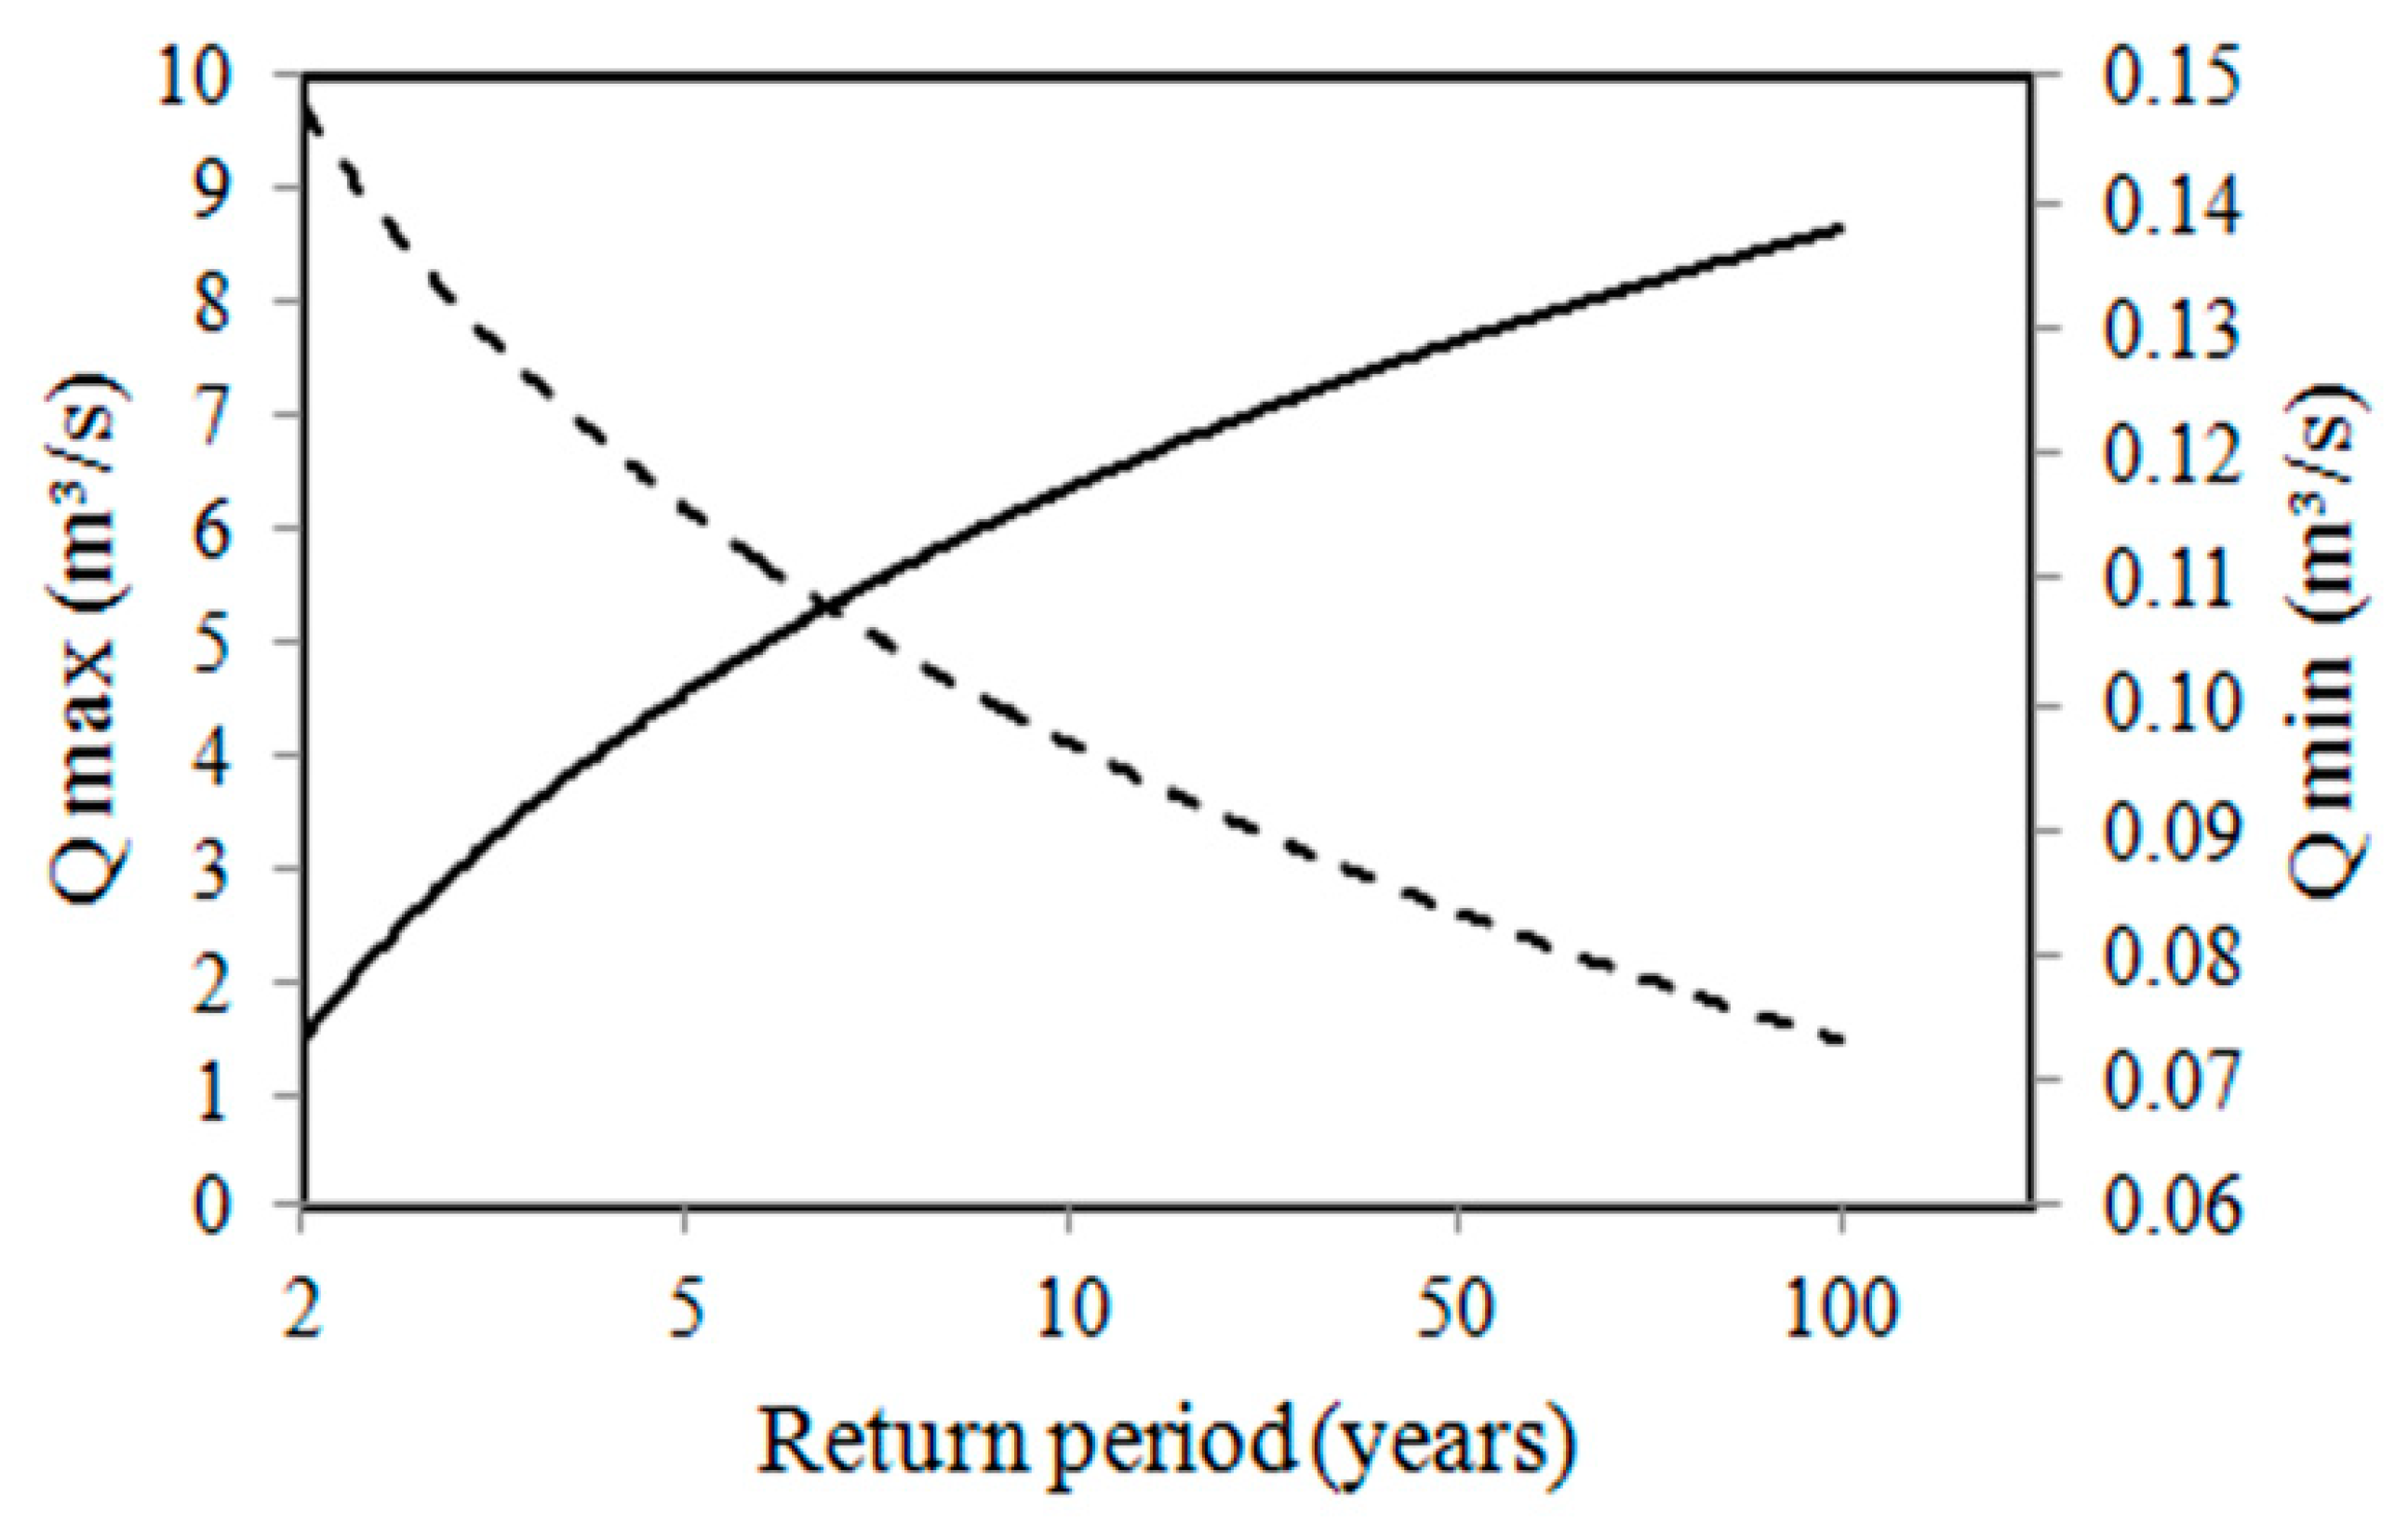
n is the number of ordered data. It also involved the definition of maximum and minimum flow values at different return periods (2, 5, 10, 50, and 100 years) using the log-normal probability distribution [78].

3. Results

The modeled sub-basin (Step 2; Figure 5) of Jequitibá River basin is located upstream of hydrometric station 41.410000. This sub-basin is represented in Figure 3 over the topographic, geologic, soil, and land use maps and corresponds to the upper part of Jequitiba River basin. During the hydrologic modeling, the overlay analysis of these geographic data generated 22,920 hydrologic response units characterized by similar soil types, relief classes, and land uses/occupations. These attributes, together with the climate data, were submitted to 5000 iterations in JAMS J2000 modules, which returned values for specific hydrologic parameters as listed the Appendix C. The hydrologic model also returned simulated stream flows that were compared with real discharge rates from 41.410000 station. The analysis of model performance was based on the PBIAS and NSE indices. The calculated PBIAS were −9.50 (calibration period), −3.65 (validation period), and 3.80 (whole period), indicating very good performance within the whole period (see reference levels in Appendix D). As regards NSE, the homologous results were 0.58, 0.67, and 0.64, indicating good to fair performance.
The spatial distribution of flow components is displayed in Figure 6. It is clear from this figure that direct flows dominate in the northwestern sector of the modeled sub-catchment where the Sete Lagoas town is located. This is obviously explained by surface waterproofing in this urban area. Concomitantly, the other flow components are lower in this sector, especially the deep groundwater flow. In the Marinheiro catchment, the flow components are, on average, direct flow (DF) = 36.95 mm year−1, percolation in soil layer (S) = 69.06 mm year−1, GF (upper) underground flow in the upper aquifer layer (GF) (upper) = 49.32 mm year−1, and underground flow in the lower aquifer layer (GF) (lower) = 17.3 mm year−1. If the underground components S, GF (upper), and GF (lower) are summed and converted in the m3 ha−1 year−1 scale, the result (1356.8 m3 ha−1 year−1) is similar to the recharge estimated by Monteiro et al. [37] (1420 m3 ha−1 year−1).
The stream flows at the outlet of Marinheiro catchment were obtained through “downscaling” of JAMS J2000 flows estimated at the 41.410000 station (Step 3). The results are illustrated in the hydrograph of Figure 7. In the studied period, the daily average values of precipitation and discharge were 4.02 mm and 0.21 m3 s−1, respectively. When monthly averages were compiled from the hydrograph and compared with the homologous values assessed in the field with the portable flow meter, a fair approximation was observed between the two sets of values (Table 2). In the months of April to November, the simulated flows were lower than the observed flows. Conversely, in the rainy season the simulated flows were larger than the flows estimated in the field. The differences were larger in the months of January and March, indicating a slight overestimation of the simulated flows in these months. In the other months, the simulated flows approached the observed flows, especially during the dry period. Overall, the calculated RMSE index was 0.07 m3 s−1, which is indication of an acceptable “downscaling.” Similar values of RMSE in hydrological models that presented good performance can be consulted in the works of Monte et al. [79] and Machado et al. [80].
The flow duration curve of Marinheiro catchment is illustrated in Figure 8. The figure shows that the flow was equal to or greater than 0.06 m3 s−1 (base flow) in 90% of the time and equal to or greater than 0.36 m3 s−1 (flood flows) in 10% of the time. The marked difference between flood flows and base flows may indicate low capacity to maintain the volume of water that is drained into the stream bed during the year, compromising the supply of water in the driest months unless the stream water is stored in a dam reservoir. Moreover, this low storage capacity can be explained both by the lithologic characteristics in which the river basin is located (karst) and by the abstractions that can occur in the watercourse. The minimum and maximum flows simulated for the Marinheiro catchment at various return periods are plotted in Figure 9. The maximum flows increase from 2.26 to 9.54 m3 s−1 for increasing return periods (2 to 100 years). The minimum flows decrease from 0.14 to 0.06 m3 s−1 for the same periods. The calculated ecological flows were Q7,10 = 0.045 m3 s−1 and Q90 = 0.071 m3 s−1. These values were relatively close to the IGAM’s values (Q7,10 = 0.029 m3 s−1 and Q90 = 0.075 m3 s−1), especially the Q90.

4. Discussion

The modeling of the Jequitiba River basin and the Marinheiro catchment based on the stepwise workflow of Figure 5 proved efficient, given the close match between simulated and measured stream flow discharges (Table 2) and generally good performance indicators (PBIAS, NSE, RMSE). The approximation between ecological indicators Q7,10 and Q90, derived from the hydrologic model and by the public institution IGAM, is also an indication of efficient modeling and robust modeling results. This was a key step and provides confidence in the interpretation and comments to follow.
In 2008, the ca. 220,000 inhabitants of Sete Lagoas were consuming approximately 200 L habitant−1 day−1 of karst aquifer water pumped from 94 drilled wells at an average rate of 7.8 L s−1 for 16 h every day [29,30]. This represented an annual abstraction of approximately 15.5 hm3 of groundwater. Based on the hydrologic modeling, the annual groundwater resources (Figure 6) within the Sete Lagoas karst (14.4% of the modeled catchment) represented in the 2003–2016 period 6.3 hm3 year−1. The difference between availability and demand is therefore negative and approached –9.2 hm3 year−1 in 2008. In fact, this difference has been negative for a long time and was the reason for the development of systemic water table declines and suffosional sinkholes. The duration curve of the Marinheiro catchment indicates that base flows are permanently (90% of the time) equal or greater than 0.06 m3 s−1 (1.89 hm3 year−1). These flows are ecologic and therefore not grantable for uses such as public water supply. However, the flows above 0.06 m3 s−1 can be considered for this use. For example, flows are equal to or larger than 0.13 m3 s−1 for six months (Figure 8) and even larger for shorter periods of time. The relationship between flow and duration expressed in Figure 8 assumes the free flow of stream water. If a small dam or weir is installed in the water course, then the durations can be extended longer, namely one year, because the stream water is kept in the reservoir. In that case, the average flow c (0.21 m3 s−1) can be a good proxy for a permanent flow. The difference between this value and the ecologic flow represents 4.73 hm3 year−1 of quality water that could be proposed for the public water supply in the context of conjunctive water resources management involving groundwater from the karst and surface water from the Marinheiro catchment. This conjunctive water resources management is suggested for other regions [18,81,82,83,84,85] and could help reduce pumping in the Sete Lagoas drilled wells to mitigate water table decline and suffosional sinkhole formation, as proposed by Galvão [31]. It is worth noting that the proposed discharge rate (0.21 m3 s−1) has a return period <2 years (Figure 9) and therefore is suited for water planning. We recall, however, the well-known limitations of return period assessments and the risk of failure of water resources evaluations based on this hydrologic indicator [86,87].
According to Monteiro et al. [37], recharge in the Marinheiro catchment approaches 1420 m3 ha−1 year–1 (142 mm year−1). This recharge refills the Archean basement (30% of the catchment) but mostly the karst aquifer (70%), representing an input of 1.47 hm3 year−1 of quality water to the karst aquifer. It can be considered a high value, when compared with a range of values determined by Galvão [88] within the Serra de Santa Helena Environmental Protection Area next to the urbanized area of Sete Lagoas. The creation of a dam reservoir in the Marinheiro catchment could increase aquifer recharge to even larger values and hence improve productivity of boreholes downward. In a study based on stable isotopes, Galvão [89] related groundwater origin directly to local precipitation, with a limited recharge period, and locally receiving surface water contributions. It is therefore acceptable to expect the possibility of local recharge from a dam reservoir and to assume that recharge could be extended in time with the presence of that infrastructure. Studies all over the globe claim recharge improvements triggered by dam installation. For example, a study in AlKhod, Oman [90], claimed that controlled releases of water captured by a dam optimized water percolation and enhanced artificial recharge, which almost doubled in a period of eight years. Many other studies refer stream damming as measure to manage aquifer recharge [91,92], while the problem has been addressed from multiple stand points. For example, in a study developed in Ranchi (India), Mahto studied the feasibility of artificial groundwater recharge structures for urban and rural environment, using geospatial technology [93]. Other authors compared recharge improvements obtained with single dams and cascades of dams (check dams) [94]. The next step would be to look at the Marinheiro catchment as an opportunity to manage recharge expecting an improvement of hydraulic heads around Sete Lagoas.
From a practical standpoint, the modeling results confirmed the ability of the Marinheiro catchment to be used as source of quality surface water to the municipality of Sete Lagoas in the context of conjunctive water resources management. More importantly, the present research proved the efficiency of the modeling of ungauged catchments. Usually, the hydrologic modeling of gauged basins can be robustly validated with measured stream flows, but the scarcity of monitoring stations hampers validation of hydrologic models in headwater catchments. In the present study, a stepwise approach was implemented whereby a gauged basin is modeled for stream flow in a process involving calibration of hydraulic parameters and validation of simulated stream flows with measured counterparts. Subsequently, the calibrated parameters were used to model the stream flows of an enclosed sub-basin, in a process referred to as “downscaling.” Finally, the “downscaled” stream flows were validated in the field by measurements of flow velocity and water column weight. To our knowledge, this sequential approach involving a double validation of modeling results is uncommon and can be viewed as relevant improvement of ungauged catchment hydrologic modeling.

5. Conclusions

A novel hydrologic approach was accomplished through a double run of the JAMS J2000 framework, whereby calibrated hydraulic parameters and simulated stream records were obtained at the scale of Jequitiba River basin (first run), and then the simulated flows were adjusted to the scale of the Marinheiro catchment (second run), which is a Jequitiba tributary. The Jequitiba basin also encloses the town of Sete Lagoas (state of Minas Gerais, Brazil), which has for decades experienced severe problems of water table declines and depletion of groundwater resources related to overexploitation of a karst aquifer used for public supply. The double run of JAMS J2000 was accompanied by a double validation of modeled stream flows. In the first run, the simulated stream flows could be validated by comparison with stream flows measured in a hydrometric station installed in a section of the Jequitiba section for years. The Marinheiro catchment is not gauged, and therefore that type of validation was not possible. Instead, the simulated (downscaled) stream flows were validated by discharge rates assessed in the field through measurements of flow velocity and water column heights. Having finished the modeling, flow duration and return periods of stream flow were assessed using probabilistic models. Altogether, the possibility to deliver 4.73 hm3 year−1 of quality surface water to Sete Lagoas to alleviate the pressure over the karst aquifer was considered. This water would be stored in a small dam that would also improve aquifer recharge

Author Contributions

Conceptualization, H.H.C.d.S., F.A.L.P., and A.M.d.C.; methodology, H.H.C.d.S., A.K. and A.M.d.C.; software, H.H.C.d.S. and A.K., validation, H.H.C.d.S. and F.A.L.P.; resources, A.M.d.C.; writing—original draft preparation, H.H.C.d.S.; writing—review and editing, A.M.d.C., L.F.S.F., and F.A.L.P.; supervision, A.M.d.C.; funding acquisition, A.M.d.C.

Funding

For authors integrated in the CITAB research center, this study was further financed by the FEDER/COMPETE/POCI—Operational Competitiveness and Internationalization Programme, under Project POCI-01-0145-FEDER-006958, and by National Funds of FCT—Portuguese Foundation for Science and Technology, under project UID/AGR/04033/2019. For the author integrated in the CQVR, the research was additionally supported by National Funds of FCT—Portuguese Foundation for Science and Technology, under project UID/QUI/00616/2019.

Conflicts of Interest

The authors declare no conflict of interest. The funders had no role in the design of the study; in the collection, analyses, or interpretation of data; in the writing of the manuscript or in the decision to publish the results.

Appendix A

Table A1. JAMS J2000 modules used in the hydrologic modeling.
ModuleParameterDescription
Start upmFCaMultiplier of field capacity
mACaMultiplier of air capacity
initRG1Initial capacity in the upper underground reservoir
initRG2Initial capacity in the lower underground reservoir
Interceptionα, rainMaximum interception capacity of leaf area
Water in soilsoiMaxDPSMaximum storage capacity in the surface
soilPolRedPolynomial reduction factor of potential evapotranspiration
soilLinRedLinear reduction factor of potential evapotranspiration
soilMaxInf1Maximum infiltration in the April–September period
soilMaxInf2Maximum infiltration in the October–March period
soilImpGT80Relative infiltration capacity in areas with waterproofing larger than 80%
soilImpLT80Relative infiltration capacity in areas with waterproofing smaller than 80%
soilDistMPSLPSCoefficient of infiltration distribution between medium and large pores
soilDiffMPSLPSDiffusion coefficient from large to medium pores
soilOutLPSOutput coefficient from large pores
soilLatVertLPSDistribution coefficient between interflow and percolation
soilMaxPercMaximum percolation capacity
soilConcRD1Retention coefficient of surface flow
soilConcRD2Retention coefficient of interflow
GroundwatergwRG1RG2distDistribution coefficient between storage in the upper and lower groundwater reservoirs
gwRG1factDynamic flow factor in the upper reservoir
gwRG2factDynamic flow factor in the lower reservoir
gwCapRiseCapillary factor
RoutingflowRouteTATime of concentration

Appendix B

Parameterization of JAMS J2000 hydrologic model. The target watershed was the sub-basin of Jequitiba River basin located upstream hydrometric station 41410000. The modeling also holds for all enclosed catchments, namely the Marinheiro stream catchment. The parameterization of input data resorted to computer programs, research articles, and technical studies where lithologic, soil and land use properties were calculated or indicated. The selected values of all input parameters, as well as the corresponding sources of information, are listed in Table A2, Table A3 and Table A4.
Table A2. Land use and occupation parameters used in the hydrologic model.
Land Use or OccupationAlbedo (%)Superficial Resistance (s m−1)Leaf Area Index (Dimensionless)Effective Growth (m)Root Depth (dm)
Cultivated area20.070.00.61.12.0
Urbanized area16.470.00.010.00.0
Cerrado biome14.270.00.820.012.0
Water bodies4.070.00.00.00.0
Forest15.070.00.930.030.0
Bare land20.070.00.00.00.0
Reference(s)[95,96][97][98][99][97]
Table A3. Soil parameters used in the hydrologic model.
Soil TypeDepth (cm)Minimum Permeability Coefficient (mm d−1)Air Capacity (mm)Field Capacity (mm)
Red-yellow argisol170140600
Haplic cambisols2301371150
Red-yellow latossols2501381500
Tholic Litholic50113125
ReferenceHydrus 1D software (https://www.pc-progress.com)
Table A4. Lithologic parameters used in the hydrologic model.
Lithologic TypeMaximum Storage Capacity in the Upper Aquifer (mm)Maximum Storage Capacity in the Lower Aquifer (mm)Storage Coefficient in the Upper Groundwater Reservoir (d)Storage Coefficient in the lower Groundwater Reservoir (d)
Orthogneiss5090013365
Clastic sediments5080016365
Limestone70100017365
Silstone6090014365
Reference[100]

Appendix C

Table A5. Intervals and values of JAMS J2000 module parameters obtained after calibration.
ModuleParametersIntervalUnitCalibrated Value
Start upmFCa0–54.99
mACa0–54.98
initRG10–10.40
initRG20–10.72
Interceptionα, rain0–10mm5.80
Water in soilsoiMaxDPS0–10mm3.49
soilPolRed0–106.78
soilLinRed0–101.57
soilMaxInf10–200mm129.97
soilMaxInf21–200mm75.99
soilImpGT800–10.07
soilImpLT801–10.31
soilDistMPSLPS0–100.13
soilDiffMPSLPS0–100.34
soilOutLPS0–102.27
soilLatVertLPS0–100.70
soilMaxPerc0–20mm5.10
soilConcRD10–101.49
soilConcRD21–109.99
GroundwatergwRG1RG2dist0–10.31
gwRG1fact0–103.40
gwRG2fact0–101.27
gwCapRise0–10.41
RoutingflowRouteTA0–100h46.80

Appendix D

Table A6. Reference values of PBIAS and NSE and their relation to hydrologic model performance. The evaluation of performance was done separately for the calibration period (2003 to 2011), validation period (2012 to 2016), and full data period (2003 to 2016), allowing us to verify the replication of parameters.
PBIAS (%)NSEPerformance
0 a 100.75 a 1Very good
10 a 150.65 a 0.75Good
15 a 250.50 a 0.65Fair
>25<0.50Inadequate

References

  1. Kazakis, N.; Chalikakis, K.; Mazzilli, N.; Ollivier, C.; Manakos, A.; Voudouris, K. Management and research strategies of karst aquifers in Greece: Literature overview and exemplification based on hydrodynamic modelling and vulnerability assessment of a strategic karst aquifer. Sci. Total Environ. 2018, 643, 592–609. [Google Scholar] [CrossRef] [PubMed]
  2. Fleury, P.; Ladouche, B.; Conroux, Y.; Jourde, H.; Dörfliger, N. Modelling the hydrologic functions of a karst aquifer under active water management—The Lez spring. J. Hydrol. 2009, 365, 235–243. [Google Scholar] [CrossRef]
  3. Ladouche, B.; Marechal, J.-C.; Dorfliger, N. Semi-distributed lumped model of a karst system under active management. J. Hydrol. 2014, 509, 215–230. [Google Scholar] [CrossRef] [Green Version]
  4. Kemmerly, P.R. A time-distribution study of doline collapse: Framework for prediction. Environ. Geol. 1980, 3, 123–130. [Google Scholar] [CrossRef]
  5. Tihansky, A.B. Sinkholes, west-central Florida. Land Subsid. USA 1999, 1182, 121–140. [Google Scholar]
  6. Kaufmann, O.; Quinif, Y. Geohazard map of cover-collapse sinkholes in the ‘Tournaisis’ area, southern Belgium. Eng. Geol. 2002, 65, 117–124. [Google Scholar] [CrossRef]
  7. García-Moreno, I.; Mateos, R.M. Sinkholes related to discontinuous pumping: Susceptibility mapping based on geophysical studies. The case of Crestatx (Majorca, Spain). Environ. Earth Sci. 2011, 64, 523–537. [Google Scholar] [CrossRef]
  8. Doğan, U.; Yılmaz, M. Natural and induced sinkholes of the Obruk Plateau and Karapınar-Hotamış Plain, Turkey. J. Asian Earth Sci. 2011, 40, 496–508. [Google Scholar] [CrossRef]
  9. Bonneau, J.; Fletcher, T.D.; Costelloe, J.F.; Burns, M.J. Stormwater infiltration and the ‘urban karst’—A review. J. Hydrol. 2017, 552, 141–150. [Google Scholar] [CrossRef]
  10. Locatelli, L.; Mark, O.; Mikkelsen, P.S.; Arnbjerg-Nielsen, K.; Deletic, A.; Roldin, M.; Binning, P.J. Hydrologic impact of urbanization with extensive stormwater infiltration. J. Hydrol. 2017, 544, 524–537. [Google Scholar] [CrossRef] [Green Version]
  11. Kalhor, K.; Ghasemizadeh, R.; Rajic, L.; Alshawabkeh, A. Assessment of groundwater quality and remediation in karst aquifers: A review. Groundw. Sustain. Dev. 2019, 8, 104–121. [Google Scholar] [CrossRef]
  12. Ghasemizadeh, R.; Hellweger, F.; Butscher, C.; Padilla, I.; Vesper, D.; Field, M.; Alshawabkeh, A. Review: Groundwater flow and transport modeling of karst aquifers, with particular reference to the North Coast Limestone aquifer system of Puerto Rico. Hydrogeol. J. 2012, 20, 1441–1461. [Google Scholar] [CrossRef] [Green Version]
  13. Groves, C.G.; Howard, A.D. Early development of karst systems: 1. Preferential flow path enlargement under laminar flow. Water Resour. Res. 1994, 30, 2837–2846. [Google Scholar] [CrossRef]
  14. Malard, A.; Jeannin, P.-Y.; Vouillamoz, J.; Weber, E. An integrated approach for catchment delineation and conduit-network modeling in karst aquifers: Application to a site in the Swiss tabular Jura. Hydrogeol. J. 2015, 23, 1341–1357. [Google Scholar] [CrossRef]
  15. Perrin, J.; Luetscher, M. Inference of the structure of karst conduits using quantitative tracer tests and geological information: Example of the Swiss Jura. Hydrogeol. J. 2008, 16, 951–967. [Google Scholar] [CrossRef]
  16. White, E.L.; Aron, G.; White, W.B. The influence of urbanization of sinkhole development in central Pennsylvania. Environ. Geol. Water Sci. 1986, 8, 91–97. [Google Scholar] [CrossRef]
  17. Furlong, C.; Jegatheesan, J.; Currell, M.; Iyer-Raniga, U.; Khan, T.; Ball, A.S. Is the global public willing to drink recycled water? A review for researchers and practitioners. Util. Policy 2019, 56, 53–61. [Google Scholar] [CrossRef]
  18. Ross, A. Speeding the transition towards integrated groundwater and surface water management in Australia. J. Hydrol. 2018, 567, e1–e10. [Google Scholar] [CrossRef]
  19. Soares, S.; Terêncio, D.; Fernandes, L.; Machado, J.; Pacheco, F. The Potential of Small Dams for Conjunctive Water Management in Rural Municipalities. Int. J. Environ. Res. Public Health 2019, 16, 1239. [Google Scholar] [CrossRef]
  20. Křeček, J.; Haigh, M. Land use policy in headwater catchments. Land Use Policy 2019, 80, 410–414. [Google Scholar] [CrossRef]
  21. Santos, R.M.B.; Sanches Fernandes, L.F.; Moura, J.P.; Pereira, M.G.; Pacheco, F.A.L. The impact of climate change, human interference, scale and modeling uncertainties on the estimation of aquifer properties and river flow components. J. Hydrol. 2014, 519, 1297–1314. [Google Scholar] [CrossRef]
  22. Santos, R.M.B.; Sanches Fernandes, L.F.; Pereira, M.G.; Cortes, R.M.V.; Pacheco, F.A.L. Water resources planning for a river basin with recurrent wildfires. Sci. Total Environ. 2015, 526, 1–13. [Google Scholar] [CrossRef]
  23. Beven, K.J.; Kirkby, M.J. A physically based, variable contributing area model of basin hydrology/Un modèle à base physique de zone d’appel variable de l’hydrologie du bassin versant. Hydrol. Sci. Bull. 1979, 24, 43–69. [Google Scholar] [CrossRef]
  24. Abbott, M.B.; Bathurst, J.C.; Cunge, J.A.; O’Connell, P.E.; Rasmussen, J. An introduction to the European Hydrological System—Systeme Hydrologique Europeen, “SHE”, 1: History and philosophy of a physically-based, distributed modelling system. J. Hydrol. 1986, 87, 45–59. [Google Scholar] [CrossRef]
  25. Arnold, J.G.; Srinivasan, R.; Muttiah, R.S.; Williams, J.R. Large area hydrologic modeling and assessment part I: Model development. J. Am. Water Resour. Assoc. 1998, 34, 73–89. [Google Scholar] [CrossRef]
  26. Coe, M.T.; Costa, M.H.; Howard, E.A. Simulating the surface waters of the Amazon River basin: Impacts of new river geomorphic and flow parameterizations. Hydrol. Process. 2008, 22, 2542–2553. [Google Scholar] [CrossRef]
  27. Santhi, C.; Kannan, N.; Arnold, J.G.; Di Luzio, M. Spatial Calibration and Temporal Validation of Flow for Regional Scale Hydrologic Modeling. JAWRA J. Am. Water Resour. Assoc. 2008, 44, 829–846. [Google Scholar] [CrossRef]
  28. Grayson, R.B.; Moore, I.D.; McMahon, T.A. Physically based hydrologic modeling: 1. A terrain-based model for investigative purposes. Water Resour. Res. 1992, 28, 2639–2658. [Google Scholar] [CrossRef]
  29. Pessoa, P.F.P. Caracterização Hidrogeológica da Região Cárstica de Sete Lagoas-MG: Potencialidades e Riscos. MSc Thesis, São Paulo University, São Paulo, Brazil, 1996. [Google Scholar]
  30. Botelho, L.A.L.A. Gestão dos Recursos Hídricos em Sete Lagoas/MG: Uma Abordagem a Partir da Evolução Espaçotemporal da Demanda e da Captação de Agua. MSc Thesis, Federal University of Minas Gerais, Belo Horizonte, Brazil, 2008. [Google Scholar]
  31. Galvão, P.; Halihan, T.; Hirata, R. Evaluating karst geotechnical risk in the urbanized area of Sete Lagoas, Minas Gerais, Brazil. Hydrogeol. J. 2015, 23, 1499–1513. [Google Scholar] [CrossRef]
  32. Iglesias, M.; Uhlein, A. Estratigrafia do Grupo Bambuí e coberturas fanerozóicas no vale do rio São Francisco, norte de Minas Gerais. Rev. Bras. Geociências 2009, 39, 256–266. [Google Scholar] [CrossRef]
  33. CPRM/CODEMIG—Companhia de Pesquisa de Recursos Minerais/Companhia de Desenvolvimento Econômico de Minas Gerais. Mapa Geológico do Estado de Minas Gerais. Available online: www.portaldageologia.com.br (accessed on 1 October 2018).
  34. Universidade Federal De Lavras; Fundação Estadual Do Meio Ambiente De Minas Gerais. Mapa de Solos do Estado de Minas Gerais. Available online: http://www.dps.ufv.br/?page_id=742 (accessed on 1 November 2018).
  35. FBDS—Fundação Brasileira para o Desenvolvimento Sustentável. Mapeamento em Alta Resolução dos Biomas Brasileiros. Available online: http://geo.fbds.org.br/ (accessed on 1 November 2018).
  36. Batista, R.C.R. Caracterização Hidrogeológica do Entorno do Centro Nacional de Pesquisa de Milho e Sorgo (CNPMS), em Sete Lagoas, MG. MSc Thesis, Universidade Federal de Minas Gerais, Belo Horizonte, Brazil, 2009. [Google Scholar]
  37. Da Costa, A.M.; de Salis, H.H.C.; Viana, J.H.M.; Leal Pacheco, F.A. Groundwater Recharge Potential for Sustainable Water Use in Urban Areas of the Jequitiba River Basin, Brazil. Sustainability 2019, 11, 2955. [Google Scholar] [CrossRef]
  38. IBGE Sistema IBGE de Recuperação Automática (SIDRA). Available online: http://www.sidra.ibge.gov.br/bda/orcfam/default.asp?t=2&z=t&o=23&u1=1&u2=1&u3=1&u4=1&u5=1&u6=1 (accessed on 1 November 2018).
  39. UAF-NASA Alaska Satellite Facility—Making Remote-Sensing Data Accessible Since 1991. Available online: https://www.asf.alaska.edu/ (accessed on 1 November 2018).
  40. The USGS Earth Explorer (USGS). USGS EarthExplorer. Available online: http://earthexplorer.usgs.gov/ (accessed on 28 November 2018).
  41. Instituto Nacional de Meteorologia, Ministério da Agricultura, Dados Meteorológicos. Available online: http://www.inmet.gov.br/portal/ (accessed on 1 November 2018).
  42. Agência Nacional de Águas. HidroWEB: Acervo de Dados Hidrológicos. Available online: http://www.snirh.gov.br/hidroweb/publico/apresentacao.jsf (accessed on 1 November 2018).
  43. Pacheco, F.A.L.; Van der Weijden, C.H. Weathering of plagioclase across variable flow and solute transport regimes. J. Hydrol. 2012, 420–421, 46–58. [Google Scholar] [CrossRef]
  44. Pacheco, F.A.L.; Szocs, T. “Dedolomitization reactions” driven by anthropogenic activity on loessy sediments, SW Hungary. Appl. Geochem. 2006, 21, 614–631. [Google Scholar] [CrossRef]
  45. Fonseca, A.R.; Sanches Fernandes, L.F.; Fontainhas-Fernandes, A.; Monteiro, S.M.; Pacheco, F.A.L. The impact of freshwater metal concentrations on the severity of histopathological changes in fish gills: A statistical perspective. Sci. Total Environ. 2017, 599–600, 217–226. [Google Scholar] [CrossRef]
  46. Fonseca, A.R.; Sanches Fernandes, L.F.; Fontainhas-Fernandes, A.; Monteiro, S.M.; Pacheco, F.A.L. From catchment to fish: Impact of anthropogenic pressures on gill histopathology. Sci. Total Environ. 2016, 550, 972–986. [Google Scholar] [CrossRef]
  47. Valle Junior, R.F.; Varandas, S.G.P.; Sanches Fernandes, L.F.; Pacheco, F.A.L. Multi Criteria Analysis for the monitoring of aquifer vulnerability: A scientific tool in environmental policy. Environ. Sci. Policy 2015, 48, 250–264. [Google Scholar] [CrossRef] [Green Version]
  48. Ferreira, A.R.L.; Sanches Fernandes, L.F.; Cortes, R.M.V.; Pacheco, F.A.L. Assessing anthropogenic impacts on riverine ecosystems using nested partial least squares regression. Sci. Total Environ. 2017, 583, 466–477. [Google Scholar] [CrossRef]
  49. Santos, R.M.B.; Sanches Fernandes, L.F.; Cortes, R.M.V.; Varandas, S.G.P.; Jesus, J.J.B.; Pacheco, F.A.L. Integrative assessment of river damming impacts on aquatic fauna in a Portuguese reservoir. Sci. Total Environ. 2017, 601–602, 1108–1118. [Google Scholar] [CrossRef]
  50. Sanches Fernandes, L.F.; Fernandes, A.C.P.; Ferreira, A.R.L.; Cortes, R.M.V.; Pacheco, F.A.L. A partial least squares—Path modeling analysis for the understanding of biodiversity loss in rural and urban watersheds in Portugal. Sci. Total Environ. 2018, 626, 1069–1085. [Google Scholar] [CrossRef]
  51. Álvarez, X.; Valero, E.; Santos, R.M.B.; Varandas, S.G.P.; Sanches Fernandes, L.F.; Pacheco, F.A.L. Anthropogenic nutrients and eutrophication in multiple land use watersheds: Best management practices and policies for the protection of water resources. Land Use Policy 2017, 69, 1–11. [Google Scholar] [CrossRef]
  52. Pacheco, F.A.L. Regional groundwater flow in hard rocks. Sci. Total Environ. 2015, 506–507, 182–195. [Google Scholar] [CrossRef]
  53. Fernandes, L.F.S.; Marques, M.J.; Oliveira, P.C.; Moura, J.P. Decision support systems in water resources in the demarcated region of Douro—Case study in Pinhão river basin, Portugal. Water Environ. J. 2014, 28, 350–357. [Google Scholar] [CrossRef]
  54. Fernandes, L.F.S.; dos Santos, C.M.M.; Pereira, A.P.; Moura, J.P. Model of management and decision support systems in the distribution of water for consumption. Eur. J. Environ. Civ. Eng. 2011, 15, 411–426. [Google Scholar] [CrossRef]
  55. Pacheco, F.A.L. Application of Correspondence Analysis in the Assessment of Groundwater Chemistry. Math. Geol. 1998, 30, 129–161. [Google Scholar] [CrossRef]
  56. Do Valle Júnior, R.F.; Siqueira, H.E.; Valera, C.A.; Oliveira, C.F.; Sanches Fernandes, L.F.; Moura, J.P.; Pacheco, F.A.L. Diagnosis of degraded pastures using an improved NDVI-based remote sensing approach: An application to the Environmental Protection Area of Uberaba River Basin (Minas Gerais, Brazil). Remote Sens. Appl. Soc. Environ. 2019, 14, 20–33. [Google Scholar] [CrossRef]
  57. Pacheco, F.A.L.; Landim, P.M.B. Two-Way Regionalized Classification of Multivariate Datasets and its Application to the Assessment of Hydrodynamic Dispersion. Math. Geol. 2005, 37, 393–417. [Google Scholar] [CrossRef] [Green Version]
  58. Pacheco, F.A.L.; Sousa Oliveira, A.; Van Der Weijden, A.J.; Van Der Weijden, C.H. Weathering, biomass production and groundwater chemistry in an area of dominant anthropogenic influence, the Chaves-Vila Pouca de Aguiar region, north of Portugal. Water Air Soil Pollut. 1999, 115, 481–512. [Google Scholar] [CrossRef]
  59. Pacheco, F.A.L. Finding the number of natural clusters in groundwater data sets using the concept of equivalence class. Comput. Geosci. 1998, 24, 7–15. [Google Scholar] [CrossRef]
  60. Valera, C.A.; Pissarra, T.C.T.; Martins Filho, M.V.; Valle Junior, R.F.; Sanches Fernandes, L.F.; Pacheco, F.A.L. A legal framework with scientific basis for applying the ‘polluter pays principle’ to soil conservation in rural watersheds in Brazil. Land Use Policy 2017, 66, 61–71. [Google Scholar] [CrossRef]
  61. Hughes, S.J.; Cabecinha, E.; Andrade dos Santos, J.C.; Mendes Andrade, C.M.; Mendes Lopes, D.M.; da Fonseca Trindade, H.M.; dos Santos Cabral, J.A.F.A.; dos Santos, M.G.S.; Lourenço, J.M.M.; Marques Aranha, J.T.; et al. A predictive modelling tool for assessing climate, land use and hydrological change on reservoir physicochemical and biological properties. Area 2012, 44, 432–442. [Google Scholar] [CrossRef]
  62. Modesto Gonzalez Pereira, M.J.; Sanches Fernandes, L.F.; Barros Macário, E.M.; Gaspar, S.M.; Pinto, J.G. Climate Change Impacts in the Design of Drainage Systems: Case Study of Portugal. J. Irrig. Drain. Eng. 2015, 141, 05014009. [Google Scholar] [CrossRef] [Green Version]
  63. Siqueira, H.E.; Pissarra, T.C.T.; do Valle Junior, R.F.; Fernandes, L.F.S.; Pacheco, F.A.L. A multi criteria analog model for assessing the vulnerability of rural catchments to road spills of hazardous substances. Environ. Impact Assess. Rev. 2017, 64, 26–36. [Google Scholar] [CrossRef] [Green Version]
  64. Krause, P.; Kralisch, S. The hydrological modelling system J2000—knowledge core for JAMS. In Proceedings of the MODSIM 2005 International Congress on Modelling and Simulation, Melbourne, Australia, 12–15 December 2005. [Google Scholar]
  65. Zander, F.; Kralisch, S. River Basin Information System: Open Environmental Data Management for Research and Decision Making. ISPRS Int. J. Geo-Inf. 2016, 5, 123. [Google Scholar] [CrossRef]
  66. Pfennig, B.; Kipka, H.; Wolf, M.; Fink, M.; Krause, P.; Flügel, W.A. Development of an extended routing scheme in reference to consideration of multi-dimensional flow relations between hydrological model entities. In Proceedings of the 18th World IMACS Congress and MODSIM09 International Congress on Modelling and Simulation, Cairns, Australia, 13–17 July 2009. [Google Scholar]
  67. Flügel, W.A. Hydrological response units (HRU’s) as modelling entities for hydrological river basin simulation and their methodological potential for modelling complex environmental process systems. Results from the Sieg catchment. Erde 1996, 127, 43–62. [Google Scholar]
  68. Srinivas, N.; Deb, K. Muiltiobjective Optimization Using Nondominated Sorting in Genetic Algorithms. Evol. Comput. 1994, 2, 221–248. [Google Scholar] [CrossRef]
  69. Gupta, H.V.; Sorooshian, S.; Yapo, P.O. Status of Automatic Calibration for Hydrologic Models: Comparison with Multilevel Expert Calibration. J. Hydrol. Eng. 2002, 4, 135–143. [Google Scholar] [CrossRef]
  70. Nash, J.E.; Sutcliffe, J.V. River flow forecasting through conceptual models part I—A discussion of principles. J. Hydrol. 1970, 10, 282–290. [Google Scholar] [CrossRef]
  71. Harris, N.M.; Gurnell, A.M.; Hannah, D.M.; Petts, G.E. Classification of river regimes: A context for hydroecology. Hydrol. Process. 2000, 14, 2831–2848. [Google Scholar] [CrossRef]
  72. Ribeiro, M.M.R. No Alternativas para Outorga e a Cobrança Pelo Uso da Água: Simulação de um Caso. Ph.D. Thesis, Instituto de Pesquisas Hidráulicas, Universidade Federal de Rio Grande do Sul, Porto Alegre, Brazil, 2000. [Google Scholar]
  73. Da Silva, A.M.; de Oliveira, P.M.; de Mello, C.R.; Pierangeli, C. Vazões mínimas e de referência para outorga na região do Alto Rio Grande, Minas Gerais. Rev. Bras. Eng. Agríc. Ambient. 2006, 10, 374–380. [Google Scholar] [CrossRef]
  74. Longhi, E.H.; Formiga, K.T.M. Metodologias para determinar vazão ecológica em rios. Rev. Bras. Ciências Ambient. 2011, 20, 33–48. [Google Scholar]
  75. Vestena, L.R.; Oliveira, E.D.; Cunha, M.C.; Thomaz, E.L. Vazão ecológica e disponibilidade hídrica na bacia das Pedras, Guarapuava-PR. Rev. Ambiente Água 2012, 7, 212–227. [Google Scholar] [CrossRef]
  76. Vogel, R.M.; Fennessey, N.M. Flow-Duration Curves. I: New Interpretation and Confidence Intervals. J. Water Resour. Plan. Manag. 2006, 120, 485–504. [Google Scholar] [CrossRef]
  77. Vogel, R.M.; Fennessey, N.M. Flow Duration Curves Ii: A Review of Applications in Water Resources Planning. JAWRA J. Am. Water Resour. Assoc. 1995, 31, 1029–1039. [Google Scholar] [CrossRef]
  78. Naghettini, M.; Pinto, E.J.D.A. Hidrologia Estatística; CPRM: Belo Horizonte, Brazil, 2007; ISBN 978-85-7499-023-1.
  79. Monte, B.; Costa, D.; Chaves, M.; Magalhães, L.; Uvo, C. Hydrological and hydraulic modelling applied to the mapping of flood-prone areas. Rev. Bras. Recur. Hídricos 2016, 21, 152–167. [Google Scholar] [CrossRef]
  80. Machado, A.R.; Mello Junior, A.V.; Wendland, E.C. Avaliação do modelo J2000/JAMS para modelagem hidrológica em bacias hidrográficas brasileiras. Eng. Sanit. Ambient. 2017, 22, 327–340. [Google Scholar] [CrossRef]
  81. Pulido-Velazquez, M.; Jenkins, M.W.; Lund, J.R. Economic values for conjunctive use and water banking in southern California. Water Resour. Res. 2004, 40. [Google Scholar] [CrossRef] [Green Version]
  82. Fitch, P.; Brodaric, B.; Stenson, M.; Booth, N. Integrated groundwater data management. In Integrated Groundwater Management: Concepts, Approaches and Challenges; Springer International Publishing: Cham, Switzerland, 2016; pp. 667–692. ISBN 9783319235769. [Google Scholar]
  83. Bazargan-Lari, M.R.; Kerachian, R.; Mansoori, A. A conflict-resolution model for the conjunctive use of surface and groundwater resources that considers water-quality issues: A case study. Environ. Manag. 2009, 43, 470–482. [Google Scholar] [CrossRef]
  84. Zhu, T.; Marques, G.F.; Lund, J.R. Hydroeconomic optimization of integrated water management and transfers under stochastic surface water supply. Water Resour. Res. 2015, 51, 3568–3587. [Google Scholar] [CrossRef]
  85. Blomquist, W.; Heikkila, T.; Schlager, E. Institutions and Conjunctive Water Management among Three Western States. In Economics of Water Resources; Routledge: London, UK, 2018; pp. 241–271. [Google Scholar] [Green Version]
  86. Volpi, E.; Fiori, A.; Grimaldi, S.; Lombardo, F.; Koutsoyiannis, D. One hundred years of return period: Strengths and limitations. Water Resour. Res. 2015, 51, 8570–8585. [Google Scholar] [CrossRef] [Green Version]
  87. Volpi, E. On return period and probability of failure in hydrology. Wiley Interdiscip. Rev. Water 2019, 6, e1340. [Google Scholar] [CrossRef]
  88. Galvão, P.; Hirata, R.; Conicelli, B. Estimating groundwater recharge using GIS-based distributed water balance model in an environmental protection area in the city of Sete Lagoas (MG), Brazil. Environ. Earth Sci. 2018, 77, 398. [Google Scholar] [CrossRef]
  89. Galvão, P.; Hirata, R.; Halihan, T.; Terada, R. Recharge sources and hydrochemical evolution of an urban karst aquifer, Sete Lagoas, MG, Brazil. Environ. Earth Sci. 2017, 76, 159. [Google Scholar] [CrossRef]
  90. Abdalla, O.A.E.; Al-Rawahi, A.S. Groundwater recharge dams in arid areas as tools for aquifer replenishment and mitigating seawater intrusion: Example of AlKhod, Oman. Environ. Earth Sci. 2013, 69, 1951–1962. [Google Scholar] [CrossRef]
  91. Morsy, K.M.; Morsy, A.M.; Hassan, A.E. Groundwater sustainability: Opportunity out of threat. Groundw. Sustain. Dev. 2018, 7, 277–285. [Google Scholar] [CrossRef]
  92. Jaafar, H.H. Feasibility of groundwater recharge dam projects in arid environments. J. Hydrol. 2014, 512, 16–26. [Google Scholar] [CrossRef]
  93. Mahto, S.; Kushwaha, A.; Siva Subramanian, M.; Nikita, N.; Singh, T.B.N. Feasibility of Artificial Groundwater Recharge Structures for Urban and Rural Environment of Ranchi in India using Geospatial Technology. Hydrospat. Anal. 2018, 2, 28–42. [Google Scholar] [CrossRef]
  94. Parimalarenganayaki, S.; Elango, L. Assessment of effect of recharge from a check dam as a method of Managed Aquifer Recharge by hydrogeological investigations. Environ. Earth Sci. 2015, 73, 5349–5361. [Google Scholar] [CrossRef]
  95. Braga, C.C.; Amanajás, J.C.; Alcântara, C.R.; Dantas, M.P. Avaliação do albedo nos diferentes tipos de cobertura do cerrado do Amapá—Brasil com imagens MODIS. Territorium 2018, 25, 129–134. [Google Scholar] [CrossRef]
  96. Giongo, P.R.; Vettorazzi, C.A. Albedo da superfície por meio de imagens TM-Landsat 5 e modelo numérico do terreno. Rev. Bras. Eng. Agrícola Ambient. 2014, 18, 833–838. [Google Scholar] [CrossRef]
  97. Testa, G.; Gresta, F.; Cosentino, S.L. Dry matter and qualitative characteristics of alfalfa as affected by harvest times and soil water content. Eur. J. Agron. 2011, 34, 144–152. [Google Scholar] [CrossRef]
  98. Ribeiro, E.P.; Nóbrega, R.S.; Mota Filho, F.O.; Moreira, E.B. Estimativa dos índices de vegetação na detecção de mudanças ambientais na bacia hidrográfica do rio Pajeú. Geosul 2016, 31, 59–92. [Google Scholar]
  99. Scolforo, J.R.; Oliveira, A.D.; Mello, J.M.; Silva, C.P.C.; Ferraz-Filho, A.C.; Andrade, I.S.; Abreu, E.C.R. Análise da estrutura fitossociológica dos fragmentos inventariados e dos grupos fisionômicos. In Inventário Florestal de Minas Gerais: Floresta Estacional Decidual—Florística, Estrutura, Diversidade, Similaridade, Distribuição Diamétrica e de Altura, Volumetria, Tendências de Crescimento e Áreas Aptas para Manejo Florestal; UFLA: Lavras, Brazil, 2008; pp. 99–114. [Google Scholar]
  100. Schwarze, C.P.; Wollmann, H.A.; Binder, G.; Ranke, M.B. Short-term increments of insulin-like growth factor I (IGF-I) and IGF-binding protein-3 predict the growth response to growth hormone (GH) therapy in GH-sensitive children. Acta Paediatr. 1999, 88, 200–208. [Google Scholar] [CrossRef]
Figure 1. Conceptual approach to conjunctive water resources management in a karst aquifer.
Sustainability 11 03944 g001
Figure 2. Location of study area.
Sustainability 11 03944 g002
Figure 3. (a) Topographic map of Jequitiba River basin, with indication of towns, drainage network, and main road network; (b) lithologic map of Jequitiba River basin; (c) soil map of Jequitiba River basin; (d) land use and cover map of Jequitiba River basin. The geographic reference for the maps is the Universal Transverse Mercator (UTM) projection system, SIRGAS 2000 datum, 23 south time zone. The modeled sub-basin and Marinheiro catchment are also indicated in all panels.
Sustainability 11 03944 g003
Figure 4. Recharge within the Jequitiba River basin and Marinheiro catchment. Adapted from Monteiro et al. [37].
Sustainability 11 03944 g004
Figure 5. Workflow used to perform the hydrologic modeling.
Sustainability 11 03944 g005
Figure 6. Flow components simulated by the JAMS J2000 framework within the Jequitiba River sub-basin located upstream the 41.410000 station. (DF)—direct (surface) flow; (S)—percolation in the soil layer; (GF upper)—underground flow in the upper aquifer layer; (GF lower)—underground flow in the lower aquifer layer.
Sustainability 11 03944 g006
Figure 7. Discharge rates in the Marinheiro stream simulated with the JAMS J2000 model.
Sustainability 11 03944 g007
Figure 8. Flow duration curve of the Marinheiro catchment.
Sustainability 11 03944 g008
Figure 9. Return period of maximum (Qmax) and minimum (Qmin) flows in the Marinheiro catchment, estimated at return periods of 2, 5, 10, 50, and 100 years.
Sustainability 11 03944 g009
Table 1. Materials used in the JAMS J2000 hydrologic model, namely spatial data and climatic and stream flow records, and URLs of websites used for downloading the data.
Data TypeUse in the Hydrologic ModelURL of Website
Digital elevation modelHydrologic Response Units (HRU)https://www.asf.alaska.edu
Satellite imagesLand use mapping and HRUhttps://earthexplorer.usgs.gov/
Soil map and hydraulic conductivity dataHRU and data parameterization http://www.dps.ufv.br
Geologic mapHRU and data parameterization www.portaldageologia.com.br
Climatic dataData for JAMS J2000 hydrologic modelhttp://www.inmet.gov.br
Stream flow dataCalibration/validation procedurehttp://www.snirh.gov.br/hidroweb
Table 2. Simulated (JAMS J2000), measured (portable flow meter), and residual (difference between simulated and measured) stream flows in the Marinheiro catchment, averaged on a monthly basis. The Root-mean-square deviation (RMSE) value indicates an acceptable performance of stream flow downscaling.
MonthSimulated Discharge (m3 s−1)Measured Discharge (m3 s−1)Residuals (m3 s−1)
January0.400.240.16  
February0.230.25−0.02  
March0.300.170.13  
April0.160.17−0.01  
May0.130.18−0.05  
Jun0.110.16−0.05  
July0.100.14−0.04  
Augus0.090.12−0.03  
September0.080.12−0.04  
October0.090.14−0.05  
November0.130.16−0.03  
December0.360.300.06  
RMSE = 0.07  

