1. Introduction
Nitrogen (N) is the most important nutrient controlling agricultural primary production. To support a rapidly growing population and its food demand this production requires the external application of N in form of fertilizers. Despite introducing new N use management techniques, e.g., precision agriculture, or synchronizing of N application with crop demand [
1,
2], considerable amounts of N are still being lost to the environment, contributing to surface and groundwater pollution, eutrophication, and their subsequent effects on aquatic ecosystems. The anthropogenic nutrient over-enrichment is considered a main problem in many regions of the world [
3]. In Europe the average use of N fertilizers has substantially grown in recent times, from 44.9 kg N/ha in 2004, up to 49.8 kg N/ha in 2015 [
4].
To prevent and reduce water pollution from nutrients arising from agricultural sources, the European Union (EU) introduced a range of control measures, with general rules set by the Nitrate Directive (ND) (91/676/EEC). This document obliges Member States to designate areas vulnerable to nitrate pollution and to concert the efforts to reduce this pollution through national action programmes. These programmes require land managers to follow a range of measures, such as, among others, controlling the timing and quantities of fertilizers applied to the land, and ensuring proper storage capacity for livestock manure. It has been already concluded that implementation of the ND decreased both N leaching losses to ground and surface waters, and gaseous emissions to the atmosphere in EU-27 [
5]. However, the problem of nutrient pollution has not been completely solved in the EU so far [
6].
Poland is one of the countries located in the Baltic Sea (BS) catchment. Due to its proportion of the catchment area (ca. 18%), and very large share in agricultural land area (ca. 50%) [
7], it is considered as one of the main contributors to the excessive nutrient loads into this sea. Indeed, despite the concerted actions in all the Baltic countries to focus on reduction of nutrient loadings, 96% of the total surface area in the BS remains affected by eutrophication [
8]. Nutrient loads from Poland are being discharged mostly from riverine sources, via two main rivers (Vistula and Oder), draining ca. 88% of the country’s territory, and estimated under the National Environment Monitoring Program [
9]. A substantial downward trend has been observed in the total nitrogen (TN) load from the Polish territory, from 262 thousand tons in 1995 to 170 thousand tons in 2014 [
10]. However, it should also be noted that 9 small rivers from the Pomerania region, carry their waters directly into the BS. These rivers, including the Słupia River—which is the one used as a pilot catchment in this study, are not monitored for nutrient loads [
11].
Of the total area of Poland, agricultural land occupies ca. 60% of the surface, with the industry profile dominated by private farms [
12]. The restructuring trend observed in Polish agriculture after 1990, also enforced by adoption of EU laws, resulted in a general decrease of pressures on aquatic environment quality (e.g., improvement of sewage system management) [
9,
13]. However, this resulted in Polish farmers striving to achieve competitiveness in the EU agricultural market and, thus, increased the use of fertilizers (from 47 kg N/ha in 1995 to 72 kg N/ha in 2016) [
14,
15]. Since agriculture production, as well as fertilizer use, shows strong regional differentiation in Poland, based on the variability of natural and economic factors [
12], the measures to approach nutrient discharge problems should be different. The paper aims to present possible changes in the N load discharge from Polish catchments under the new measures imposed by the EU. To assess possible changes for the aquatic environment a modelling approach was adopted, allowing analysis of different variant scenarios of fertilizer use. Moreover, the 15-year period of meteorological data used in this study also allowed to draw conclusions on possible impacts of climate changes on the N yield from the catchments.
2. Nitrate Vulnerable Zone (NVZ) Approach
2.1. NVZ Status Quo in Europe
Agriculture (i.e., arable land, permanent crops, pastures, and mosaics) occupies nearly 42% (2012) of the EU territory. However, a visible trend of agricultural land loss through the abandonment or withdrawal from farming activities has been observed recently (—0.5% of the agricultural area, 2006–2012) [
16]. It provides indisputable benefits to society, although some farming activities cause substantial impacts on water bodies [
6]. Although an improvement of point-source management has been observed in recent decades in Europe [
17], most studies point out farming practices as a major source of nutrients in the aquatic environment [
18,
19]. Crop and livestock production, as well as fertilizer use, are considered as main accelerators of the nutrient cycle, as global surpluses of N continue to increase (+23% N) [
20].
In general, the nutrient balance (defined as difference between the nutrient inputs entering and leaving farming systems) is being altered in many areas of Europe. In the period 2012–2014, all Member States, except Romania, had a surplus of N, with values exceeding 50 kg/ha in many countries [
6]. The nutrient agricultural discharges alter quality of aquatic resources and result in an increased eutrophication risk [
21], and over-fertilization pressure exerts more awareness as climate change and deterioration of fresh water become more critical. According to the Fifth IPCC Assessment Report (AR5) conclusions, and the National Oceanic and Atmospheric Administration (NOAA) findings, climate change will affect (with a different probability) the global water cycle, causing changes in precipitation distribution, and its intensification over land areas, as well as the frequency of extreme weather events [
22,
23]. These changes will likely affect the crop cycle and, therefore, its N uptake capacity. Moreover, results of modelling studies [
24] show that, under specific climate change scenarios, an increasing trend of the nitrate leaching pattern is possible.
To tackle the issue of water pollution caused by nitrates from agricultural sources at a catchment level, nitrate vulnerable zones (NVZ) have been introduced under the ND throughout the EU. The NVZs are defined as those waters, surface and/or groundwater in which the nitrate levels exceed or are likely to exceed 50 mg/L from agricultural sources. The extent of the ND appliance depends upon the interpretation of the requirements by Member States. Particularly, the interpretation of “vulnerable”, since this affects the range of the area subjected to mandatory requirements. In accordance with the provisions of the ND, Member States had two options to implement its stipulations. The first method relied on identification of the waters affected by nitrate pollution and waters which could be affected in case of a lack of any action pursued, and designating NVZs in their territories. The second method allowed the Member State to be exempted from the obligation of NVZs identification through implementation of action programmes throughout their national territory. Those countries opting for the second method were: Austria, Denmark, Finland, Germany, Ireland, Lithuania, Luxembourg, Malta, the Netherlands, Romania, Slovenia, the Region of Flanders, and Northern Ireland.
In the remaining countries the criteria for NVZs designation had to be developed, and most of them depended on the results of various computer simulations [
25,
26]. The total area of NVZ’s, including countries that apply for a whole-territory approach, represented approximately 61% of EU agricultural area in 2015. Therefore, there are still areas in Europe with potential water pollution that are not included in any action programme. Moreover, in some countries, the designed territories are limited to reduced areas putting in question the potential effectiveness of the action programmes [
6].
2.2. NVZ Revision in Poland
The provisions of the ND have been officially introduced in Poland in 2004. Delimitation of the initial range of NVZs was performed by the Regional Water Management Authorities in each of the seven surface water districts and based on: (i) content of N compounds in surface and underground waters; (ii) eutrophication of surface waters (including internal and coastal sea waters); (iii) agricultural land use structure and soil typology; (iv) type of agricultural activity, and concentration of animal production; and (v) prevailing meteorological-, hydrological-, and hydrogeological conditions [
27]. Originally, in the first period of the ND being in force in Poland (2004–2008), 21 NVZs had been delimited, which accounted for 2% of the total area of the Polish territory. Moreover, the Action Programmes for Reduction of Outflow of Nitrogen from Agricultural Sources, and the Code of Good Agricultural Practices had been prepared and implemented [
28]. Standards included in these documents related primarily to the requirements of fertilizers and plant protection products management, water and soil conservation, rational use of wastewater and sewage sludge, conservation of valuable habitats and species found in agricultural areas, as well as maintaining cleanliness and order on farms [
29].
Following the ND requirements the eutrophic state of the waters, action programmes, and extension of NVZs should be reviewed every four years. Hence, such actions have been performed in Poland in 2008, and 2012 based on the results of monitoring tests, expertise [
30], as well as modelling results [
31]. In the second cycle (2008–2012) 19 NVZs were designated, covering approximately 1.5% of the country’s area. Then, in the third cycle (2012–2016) 48 NVZs constituted 4.46% of the Polish territory. Process of the ND implementation in Poland has been followed and assessed by the European Commission (EC) [
32], and insufficient surface areas designated as NVZs had been indicated. Due to the fact that Poland had not complied with the EC recommendations, a litigation process was started in 2013 (Case C 356/13). As Poland has failed to fulfil the ND obligations by inadequate identification and classification of nitrate vulnerable waters, and adopting incompatible measures in action programmes, a change of the approach to the ND has been imposed. This change resulted in switching into the second option of the ND provision implementation, i.e., an indication of the whole country’s territory as a nitrate vulnerable zone, and development of a new approach to tackle the nitrogen pollution issue.
2.3. Consequences of the NVZ Approach Change
Apart from extending the NVZs range, the new approach to the implementation of the ND requirements will be based on the on the new Action Programme adopted in June 2018 [
33]. This programme specifies, among others: periods of fertilizer application, storage conditions for natural fertilizers, doses, and methods of nitrogen fertilization, and the way in which farmers are to document the implementation of these requirements. According to this document, mineral nitrogen fertilizers on arable land can be applied from 1 March to the end of October, other fertilizers (solid) from 1 March to 30 November, and liquid at such dates as nitrogen ones (
Table 1). Selected fertilizers (mineral nitrogen and other liquid fertilizers) can be applied from 15 February on grounds that are not frozen, covered with snow or water, or saturated with water. Additionally, in accordance with this regulation liquid and solid manure fertilizers should be stored in a way that prevents leachates from entering the ground and water during the period when they are not used. Moreover, an increase of natural fertilizer tank capacity should be ensured, to enable their storage for a period of six months, not four as before. The document also indicates that farmers are obliged to keep records of nitrogen fertilization, and agree them with the regional agricultural stations.
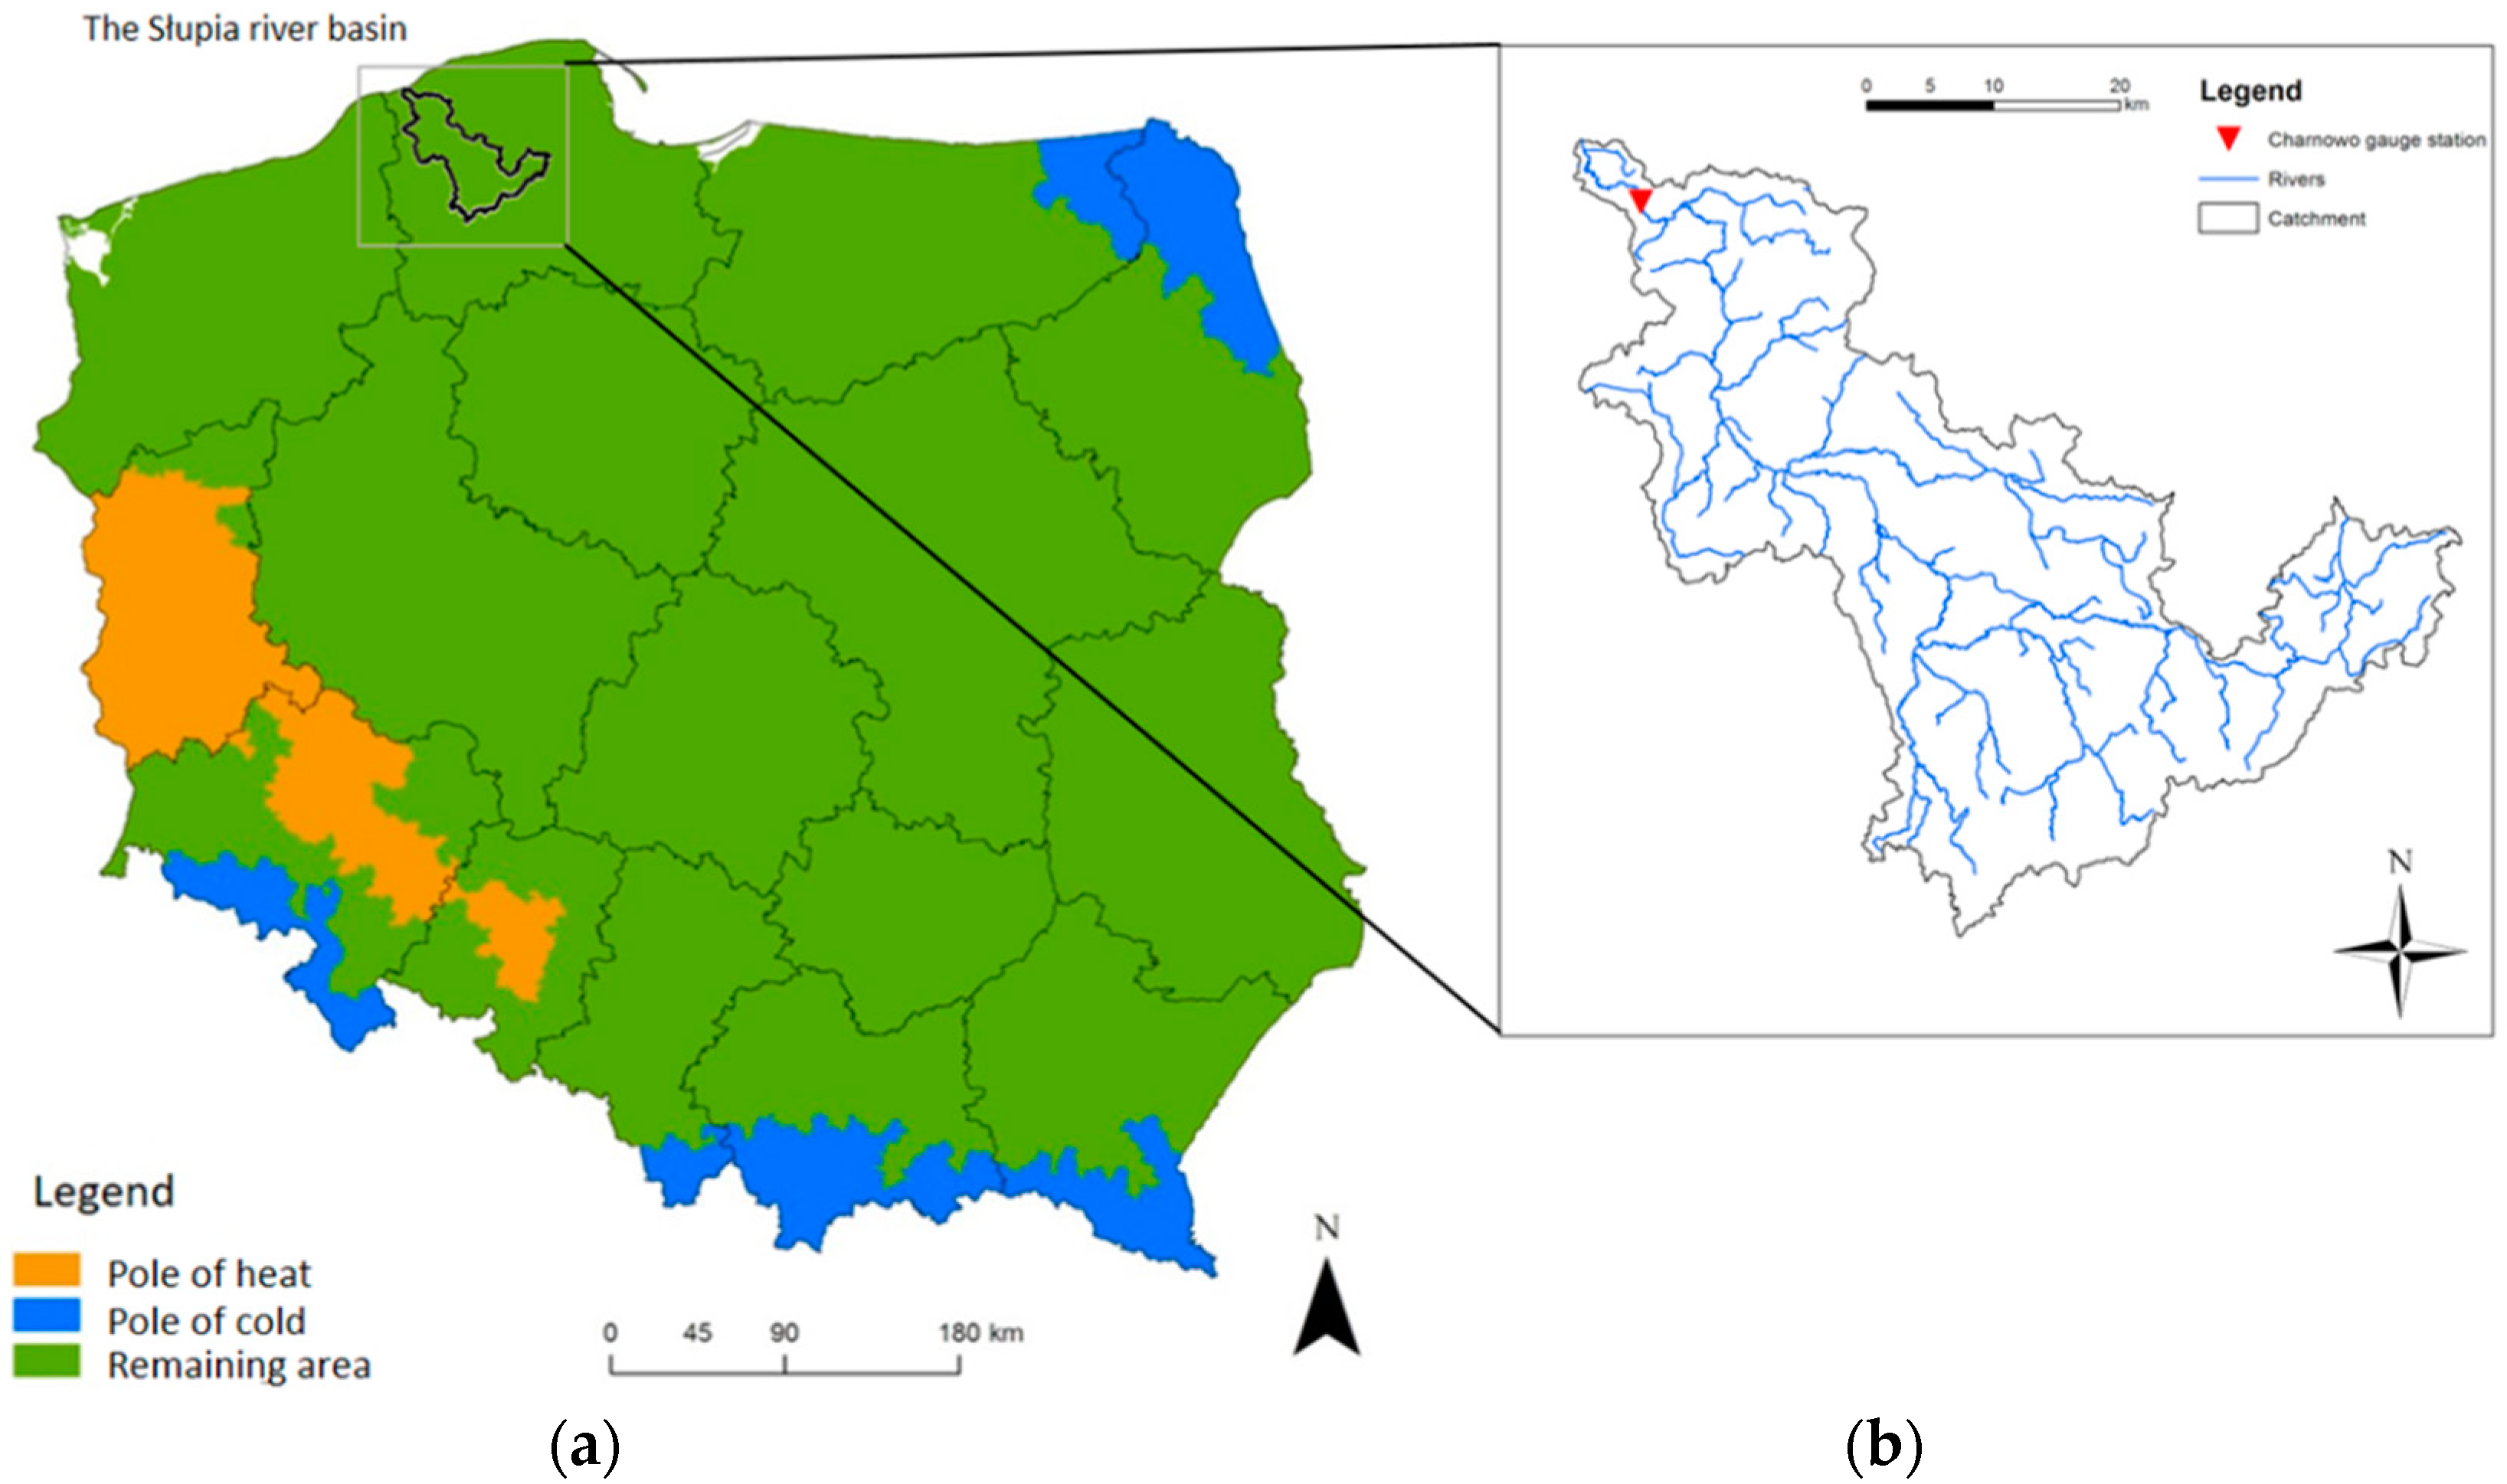
One of the most important elements of the ND is the control of doses and periods of fertilization on selected types of land. Due to the fact that Poland extends in the north–south dimension over 649 km, and 689 km in the east–west dimension, there are significant differences in the average annual temperature of air between the extreme regions of the country. This fact has a direct influence on plant vegetation periods, and subsequently on the periods of fertilizer application. Therefore, it was considered necessary to designate areas of the country where the dates of fertilizer application will be shortened or extended. This task performed by the Institute of Meteorology and Water Management (IMGW), resulted in delimitation of so-called “pole of cold” and “pole of heat” (
Figure 1). The confines of the poles are based on the administrative borders of municipalities (communes), and the delimitation process was based on:
Eventually, the “pole of cold” and “pole of heat” areas covered the range of 5.8% and 5.7% of the country’s territory, respectively. The “pole of hot” covers three provinces (Opolskie, Dolnośląskie, and Lubuskie) and is a single area. The “field of cold”, on the other hand, consists of three areas covering mountainous areas in the south of the country in the Dolnośląskie, Śląskie, Małopolskie, and Podkarpackie voivodships as well as the northeastern Polish area in the Warmian-Masurian and Podlasie voivodships.
According to the new regulations, the available time for fertilization in the “pole of cold” area has been shortened by a total of 20 days for solid organic fertilizers, and 16 days for solid nitrogen and nitrogenous mineral fertilizers. For the “pole of heat” area these periods have been extended by 15 and 30 days, respectively (
Table 1).
3. Modeling of NVZ Revision’ Impact—Variant Scenarios
To estimate the impact of introducing additional restrictions on fertilization periods in the “pole” areas, model calculations have been performed using the macromodel DNS/SWAT. Its construction and applicability have been described elsewhere [
36]. Briefly, the macromodel combines existing mathematical models and equations of hydrological transport in a catchment with the benefits of the SWAT module, which is generally used to model continuous long-term yields within hydrologic response units. The numerical model of a catchment created with the use of the macromodel DNS/SWAT enables to analyse different scenarios of the catchment exploitation in different meteorological and hydrologic conditions. This tool is also used to analyse the yield of nutrients at any selected control point of the river [
11,
37].
In the current study, the Słupia River catchment (
Figure 1) has been selected as a pilot area for the modelling purposes. Although, this catchment is not located in any of the designated “pole” areas, covered by additional restrictions, its choice was promoted by many factors. Above all, the Słupia River discharges directly into the Baltic Sea. Moreover, this catchment has been used for total nitrogen (TN) field research by the IMGW since 2013. These results are beneficial in verification of the TN calculations with use of the macromodel DNS/SWAT. The aforementioned research conducted also at the neighbouring catchments confirmed that the Słupia River may be considered a representative catchment for the whole Pomeranian region. Therefore, it plays an important role in the estimation of TN loads from the territory of Poland into the Baltic Sea [
38,
39,
40]. The Słupia River has a length of 139 km, and its catchment covers an area of 1623 km
2. The entire catchment is located in the northwestern part of the Pomeranian Voivodeship (
Figure 1), and its area is dominated by agricultural use (almost 50% of the total area). Forest area covers 44% and occurs mainly in its central part. Buildings and anthropogenic areas constitute about 4% of the catchment area, with the main urban centres in Słupsk, Ustka, and Bytów. Floods in this catchment occur in the snow melting period (spring) and are inconsequential. However, the outlet area is frequently affected by sea water storm surges. As a main calculation profile for the macromodel DNS/SWAT calculation, the Charnowo profile was selected. This cross-section is located close to the mouth of the river (
Figure 1), but at the same time far enough to be insusceptible to the impact of backwater from the sea. The Charnowo profile, a semi-automatic device (autosampler) has been also installed to collect water samples for the total nitrogen (TN) analyses. The macromodel DNS/SWAT generates datasets for the flow rate and loads of selected pollutants such as TN. Data is generated with a daily time step for any selected profile on the river.
The baseline scenario of the Słupia River model (VS0), also referred in the current study as a reference or control one, has been created with the goal of the best accurate representation of the real conditions in the catchment. To create VS0, the input data have been used, namely:
Digital elevation model (DEM) on a scale of 1:50,000;
Map of hydrographical divisions of Poland;
Data on discharges of pollutants from sewage treatment plants, containing geographical coordinates of discharge points, amount of municipal waste water treated (m3/year), total suspended soil (mg/dm3), total nitrogen and total phosphorus (mg/dm3)—this data came from the National Sewage Treatment Program and did not require processing;
Meteorological data on precipitation, temperature, humidity, sunlight, and wind speed and direction derived from historical database IMGW-PIB;
Digital maps for soil classes, at a scale of 1:100,000 divided into 23 classes of soils. These classes were created by the generalization of all types of soil occurring in this area;Land use maps developed on the basis of Coordination of Information on the Environment programme (CORINE Land Cover). Maps that divide the catchment area into urbanized, agricultural, forested, wetlands, and water bodies. The agricultural land was further divided into specific crops; and
Fertilizer data from the Local Data Bank and research carried out by the Warsaw University of Life Sciences.
Since the processes affecting the outflow of N and P loads from the catchment may be completely different, depending on the hydrological characteristics of a given year, the VS0 was based on an uninterrupted period of 15 years, including years with dry, average, and wet hydrological conditions. Then, the SV0 was calibrated and verified with use of the TN data from the IMGW monitoring station.
The use of the macromodel DNS/SWAT allows also for incorporation of the data on agrotechnical treatments, and so-called fertilization calendar. The fertilization calendar is based on data on the maximum permissible fertilizer dose that can be applied, taking into account the requirements of cultivated plants, soil types, and slope. The calendar divides fertilizers into mineral and organic and distributes them for specific months and days. All three prepared variant scenarios were based on modification of the fertilization calendar. For the scenarios representing the “field of cold” conditions, the fertilization periods were shortened, whereas for the scenario representing the “field of heat” conditions, they were extended. To assess the effects of the fertilization restrictions in the “pole of cold” and “pole of heat” areas in the Słupia River three variant scenarios (VS1-3) have been created:
VS1—“pole of cold” variant scenario 1—assumed shortening of the fertilization period by 20 days, and thus reducing of the amount of both mineral and organic fertilizers used during the allowed period;
VS2—“pole of cold” variant scenario 2—assumed shortening of the fertilization period by 20 days, and maintaining the VS0 amount of fertilizer applied in the catchment through increase of the fertilizer dose in the remaining allowed period; and
VS3—“pole of heat” variant scenario—assumed prolongation of the fertilization period by 30 days in total, while maintaining the VS0 amount of fertilizer applied in the catchment.
4. Results
All scenario simulations were performed on the monthly data for the period of 2002–2016. In the current study, to underline the seasonal differences, the yearly data and subsequent calculations were divided into two periods: summer (April–September), and winter (October–March), for which the monthly average TN load values for all the prepared scenarios have been calculated (
Table 2). The differences in the TN loads between summer and winter months are clearly visible already for the VS0, with the average difference between the TN loads for the summer and winter months of 18,494 kg/month. Even larger differences between the average seasonal TN loads at the Charnowo calculation profile were detected during the variant scenario simulations, with the highest value for the VS3, reaching 42,248 kg/month (VS1—36,218 kg/month, and VS2—38,295 kg/month, respectively). For the VS0, and all three variant scenarios, the percentage of the TN load reduction (assuming the TN value for VS0 as 100%,
Table 2), and also the resultant dispersion, have also been calculated. The dispersion was based on Equation (1):
where
R—data dispersion within the month;
Xmax—the maximum value of the measurement during the month;
Xmin—the minimum value of the measurement during the month;
—mean value of the measurement during the month.
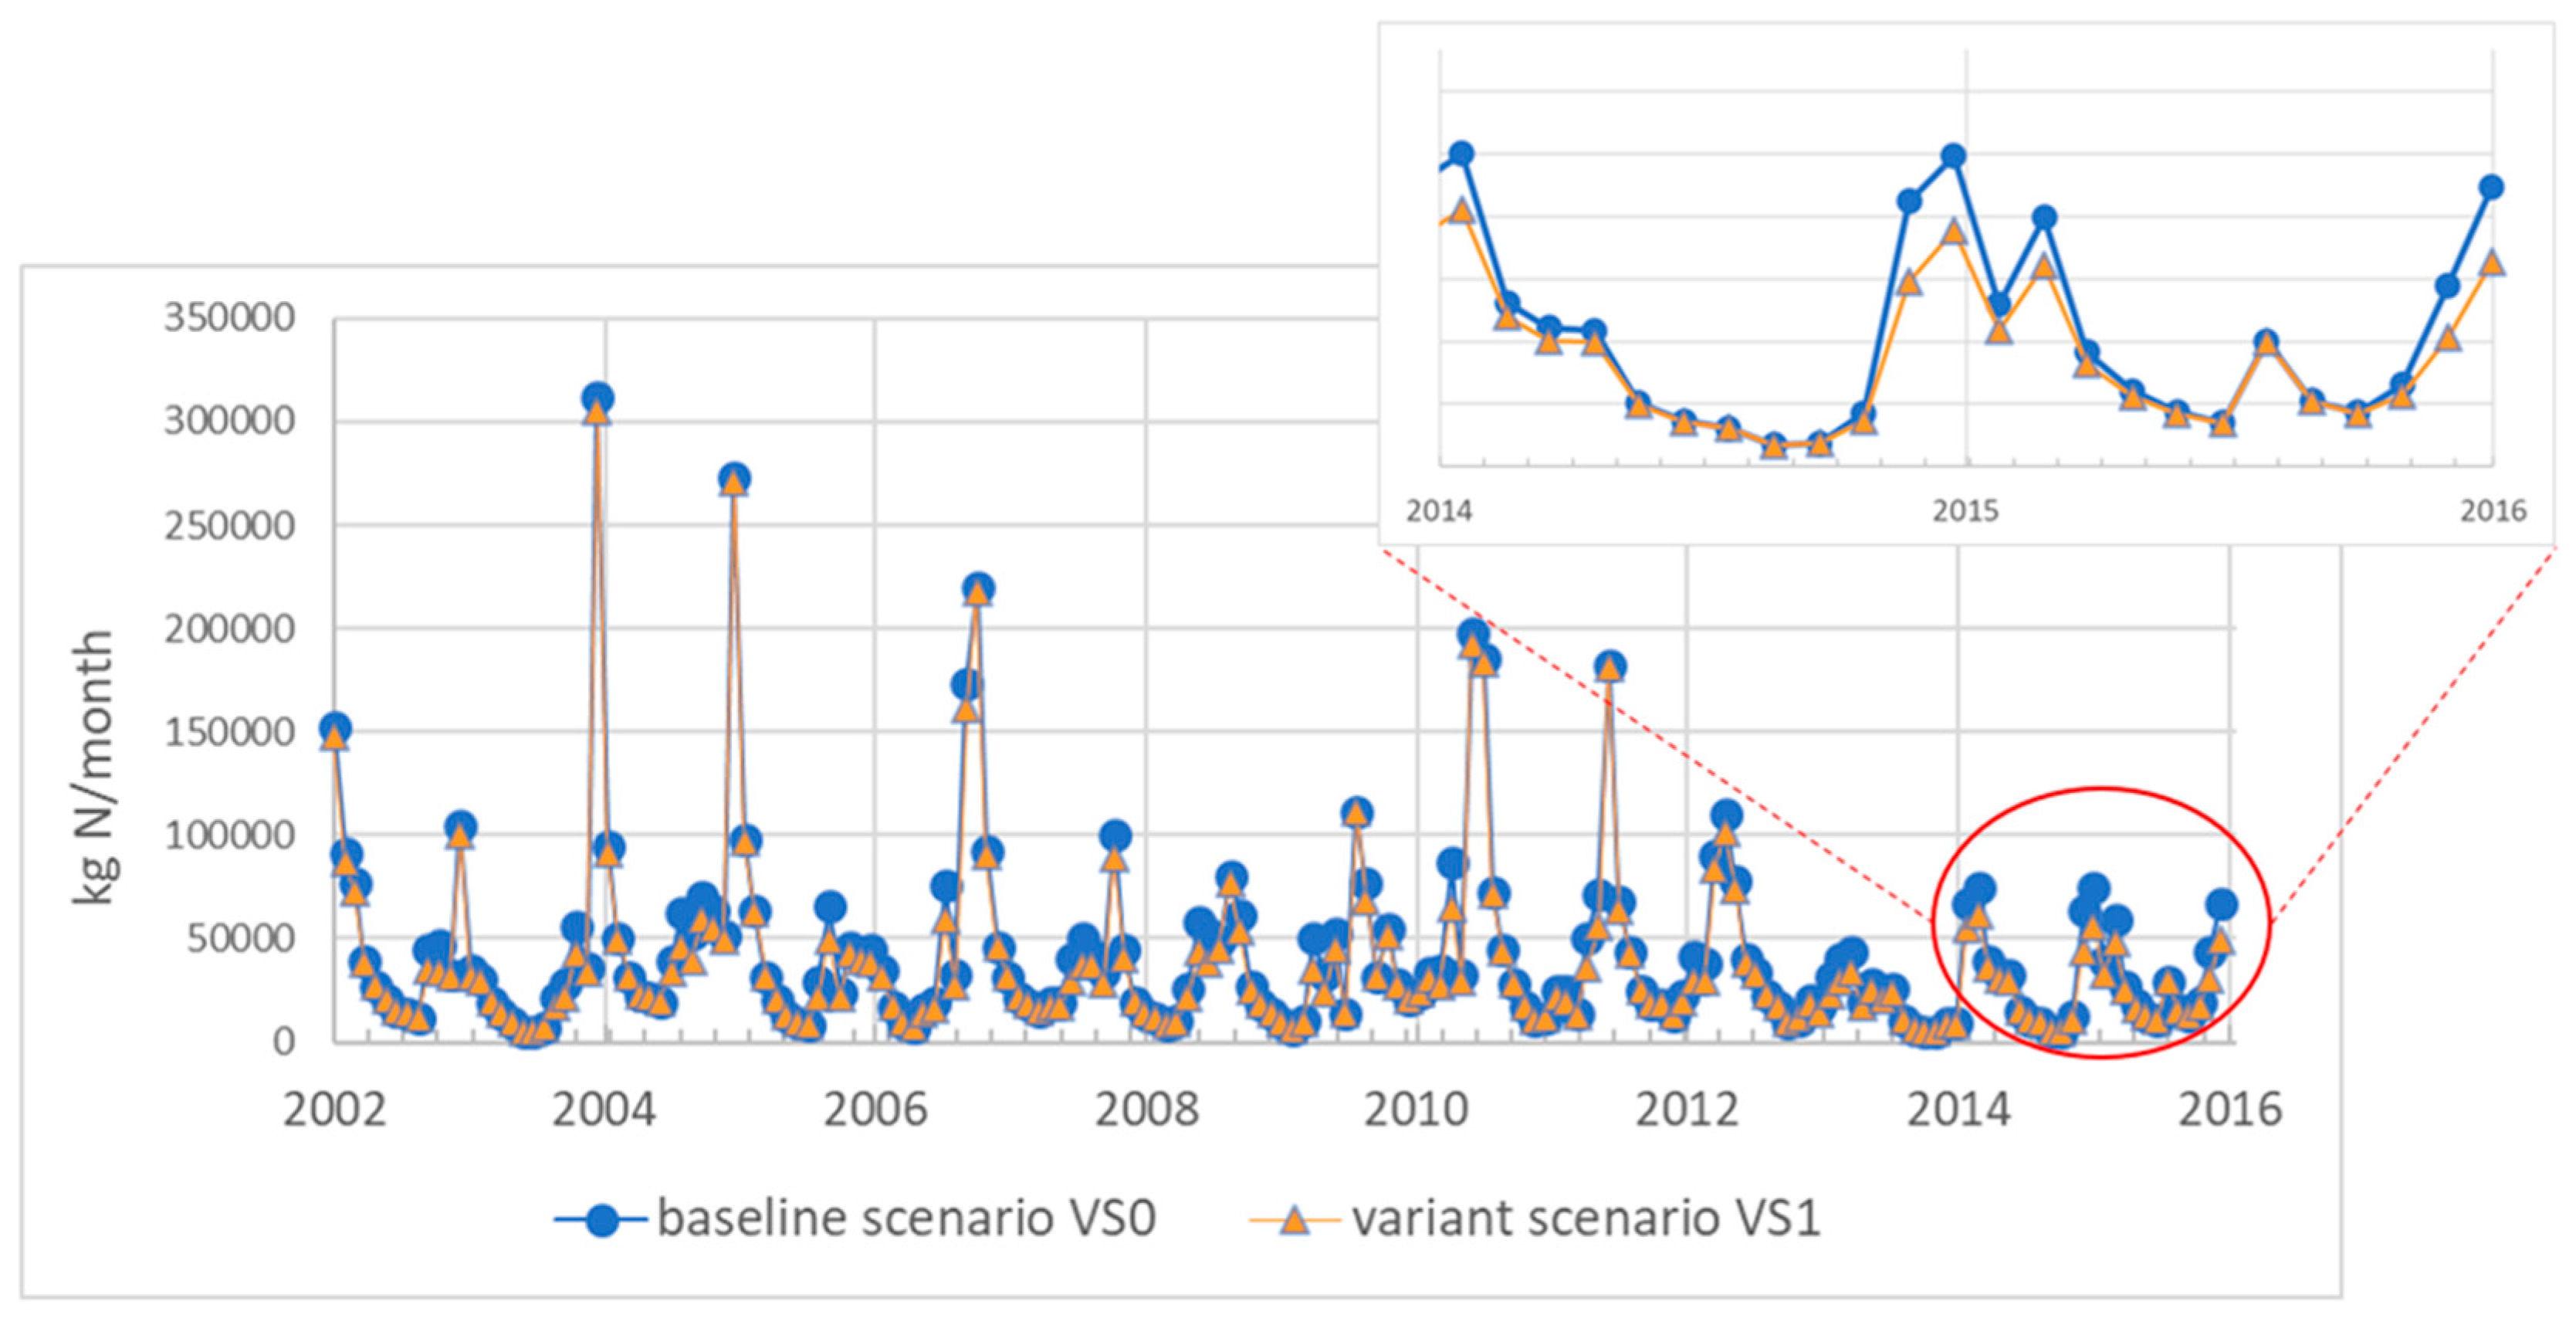
Simulation results showed that the reduction of the fertilization period by 20 days and, thus, reduction of the fertilizers amount by 55 kg/ha TN for each of the five crop types included in the fertilizer calendar, (VS1) could bring 8.61% of the TN load reduction (average for the period of 2002–2016) in the Słupia River catchment. Dispersion of the yearly results was very high for this scenario (775%), and clear differences were visible between the seasons, and among particular years (
Table 2,
Figure 2). The reduction of the TN load varied from 0.86% to 6.85% for the summer period, and from 9.87% to 19.16% for the winter period. The average TN load difference at the selected calculation profile between the baseline and “pole of cold 1” scenarios was 762 kg/month (coefficient of variation, cv = 60%) during the summer period, and 7171 kg/month (cv = 21%) during the winter period on average. As for the particular years, the lowest values of the VS0 and VS1 difference were observed in 2002–2003 and 2011, and the highest for 2006 and 2015 (for the summer and winter period, respectively). In general, in the all analysed years, the results of the variant VS1 scenario maintained a constant trend observed in the catchment, i.e., a high TN load values in winter periods (From October to March) and low TN load values in summer periods (from April to September, but the months in which the TN load was particularly low were July, August, and September). For the last two years (2014–2016) specified in
Figure 2, the lowest TN load was slightly over 4700 kg/month (September 2014), while the highest TN load reached almost was 62,000 kg/month (January 2015). In practice, this means that the TN load values for the winter period are over 15-times higher than in the summer period.
Figure 2 shows that in some earlier years the differences described were even greater.
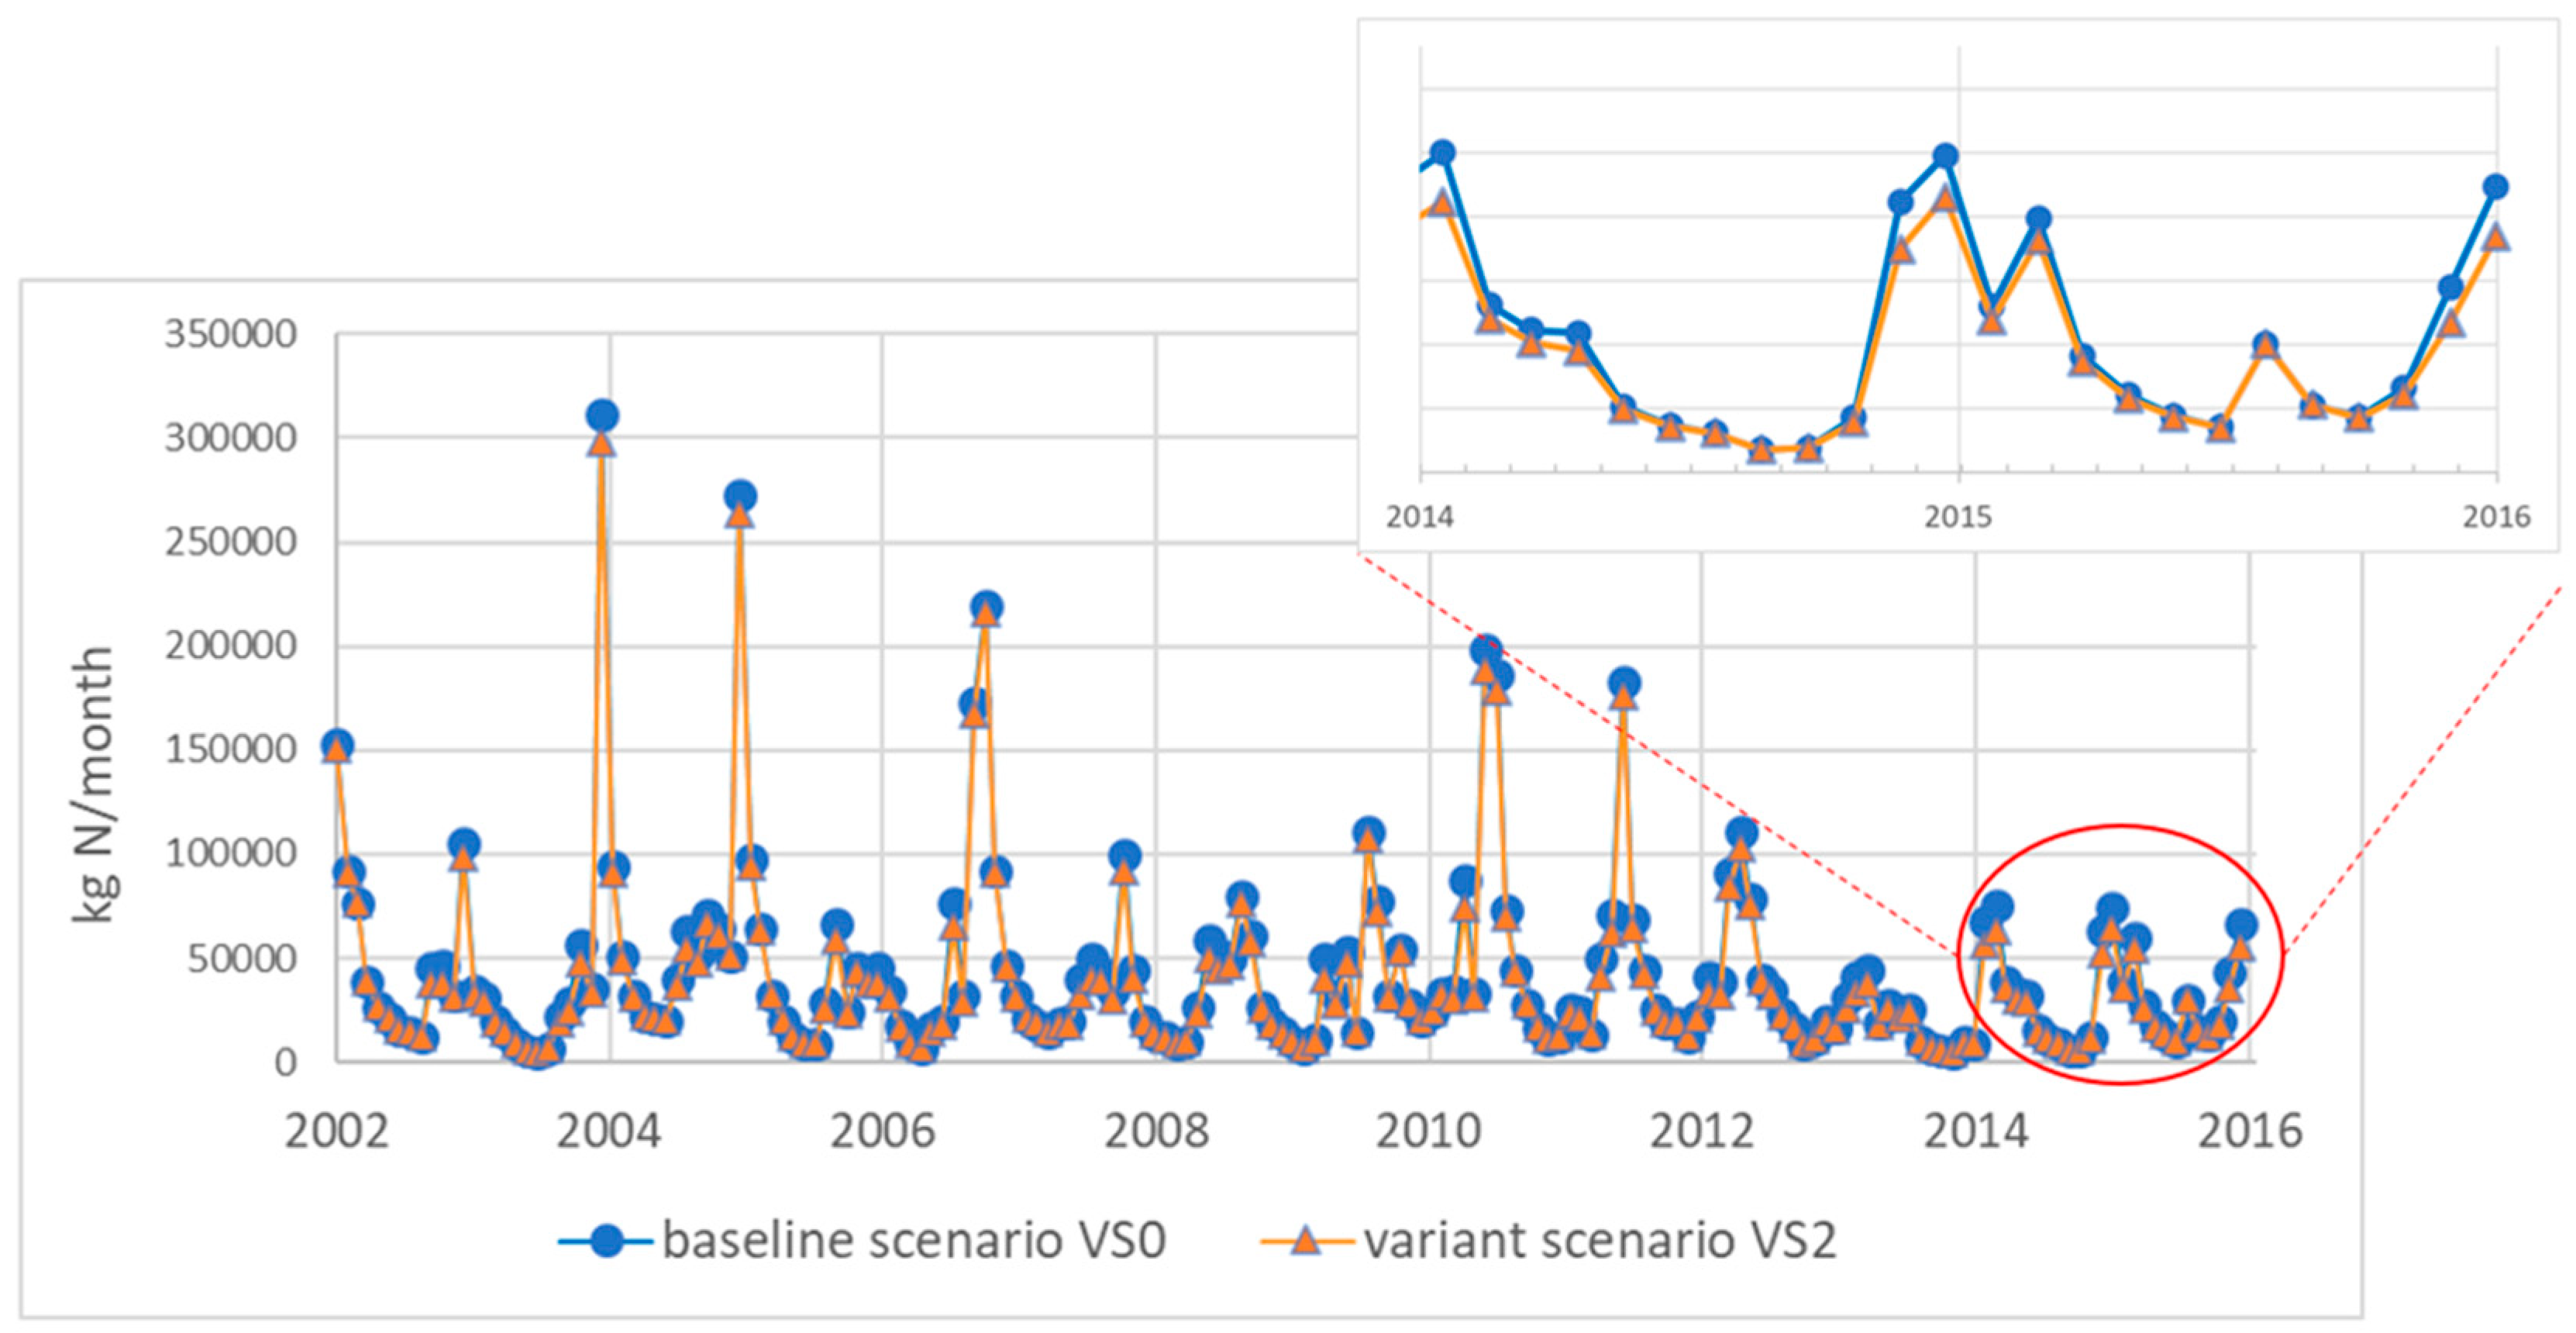
For the next “pole of cold” scenario (VS2), with shortening of the fertilization calendar, but without reduction of the fertilizer amount, the percentage of the TN load reduction was slightly lower compared to the VS1 scenario (5.96%). Dispersion for the VS2 results was at the similar level (737%), and the similar pattern was maintained for the seasonal changes. However, slightly lower ranges of the reduction for the summer (0.47–7.55%), and winter (5.94–12.05%) periods were detected (
Table 2). The average TN loads both for summer and winter were also lower than those calculated for the VS1 scenario, by 0.2% and 3.59%, respectively. Comparing results of the VS2 with the baseline scenario the TN load average difference by 716 kg/month (cv = 72%) for the summer period, and 5049 kg/month (cv = 20%) for the winter period was concluded. As for the yearly pattern of the TN load distribution, the extreme values were detected in the same years as for the VS1 (2002–2003, and 2006) for the summer period. During the winter period the extreme values were observed in 2002 and 2012. Similarly, to the variant scenario VS1, also for VS2, the dependence of the TN load value on time remained the same (high values in the winter months and low in the summer months) (
Figure 3). For the years 20014–2016, the lowest TN load was 4,810 kg/month (September 2014), while the highest TN load was 64,666 kg/month (December 2015), which again highlights the 15-times difference between winter and summer periods.
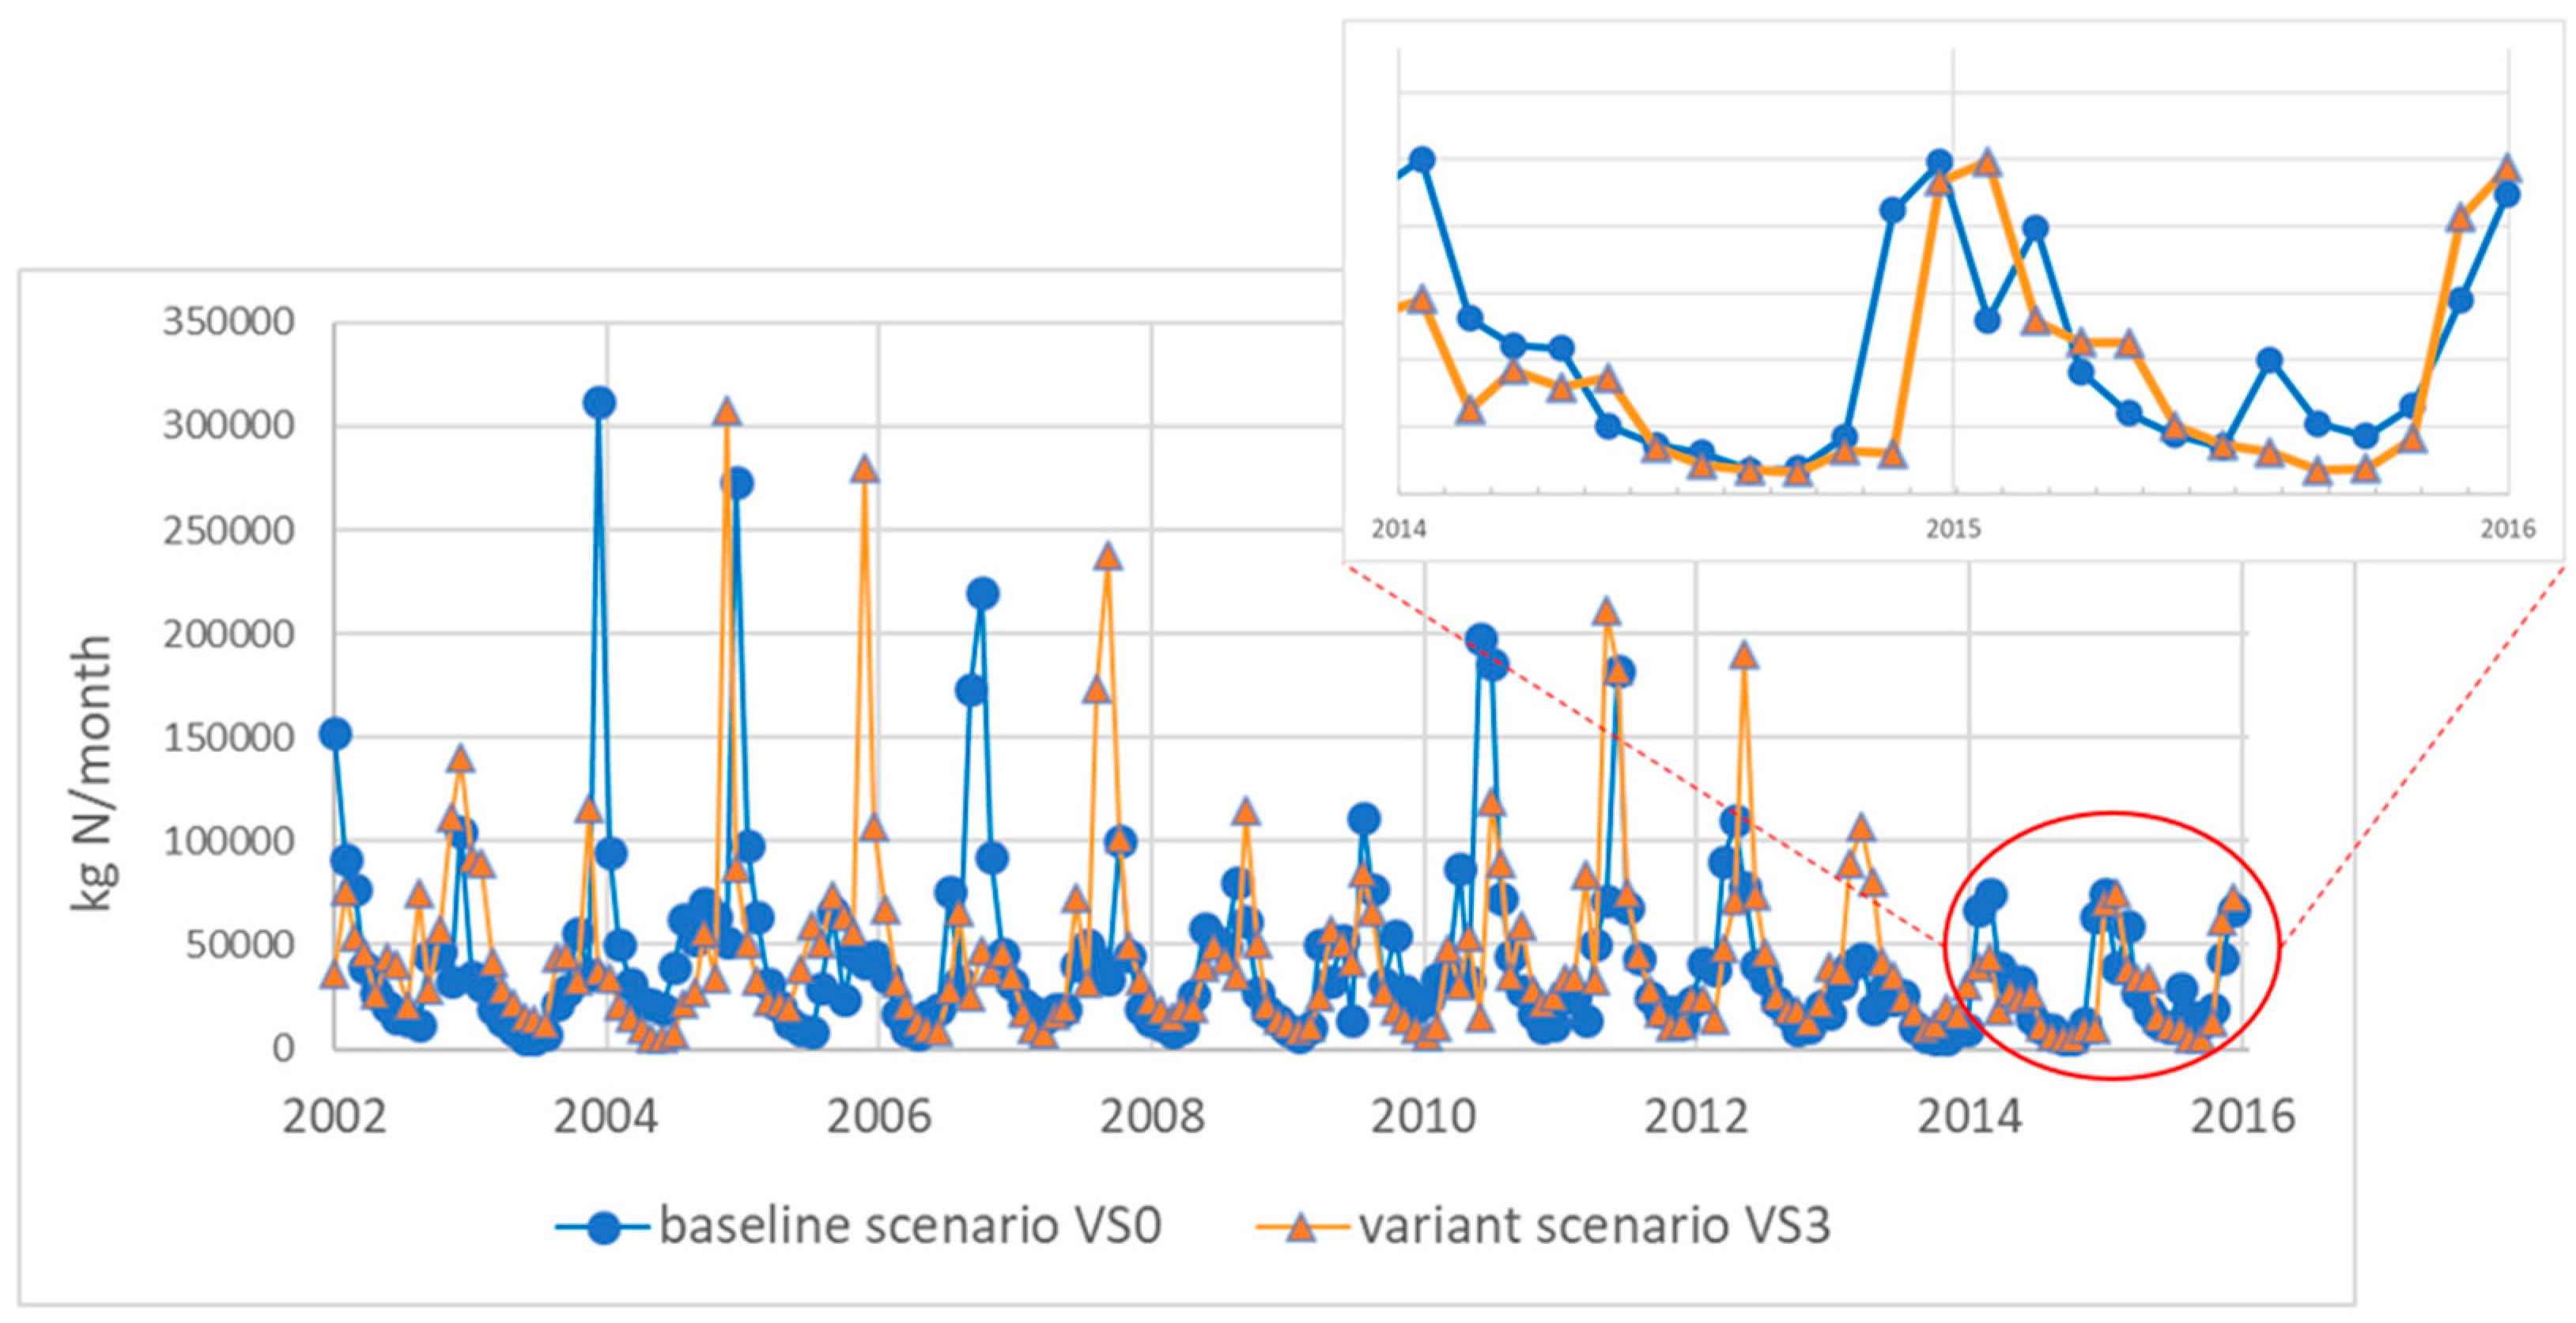
Extension of the fertilization period by 30 days (with maintaining the yearly fertilizer consumption) assumed in the “pole of heat” scenario (VS3) showed opposite trends. For the discussed pilot catchment such a change could result in a 43.69% increase of the TN load comparing to the baseline scenario. The reduction percentage for the VS3 compared to the VS0 scenario ranged between 67.77% and −145.09% (increase) for the summer period, and from 37.71% to −176.14% (increase) for the winter period (
Table 2). Dispersion of the results was smaller than in the case of the VS1 and VS2 scenarios and amounted to 677%, and dramatic changes could be observed for the particular years (
Figure 4). For the summer period the extreme values were observed for 2002, and 2004, while the contrasting (lowest-highest) values were detected for 2007, and 2008. The average TN values showed an increase by 2220 kg/month (cv = 520%) for the summer period, and by 1841 kg/month (cv = 1742%) for the winter period. Additionally, in the case of the variant VS3 scenario, the trend has been preserved for most years. In the case of this scenario, however, there is a clear difference in the TN load values obtained for selected months compared to the VS0 scenario. For the 2014–2016 period highlighted in
Figure 4, the lowest TN load was about 4800 kg/month (September 2015), while the highest value (~107,000 kg/month) reached in January 2014. In comparison to the VS1 and VS2 scenarios, the difference between TN loads for summer and winter in the period 2014–2016 has even increased, being 26-times higher during the winter period.
5. Discussion
Introduction of the new NVZ approach in Poland is supposed to bring vast changes for the environment, but also for communities living from agriculture, which create an important part of the Polish society. After adoption of the new legislation Poland will become one large area of NVZ, which will result in additional restrictions that will apply to farmers in all regions of the country. These restrictions are meant to bring environmental benefits, however, conflict between this large and influential social group and the legislator are expected. Fear of additional costs related to the required farm investments, and an extra effort to put into fertilizer use, reporting, and management, has been already observed through the press and social media activity focused on agribusiness issues. Even a more explicit social response is expected from the areas assigned to the “pole of cold”, and “pole of heat”. It should be noted that restrictions related to the fertilizer use calendar will be imposed on farms based on administrative borders of communes, without recognition of the actual range of corresponding crops. Areas defined as the “cold pole”, especially in mountain areas (
Figure 1), are already less competitive compared to the rest of the country (poorer soil quality), therefore, introducing new regulations may further aggravate the current situation of farmers. Moreover, one should expect particularly strong social resistance related to the introduction of different regulations than in other parts of the country. The “pole of heat” areas will likely experience fewer conflicts, as farms located in this area will benefit from an extended period of fertilization. However, the overuse of fertilizers, exceeding the available dose, could be expected through the application time extension.
Despite, the possible social conflicts, the results obtained from the macromodel DNS/SWAT clearly show that restrictions imposed on farmers in the “pole of cold” areas will bring sound ecological effects. The simulations for the variant scenarios including conditions to be met in these regions show a noticeable reduction of the yearly TN load (8.61%, and 5.96% for the VS1, and VS2, respectively) in the pilot catchment. Since, the requirement of the fertilizer calendar shortening does not necessarily have to guarantee reduction of the total dose of the chemicals used in the catchments, then the second “pole of cold” scenario (VS2) should be considered as more probable. In the case of the pilot catchment, this scenario would result in an average decrease of the TN load by ca. 3000 kg/month. On the contrary, calculations for the “pole of heat” scenario (VS3) resulted in a distinct increase of the yearly TN load (43.69%) due to the extension of the fertilizer use period. Such an increase has to be considered as significant, especially taking into consideration that the size of the pilot catchment does not exceed 1620 km
2. For the catchment of the Warta River, located in the central part of Poland, with a size of 54,529 km
2 and where intensive agricultural activity is conducted [
36] (with ca. 12% of the total area belonging to the “pole of heat” area), such a level of increase would likely result in hundreds of thousands of TN (kg) surplus per month. However, it should be remembered that the studied Słupia River catchment does not belong to the pole areas, therefore, only general restrictions imposed by the NVZ’s new regulations will be introduced. Even in that case, the average TN load discharged into the Baltic Sea by this river (ca. 43,000 kg/month) should be reduced. Additionally, taking into consideration the presence of eight other small rivers in the Pomerania region with comparable catchments would bring a highly expected reduction of TN load discharged from Poland, from the point of view of pollution to the Baltic Sea. At this stage it is difficult to say whether the remaining catchments in this region will be comparable to the implementation of the new regulations, but it is nevertheless correct to assume that the TN load will be reduced throughout the area.
The justification of the obtained ecological results should be, however, discussed taking into consideration seasonal and yearly pattern of TN load changes. The significant differences between the winter and summer periods in the TN loads have been observed for the modelling results (VS0-3) at the study area. The summer TN loads in the Słupia River at the calculation profile of Charnowo were noticeably smaller (by average ca. 64% for all discussed scenarios) then the winter loads. This phenomenon, called a flattening phenomenon, has been observed in different catchments in Poland. It consists in periodic reduction of nutrient compounds released to surface waters, due to plant cover influence on retention of water and nutrients [
41]. Although, in the case of the performed simulations, this phenomenon was additionally altered through the changes in the fertilization period. Both circumstances contributed to the high values of result dispersion. The obtained values were at the level of 737–775% for the “pole of cold” scenarios, and slightly lower (677%) for the “pole of heat” calculations. With the latter value related most likely to the extension of the fertilization period in the VS3 scenario. These results confirm natural variability of the TN loads depending on the season of the year, which is characteristic for the majority of the catchments at this latitude. For example, the dispersion for the TN load for the already mentioned Warta River was at the similar level (ca. 674%).
As for the yearly pattern of differences, a large variability of the average TN loads has been observed even for the reference scenario (VS0). For this variant, the extreme TN load values were recorded in 2003–2005, and 2014 (
Table 2). To investigate this pattern, 1-min data from the Ustka meteorological station, located directly at the Słupia River catchment, were used. These data were calculated at the IMGW-PIB for the needs of the Polish Atlas of Rainfall Intensity (PANDa) currently being prepared by the RETENCJAPL [
42]. This information allowed identifying sudden short-term precipitation events and a frequency of their occurrence on particular days and months of the year. Detailed information was retrieved for the years where the extremely high or low values of the TN load reduction were observed in each season. Thus, the years of 2003 and 2005 were selected as charged with extreme values during the summer season (9850, and 38,604 kg/month, respectively, for the both “pole of cold” scenarios). While, 2014 and 2004 were bearing the extreme values for the winter period of VS1 and VS2 (24,486, and 98,720 kg/month, respectively). For these years the seasonal precipitation was examined at the Ustka station. The average annual rainfall for this station is quite high and fluctuates from 497 mm during the winter period to over 873 mm in the summer one, with the highest sums recorded from July to October (over 60 mm), and the smallest (below 40 mm) in January, and April. For the Ustka station, both 2003 and 2005 were classified as dry years. In 2003, heavy rain in the summer season was low, while the summer period of 2005 was extremely dry. On the other hand, from October to December numerous short-lived but intense rainfalls were noted. The years selected as extreme from the point of view of the TN load were considered as wet. The recorded rainfall data for 2004 clearly justifies the maximum TN load in the winter for this year. Heavy rainfalls had been occurring since September of that year. Conversely, the situation looked like in 2014 where, after intensive summer rainfall, there was a dry autumn and winter explaining the low TN load values for both VS1 and VS2. The similar analysis performed for the “pole of heat” scenario VS3 indicated years 2004 and 2002 as bearing the minimal and maximal TN loads (10,239 and 42,176 kg/month, respectively). The year of 2004, as already mentioned, was characterized by exceptionally low rainfall values during summer, with only precipitation that could have a significant impact on the surface runoff volume observed from September of this specific year. In turn, 2002 was full of numerous short-lived, but intense, precipitation during the summer months. For the winter period, the values of the minimal and maximal TN loads were observed in 2015 and 2008 (29,844 and 103,619 kg/month, respectively). Unfortunately, the data for 2015 is difficult to analyse, since they are very limited and do not allow establishing the relationship between the precipitation and TN load. As for 2008, numerous intense rainfalls from August to December were detected. There is no doubt that atmospheric precipitation, its frequency and intensity, are of great importance for the release of nutrients into surface waters. Throughout Poland signs of climate change and its impact on surface waters have been observed, and is increasing year by year. Increased frequency of extreme events, such as intense rainfalls, in turn, will lead to an increase in the amount of nutrients entering surface waters from areas used for agriculture [
43] and clearly should be taken into consideration while estimating the impact of the NVZ regulations.
The results obtained, although they should be treated as preliminary, indicate the positive environmental aspects of the implementation of the new NVZ action program. The introduction of additional restrictions and requirements to limit the release of nitrogen from agricultural sources to surface waters and further into the Baltic Sea will undoubtedly reduce excessive amounts of nutrients in the aquatic environment and dependent water by improving the functioning of ecosystems in the long term. While there is no doubt that any initiative aimed at improving the quality of the environment is extremely important, it is also necessary to remember about the social aspect which, if not well thought out already at the planning stage, can effectively hamper and sometimes even prevent changes. Already at the stage of strongly truncated social consultations and reactions of institutions representing the interests of farmers, it could be concluded that the new regulations will generate a very large number of conflicts between the legislator and farmers.
6. Conclusions
The current study made the first attempt to analyse an impact of the new action program aimed to reduce nitrogen pollution caused by agricultural sources in Poland. Implementation of the general requirements imposed through this program on the whole country will, unfailingly, bring benefits to the environment. However, their financial and organizational costs will likely meet discontentment from farmers, which is inevitable when one has to choose between the competitiveness of farms and the improvement of the state of the environment. In addition to these changes, more specific restrictions will be imposed on the territories designated for reduction or extension of the period when the use of nitrogen fertilizers is allowed.
To incorporate details of the stipulated changes in the fertilizer use calendar, the modelling approach was adopted. With the use of the macromodel DNS/SWAT the baseline model, and three variant scenarios, were created for the pilot catchment (Słupia River). The obtained results have shown that introduction of more rigorous restrictions on nitrogen fertilizer use would have a considerable impact on TN load reduction in the areas subjected to such changes (“pole of cold”). Therefore, the total load of nitrogen discharged from the Polish territory could be also reduced. However, the extension of the fertilizer use period will likely result in an increase of total nitrogen load released from the catchments located at the “pole of heat” region. The analyses described in the article have also confirmed the strong relationship of atmospheric precipitation with the amount of nutrients in surface waters. Climate change is becoming more and more visible throughout Europe, which will, inter alia, cause intensification of violent meteorological phenomena such as rapid rainfall. As a result, more and more nitrogen could be released from cultivated fields, through run-off to surface waters, causing algal blooms in water bodies, including the Baltic Sea. Therefore, new programs of measures limiting the use of nutrients are necessary.
The general questions, i.e., will the described changes in legislation help to improve the general quality of surface waters, and/or will the costs incurred as a result of these changes and conflicts between the legislator and the farmers be consequently considered to be profitable, are still premature and need to be answered. However, it must not be forgotten that any introduction of new legislations, especially those that cover the whole area of the country, require long and well-prepared social consultations and information programs, as well as transitional periods. Only the combination of these three elements could limit the aforementioned conflicts. At the same time, it must never be forgotten that farmers will face the main burden of these provisional implementations, and the role of the state, in addition to caring for the environment, should also be concerned for the competitiveness and good conditions of farms.


