Article

Healthcare Facility Location-Allocation Optimization for China’s Developing Cities Utilizing a Multi-Objective Decision Support Approach

College of Architecture and Urban-Rural Planning, Sichuan Agricultural University, Dujiangyan 611830, China
*
Author to whom correspondence should be addressed.
Sustainability 2018, 10(12), 4580; https://doi.org/10.3390/su10124580
Submission received: 1 November 2018 / Revised: 26 November 2018 / Accepted: 26 November 2018 / Published: 4 December 2018

Abstract

:
With rapid development of the healthcare network, the location-allocation problems of public facilities under increased integration and aggregation needs have been widely researched in China’s developing cites. Since strategic formulation involves multiple conflicting objectives and stakeholders, this paper presents a practicable hierarchical location-allocation model from the perspective of supply and demand to characterize the trade-off between social, economical and environmental factors. Due to the difficulties of rationally describing and the efficient calculation of location-allocation problems as a typical Non-deterministic Polynomial-Hard (NP-hard) problem with uncertainty, there are three crucial challenges for this study: (1) combining continuous location model with discrete potential positions; (2) introducing reasonable multiple conflicting objectives; (3) adapting and modifying appropriate meta-heuristic algorithms. First, we set up a hierarchical programming model, which incorporates four objective functions based on the actual backgrounds. Second, a bi-level multi-objective particle swarm optimization (BLMOPSO) algorithm is designed to deal with the binary location decision and capacity adjustment simultaneously. Finally, a realistic case study contains sixteen patient points with maximum of six open treatment units is tested to validate the availability and applicability of the whole approach. The results demonstrate that the proposed model is suitable to be applied as an extensive planning tool for decision makers (DMs) to generate policies and strategies in healthcare and design other facility projects.

1. Introduction

Sustainable urbanization has been raising living standards and enhancing household income tremendously. China’s government makes efforts to invest abundant funds to ensure healthcare insurance, and require health cost reductions to 30% by the end of 2018 [
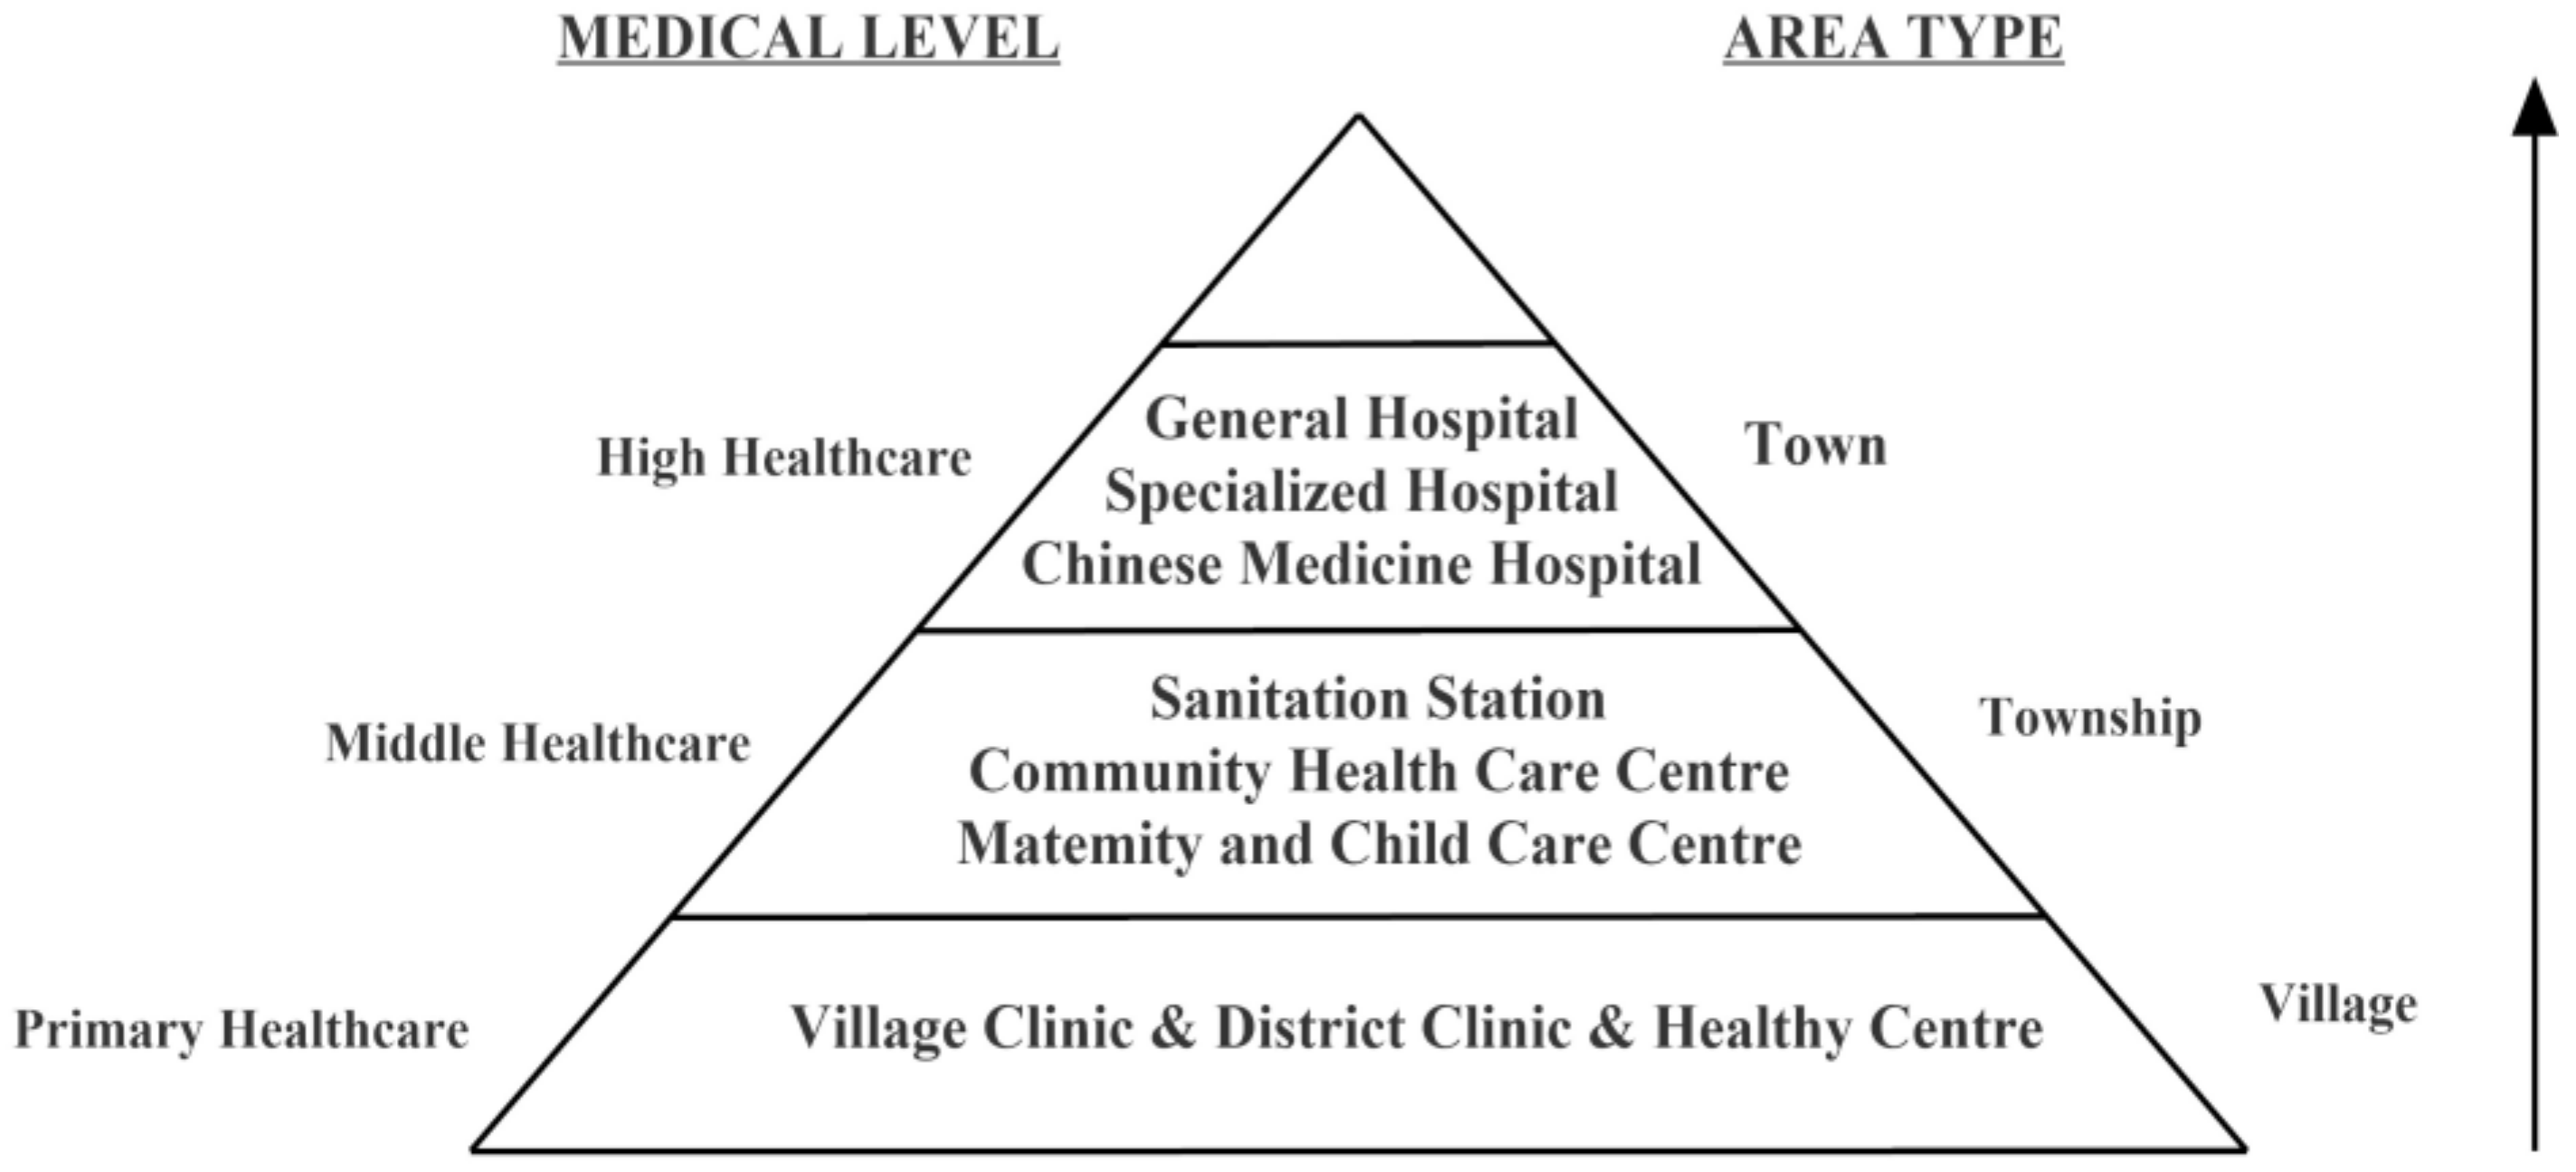
1]. On the basis of rural revitalization policy in China, the demand for rational and available healthcare facility planning has attracted widespread attention. One of the most crucial issues is to achieve high healthcare service quality in developing cities or rural areas, which contributes to a comprehensive understanding of the development process overall within the whole healthcare system. With the worldwide trend of tremendous population growth, diseases increasing and environmental degradation, healthcare facility location problems (HCFLPs) have become increasingly noticeable in human society [2,3]. Unreasonable and unconsidered healthcare facility (HCF) location will impede economic growth, as well as increase morbidity and mortality. In some developing cities, the treatment technology and medical equipment of most hospitals may not satisfy the rigid demand due to the lagging economy. Therefore, completing the basic healthcare services in rural and remote regions should be prioritized. As a vital element in strategic management, optimizing HCF location plays a significant role in decision making for private and public organizations such as schools, warehouses and retail stores [2]. Selecting appropriate positions is not only able to improve the service accessibility for patients, but also simultaneously enhance the service quality [4].
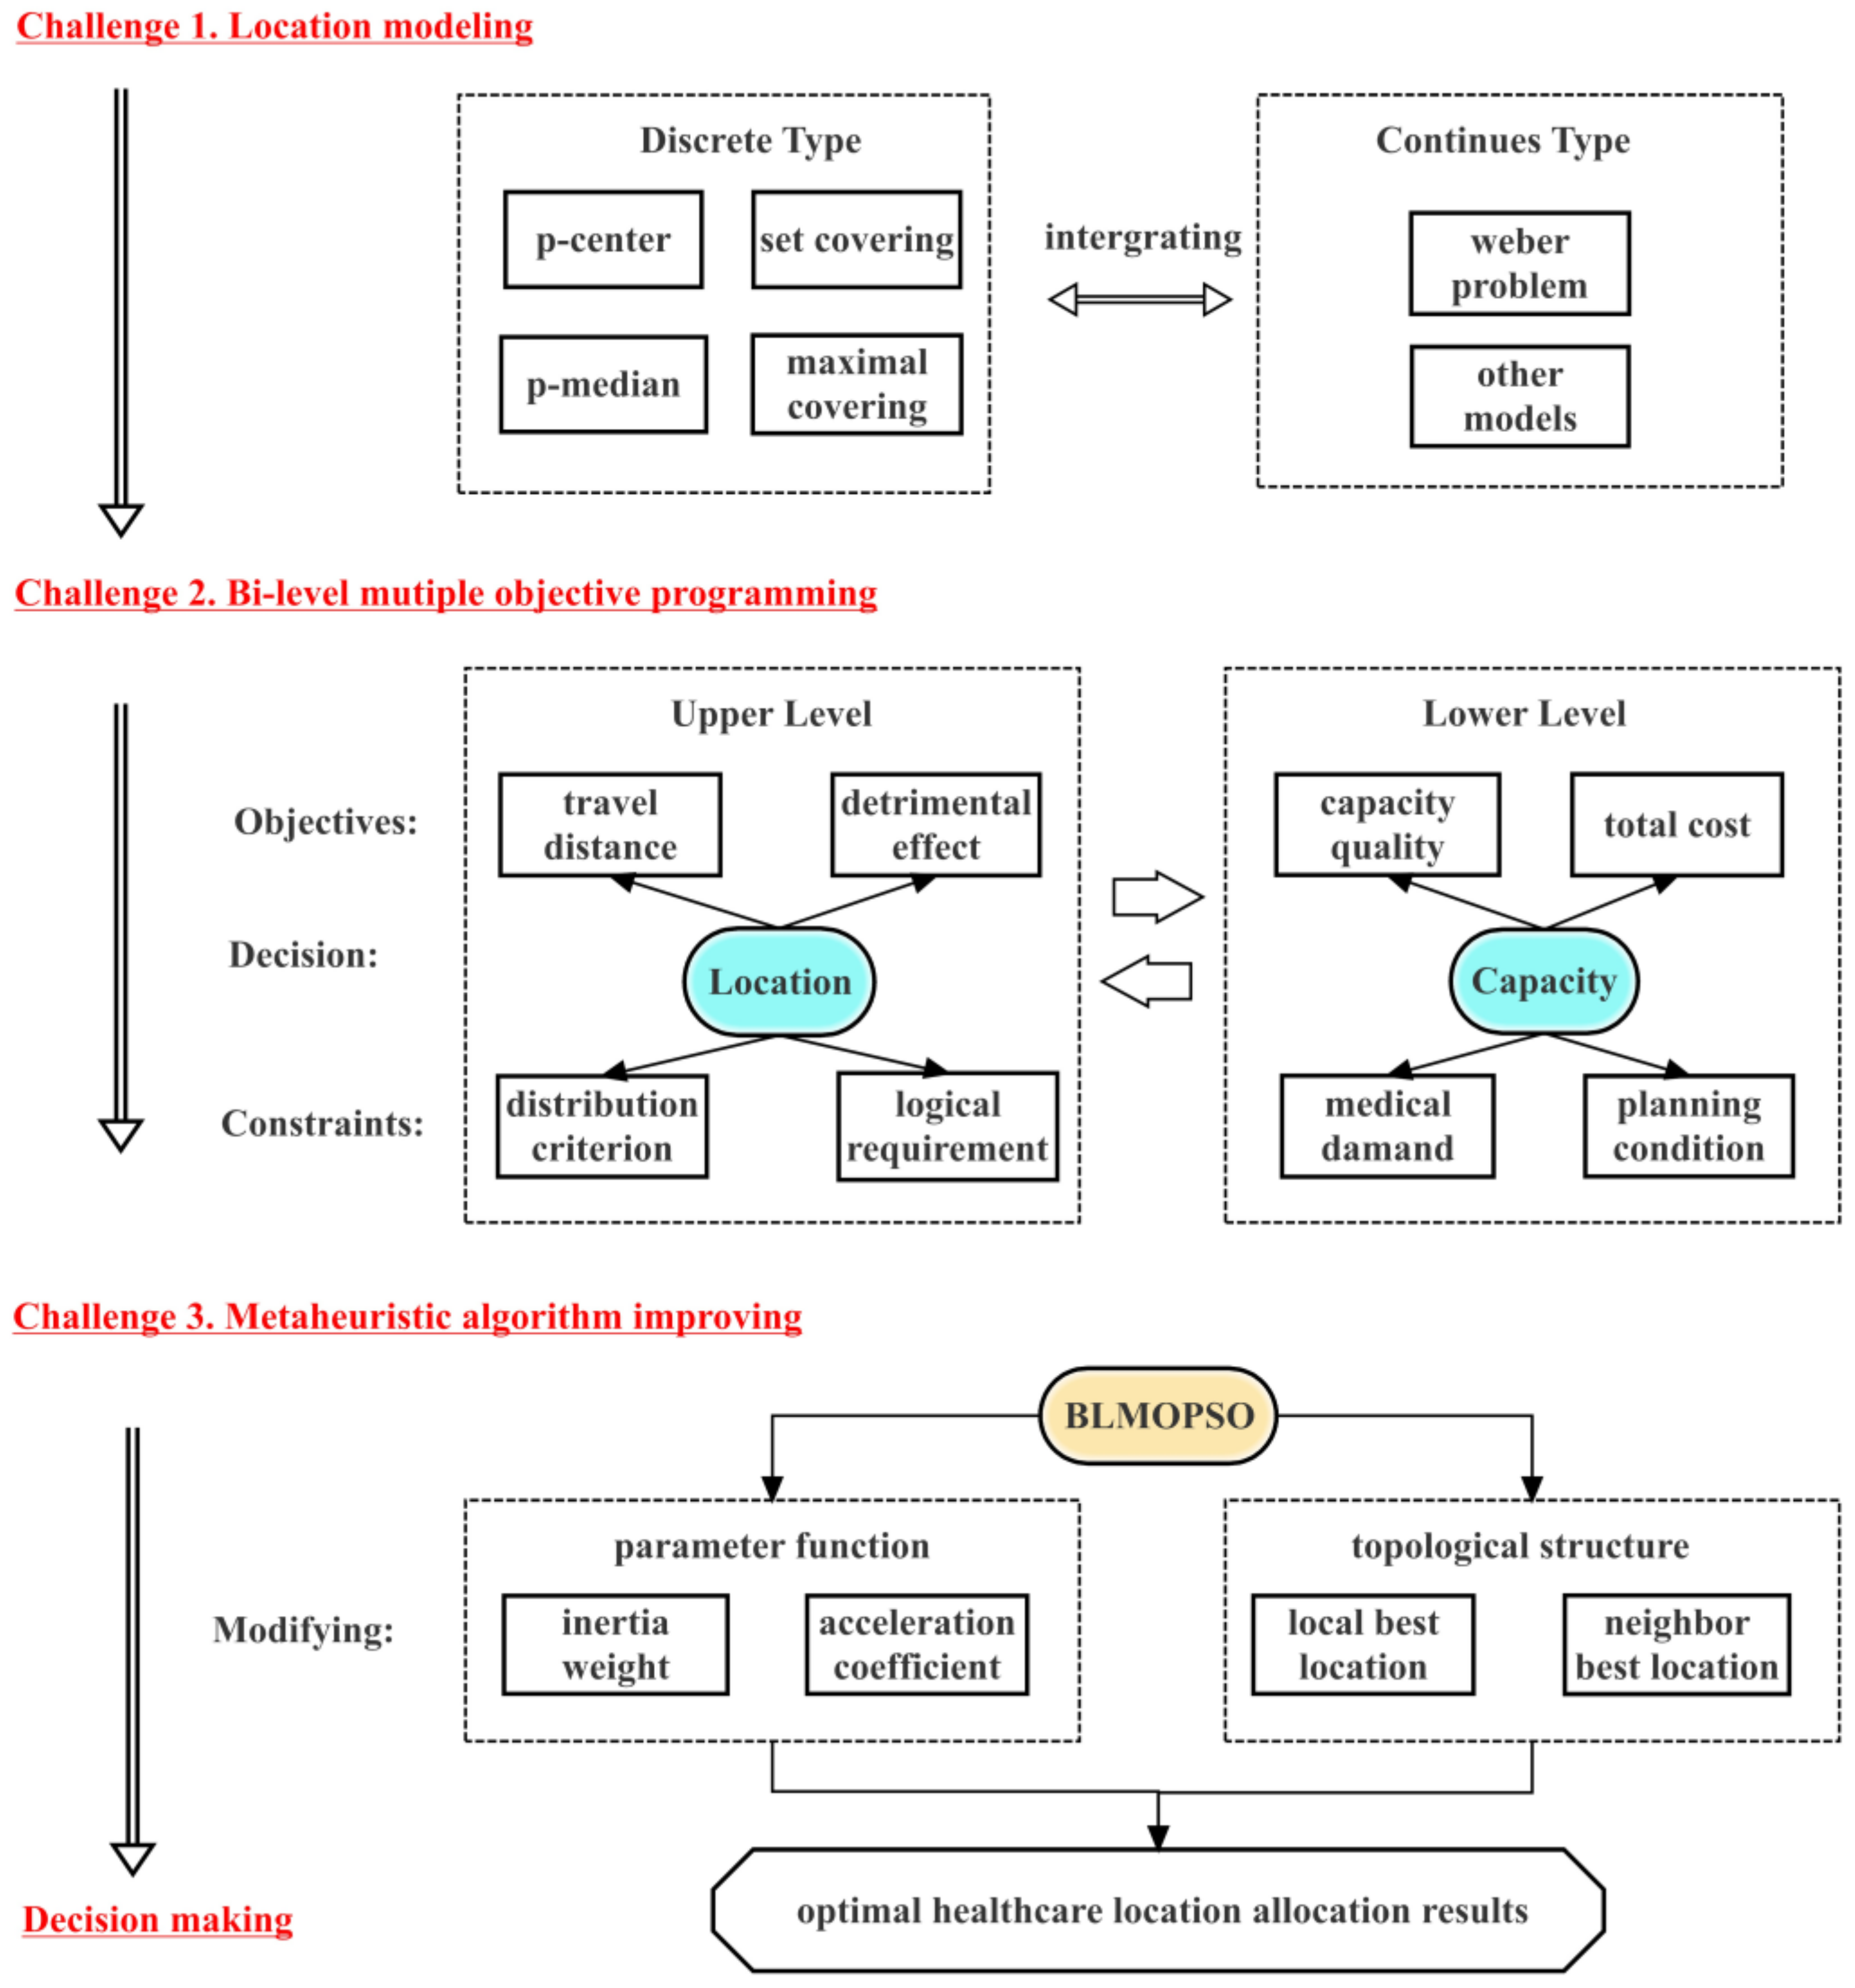
Furthermore, most scholars have been focusing on location assignment for health system but ignoring the significance of improving capacity. It is obvious that different stakeholders (i.e., suppliers and customers) have their preferential objectives in facility location problems (FLPs) [5]. Local governments generally expect to expand the scope of services to acquire higher social benefits, while the patients pursue greater capacity of each facility to obtain a better treatment environment. Thus, keeping the capacity in balance becomes a novel tendency in FLPs, which promotes availability gradually. Moreover, when generating healthcare planning strategy, decision-makers (DMs) will take numerous factors into account, such as travel distance, construction and management cost, transportation convenience, and capacity constraints [6,7,8,9]. Since these objectives often conflict with each other, a multiple objective decision making (MODM) approach is introduced to solve such a complex planning problem.
As the strategy horizon moves forward constantly, an uncertain environment needs to be taken into account for long-range planning [8]. In a realistic world, the decision making process in a medical system involves a degree of uncertainty [10]. For instance, there is probability between medical demand and cost, which leads to distinct optimal solutions. Combined with the aforementioned objectives, the computational procedure of this Non-deterministic Polynomial-Hard (NP-hard) problem becomes extraordinary sophisticated and diverse. To solve this problem, particle swarm optimization (PSO) algorithm is introduced to find optimal solutions due to its fast convergence and effective search ability [11]. The PSO algorithm has been proved to successfully find optimal solutions under complex continuous search spaces. Although it does not guarantee optimality, it is appropriate for the current application [12].
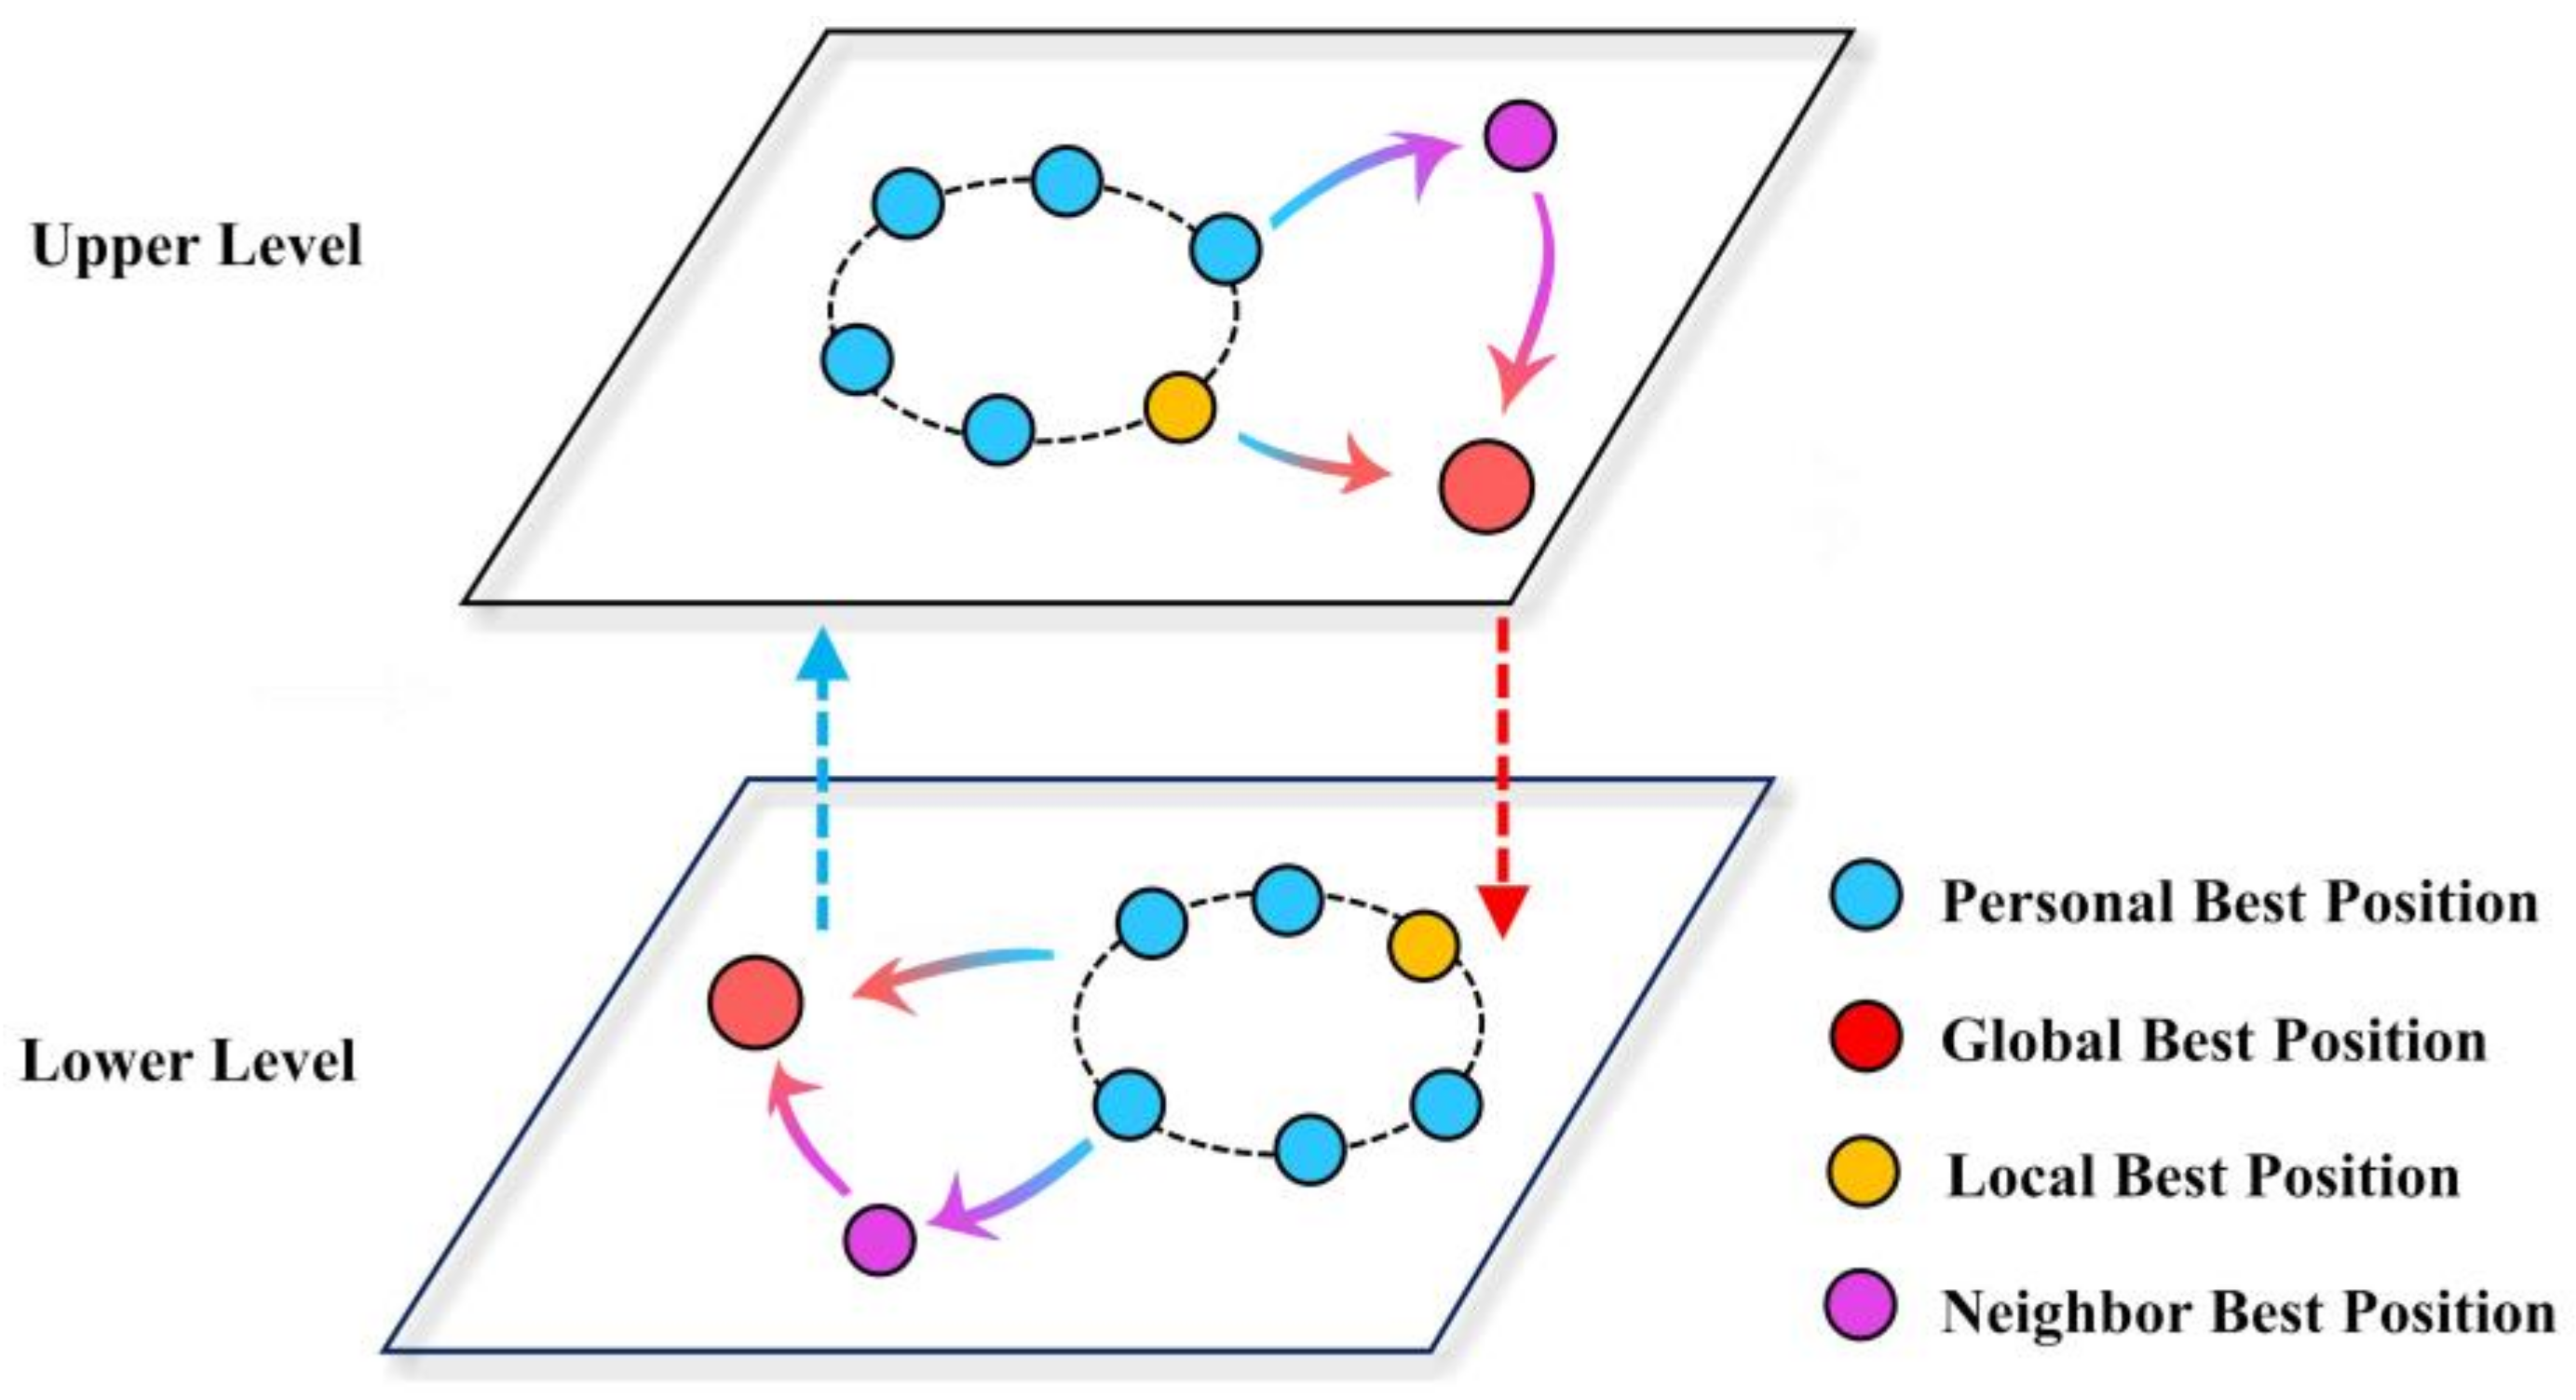
In general, this study aims to find applicable location-allocation solutions in uncertain environment, which plays a critical role to ensure access to public facilities and personal demands. Bi-level multiple objective programming is introduced to determine location and capacity distribution concurrently. In addition, a modified PSO algorithm is utilized to equilibrate the trade-off between complicated and multidimensional objectives. The eventual optimal results are reflected as two aspects: introduce new facilities and upgrade existing capacities.
The remainder of this paper is organized as follows: Section 2 analyzes the current researches and Section 3 describes the main problems in healthcare system. In Section 4, the modeling process and algorithm application are introduced in detail. Following this, Section 5 provides a numerical example to validate the availability and applicability of our approach. Finally, Section 6 gives the conclusions and future research directions.

2. Literature Review

Research in healthcare strategic planning involves various aspects like location and capacity allocation. Plenty of scholars make efforts to do independent but complementary research on healthcare systems. The literature we have reviewed can be classified in four parts: (1) healthcare facility location problems; (2) MODM methods; (3) uncertainty analysis; (4) meta-heuristic algorithms.

2.1. Healthcare Facility Location Problems

In the field of healthcare, illogical HCF location decisions have multiple negative effects on society rather than one single effect [2]. An inaccessible HCF is more likely to increase the risk of morbidity and mortality, as well as provoke public discontent. Therefore, facility location-allocation modeling has become crucial. The hierarchical components of healthcare facilities in urban and rural regions are organized quite different. The delivery system of developing cities is relatively independent and have informal institutions compared with the national standard. According to the National Bureau of Statistics, the local Sanitary Bureau in China, and a literature summary, the healthcare system in developing cities is composed of three hierarchies: primary, middle and high [13,14]. The primary healthcare is a village-based management that cures the basic minor ailments in village regions, including Village Clinics, Healthy Centre and District Clinics. The Community Health Care Centre, Matemity and Child Care Centre, and Sanitation Station set up in townships provide middle healthcare to satisfy most residents in a township. Furthermore, the high-level system is able to conduct more comprehensive treatment for patients with serious illness. These facilities can be defined as General Hospitals, Chinese Medicine Hospitals and Specialized Hospitals. The three levels of public healthcare system in rural areas are summarized in Figure 1.
Previous research discovered that the poor location, inadequate supply or excessive capacity can aggravate the cost burden [9]. Thus, four well known location-allocation models have been studied: the p-median location problem, p-center location problem, set covering location problem, and maximal covering location problem [2,15,16,17,18,19,20]. Hakimi [17] firstly proposed the concept of p-median to minimize the total transport distance and cost between the demand points and selected facilities with fixed quantity. The p-center problem, also known as the minmax problem, is raised to minimize any demand points served by the nearest facility. Toregas et al. [20] introduced the set covering problem aiming to minimize the total facility number or allocation costs to cover all of the demand points. Church and Revelle [15] presented the maximal covering problem which focused on satisfying as many demand points as possible on the premise of constant facility number. In another study, the continue facility location problem, known as multi-source Weber problems, have also been well studied in FLPs. Venkateshan et al. [21] considered the continuous Euclidean space as an essential element when addressing the trade-off between multiple stakeholders in a Weber problem. Drezner et al. [22] denoted the most common objective in a classic Weber problem is to minimize the weighted sum of Euclidean distance between facility and demand points. Uno et al [23] regarded the uncertainty and vagueness as other important factors in a Weber problem when they find an optimal facility location with weighted distance. Unlike the discrete location models, this type of optimal model can select any location within a path or area as a candidate point [18]. In summary, DMs should choose specific location model with different sources constrained.

2.2. Multiple Objective Decision Making (MODM) Methods

In reality, numerous approaches have been utilized to solve FLPs (Table 1). Multiple objective optimization as a representative branch in mathematical programming, can be adapted to all kinds of location problems. There is a tendency that a growing number of decision makers prefer to pursuing multiple objectives in a realistic world. For instance, Farahani et al. [24] determined that the location of HCFs should consider both cost minimization and service availability maximization objectives to serve the patients efficiently. Ye and Kim [25] reduced the construction cost and maximized service coverage to ensure the total demands within limited facility capability. Syam and Côté [26] regarded the treatment cost and the facility size as equally momentous targets for non-profit service organization. Schuldt et al. [27] uncovered the consumers with distinct complication rates to affect hospital choice by their preferences. Whatever the purpose they contribute to, the ultimate result is to obtain the supreme social-economical-environmental benefits. Therefore, a MODM approach is introduced to balance tradeoffs between multiple objectives effectively. This method can provide a set of pareto solutions understood as parallel scenarios (i.e., spatial distribution and capacity allocation) by comparing the value of each objective. All pareto solutions are superior to the rest of the solutions when all objectives are considered but are inferior to others in only one or more objectives [28,29]. As a result, DMs can select proper scenarios from the pareto plans based on their preference to support their further decisions. Moreover, based on practical consideration, heterogeneous participants affect the determination in HCFLPs [9]. That is to say, choosing an appropriate facility location is depended on not only governments’ strategies but also patients’ behavior. Consequently, it is suitable to combine MODM method with multilevel programming to undertake planning research.

2.3. Uncertainty Analysis

The location-allocation strategy cannot ignore uncertain elements [31]. Although the traditional deterministic location model can process the statistical and empirical data sufficiently, it falls short in the handling capacity under probabilistic or probable situations. Zarrinpoor et al. [31] proved that environmental uncertainty such as economic structure upgrade, climate change and population migration, will definitely influence human behavior and lead to random demands. Mestre et al. [8] discovered that there are few stochastic location models for a healthcare system focus on uncertainty analysis, and they considered different uncertainty assumptions in real-world applications. In a healthcare system, the treatment demand is seriously impacted by resident population and incidence rate, which make requirements for doctors or sickbeds more flexible. Furthermore, some indescribable or ambiguous information such as satisfaction degree, service quality and operating cost, will also lead to distinction in allocation schemes. Accordingly, considering both fuzzy and stochastic factors has the advantage of simulating actual scenarios.

2.4. Meta-Heuristic Algorithm

Establishing HCF location model requires multiple objective and constraint functions, as well as intricate binary variables. For example, the continuous coordinate will generate numerous possible solutions due to its alterable values. HCFLP is studied as a NP-hard problem, requiring a tremendous amount of calculation as the scale of problem increase [2], especially under the strategic background of healthcare planning. The existing exact algorithms often calculate the location model beyond an acceptable time, and lose accuracy when they encounter a considerably large number of instances. In order to efficiently solve such complex problems generated from multiple objective programming and other computational issues, meta-heuristic algorithm such as a genetic algorithm [16], Lagrangian relaxation [32], simulated annealing [2], and PSO [33] have been widely studied in recent years.

3. Problems Description and Framework

3.1. Challenge Description

According to the literature review, we have summarized three main challenges to overcome: (1) selecting befitting location model; (2) searching available multiple objectives; (3) employing an effective intelligence algorithm.
Challenge 1. Location model:
Currently, the most popular facility location models can be definitely divided into two categories: discrete location model and continuous model. The discrete model ordinarily selects appropriate geographic position within limited candidate locations, while the continuous model allows the facilities constructed anywhere in the feasible areas [34]. With reference to Ahmadi-Javid et al. and Güneş et al. [2,19], the covering-based models are representatively suitable for healthcare facilities. Moreover, the location models that we studied belongs to the type of binary integer programming [35]. This kind of variable can act as a control switch determining whether the healthcare units can be set up in a potential position. In this paper, with previous status analysis, two types of models are combined to provide a universally applicable theory. It is noteworthy that if a constrained position can be shrunk to some tiny point, the continuous variables can be discretized.
Challenge 2. Multiple objectives:
The objectives in HCFLPs may often be conflicting due to external and internal factors. Table 2 summarized the most frequent factors bases on the literature we studied. Obviously, most of scholars pay more attention to travel distance and facility costs, which belong to the component of social and economic benefit. An increasing number of customers concentrate on service quality when they choose a hospital. Although most optimal goals focus on balancing the trade-off amongst the previous aspects, to the best of our knowledge, few scholars attach importance to the essentiality of environmental factors. In addition, healthcare capacity (i.e,. number of beds) has indirectly impacted on patients’ consumption behavior in the service industry [36]. That is to say, the facility capacity should also be regarded as object variables rather than just constraining the condition. Consequently, this study utilizes the MODM method to establish a bi-level structural model based on the economic–social–environmental perspective. For each hierarchy, the upper-level addresses the HCF location-allocation problem while the lower-level adjusts the capacity scale.
Challenge 3. Optimization algorithm:
The MODM approach will provide decision makers with a set of non-dominated points, also known as pareto solutions [37]. For the solutions on a non-dominated frontier, none of the objective function values can be improved without degrading one or more of the other objective function values. Moreover, for any given multi-objective problem, the challenge is to find a representative subset of pareto optimal solutions. Many HCFLPs involve a set of non-dominated points that may include a very large number of feasible points. To solve this problem, the PSO algorithm is capable of searching the practical equilibrium between the conflicting objectives in an uncertain environment. This meta-heuristic algorithm can dynamically alter the HCF location and capacity, even meet the worst-case scenario [8].

3.2. Research Framework

The framework of healthcare facility location-allocation optimization for developing cities in China can be shown in Figure 2.

4. Materials and Methods

4.1. MODM Programming

Due to the conflict relationship among the objectives, this research proposes a bi-level multiple objective programming from the perspective of suppliers and customers. On one hand, the upper-level (i.e., dominant layer) integrates continuous and discrete location models to determine the potential location of HCF, improving service quality, reducing facility costs, and promoting environmental benefits. On another hand, the lower-level (i.e., the subordinate layer) determines the capacity requirement according to the optimal locations. Equation (1) describes the integrated mathematical model.
min F 1 : S = i I j J ( P i j × d i j × x i j ) min F 2 : L = ( α 1 × t a T A ϕ t a × ( x e A T e t a ) 2 + ( x n A T n t a ) 2 + α 2 × q a Q A φ q a × ( x e A Q e q a ) 2 + ( x n A Q n q a ) 2 ) × y j s . t . j J x i j = 1 ; i I j J y j = 1 x e R + x n R + x i j { 0 , 1 } ; i I ; j J y j { 0 , 1 } ; j J max G 1 : S = j J ( k j i I d i j ) × y j min G 2 : C = j = 1 J ( ( B P × B A × k j + R P × R A × k j ) × y j + ( ( k j E C j ) × ( η ˜ 1 + S P × A V + ( 1 S P ) × A V ) ) × z j ) s . t . z j { 0 , 1 } ; j J k j i I ( P i j × x i j ) ; j J j J k j T P k j R +
where the first two objectives F1 : S and F2 : L represent the social and environmental benefits, which are established from the perspective of customers. The objectives of G1 : S and G2 : C based on the suppliers’ angle pursue social and economic benefits respectively. The detailed description of each function is stated below.

4.1.1. Upper-Level Programming: Objective Functions

HCFs act as public service facilities, providing an applicable and comfortable environment for patients. The medical demand expects to be assigned to the closest open facility, as well as a peaceful recovery condition [39]. Hence, this research considers two conflicting objectives on the upper-level to realize location optimization: (1) minimize the anticipant travel distance to reach HCF; (2) minimize the detrimental effect to provide a tranquil medical environment.
The most common optimization criteria are the travel distance and travel time, which are dominated by the “cost” of the patient’s arrival at the hospital [40]. The patients usually expect to seek the nearest hospital with an eligible department. In the current study, the Euclidean distance has been widely used to measure social impact as it is constant over time [19]. It is a straight line between the patients’ individual addresses and potential facility sites. Moreover, the patient demand and disease incidence in a practical sense are not accurate variables. They are uncertain and are probabilistically influenced by external and physiological factors. According to Jia et al. [4] and Wei et al. [41], the stochastic treatment demand is given as follows:
P i j = R i × Pr i j × ξ ˜
Pr i j = k j d i j j J ( k j d i j )
d i j = { ( x e F e i ) 2 + ( x n F n i ) 2 , x i j = 1 0 , x i j 1
where P i j = customer demand (i.e., patient number); R i = residents’ number at site i ; Pr i j = probability of a patient travelling to a facility j ; ξ ˜ = disease incidence, which is a random variable; k j = facility capacity (i.e., number of sickbeds); d i j = Euclidean distance (dominated in kilometers in this paper) between resident site i and facility j ; x e and x e = candidate facility location, which represent the coordinate of east longitude and north latitude; F e i and F n i = coordinate of patient site; x i j = 1 means demand i is assigned to facility j .
Therefore, the first objective for social benefit can be described by Equation (5), which minimizes the overall travel distance for all patients:
min F 1 : S = i I j J ( P i j × d i j × x i j )
where F 1 : S = service objective, considering the total travel distance in an uncertain environment. The value of ξ ˜ is set as uniform distribution.
In the view of the location criteria, the public HCFs are supposed to be built in a relatively quiet environment to provide favorable conditions for local patients. Tumultuous surroundings such as a vegetable market, commercial centre and construction site will no doubt impede recovery. Moreover, the location of HCFs should be adjacent to a convenient arterial road in cased of unexpected emergencies. Congested traffic cannot ensure a timely rescue, which probably increase the morbidity and mortality of the sick. Thereby, it is necessary to provide a better therapeutic environment for patients’ care and incorporate it into the optimal model.
min F 2 : L = ( α 1 × t a T A ϕ t a × ( x e A T e t a ) 2 + ( x n A T n t a ) 2 + α 2 × q a Q A φ q a × ( x e A Q e q a ) 2 + ( x n A Q n q a ) 2 ) × y j
where F 2 : L = location objective, considering the environment elements; α 1 and α 2 = weight for two types of condition; ϕ t a = weight for traffic advantage area; A T e t a and A T n t a = coordinate of traffic advantage area; φ q a = weight for quiet area; A Q e q a and A Q n q a = coordinate of quiet area; y j = 1 represents a new facility will be built at site j .

4.1.2. Upper-Level Programming: Constraints

First, we assume each demand point is served by just one facility in the cities with a dispersed distribution of population.
j J x i j = 1 ; i I
x i j { 0 , 1 } ;       i I ;     j J
Second, the binary decision variable represents whether the facility should be located at site. In order to decrease the building costs, this research assumes only one new facility will be set up.
j J y j = 1
y j { 0 , 1 } ; j J
At last, it is clear that the optimal location should be positive.
x e R + ; x n R +

4.1.3. Lower-Level Programming: Objective Functions

Other than the location-allocation assignment, the performance of a healthcare system likewise relies on the capacity of these facilities [25]. Decision making for capacity is promoted by perspective on resource constraints [9]. Thereby, adjusting the capacity structure (i.e., number of sickbeds) plays a significant role in providing an effective medical service. An eligible facility is supposed to have adequate capacity to satisfy medical demand as well as guarantee the fundamental requirements. On the one hand, superabundant doctors and sickbeds will result in resource waste. On the other hand, if the facility service exceed the threshold limit, the patients will feel discontented when meeting service delays, reduced diagnosis time, etc. Consequently, low-level programming modifies the facility capability involving two contradictory objectives: (1) maximize the capacity quality for patients; (2) minimize the total cost for governments.
Abundant capacity ensures a healthcare system’s service quality and provides reasonable distribution of public funding [41,42]. The general criterion of measuring capacity is to estimate the number of sickbeds [9]. Furthermore, local governments expect to assign as many patients as possible to improve service quality. Thus, the service capacity is profoundly affected by the decision variables on the upper-level programming.
max G 1 : S = j J ( k j i I d i j ) × y j
where G 1 : S = social objective, considering the facility capacity.
In addition, developing cites with a lagging economy and restricted healthcare resources not only need accessibility in a healthcare system, but also pursue the minimum financial budget for government. Landa-Torres et al. [43] found that constructing and managing a new public facility is linearly dependent on capacity. Güneş and Nickel [9] believed that facility capacity can be regarded as decision variables associated with building cost in an optimal model. If too many sickbeds are allocated, the maintenance charge will go up, whereas deficient capacity is unable to meet a satisfactory standard [25]. Choosing the proper quantity of sickbeds is crucial to guarantee the optimal capacity and minimize the total costs. Therefore, the second objective on the lower level is to reducing the total costs, including building costs, expansion costs and operating costs [29,42].
min G 2 : C = j = 1 J ( ( B P × B A × k j + R P × R A × k j ) × y j + ( ( k j E C j ) × ( η ˜ 1 + S P × A V + ( 1 S P ) × A V ) ) × z j )
where G 2 : C = economic objective, considering removal, expansion and operations management; B P = building price; B A = unit building area; k j = facility capacity (i.e., number of sickbed); R P = rental price; R A = unit rental area; E C j = existing capacity; η ˜ 1 = sickbed price, which is considered as fuzzy variables; S P = proportion of senior doctor to patient; A V = average wage of senior doctor; A V = average wage of ordinary doctor; z j = 1 represents k j E C j . In addition, the unit of price used in this paper is the CNY, and the unit of acreage is square meters.

4.1.4. Lower-Level Programming: Constraints

First, the expansion costs in Equation (13) will be calculated when the prospective sickbeds exceed the existing capacity.
z j { 0 , 1 } ; j J
Second, the number of sickbed for each hospital should satisfy overall patients in covered residential areas [43].
k j i I ( P i j × x i j ) ; j J
Third, the total capacity should be able to accommodate all of the patients.
j J k j T P
where T P = total patients.
At last, the capacitance range of each hospital should not be negative.
k j R +

4.2. Particle Swarm Optimization (PSO) Algorithm for Healthcare Facility Location Problems (HCFLPs)

4.2.1. Bi-Level Multi-Objective Particle Swarm Optimization (BLMOPSO)

PSO is an evolutionary computation algorithm inspired by the food-seeking behavior of birds and social co-operation of fish, initially developed by Kennedy and Eberhart [44]. It has been resoundingly utilized to solve complicated problems with multiple objectives. Due to merits of a simple control structure and few variables, the PSO is able to produce effective results within a short time to determine appropriate locations. It can search sets of pareto solutions in a complex and stochastic environment to provide various scenarios for decision making. With reference to [45,46], many works based on PSO have been modifying this meta-heuristic algorithm. For instance, Ye et al. [47] adjusted the topologies to control the searching mechanism and maintain optimal diversity. Peng et al. [48] modified the inertia weight to balance both the exploration and exploitation ability of PSO. Wang et al. [49] revised the searching mechanism by considering the individual’s neighborhood to adjust the velocity of the particles. The adjustments of these researchers can be classified into three aspects: parameters, topologies and searching strategies. For detail, the inertia weights and constriction factors enhance both global and local search, and the acceleration coefficients are able to achieve better stability. Furthermore, the topology structure leads to variants of the algorithm, which ensures the diversity of the optimal solutions. At the same time, the hybridized PSO aims to implement the target of exploration and exploitation by integrating different character of other algorithms. The conventional variants or specializations are summarized in Table 3.
In order to avoid premature convergence and increase the diversity of the optimal results, modifying the topology structure is an appropriate measure and has been widely used in the development of PSO. Prakash et al. [57] introduced a fitness predator optimizer to provide more optimal in multi-objective programming. Marinakis [58] developed an expanding neighborhood topology PSO algorithm to solve a discrete location routing problem. Therefore, this paper proposes the BLMOPSO, modifying two aspects (i.e., parameter function and topology structure), to increase the global searching ability based on the characteristic of a master–slave equilibrium optimization model. The particle updating mechanism is described in Figure 3, which enhances accuracy and robustness while reducing computation time. The optimal results can be divided into two sets of non-dominated solutions for heterogeneous agents (i.e., government and patient) respectively to provide diverse strategies in HCFLPs.

4.2.2. Overall Procedure of the Proposed Algorithm

The procedure of the proposed algorithm is shown in Figure 4 including 10 steps.
  • Set the parameters in the upper-level programming, including swarm size, particle position and velocity, iterations, inertia weights, acceleration coefficients and random variables ξ ˜ .
  • Update the control parameters and compute the fitness values of two upper-level objectives.
  • Estimate and replace the upper-level pareto solutions.
  • Obtain the p b e s t s , g b e s t s , l b e s t s , n b e s t s through the aforementioned approach.
  • Set the similar type of parameters as step 1 on the lower level, and generate fuzzy variables η ˜ based on confidence levels α .
  • Renewal the correlative parameters on the lower level.
  • Compute the fitness values by incorporating solutions from upper level.
  • Obtain the p b e s t s , g b e s t s , l b e s t s , n b e s t s on the lower level.
  • Check the lower level termination: if the algorithm acquires the best solution or met the maximum iteration, stop the lower level program. Otherwise, go back to Step 6.
  • Check the BLMOPSO termination: if the algorithm gains the appropriate Pareto solutions or met the maximum iteration, then stop the BLMOPSO procedure. Otherwise, go back to Step 2.

4.2.3. Solution Representation

The particle swarm contains a range of particles with multiple dimensions, and each of them represents a potential optimal solution. Accordingly, the potential solutions on the upper level are x e and x n (i.e., HCF location) combining the coordinates of latitude and longitude, while k j = ( k 1 , k 2 , ... , k J ) T are the sickbed number on behalf of facility capacity obtained by the lower level.

4.2.4. Parameter Setting

On the basis of Kennedy and Eberhart, and Gan et al. [59], initializing the control parameters is the critical step to ensure desired algorithmic outcome. The indispensable variables are set up as follows: first, Set s ( s = 1 , 2 , ... , S ) particles with h ( h = 1 , 2 , ... , H ) dimension. Second, restrict inertia weight in [ ω min , ω max ] , personal acceleration coefficient in [ c p m i n p m a x ] , and global acceleration coefficient in [ c g m i n g m a x ] . Third, initialize the local best acceleration constant c l , and near neighbor best acceleration constant c n . Last, generate the velocity v s h within the range of [ v m i n m a x ] , and position x s h within the allowed coordinate scope. Notably, all content types of parameters in the lower level are set to the same in the upper level.

4.2.5. Particle Evaluation

The proposed technique requires the algorithm tocompare and analyze the fitness value iteratively to obtain the pareto solutions. Thus, it is necessary to utilizing appropriate method to evaluated the entire particle in each iteration. According to [59], the evaluation process is depicted in detail as follows: First, putting x s h ( τ ) into objective functions F 1 : S , F 2 : L , G 1 : S and G 2 : E , and calculating the fitness values F i t n e s s ( x s h ) respectively. Second, using the pareto archived evolution strategy procedure and test procedure (refer to [59]) to obtain the p b e s t s , which represents the effect of personal experiences. For each group, employing the same approach can select the l b e s t s to expand local searching ability. Third, applying the roulette to acquire the g b e s t s , which represents the social component. Fourth, computing the local fitness value | F i t n e s s ( x d h ) F i t n e s s ( x s h ) | | x d h x s h | ( | x d h x s h | is the Euclidean distance between particle and its d t h neighbor) in each group, and regard the maximum as the n b e s t s to increase particle diversity. After several iteration calculations, the final results can provide DMs with a set of preferential and appropriate solutions.

4.2.6. Particle Updating

In order to improve the convergence of the algorithm, Zhang et al. [60] introduced a time-variant adjustment strategy for the major parameters, which is given as follows. The inertia weight ω affects the current velocity of a particle by controlling the influence of previous velocity. The growing value of ω assists the swarm to broaden its exploration, and the decrease value of ω motivates it to enhance its exploitation. Thus, the earlier stage of iteration should maintain a large liner weight to ensure the particle searching thoroughly. When the majority of solution spaces have been explored, the inertia weight needs to be slowed down in order to find a better result. According to this renewed mechanism, the ω for iteration τ is updated by the following:
ω ( τ ) = ( ω m a x m i n × τ τ m a x m i n )
where ω is restricted in range [ ω m i n m a x ] , and τ m a x is the maximum iteration.
The acceleration coefficients c p and c g have momentous influence on searching ability. The lager c p facilitates emanative search while the small c g improves partially converge. The two parameters are updated by the following:
c p ( τ ) = ( c p m a x p m i n × ( τ m a x ( ) ) τ m a x + c p m i n )
c g ( τ ) = ( c g m a x g m i n × τ τ m a x + p m i n )
where c p and c g are limited in the interval to avoid premature convergence as well.
In order to make the optimal solution become more diverse, a variant topology structure is developed by adding two novel cognitive experiences, which decrease the effect of the social collaboration process. The velocity and position are updated by the following:
v s h ( τ + 1 ) = ω ( τ ) v s h ( τ ) + c p ( τ ) u r [ ψ p s h x s h ( τ ) ] + c g ( τ ) u r [ ψ g s h x s h ( τ ) ] + c l u r [ ψ l s h x s h ( τ ) ] + c n u n [ ψ l s h x s h ( τ ) ]
x s h ( τ + 1 ) = x s h ( τ ) + v s h ( τ + 1 )
The velocity update function of a particle is composed of five parts. The first three parts ω ( τ ) v s h ( τ ) , c p ( τ ) u r [ ψ p s h x s h ( τ ) ] and c n u n [ ψ l s h x s h ( τ ) ] are the traditional direction memories, which represent the original experience, the personal experience and mutual cooperation experience, respectively. The new part c l u r [ ψ l s h x s h ( τ ) ] called the local cognitive indicates a pareto solution generated by an adjacent subswarm of a particle. Moreover, the neighbor cognitive c n u n [ ψ l s h x s h ( τ ) ] represents the major variety comparing a particle with its neighbors.

5. Case Study

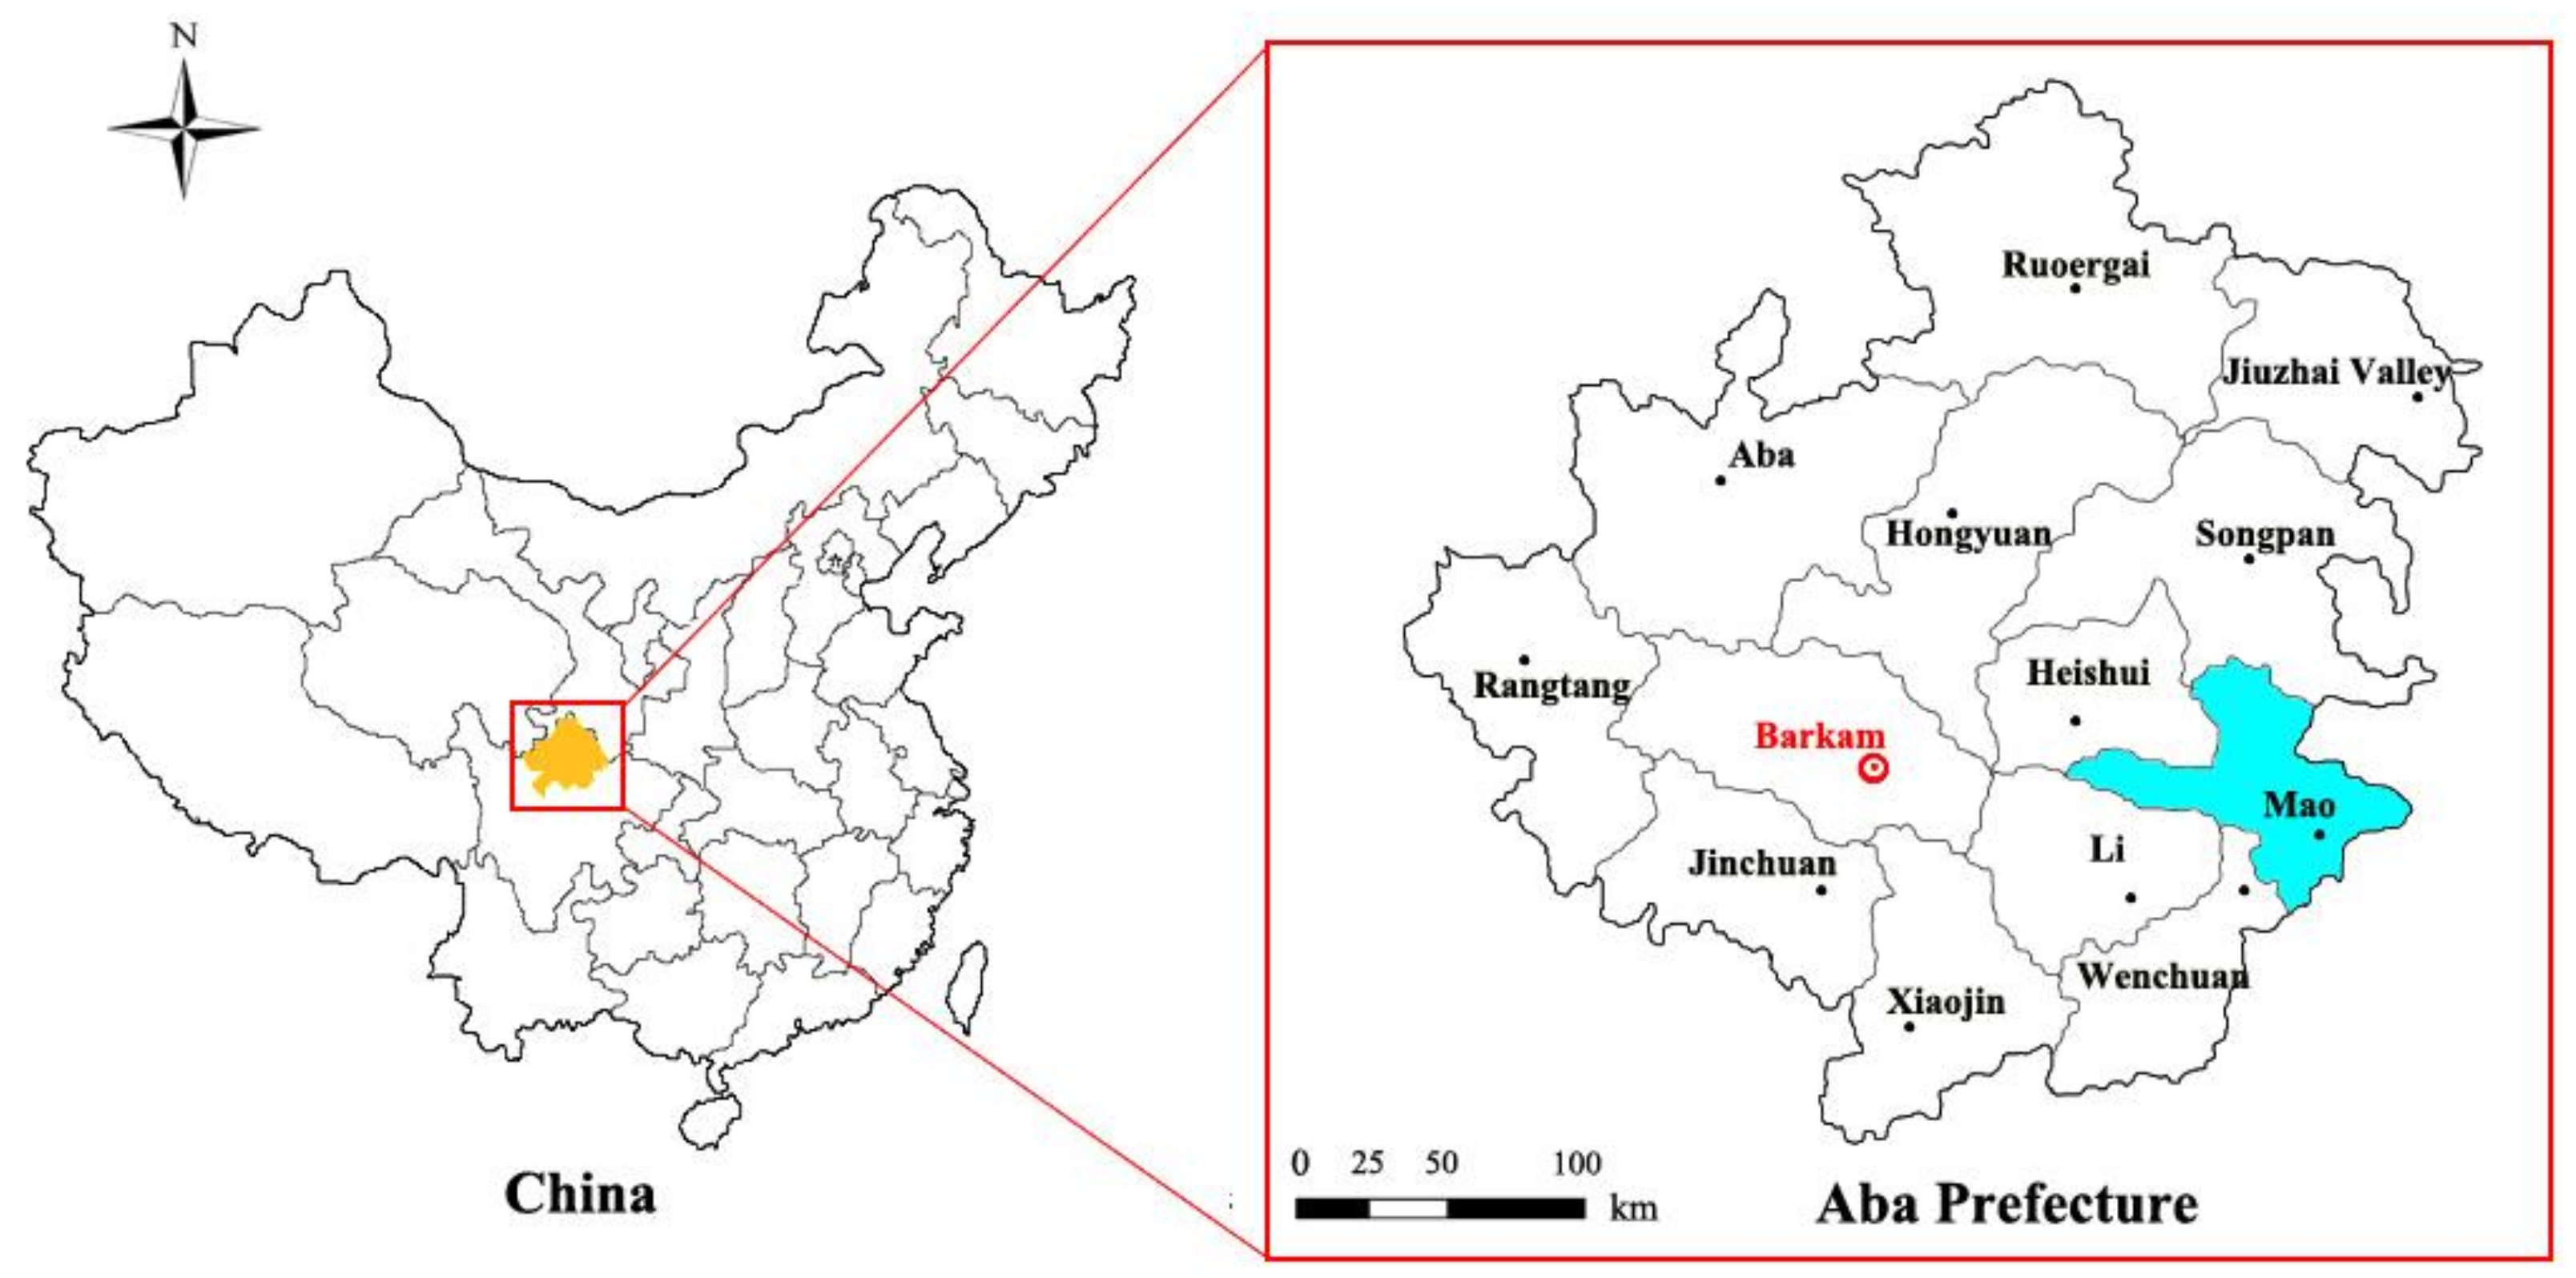
In order to verify the effectiveness of the proposed optimal model, we use computational experiments based on the depressed region of Mao County, which is located in the northwest of Sichuan province. The test aims to illustrate how the proposed model can be applied to support healthcare planners in location and allocation decisions in an uncertain environment.

5.1. Study Area

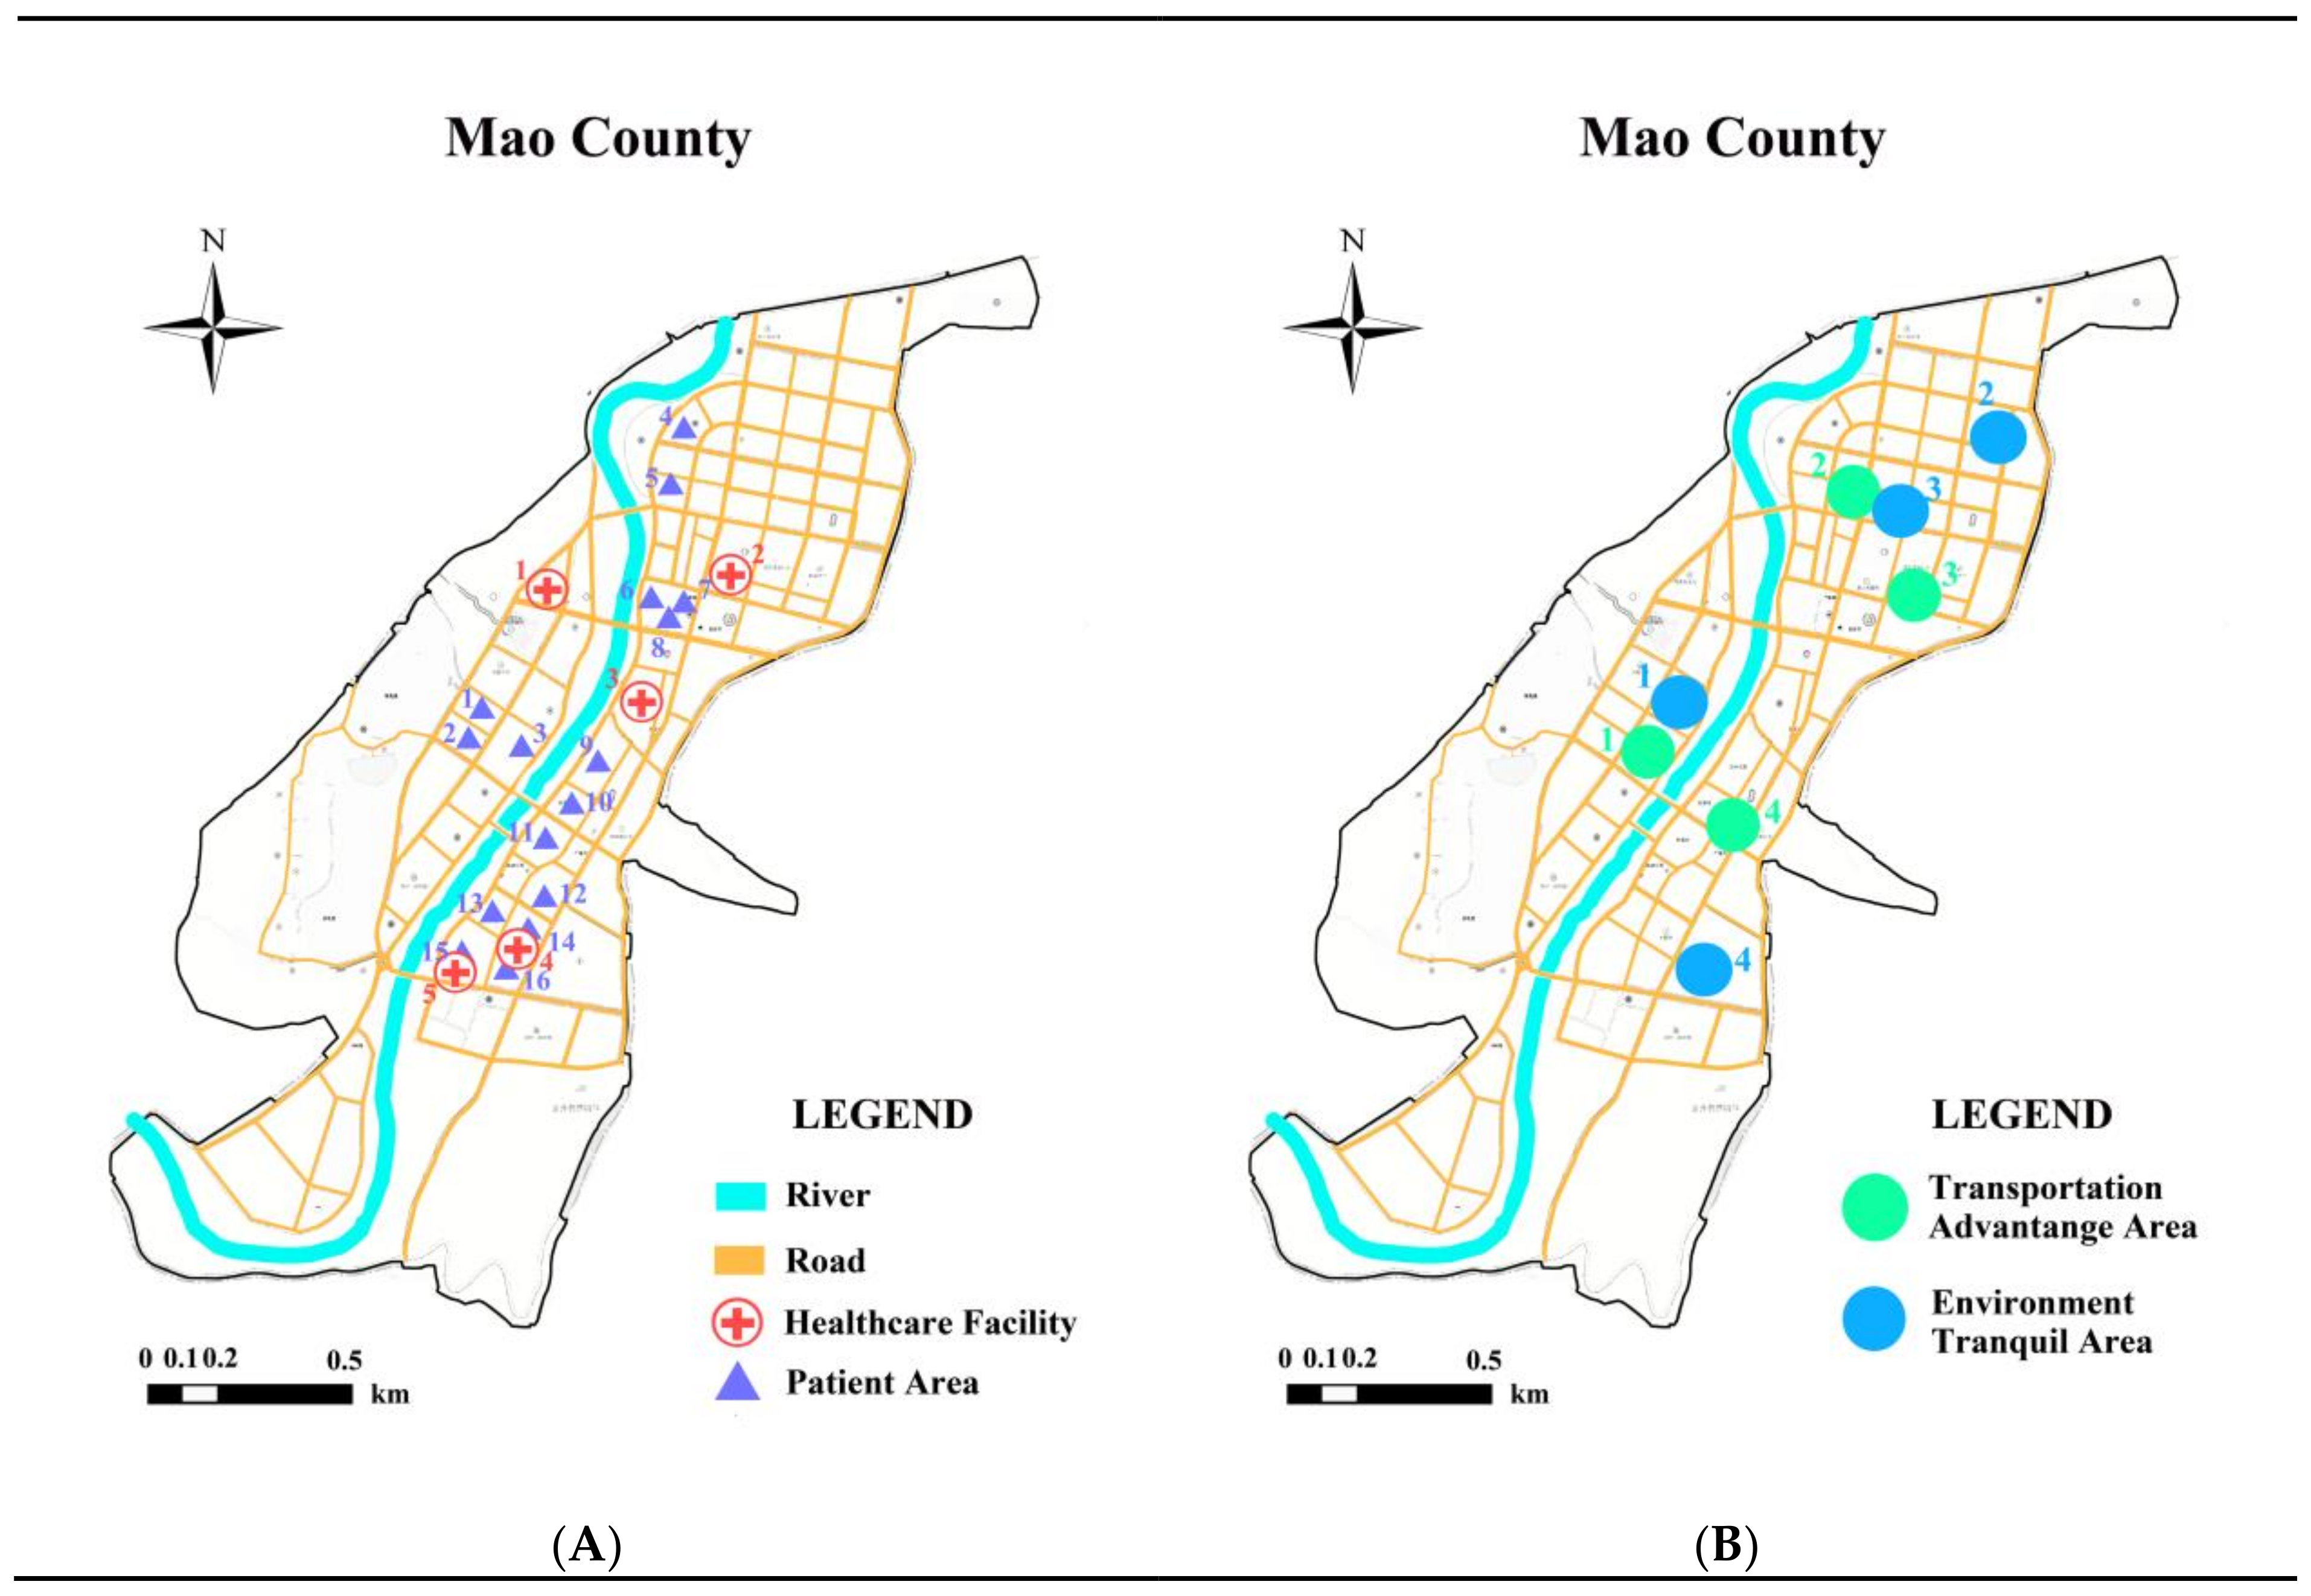
Mao County has a per capita GDP of 30046 CNY in 2017, and is a remote region with poor economic development accessibility. The detailed location of study area is shown in Figure 5. In our investigations, this developing region needs to provide sufficient healthcare facilities to the large scattered residents. What is more, there are 5 middle healthcare units and sixteen patient areas located in the township, which are presented in Figure 6A. The total sickbed number of existing hospitals is 527, which does not satisfy the total requirements for nearly 800 (i.e., T P = 800 ). Furthermore, the transportation advantage areas and environmentally tranquil areas around the existing hospitals are marked in Figure 6B.

5.2. Date Acquisition and Processing

The numerical data about population, medical demand, healthcare information, etc., are obtained from two types of organization, i.e., governmental agencies and academic institutions. According to our field investigation in local governments, the map data referring to residential distribution and healthcare network are retrieved from Statistical Bureau, Health and Family Planning Bureau and Land Source Bureau. In order to obtain the weights for environmental elements, the authors have contacted five experienced experts from the Center for Rural Construction Integrated Management (CRCIM) in Sichuan Agriculture University. The experts selected four essential areas respectively from each environmental type (Figure 6B), and gave the comprehensive weights (Table 4) based on the method of the analytic hierarchy process (AHP) [61]. Moreover, they proposed the morbidity of patient is generated by a uniform distribution ξ ˜ U ( 0.1 , 0.7 ) , and the uncertain sickbed price using a triangular fuzzy number η ˜ = ( 3500 , 4000 , 4500 ) with a confidence level of 90%.

5.3. Case Solution

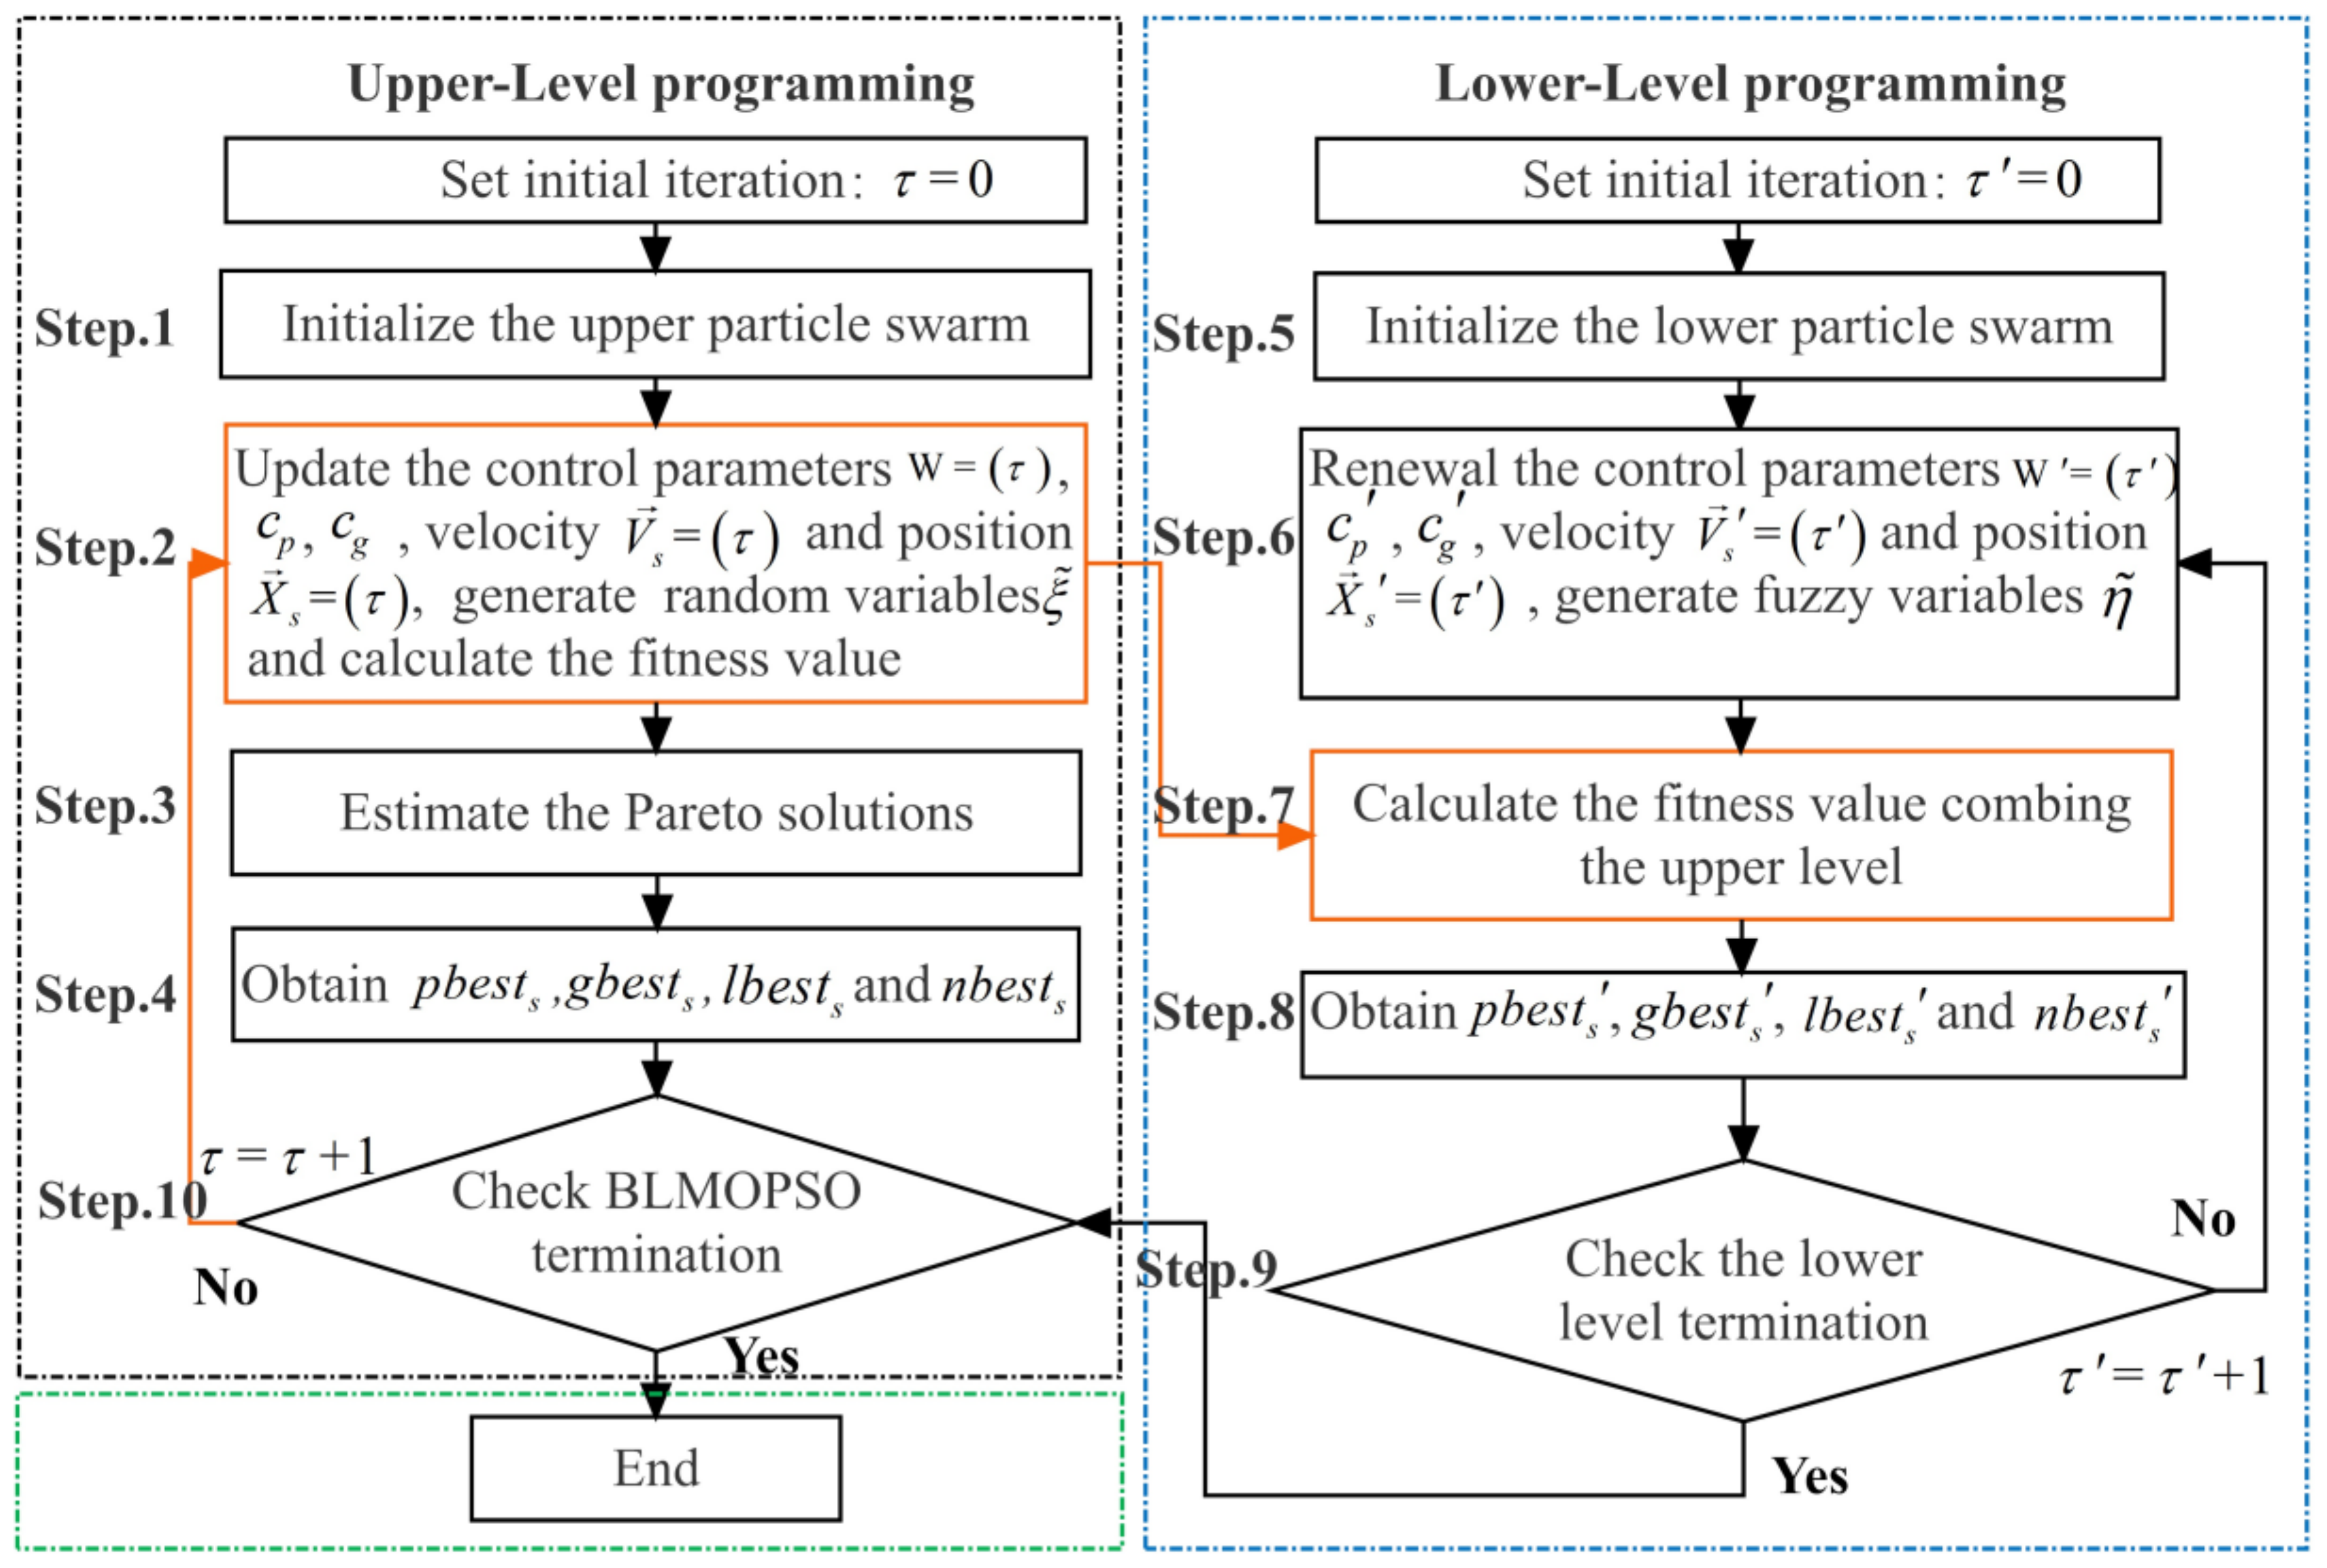
The BLMOPSO algorithm was conducted on a Windows 10 personal computer with 8 GB of RAM running at 2.8 GHz on an Intel Core i7 processor. The control parameters on each level were set as follows: iteration τ = 30 , swarm size s = 20, inertia weight in [0.1,0.9], personal and global acceleration coefficient in, local and near neighbor best acceleration constant c l = c n = 0.2 .
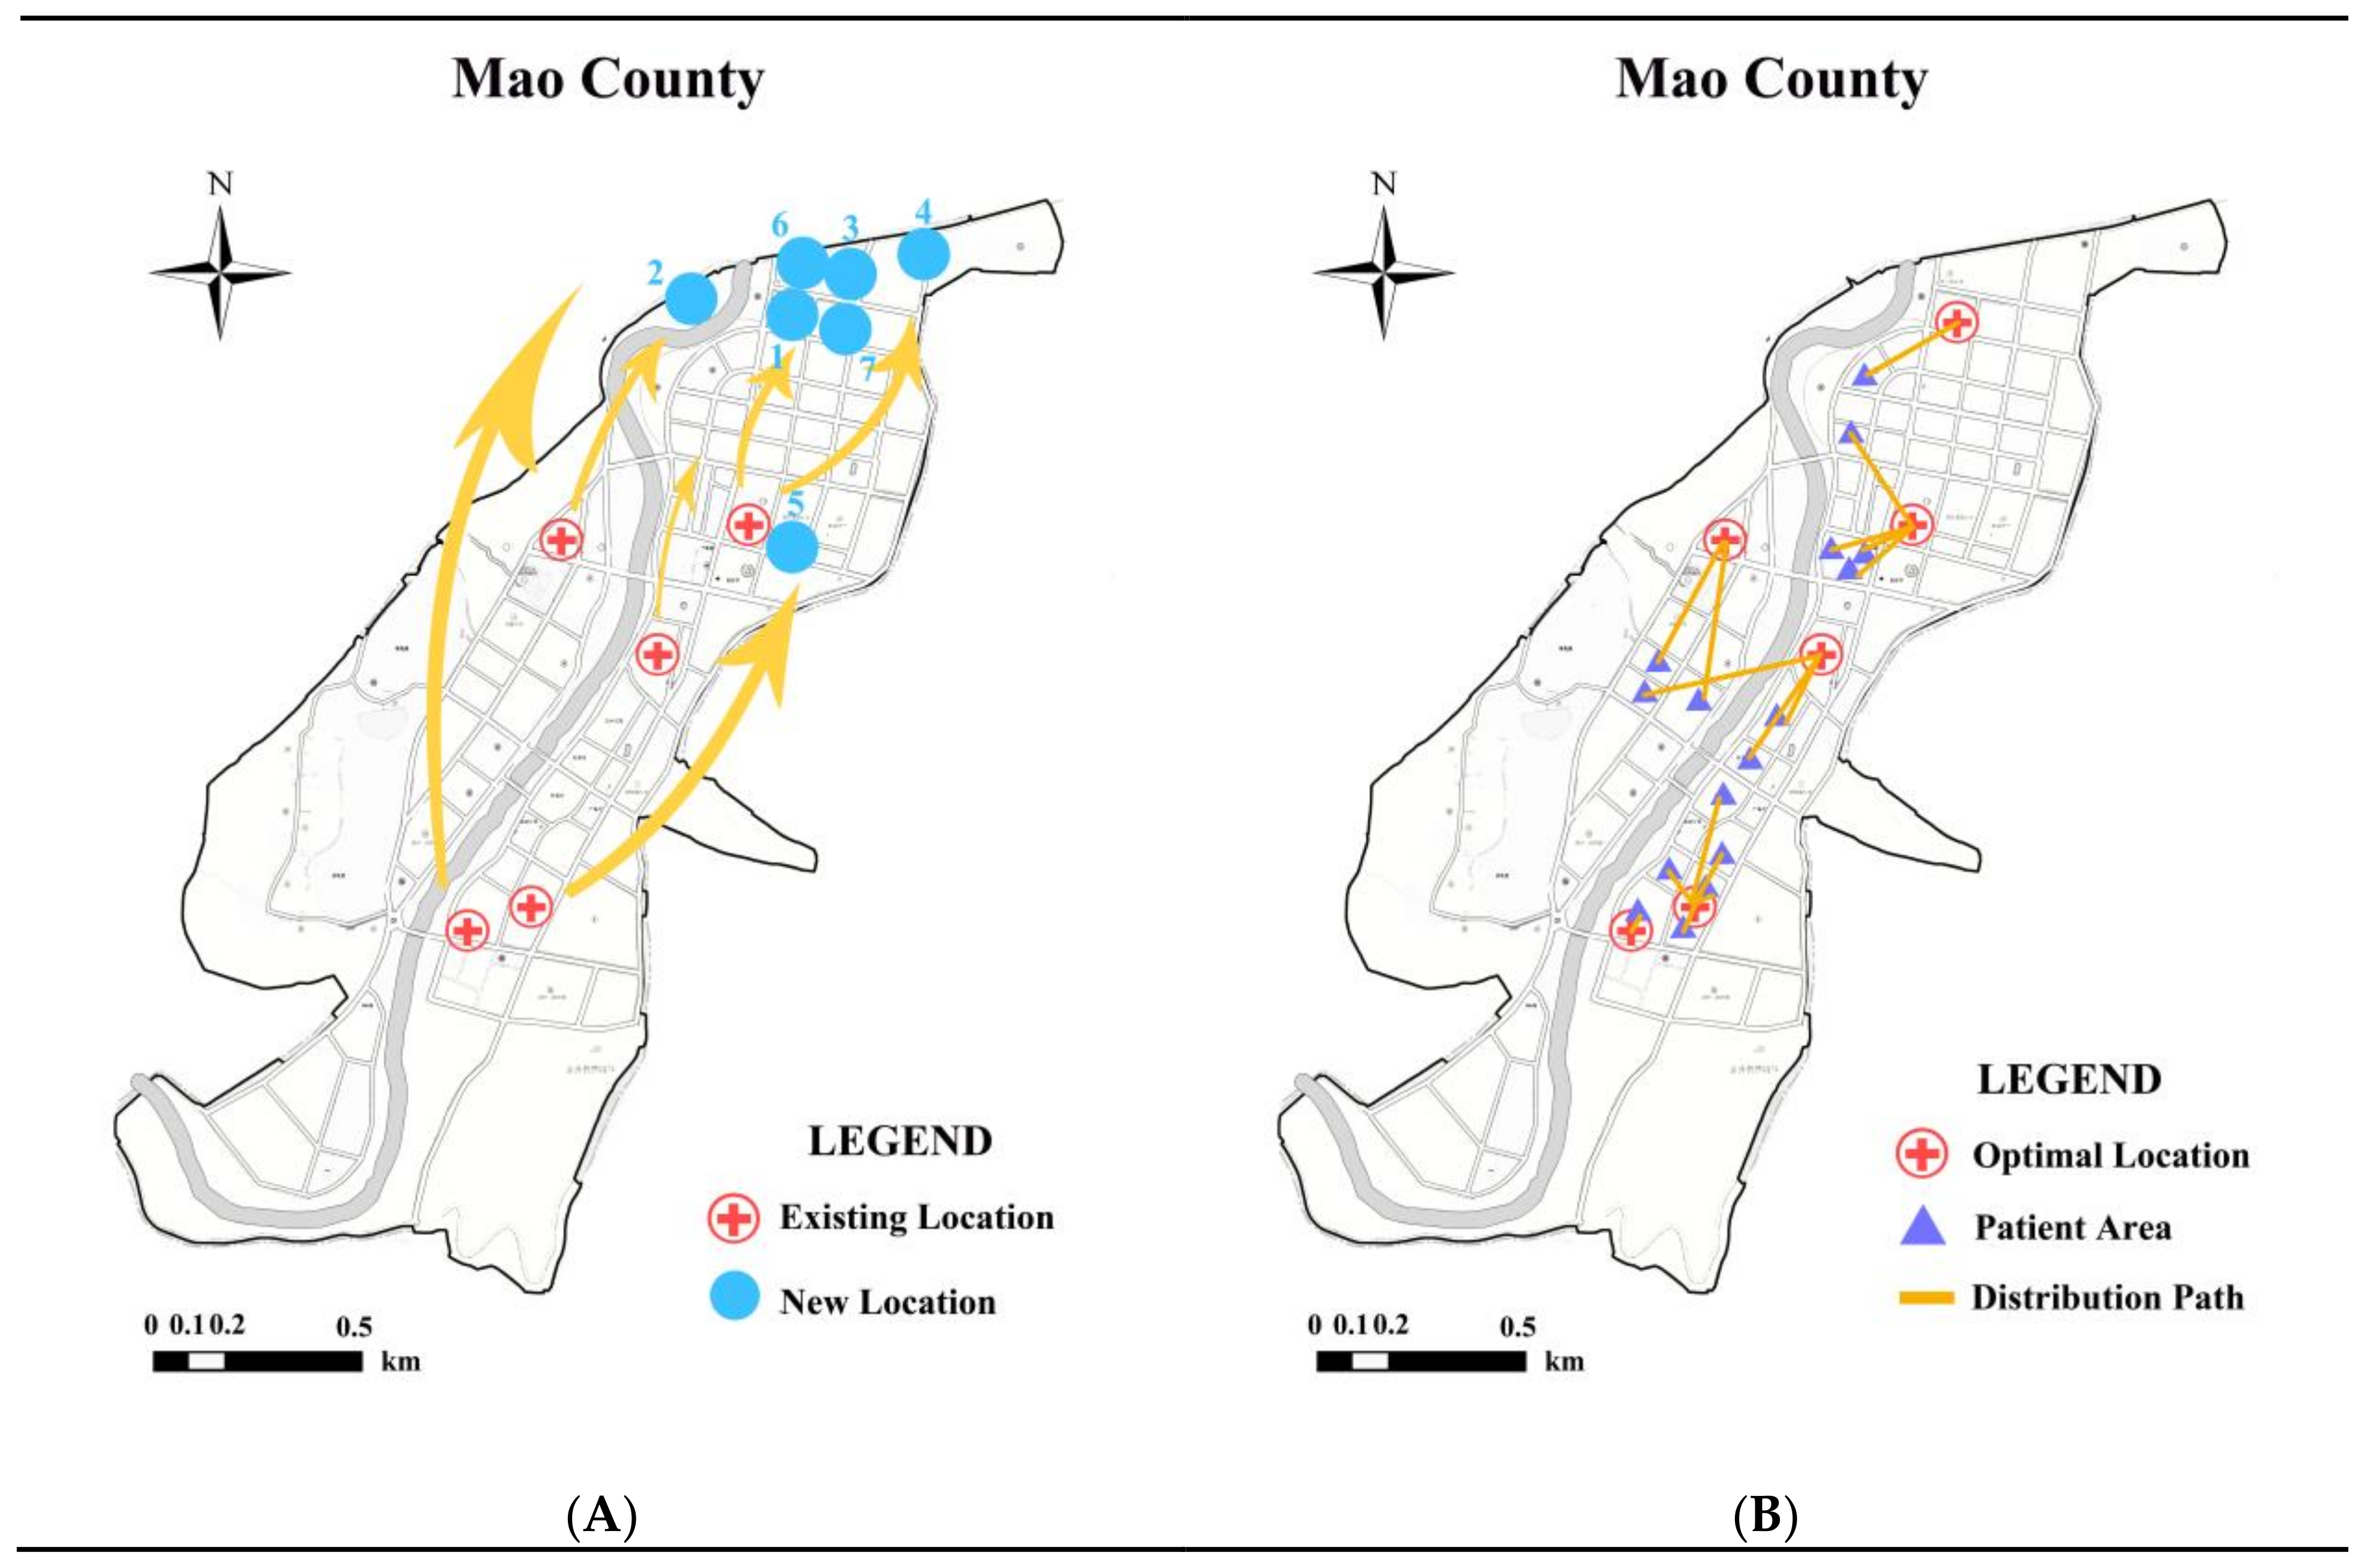
Since operating one iteration on the upper-level needs 30 iterations on the lower-level, the performance period grows exponentially. After 900 iterations in total, the pareto solutions were generated within average 7 minutes. The seven solutions on the upper level are demonstrated in Table 5, indicating the position and patient allocation scheme when constructing a new HCF. Notably, each location solution has a group of capacity scenarios on the lower level. Due to the space limitation, this research picked one of the capacity optimal solutions corresponding to an allocation scheme, which is shown in Table 6.

5.4. Analytic Results

With respect to alternative decision making, Figure 7A provides all of optimal solutions for governments to choose their preferences. That is to say, looking for to high service quality may situate the location far away from arterial road or quiet districts and, vice versa, pursuing a suitable medical environment could aggravate the travel burden. Furthermore, on the basis of primary results summarized in the tables as above, the location distributions of HCFs are illustrated in Figure 7B.
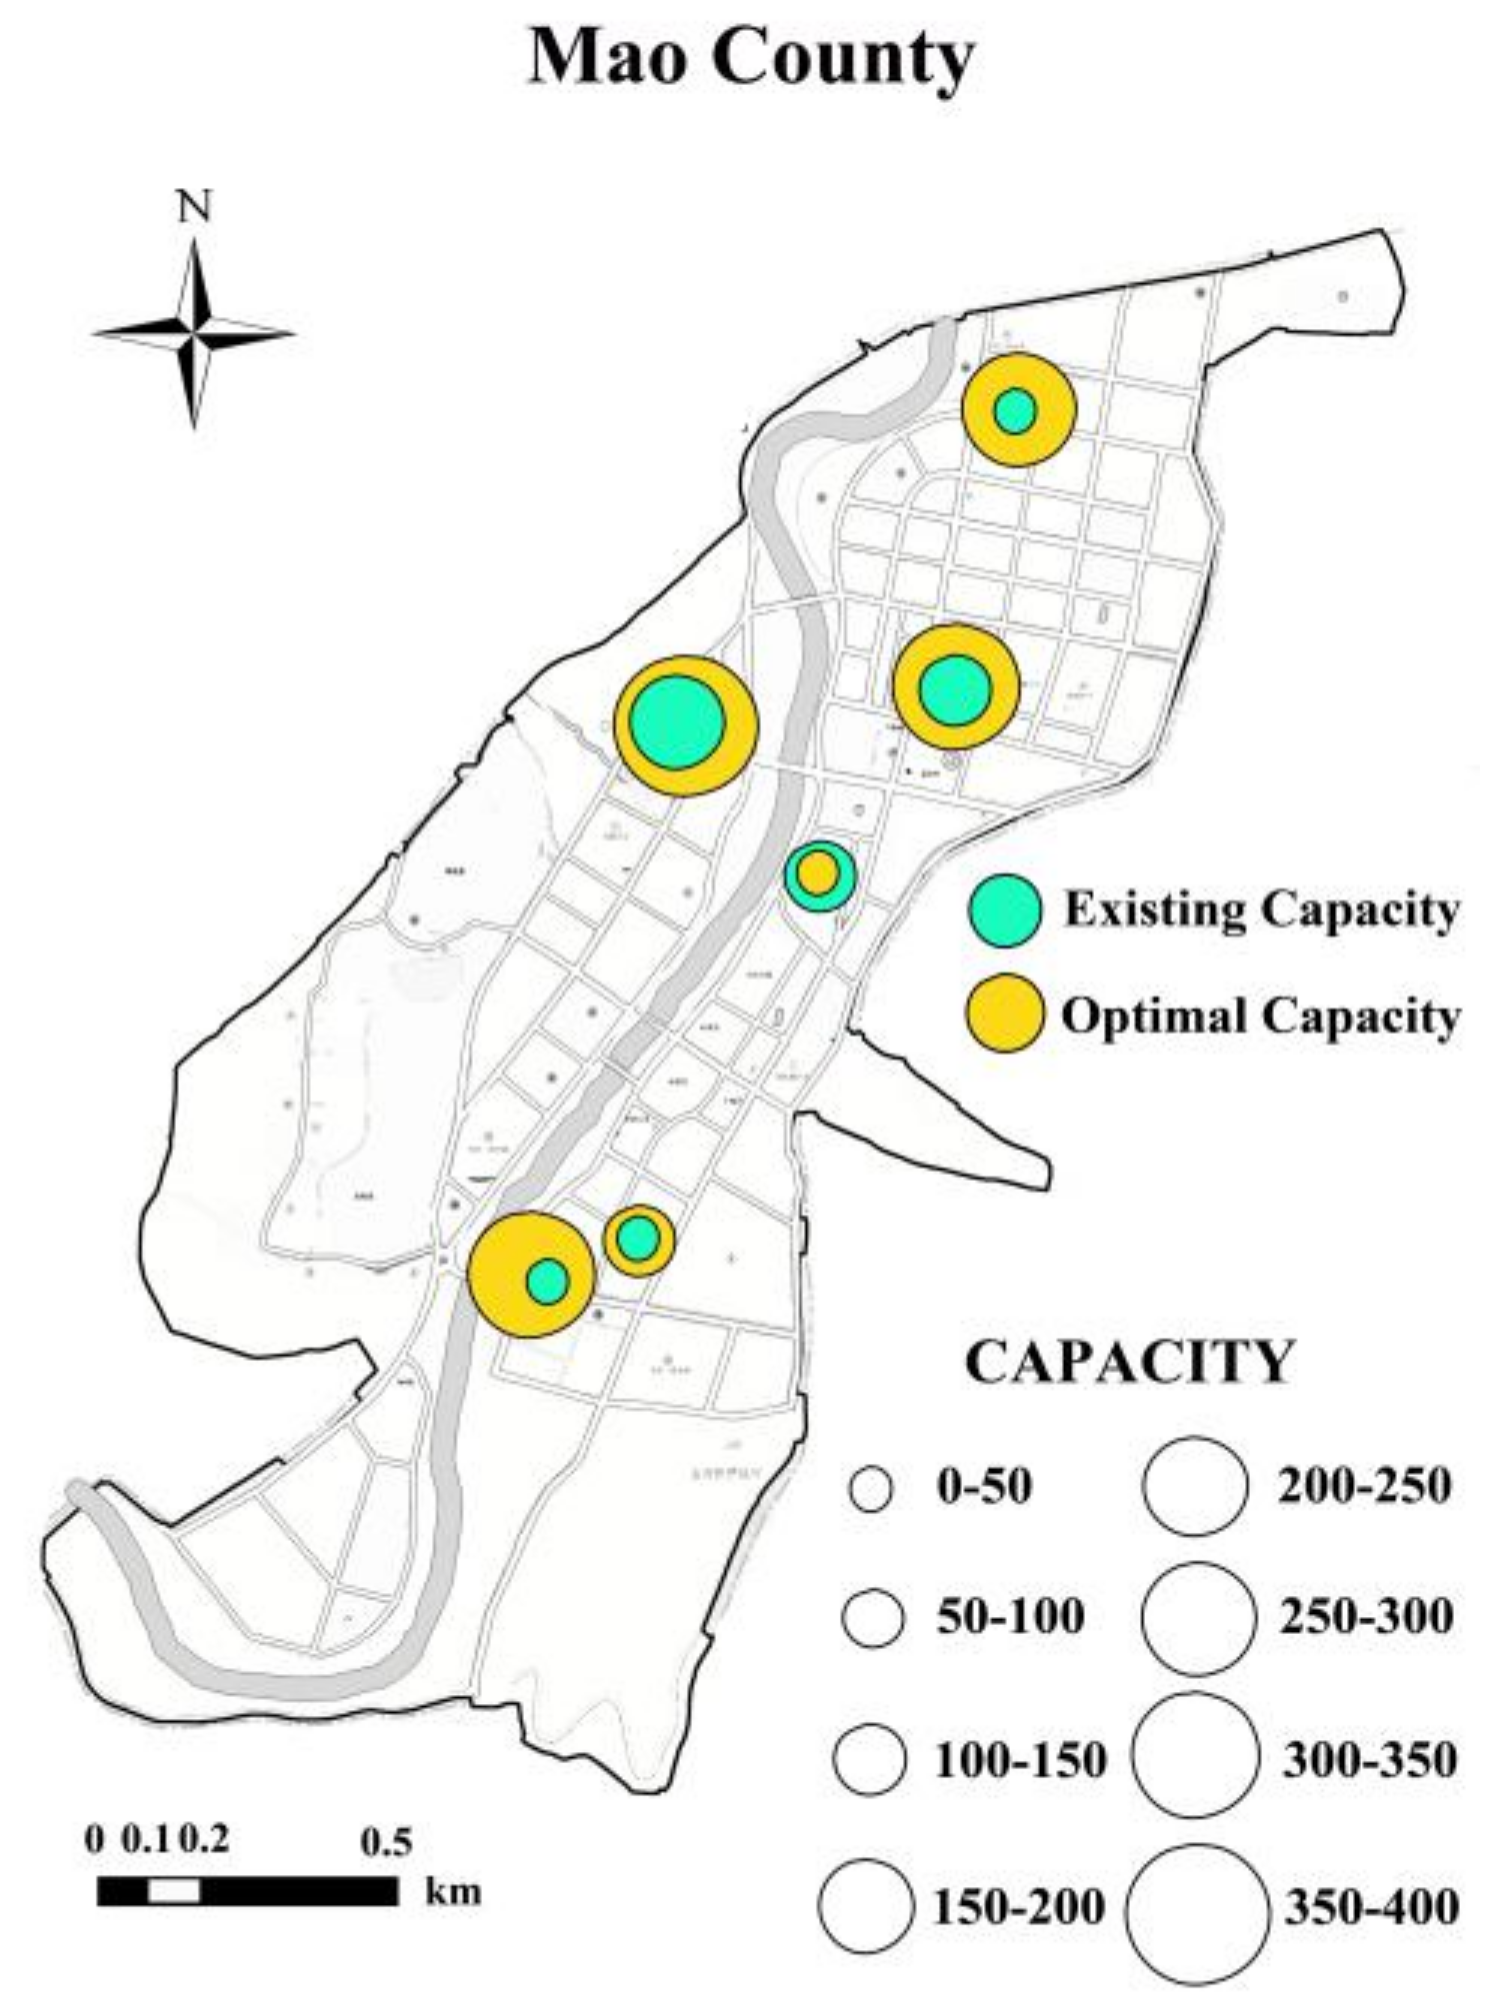
Figure 8 displays the capacity allocation for one of the options selected in Table 6. Obviously, availability and accessibility can be promoted by adding more sickbeds, but also cause the construction costs to rise. On the contrary, controlling the facility capacity can ease the financial pressure, but it may delay the best treatment for patients as well. Within this context, DMs should find a tradeoff among such conflicting objectives under different situations.

5.5. Comparative Analysis

This research compares the BLMPPSO with basic PSO in HCFLPs to validate its efficiency. Due to the complexity of multiple objective optimization compared to single objective programming, we studied four metrics of performance proposed in Gan et al. [40] to further illustrate the exploration and exploitation ability of the algorithm. Table 7 describes the iterative process of the pareto solutions, which discloses the diversity of the results. Table 8 collects different types of indicator value, and shows that the proposed algorithm performs better in all directions.

5.6. Stability Analysis

The eventual optimal solutions are acquired based on 30 tests in order to avoid accidental events. Although the experience is likely to generate other potential situations, the authors select one of the results that occurred most frequently. The test statistics are recorded in Table 9. In addition, the performance metric of “the extent” can test the stability of the results as well. Thus, the authors compared and calculated the error rates amongst the pareto solutions which with the same solution amount. Table 10 shows that most of error rates are no more than 5%. According to these two tables, the solutions obtained in this study are credible and reasonable.

6. Conclusions and Future Research

This study presents a location-allocation optimal model for China’s healthcare system to enhance availability and accessibility by using bi-level multiple objective programming in an uncertain environment. The upper level considers the conflicts of social and environmental factors on location decision, while the lower level adjusts the facility capacity, including service quality and financial costs simultaneously. Since-facility spatial distribution is a complex and time-consuming problem, and an ameliorated BLMOPSO algorithm is designed to improve the accuracy of the results. In order to verify the applicability and versatility of the proposed model, an extensive computational experiment has been carried out by using the data obtained from a field investigation. It balances the tradeoffs among the four conflicting optimal targets, analyzes the efficiency of location decisions, and estimates the requirement for capacity increase. Moreover, the optimal pareto solutions illustrate that the DMs’ preference has a significant bearing on the spatial and capacity assignment of patient areas to healthcare units.
The characteristic contributions of this paper are: (1) the hierarchical programming carries out the location and capacity assignment to maintain a balance between supply and demand; (2) the proposed model considers uncertainty associated with medical demand and costs to simulate possible realization; (3) BLMOPSO is designed to efficiently tackle such a NP-hard problem by means of improving the global search and reducing the probability of falling into premature convergence; (4) the optimal results pave the way for the practical application in healthcare network design, and also can be popularized in other types of public facilities such as schools, warehouses and police stations.
The current research is original, and will be needed for future work in at least two aspects. On one hand, choosing an appropriate location depends on not only the external environment but also internal factors such as competition among hospitals, classes of patients and diagnostic cost. On the other hand, the optimal objectives of urban and rural areas may differ and should be adjusted according to regional conditions.

Author Contributions

Li Wang conceived the framework, designed the model, implemented the entire experiments and wrote the majority of the manuscript; Huan Shi carried out the field research, collected the data and provided constructive suggestions on mathematical theory; Lu Gan proposed novel ideas and technical scenarios, refined the manuscript and improved the use of language. All the authors have read and approved the final manuscript.

Funding

This research was funded by the Humanities Social and Sciences Research Funds of Education Ministry (Grant No. 15XJC630001), the Key Funds of Sichuan Social Science Research Institution “System Science and Enterprise Development Research” (Grant No. Xq18B06), and the Foundation of Chengdu Science and Technology (Grant No. 2017-RK00-00274-ZF).

Conflicts of Interest

The authors declare no conflict of interest.

References

  1. Healthcare in China. Available online: https://en.wikipedia.org/wiki/Healthcare_in_China (accessed on 30 October 2018).
  2. Ahmadi-Javid, A.; Seyedi, P.; Syam, S.S. A survey of healthcare facility location. Comput. Oper. Res. 2016, 79, 223–263. [Google Scholar] [CrossRef]
  3. Vidyarthi, N.; Jayaswal, S. Efficient solution of a class of location–allocation problems with stochastic demand and congestion. Comput. Oper. Res. 2014, 48, 20–30. [Google Scholar] [CrossRef]
  4. Jia, T.; Tao, H.; Qin, K.; Wang, Y.L.; Liu, C.K.; Gao, Q.L. Selecting the optimal healthcare centers with a modified P-median model: a visual analytic perspective. Int. J. Health. Geogr. 2014, 13, 1–15. [Google Scholar] [CrossRef] [PubMed]
  5. Güneş, E.D.; Yaman, H.; Çekyay, B.; Verter, V. Matching patient and physician preferences in designing a primary care facility network. J. Oper. Res. Soc. 2014, 65, 483–496. [Google Scholar] [CrossRef] [Green Version]
  6. Karatas, M.; Yakıcı, E. An iterative solution approach to a multi-objective facility location problem. Appl Soft Comput. 2017, 26, 272–287. [Google Scholar] [CrossRef]
  7. Current, J.; Min, H.; Schilling, D. Multi-objective analysis of facility location decisions. Eur. J. Oper. Res. 1990, 49, 295–307. [Google Scholar] [CrossRef]
  8. Mestre, A.M.; Oliveira, M.D.; Barbosa-Póvoa, A.P. Location–allocation approaches for hospital network planning under uncertainty. Eur. J. Oper. Res. 2015, 240, 791–806. [Google Scholar] [CrossRef]
  9. Güneş, E.D.; Nickel, S. Location Problems in Healthcare. In Location Science; Laporte, G., Nickel, S., Saldanha da Gama, F., Eds.; Publisher: Springer, Cham, Germany, 2015; pp. 555–579. [Google Scholar]
  10. Das, S.; Kar, S. Group decision making in medical system: An intuitionistic fuzzy soft set approach. Appl. Soft. Comput. 2014, 24, 196–211. [Google Scholar] [CrossRef]
  11. Hassanien, A.E.; Grosan, C.; Tolba, M.F. Applications of Intelligent Optimization in Biology and Medicine. Springer: Cham, Germany, 2016. [Google Scholar]
  12. Clerc, M.; Kennedy, J. The particle swarm - explosion, stability, and convergence in a multidimensional complex space. IEEE. Trans. Evol. Comput. 2002, 6, 58–73. [Google Scholar] [CrossRef] [Green Version]
  13. Li, X.; Lu, J.; Hu, S.; Cheng, K.; Maeseneer, J.D.; Meng, Q.; Mossialos, E.; Xu, D.R.; Yip, W.; Zhang, H.; Krumholz, H.M.; Jiang, L.; Hu, S. The primary health-care system in China. Lancet 2017, 390, 2584–2594. [Google Scholar] [CrossRef]
  14. Wang, X.; Yang, H.; Duan, Z.; Pan, J. Spatial accessibility of primary health care in China: A case study in Sichuan Province. Soc. Sci. Med. 2018, 209, 14–24. [Google Scholar] [CrossRef] [PubMed]
  15. Church, R.; Velle, C.R. The maximal covering location problem. Pap. Reg. Sci. Assoc. 1974, 32, 101–118. [Google Scholar] [CrossRef]
  16. Czerwiński, A.M.; Więckowska, B. Location-allocation model for external beam radiotherapy as an example of an evidence-based management tool implemented in healthcare sector in Poland. Radiat Oncol. 2018, 127, 154–160. [Google Scholar] [CrossRef] [PubMed]
  17. Hakimi, S.L. Optimum locations of switching centers and the absolute centers and medians of a graph. Oper. Res. 1964, 12, 450–459. [Google Scholar] [CrossRef]
  18. Brimberg, J.; Drezner, Z.; Mladenović, N.; Salhi, S. A new local search for continuous location problems ☆. Eur. J. Oper. Res. 2014, 232, 256–265. [Google Scholar] [CrossRef]
  19. Farahani, R.Z.; Asgari, N.; Heidari, N.; Hosseininia, M.; Goh, M. Covering problems in facility location: A review. Comput. Ind. Eng. 2012, 62, 368–407. [Google Scholar] [CrossRef]
  20. Toregas, C.; Swain, R.; Revelle, C.; Bergman, L. The location of emergency service facilities. Oper. Res. 1971, 19, 1363–1373. [Google Scholar] [CrossRef]
  21. Venkateshan, P.; Ballou, R.H.; Mathur, K.; Maruthasalam, A.P.P. A Two-echelon joint continuous-discrete location model. Eur. J. Oper. Res. 2017, 262, 1028–1039. [Google Scholar] [CrossRef]
  22. Drezner, T.; Drezner, Z.; Schöbel, A. The Weber obnoxious facility location model: A Big Arc Small Arc approach. Comput. Oper. Res. 2018, 98, 240–250. [Google Scholar] [CrossRef]
  23. Uno, T.; Kato, K.; Katagiri, H. Fuzzy random weighted Weber problems in facility location. Procedia Comput. Sci. 2015, 60, 936–943. [Google Scholar] [CrossRef]
  24. Farahani, R.Z.; Hekmatfar, M.; Fahimnia, B.; Kazemzadeh, N. Hierarchical facility location problem: Models, classifications, techniques, and applications. Comput. Ind. Eng. 2014, 68, 104–117. [Google Scholar] [CrossRef]
  25. Ye, H.; Kim, H. Locating healthcare facilities using a network-based covering location problem. Geojournal 2016, 81, 1–16. [Google Scholar] [CrossRef]
  26. Syam, S.S.; Côté, M.J. A comprehensive location-allocation method for specialized healthcare services. Oper. Res. Health Care 2012, 1, 73–83. [Google Scholar] [CrossRef]
  27. Schuldt, J.; Doktor, A.; Lichters, M.; Vogt, B.; Robra, B.P. Insurees’ preferences in hospital choice—A population-based study. Health Policy 2017, 121, 1040–1046. [Google Scholar] [CrossRef] [PubMed]
  28. Srinivas, N.; Deb, K. Muiltiobjective optimization using nondominated sorting in genetic algorithms. Evol Comput. 2014, 2, 221–248. [Google Scholar] [CrossRef]
  29. Zhang, W.; Cao, K.; Liu, S.; Huang, B. A multi-objective optimization approach for health-care facility location-allocation problems in highly developed cities such as Hong Kong. Comput. Environ. Urban. Syst. 2016, 59, 220–230. [Google Scholar] [CrossRef]
  30. Mandloi, M.; Bhatia, V. A low-complexity hybrid algorithm based on particle swarm and ant colony optimization for large-MIMO detection. Expert Syst. Appl. 2016, 50, 66–74. [Google Scholar] [CrossRef]
  31. Zarrinpoor, N.; Fallahnezhad, M.S.; Pishvaee, M.S. Design of a reliable hierarchical location-allocation model under disruptions for health service networks: A two-stage robust approach. Comput. Ind. Eng. 2017, 109, 130–150. [Google Scholar] [CrossRef]
  32. Kim, D.G.; Kim, Y.D. A Lagrangian heuristic algorithm for a public healthcare facility location problem. Ann. Oper. Res. 2013, 206, 221–240. [Google Scholar] [CrossRef]
  33. Elkady, S.K.; Abdelsalam, H.M. A Modified Particle Swarm Optimization Algorithm for Solving Capacitated Maximal Covering Location Problem in Healthcare Systems. In Applications of Intelligent Optimization in Biology and Medicine.; Hassanien, A.E., Grosan, C., Fahmy, Tolba.M., Eds.; Springer: Cham, Germany, 2016; pp. 117–133. ISBN 978-3-319-21211-1. [Google Scholar]
  34. Eiselt, H.A.; Marianov, V. Foundations of Location Analysis. In International Series in Operations Research & Management Science l.; Publisher: Springer, Boston, MA, USA, 2011. [Google Scholar]
  35. Syam, S.S.; Côté, M.J. A location–allocation model for service providers with application to not-for-profit health care organizations. Omega 2010, 38, 157–166. [Google Scholar] [CrossRef]
  36. Zhang, Y.; Atkins, D. Medical Facility Network Design: User-Choice and System-Optimal Models. Eur. J. Oper. Res. 2018, 273, 305–319. [Google Scholar] [CrossRef]
  37. Collette, Y.; Siarry, P. Multiobjective Optimization; Springer: Berlin, Germany, 2003. [Google Scholar]
  38. Mestre, A.M.; Oliveira, M.D.; Barbosa-Póvoa, A. Organizing hospitals into networks: a hierarchical and multiservice model to define location, supply and referrals in planned hospital systems. Or. Spectru. 2012, 34, 319–348. [Google Scholar] [CrossRef]
  39. Stummer, C.; Doerner, K.; Focke, A.; Heidenberger, K. Determining Location and Size of Medical Departments in a Hospital Network: A Multiobjective Decision Support Approach. Health. Care. Manag. Sci. 2004, 7, 63–71. [Google Scholar] [CrossRef] [PubMed]
  40. Wei, G.; Xin, W.; Mcgregor, S.E. Optimization of preventive health care facility locations. Int. J. Health. Geogr. 2010, 9, 17. [Google Scholar] [CrossRef] [PubMed]
  41. Shariff, S.S.R.; Moin, N.H.; Omar, M. Location allocation modeling for healthcare facility planning in Malaysia. Comput. Ind. Eng. 2012, 62, 1000–1010. [Google Scholar] [CrossRef]
  42. Verter, V.; Lapierre, S.D. Location of Preventive Health Care Facilities. Ann. Oper. Res. 2002, 110, 123–132. [Google Scholar] [CrossRef]
  43. Landa-Torres, I.; Manjarres, D.; Salcedo-Sanz, S.; Del Ser, J.; Gil-Lopez, S. A multi-objective grouping Harmony Search algorithm for the optimal distribution of 24-hour medical emergency units. Expert Syst. Appl. 2013, 40, 2343–2349. [Google Scholar] [CrossRef]
  44. Kennedy, J.; Eberhart, R. Particle swarm optimization. In Proceedings of the IEEE International Conference on Neural Networks, Perth, WA, Australia, 27 November–1 December 1995. [Google Scholar] [CrossRef]
  45. Poli, R.; Kennedy, J.; Blackwell, T. Particle Swarm Optimization: An Overview. Swarm Intell. 2007, 1, 33–57. [Google Scholar] [CrossRef]
  46. Sengupta, S.; Basak, S.; Peters, R.A. Particle Swarm Optimization: A Survey of Historical and Recent Developments with Hybridization Perspectives. Mach. Learn. Knowl. Extr. 2018, 1, 157–191. [Google Scholar] [CrossRef]
  47. Ye, W.; Feng, W.; Fan, S. A novel multi-swarm particle swarm optimization with dynamic learning strategy. Appl. Soft. Comput. 2017, 61, 832–843. [Google Scholar] [CrossRef]
  48. Peng, Z.; Manier, H.; Manier, M.A. Particle swarm optimization for capacitated location-routing problem. IFAC-Papers. OnLine. 2017, 50, 14668–14673. [Google Scholar] [CrossRef]
  49. Wang, S.; Watada, J. A hybrid modified PSO approach to VaR-based facility location problems with variable capacity in fuzzy random uncertainty. Inf. Sci. 2012, 192, 3–18. [Google Scholar] [CrossRef]
  50. Ratnaweera, A.; Halgamuge, S.; Watson, H. Particle Swarm Optimization with Self-Adaptive Acceleration Coefficients. In Proceedings of the First International Conference on Fuzzy Systems and Knowledge Discovery, Guilin, China, 14–17 October 2003; pp. 264–268. [Google Scholar]
  51. Naka, S.; Genji, T.; Yura, T.; Fukuyama, Y. Practical Distribution State Estimation using Hybrid Particle Swarm Optimization. In Proceedings of the IEEE Power Engineering Society Winter Meeting, Columbus, OH, USA, 28 January–1 February 2001; Volume 2, pp. 815–820. [Google Scholar]
  52. Clerc, M.; Kennedy, J. The Particle Swarm-Explosion, Stability and Convergence in a Multidimensional Complex Space. IEEE Trans. Evol. Comput. 2002, 6, 58–73. [Google Scholar] [CrossRef]
  53. Xing, J.; Xiao, D. New Metropolis Coefficients of Particle Swarm Optimization. In Proceedings of the 2008 Chinese Control and Decision Conference, Yantai, Shandong, China, 2–4 July 2008; pp. 3518–3521. [Google Scholar]
  54. Li, C.; Zhai, R.; Liu, H.; Yang, Y.; Wu, H. Optimization of a heliostat field layout using hybrid PSO-GA algorithm. Appl. Therm. Eng. 2018, 128, 33–41. [Google Scholar] [CrossRef]
  55. Niknam, T.; Narimani, M.R.; Jabbari, M. Dynamic optimal power flow using hybrid particle swarm optimization and simulated annealing. Int. Trans. Electr. Energy Syst. 2013, 23, 975–1001. [Google Scholar] [CrossRef]
  56. Mandloi, M.; Bhatia, V. A low-complexity hybrid algorithm based on particle swarm and ant colony optimization for large-MIMO detection. Expert. Syst. Appl. 2016, 50, 66–74. [Google Scholar] [CrossRef]
  57. Prakash, J.; Singh, P.K.; Kishor, A. Integrating fitness predator optimizer with multi-objective PSO for dynamic partitional clustering. Prog. Artif. Intell. 2018, 7, 1–17. [Google Scholar] [CrossRef]
  58. Marinakis, Y. An improved particle swarm optimization algorithm for the capacitated location routing problem and for the location routing problem with stochastic demands. Appl. Soft. Comput. 2015, 37, 680–701. [Google Scholar] [CrossRef]
  59. Gan, L.; Wang, L.; Hu, L. Gathered Village Location Optimization for Chinese Sustainable Urbanization Using an Integrated MODM Approach under Bi-Uncertain Environment. Sustain. 2017, 9, 1907. [Google Scholar] [CrossRef]
  60. Zhang, R.; Chang, P.C.; Song, S.; Wu, C. Local search enhanced multi-objective PSO algorithm for scheduling textile production processes with environmental considerations. Appl. Soft. Comput. 2017, 61, 447–467. [Google Scholar] [CrossRef]
  61. Karayalcin, I.I. The analytic hierarchy process: Planning, priority setting, resource allocation. Eur. J. Oper. Res. 1982, 9, 97–98. [Google Scholar] [CrossRef]
Figure 1. Healthcare facility hierarchy in rural areas.
Sustainability 10 04580 g001
Figure 2. Framework of healthcare facility location-allocation optimization for developing cities in China. BLMOPSO, bi-level multi-objective particle swarm optimization.
Sustainability 10 04580 g002
Figure 3. Bi-level-based update process.
Sustainability 10 04580 g003
Figure 4. Flow chart of the bi-level multi-objective particle swarm optimization (BLMOPSO) algorithm.
Sustainability 10 04580 g004
Figure 5. Location of study area.
Sustainability 10 04580 g005
Figure 6. (A) Healthcare facility and patient areas; (B) Environmental elements in Mao County.
Sustainability 10 04580 g006
Figure 7. (A) Optimal location scheme; (B) spatial distribution.
Sustainability 10 04580 g007
Figure 8. Capacity allocation.
Sustainability 10 04580 g008
Table 1. Methods in healthcare facility location problems (HCFLPs).
AuthorsMajor ApproachProblem Type
Karatas et al. [6], etc.Multi-objective optimizationFacility location
Czerwiński et al. [16], etc.Mixed-integer linear programmingHealthcare location-allocation
Ye et al. [25], etcGIS integration
Schuldt et al [30], etc.Multilevel programmingHospital network planning
Schuldt et al. [27]Conjoint analysis
Mestre et al. [8]Uncertainty modelling
Syam and Côté [26], etc.Integer programming
Table 2. Impact factors of HCFLPs.
AuthorsFactors TypeFactors NameTotal Cite
Güneş et al. [5], etc.socialtravel distance/time11
Schuldt et al. [27]service quality4
Zhang et al. [36], etc.expected waiting time2
Vidyarthi and Jayaswal [3]traffic congestion1
Current et al. [7], etc.economicfacility cost7
Jia et al. [4], etc.capacity6
Güneş and Nickel [9], etc.travel cost3
Ye and Kim [25], etc.facility amount2
Syam at al. [26]operate cost1
Brimberg et al. [18]service costs1
Jia et al. [4], etc.environmentalgeographic accessibility3
Zarrinpoor et al. [31]disruption risk1
Table 3. Conventional adjustments on particle swarm optimization (PSO).
AuthorsArea of ModificationDetail Description
Ratnaweera et al. [50]Linear varying inertia weightControl the individual velocity
Naka et al. [51]Nonlinear inertia weightEnsure the velocity toward the lowest dynamic range
Clerc and Kennedy [52]Constriction FactorAdjust the updating of the whole velocity
Xing and Xiao [53]Acceleration CoefficientsGenerate stochastic influence on velocity of different groups
Wang et al. [49]TopologiesExchange the cooperative information amongst each particle
Li et al. [54], Niknam et al. [55], Mandloi and Bhatia [56]Hybrid TechniqueIntegrate others intelligent algorithms such as Genetic Algorithm (GA), Simulated Annealing (SA) and Ant Colony Optimization (ACO)
Table 4. The weights for environmental factors.
Environmental Type
α 1 α 2
0.340.66
Transportation Advantage Area
ϕ 1 ϕ 2 ϕ 3 ϕ 4
0.130.180.370.32
Environmentally Tranquil Area
φ 1 φ 2 φ 3 φ 4
0.110.310.360.22
Table 5. The pareto solutions on the upper level.
No.NEPatient Area
12345678910111213141516
131°41′35.05″103°51′28.77″2421333344555565
231°41′37.09″103°51′23.34″2421133344555565
331°41′40.18″103°51′33.00″2421333344555565
431°41′39.32″103°51′37.63″2421133344555565
531°40′59.34″103°51′26.53″2421333344555565
631°41′53.40″103°51′44.01″2421333344555565
731°41′35.52″103°51′35.94″2421333344555565
Table 6. The pareto solutions relating to No.1 on the lower level.
No.Number of Sickbed
123456
Original-2001201076040
1289+289394+194319+19934−73102+42318+278
2133+133500+300212+92144+37402+342105+65
3433+433341+141447+327261+154417+357396+356
4309+309432+232429+309329+222384+324246+206
5174+174305+105264+144255+148214+154233+193
6377+377401+201438+318305+198393+333306+266
756+56489+289335+215349+242242+18258+18
8190+190394+194383+263313+206302+242229+189
932+32365+165370+250396+28969+966+26
Table 7. Iterative process of the pareto solutions.
IterationThe Average DistanceThe DistributionThe ExtentThe Set ConvergenceThe Solution Amount
10.05680.33333.86490.33333
20.05470.60005.61270.60005
30.05470.60005.61271.00005
40.04090.50005.86340.75004
50.04090.50005.86341.00004
60.07620.60005.86340.80005
70.07620.60005.86341.00005
80.07620.60005.86341.00005
100.07620.60005.86341.00005
120.07620.60005.86341.00005
150.07620.60005.86341.00005
180.07620.60005.86341.00005
200.07620.60005.86341.00005
220.09220.66675.86340.66676
230.09220.66675.86341.00006
240.09220.66675.86341.00006
250.09220.66675.86341.00006
260.04250.71435.86340.85717
270.04250.71435.86341.00007
280.04250.71435.86341.00007
290.04250.71435.86341.00007
300.04250.71435.86341.00007
Table 8. Comparison of BLMOPSO and basic PSO.
Algorithm TypeIterationThe average DistanceThe DistributionThe ExtentThe set ConvergenceThe Solution Amount
BLMOPSO300.04250.71435.86341.00007
Basic PSO300.17120.50005.30361.00004
Table 9. Frequency of the pareto solution.
Solution AmountOccurrence AmountPercentage
71233.33%
8416.67%
6316.67%
5313.33%
1026.67%
others413.33%
total30100.00%
Table 10. Error rate of the pareto solution.
No.Solution AmountThe ExtentError Rate
Original75.8634-
175.7702−0.0932−1.59%
275.92890.06551.12%
375.92890.06551.12%
475.7494−0.1140−1.94%
575.4991−0.3643−6.21%
675.94350.08011.37%
776.13740.27404.67%
875.5974−0.2660−4.54%
97−0.1889−0.1889−3.22%
1075.6943−0.1691−2.88%
1176.20930.34595.90%

