1. Introduction
The accelerated urban growth, the development of anthropogenic activities, and the uninterrupted flow of motorized vehicles in cities have resulted in the release of heavy metals into the environment, of which the majority are retained in the urban dust.
The World Health Organization has stated that large numbers of people living in urban cores suffer from certain health issues due to their long-term exposure to heavy metals and other pollutants [
1,
2,
3]. Urban dusts are capable of being perilous in many respects, since they are brought into contact with people by inhalation, assimilation through the skin, or even by oral consumption, the hazard being greater when the particles are particularly small [
4,
5,
6,
7].
Atmospheric pollutants accumulate on diverse urban surfaces where they mix with other components, originating the so-called urban dust, an element which has barely been researched at present. Urban dust is a heterogeneous mixture of substances derived from the weathering of urban constructions and light particles—transported by wind and water—which are produced by anthropogenic activities (traffic, industry, heating, etc.) [
8,
9]. Subsequently, the pollutants can enter rivers through the sewage system, increasing their contamination, as was shown in detailed analyses of urban and road runoffs [
10,
11].
In recent years, research into the concentrations of heavy metals in cities has increased; studies have been conducted in different parts of the world, both in major capitals, such as Mexico City [
12,
13], Dakha [
14], Islamabad [
15], and Istanbul [
16], and in smaller cities [
17,
18]. Furthermore, there has been research comparing numerous cities [
8,
19]. Regarding Spain, there are reports on the contamination by urban dust [
6] and the evolution through time of such contamination [
19].
The heavy metal contamination in street dust diverges according to the activity that gives rise to it [
20]. There is research on street dust in relation to both different sources—such as industrial, mining, residential, commercial, urban, and agricultural [
8,
17,
21,
22,
23]—and different traffic intensities [
24,
25]. The investigations in the gardens and parks where children play are of particular interest [
5,
26]. However, there are no studies of the influence of the place where the dust is deposited (roads, sidewalks, windows, etc.), or of the relationship between its color and the specific heavy metals and their concentrations present in the dust. These aspects might be significant from the cleaning and traffic intensity management points of view in the city, as well as with regard to establishing swift methodologies for the determination of the level of contamination according to the color of the sample [
27].
Multiple studies have bestowed pollution levels by considering the heavy metal enrichment in street dust relative to the soil’s content, used as a reference (background) [
17,
25]. The city of Murcia has undergone an accelerated population and traffic growth in recent years, with the consequent increase in the atmospheric contamination, as studied by Vazquez et al. [
28], among others. Nonetheless, no research on the heavy metal concentrations in street dusts has been performed here; this, in addition to the increasing social concern about the environmental conditions of cities and the health repercussions, justifies this research proposal.
The initial hypothesis is that the urban dust in the city of Murcia contains, among other pollutants, heavy metals. Besides, it is believed that the concentrations of these elements rely upon diverse factors, such as the traffic intensity or the location of the sample, and that the primary source of emission of heavy metals is motorized vehicles, without dismissing other minor sources. On that basis, the objectives of this work are:
To determine the heavy metal concentrations in the street dust and compare them with the values of other cities, thus establishing the contamination levels.
To study the correlation of the heavy metals with the color of the street dust, the traffic intensity, and the location of the sample (sidewalk, ledge, and road).
To define the heavy metal enrichment factor of the street dust, relative to the background of the sidewalk, and obtain the degree of pollution.
2. Materials and Methods
2.1. Area of Study and Sampling Design
The urban center of the city of Murcia was the area of study. This city might be considered a typical medium-sized European city, with 439,000 inhabitants, and which covers an area slightly greater than 3 km2. Activities related to the services sector and agri-food industry are carried out in the surrounding industrial area.
The city of Murcia has a semiarid Mediterranean climate with a mean annual precipitation of approximately 300 mm and a mean annual temperature of 18 °C. Besides, it has winds which tend to blow from the east–southeast from the last months of spring until the end of autumn and during the winter, whereas in the first months of spring they blow from the west. Regarding the predominant type of soil around the city, it is chalky in nature with a basic pH and a loamy texture which tends to be silty or clayey.
The sampling design was systematic, with the collection of samples every 150 m, amounting to a total of 127 samples of street dust (
Figure 1) and 8 of asphalt. The sampling was carried out in winter 2016 and coincided with a low-rainfall period. The street dust samples were taken preferentially in the roads (between parked cars), as well as from sidewalks, window ledges, doors, and fences (
Figure S1). The superficial dust of each selected point was sampled in an area of 1 m
2 using a plastic dustpan and brushes, sifted through a 1 mm mesh (nonmetallic), and kept in plastic containers at 4 °C prior to sample preparation and analysis.
As most of the street dust samples were taken in roads, it was deemed appropriate to determine the sidewalk background level, which is an innovative approach infrequently found in the references consulted, in which the soil was commonly utilized to obtain the background values. The sidewalk background level was determined in order to ascertain the quantity of heavy metals deposited in these materials—made up of concrete, gravel, etc.—which can alter the results obtained in the heavy metal analysis of the street dust.
2.2. Sample Analysis
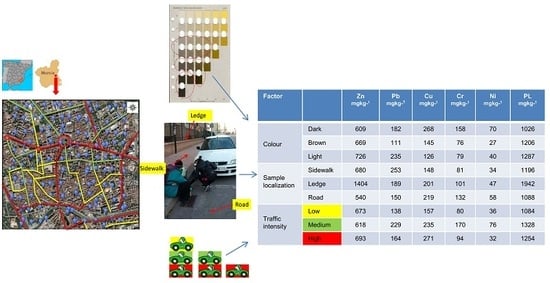
The color of the samples was estimated with the Munsell color keys [
29] and then they were clustered in three different categories: Light (value between 5 and 6), Dark (value between 2 and 3), and Brown (value of 4); all categories had the same 2.5Y HUE. The weekly traffic intensity was provided by the Traffic Police Headquarters of the city of Murcia. It was classified in three different categories: High intensity (>65,000), Medium intensity (65,000–45,000), and Low intensity (<45,000) (
Figure 1).
The samples were air-dried and passed through a 50 µm sieve prior to acid digestion with aqua regia (HNO3/HCl, 1:3) in a microwave oven at 220 °C for 1 h. Subsequently, inductively coupled plasma mass spectrometry (ICP-MS) was used to determine the following elements: As, Cd, Cu, Cr, Fe, Mn, Ni, Pb, Ti, V, and Zn (total metal concentration).
Blank samples, a standard reference material certified for its element content (SRM San Joaquín Soil) and used to provide the baseline trace element concentrations, and duplicated samples were analyzed simultaneously to provide quality control. The standard deviation was calculated (2.5–3%) and can be considered satisfactory for environmental analysis. We obtained recoveries of 93–102% for Zn, 95–101% for Pb, 91–98% for Cu, 94–99% for Cr, 98–102% for Ni, and 95–101% for Cd.
X-ray diffraction (XRD) was used to detect the mineral composition of the samples. The samples were ground in an agate mortar and mounted on a petrographic slide prior to XRD analysis. We observed the morphology and estimated the in situ chemical composition of selected samples using scanning electron microscopy (SEM) with an energy dispersive system (EDS).
2.3. Pollutant Load of the Urban Dust
On the basis of the individual concentrations of each of the heavy metals, the pollutant load of the urban dust (PL) was calculated, considering this the total sum of the concentrations of the 11 elements considered, although Fe is regarded as a nontoxic element in practically most of the guidelines consulted.
where Cx sample represents the concentration of element x.
2.4. Contamination Level
In the absence of a specific regulation with regard to the street dust reference levels, upon which the level of risk of the dust can be established, values referring to soils from Aguilar et al. [
30] were considered. Hence, several contamination levels were contemplated (
Table S1):
Reference Level (RL): The maximum permissible value for nonpolluted soils.
Recommended Research Level (RRL): The warning level at which the existence of threatening contamination is suspected.
Obligatory Research Level (ORL): At this threshold, the ground is polluted and there is an obligation to adequately research this contamination.
Intervention Level (IL): It is accepted that the ground is contaminated at hazardous levels and that immediate further action is required.
In-depth research was carried out for each of the heavy metals that, according to Aguilar et al. [
30], might represent a threat to public health: Cd, Cr, Cu, Ni, Pb, and Zn.
2.5. Enrichment Factor
Enrichment factors (EFs) were initially proposed to describe metal pollution levels in the atmosphere [
31,
32]. Subsequently, this method has been applied in many areas, especially for the evaluation of metals in soil and dust. The EFs for the metals in the dust samples were calculated as follows [
32,
33]:
where Cx represents the concentration of element x, Cref is the concentration of the reference element, in our case Ca, which is the main element found both in the dust and on the pavement. The values obtained after the analysis of the asphalt were used as background values.
The EF categories were defined [
33] as: deficient to minimal enrichment when EF < 2, moderate enrichment when EF = 2–5, substantial enrichment when EF = 5–20, very high enrichment when EF = 20–40, and extremely high enrichment when EF > 40.
2.6. Statistical Treatment of the Samples
The statistical treatment was carried out with Statgraphic Plus 5.1 software (Statpoint Technologies Inc., 1992). A discriminant analysis and a Spearman correlation matrix were executed, as well as an analysis of variance via the nonparametric Kruskal-Wallis test, which utilizes the median as the most centered value, when the normality and the homoscedasticity of the analyzed variable cannot be guaranteed.
3. Results and Discussion
The matrix resulting from the urban dust in the city of Murcia was considerably similar in all the samples and it comprised a heterogeneous mixture, fundamentally carbonated, in which calcite accounted for 47–50% of the total, dolomite for 28–30%, quartz for 20%, and gypsum and phyllosilicates less than 5% (
Figure S2). It is important to point out that in some cases, traces of magnetite and other iron ores were found (
Figure S3).
Acosta et al. [
5], when researching the physical constitution of garden soils in Murcia by X-ray diffraction and electron microscopy, found similar results, with a predominance of calcite, dolomite, and quartz, and smaller quantities of feldspars, micas, kaolinite, and goethite. It appears that metals such as Zn and Pb easily react with carbonates to form metallic carbonates and minerals on the surface of the calcite and dolomite crystals [
34]. Some Fe-containing compounds, such as magnetite and maghemite (
Figure S3), and other minerals found in ash and in gases emitted from motorized vehicles and chimneys are responsible for the magnetic properties of urban dust, and thus they might act as condensation nuclei where other heavy metals, such as Cr, Ni, and Rb, are absorbed.
The concentrations of the 11 heavy metals found in the street dust of the city of Murcia differed considerably, the average values ranging between 0.4 and 15,753 mg/kg, in the cases of Cd and Fe, respectively (
Table 1). Also, there was great variability in the concentration of each of the elements analyzed, as found by Kabadayi and Cesur [
18] in Turkey and by Trujillo et al. [
17] in Colombia.
In the street dust of the city of Murcia, there were heavy metals whose average concentration (
Table 1), according to the thresholds proposed by Aguilar et al. [
30] (
Table S1), reached the RRL such as Cr (118 mg/kg), Cu (201 mg/kg), and Ni (51 mg/kg), or even the ORL, as in the case of Zn (653 mg/kg. Occasionally, they even reached the IL established by the regulation for parks; that is to say, some unusual areas exist where the toxicity hazard is higher. In their research on street dusts, De la Losa et al. [
35] assigned an anthropogenic origin (phytosanitary products, industrial wastes, or the traffic intensity) to the heavy metals Cd, Cr, Cu, Ni, Pb, and Zn; due to their dangerousness, concentrations, and origin, we are going to refer to these in more detail in this work.
The discriminant analysis carried out for the 127 samples (
Table S2) confirmed the existence of three different classification variables: the localization, the color of the sample, and the traffic intensity. These enabled the correct classification of a high percentage of the samples according to three discrimination levels for each variable and for the 12 predictor variables (heavy metals and PL).
On the one hand and as can be observed in
Table S2, the discriminant functions with a value of
p < 0.01 were statistically significant with a 99% confidence level, thus evincing that the sampling location, with 68% of cases correctly classified, and the color of the samples, with 64%, allowed the proper classification of the 127 observations according to the three different levels established for each of the aforementioned classification variables. Taking into account the large number of factors that might influence the nature and the characteristics of the samples, it can be considered that the discriminant functions obtained are acceptably positive for this kind of study. In the case of the traffic intensity, the three intervals defined might justify a 57%.
On the other hand, a direct relationship among the color of the samples, the location, and the traffic intensity has been proven. As shown in
Table 2, there was an acceptable correlation between these variables, such that among the samples collected from the ledges, 75% had a light color, none had a dark color, and the rest had a brown color. In addition, among the samples from the road, 66% had a dark color and 20% had a brown color, while the remaining 14% had a light color. Nonetheless, the correlation with the traffic intensity was not outstanding, since a positive correlation was evidenced only for medium and high intensity, when dark colors were predominant, representing 63% and 64% of the samples, respectively.
Considering that the exposure of all the samples to the air pollution by gases and suspended particles was identical, the cause of the aforesaid color differences has to be sought in other factors that affected some sampling locations more than others. Accordingly, it is logical to assume that the color of the roads was influenced by the existing traffic, the tire wear [
36], and the color of the asphalted concrete, a constituent of the road. With regard to the ledges, the light color was prominent as a consequence of the weathering of the façades built with carbonate rocks, such as calcarenites, limestones, and marbles, along with other claddings like gypsum or lime. The sidewalks are the places where the pedestrians walk; however, the brown color of the samples collected in these locations seemed to depend upon, on the one hand, the dust from the ledges that, as has just been mentioned, has a light color and, on the other hand, the soil particles attached to the footwear, which originate from the gardens of the city and the sidewalks.
3.1.Pollutant Load (PL)
The pollutant load (PL) of the urban dust in the city of Murcia will help us to identify the focal points of contamination or the factors which might influence most greatly the contamination by heavy metals in urban dust. This variable had a mean value of 1201 mg/kg, with a minimum of 147 and a maximum of 9814 mg/kg (
Table 1).
As
Table S3 shows, the PL differed statistically among the three different categories of color and traffic intensity considered, whilst regarding the sample localization, the PL was homogeneous in the three settings (sidewalks, ledges, and roads). The PL was highest in the dark-colored samples and in those subjected to medium or high traffic intensity.
The urban dust enrichment factor of the elements assessed in the PL, relative to the background (asphalt), was seven; according to the categories stated in the Materials and Methods, this represents a substantial enrichment, suggestive of significant pollution.
Furthermore, the Spearman correlation matrix (
Table S4) displays a significant correlation between the heavy metals and the PL. Nonetheless, poor correlation among most of the elements is shown, as observed by other authors [
15]. Chromium is the element that exhibited the highest correlation coefficients, along with greater significance levels, especially with Ni (r = 0.9909 **, significant correlation at a 0.01 level, bilateral) as found also by Lu et al. [
37]. Likewise, Fe showed high and significant correlations with Cd, Mn, and Ni, and Zn exhibited an adequate correlation coefficient in its relationship with Cd (0.507 **, significant correlation at a 0.01 level, bilateral); other authors did not find correlations of Zn with Pb or Cu [
38]. Besides, it is important to point out the high significance of the relationships between Cd and several other metals, such as Cu, Ti, V, and Mn, though in some cases with poor correlation coefficients.
The results obtained were compared with similar research carried out in other cities (
Table 3), where the mean values showed great variability, essentially due to different soil usages [
17,
20] and traffic intensities [
6,
24,
25].
It can be seen that in Murcia, both Zn and Cr surpass the mean values found in Madrid, while Cu and Ni also exceed the values of Madrid, particularly at some of the traffic densities considered. Notwithstanding, in the case of Pb, the mean values presented in this work are far below those reported by De Miguel et al. [
26]. With minor exceptions, the total mean values of this work are remarkably similar to those shown by Wei and Yang [
20] for several Chinese cities.
3.2. Zinc
Mining, waste, or coal burning, and mills are among the anthropogenic sources of Zn. It is commonly used as an anticorrosive, as a white pigment (ZnO), and in the battery industry.
It is considered to be relatively nontoxic, and once present in the human body, it is eliminated through the urine and feces [
42]. However, an excessive quantity of Zn might cause several dysfunctions that give rise to growth and reproduction deterioration, gastrointestinal problems, skin irritation, nausea, and pancreas damage [
1].
Zinc was the main element found in the street dust of Murcia, as in other cities [
16,
19,
26,
43,
44,
45]. The mean value of 653 mg/kg (
Table 1) is similar to those found in other cities such as Manchester [
40], Istanbul [
16], or the Chinese cities studied by Wei and Yang [
20]. The EF of Zn in the street dust with regard to the background (asphalt) in this work was 20; according to the categories defined, this represents very high enrichment, and thus a very strong pollution signal.
The analysis of variance shows that the Zn concentration (
Table S5) differed statistically among the three color categories considered: it was highest in the light-colored dusts and lowest in the dark-colored ones. Nevertheless, though the Zn concentration was homogenous in the sidewalks, ledges, and roads, it differed statistically among the three traffic intensity levels. As shown in
Figure 2, Zn was significantly more abundant in the light-colored samples located on the ledges of the streets with high traffic intensity, where Zn easily surpassed the NI proposed by Aguilar et al. [
30].
The Zn in street dust originates mainly from automobile tire wear [
36,
46]; consequently, it should appear preferably in roads. Furthermore, road and sidewalk cleaning operations are carried out daily in the city of Murcia, whereas ledges remain without being cleaned for longer periods of time; in some cases they are only cleaned when it rains, which is a rare phenomenon in Murcia. Thus, it can be assumed that Zn is mainly eliminated from the roads solubilized in the water utilized for street cleaning. Subsequently, it might reach rivers through the sewage system, increasing their contamination, as has been evinced by analysis of the urban and road runoff [
11,
47].
Conversely, the dust accumulated on ledges indicates the composition of the finest street dust particles [
5], which are the ones remaining longer in suspension, especially if this is favored by air currents, either natural or of anthropogenic origin [
28]. In this sense, the use of forcing air turbines, such as the ones currently used in the city of Murcia, to clean the sidewalks and other places of difficult access should be evaluated, since they stir up a large amount of dust which can easily get into houses and air-conditioning circuits or be inhaled by inhabitants. In addition, other places, such as balconies, windows, and terraces, might represent hazardous areas that would require special cleaning and vigilance programs.
3.3. Lead
The mean value of the samples (177 mg/kg,
Table 1) is lower than the values reported for other cities [
16,
17,
20,
41]. Historically, vehicle gaseous emissions were responsible to a great extent for Pb pollution in cities; however, the decrease and near elimination of Pb in petrol led to a lessening of the urban concentrations of this metal in the 1970s [
48].
The EF of Pb in the urban dust in the city of Murcia, with regard to the background (asphalt), was 45, representing extremely high enrichment, suggestive of significant pollution.
Regarding the color, statistically significant differences were found. The concentration of Pb was highest in the light-colored samples and lowest in the brown ones (
Table S6), reaching an RRL above all in areas affected by medium traffic intensity. The Pb concentration was statistically different for the three levels of traffic intensity. Similar results have been reported previously [
6,
8,
17].
When studying the interactions among the different factors (
Figure 3), it is observed that Pb accumulated particularly in the light-colored samples collected in sidewalks (
Figure 3A), these samples attaining an ORL [
30]. The highest levels occurred in the areas with medium traffic intensity, regardless of the color of the samples (
Figure 3).
Taking into account that Pb must basically originate in the fuels used by vehicles, it would be logical to find the highest levels in roads with higher traffic intensity; nonetheless, as with Zn, this did not occur. The aforementioned behavior may be related to the contribution of this metal by other sources, such as certain types of paints and pigments [
6], or, more probably, to its preferential accumulation in sidewalks and ledges (forming part of the finest street dust particles [
6]) where the cleaning processes are less frequent.
It is assumed that the water used for road cleaning favors the elimination of Pb, either solubilized or in suspension, thus largely eradicating it from the roads. The effects of sweeping and road cleaning have been under consideration for a long time [
10,
49], as has the runoff water from roads [
11].
Bearing in mind the different places where Pb tends to accumulate (sidewalks and ledges), as well as the levels it reaches (RRL or ORL), there is a real probability that part of this Pb might be transported into houses, either through impregnation of footwear or via windows, ledges, or balconies. These aspects must be taken into account due to the direct influence that they may have on health, since, as is widely known, Pb does not have a known biological function in organisms, either plant or animal, and is highly toxic to mammals and aquatic organisms. Lead poisoning can produce mental retardation in children, neuropathies and hypertension in adults, and Pb might even be lethal when its presence exceeds 25 µg/kg of weight [
1]. This reality must be considered when establishing the cleaning and maintenance programs in public and private buildings, as well as in homes.
3.4. Copper
The anthropogenic sources of Cu include mining and its derivatives, the electricity industry, agriculture, the steel industry, and sewage sludge. Most of the Cu composites found in the air, water, sediment, soil, and rocks are firmly attached to dust or to other particles in suspension [
42].
The mean concentration of Cu in Murcia’s street dust (201 mg/kg,
Table 1) is high when compared to other cities, such as Manchester (113 mg/kg, [
40]), Madrid (188 mg/kg, [
39]), or Ulsan, South Korea (182 mg/kg, [
25]).
The EF of this metal in the street dust in the city of Murcia with regard to the background was 12, which implies substantial enrichment. Copper only had a significant correlation with Fe (
Table S4), though with a low r value and a high significance (0.308 **, ** significant correlation at a 0.01 level, bilateral,
Table S4). No significant correlation was found with any other element. Nonetheless, Christoforidis and Stamatis [
38] did find highly significant correlations of Cu with As (r = 0.962) and Pb (r = 0.833). Copper was the single metal analyzed which showed statistical differences for the three factors assessed (
Table S7), it was especially abundant in the dark-colored samples in roads with high traffic intensity (
Figure 4).
The behavior of Cu, after joint analysis of the color and traffic intensity factors, is presented in
Figure 4B, which shows a linear increase in its concentration in dark and brown-colored dust as traffic increases. Notwithstanding,
Figure 4A shows that the concentration in roads had a behavior similar to that mentioned in relation to the color, the highest concentration even reaching an ORL. This heavy metal was associated most closely with the pollution produced by motorized vehicles, as has been reported in other work [
17,
24,
25].
Due to the absence of more specific studies, Cu has not been classified regarding its carcinogenicity in human beings [
42], though its toxic effects have been described [
50], including kidney damage and muscle pain when Cu intake exceeds 12 mg/day. According to the results obtained in this work, it can be assumed that Cu represents an important risk to health, mainly in streets with high traffic intensity, as it accumulates in roads. The metal complex stability tends to adopt the following sequence: Cu > Fe > Mn = Co > Zn. Therefore, Cu might appear in the form of complexes [
8], which could explain its persistence in roads, unlike Zn and Pb.
3.5. Chromium
Regarding the origin of the Cr found in street dusts, the reference consulted relates it to the plating industry, steel alloys, other automobile parts, and street infrastructure.
The mean value of Cr (117 mg/kg,
Table 1) can be considered high when compared with the rest of the cities listed in
Table 3. The analysis of variance shows that the Cr concentration did not vary significantly when considering the dust color, traffic intensity, or sampling area (
Table S8).
The concentration of Cr was highest in dark-colored samples (158 mg/kg), but, in connection with the traffic intensity, its behavior coincided with that of Pb and its concentration was statistically higher in those roads affected by medium traffic intensity. The highest concentrations of Cr in the street dust in Murcia (
Figure 5) were detected in dark-colored samples located in roads, followed by sidewalks.
Moreover, the values in both locations were affected by medium traffic intensity, for which an RRL was reached. Thus, this is a pollutant of street dust that, even though it does not attain the same risk levels as the aforementioned elements, might represent a certain danger. Its toxicity is variable and depends on its valence: Cr3+ is only slightly toxic in comparison with Cr6+, whose ingestion or inhalation can cause kidney and liver damage as well as carcinogenic effects. The EF of this metal in the street dust in the city of Murcia, with regard to the background, is lower than 10, suggesting substantial enrichment.
3.6. Nickel
The anthropogenic sources of Ni include fertilizers and the steel industry. It is used in plates and in the minting of coins, and other sources are burnt petrol and detergents. The Ni originating from energy plant chimneys sticks to small dust particles, which are deposited on the soil. In the presence of certain organic chelating agents, Ni can form neutral or negatively-charged soluble complexes, thus increasing its mobility in comparison with other metals.
The mean Ni concentration in the samples was 51 mg/kg (
Table 1), of the same order as in other contaminated cities [
17,
20]. Furthermore, its accumulation was below the ORL proposed by Aguilar et al. [
30]. The analysis of variance shows that the Ni concentrations only differed statistically according to the sample color (
Table S9); the highest levels occurred in the dark-colored samples, around 70 mg/kg (
Figure 6).
Similar to Cr, the concentration of this metal was highest in the dark-colored samples taken from roads affected by medium traffic intensity, where it reached an ORL. All this is in line with the strong correlation detected between these two heavy metals, the highest and most significant correlation found in this work (0.991 **, significant correlation at a 0.01 level, bilateral,
Table S4). Nickel poisoning produces dermatitis, asthma attacks, gastric irritation, and ontological processes [
51]. Among all the heavy metals studied for the city of Murcia, this is the one with the lowest enrichment factor (5), indicating moderate enrichment.
3.7. Cadmium
This element had a mean concentration of 0.5 mg/kg. Since the RL for Cd is around 10 times higher, no detailed research was carried out for this element.
4. Conclusions
Zinc is the main heavy metal in street dust in the city of Murcia. The Cu and Cr values can be considered as high, whilst the mean value of Ni in the samples studied is similar to that in other polluted cities and the values of Pb found are below those of other cities. The mean values of Zn, Pb, Cu, Cr, and Ni exceed the RL, reaching the RRL for Pb, Cr, Cu, and Ni and even an ORL in the case of Zn. Some isolated samples attained an IL; therefore, an immediate intervention is necessary.
The grouping variables, such as the color and the traffic intensity, performed well when establishing differences among the heavy metals studied as a whole, the case of Ni and the traffic intensity being the only exception. Nonetheless, the sample location allowed differentiation in the isolated case of Cu. The risk of heavy metal contamination is greatest on the ledges of narrow streets in the city center with medium traffic intensity, where Zn and Pb tend to accumulate. The anthropogenic source of these two elements is related to traffic. The analysis of the color of the urban dust revealed that the dark samples were the most contaminated; thus, the color can be considered as a proxy for rapid diagnoses. The enrichment factor in the street dust in the city of Murcia is moderate for Ni, substantial for Cr and Cu, and very high for Zn and Pb.
It would be desirable to carry out new sampling in the urban core balconies and terraces to verify whether or not this pattern is repeated, to determine the vertical distribution of the street dust pollution and its presence in houses, and to establish security measures, such as green barriers, curtains, behavioral patterns, and new cleaning proposals, to attenuate this contamination.

 ,
, 


