Article

Capturing the Risk-Pooling Effect through Inventory Planning and Demand Switching

1
Institute of Technology Management, National Chung Hsing University, Taichung 402, Taiwan
2
Department of Business Administration, National Changhua University of Education, Changhua 500 Taiwan
*
Author to whom correspondence should be addressed.
Sustainability 2018, 10(11), 4104; https://doi.org/10.3390/su10114104
Submission received: 22 October 2018 / Revised: 31 October 2018 / Accepted: 6 November 2018 / Published: 8 November 2018
(This article belongs to the Section Economic and Business Aspects of Sustainability)

Abstract

:
This paper demonstrates how firms can deal with demand uncertainty through inventory planning and demand switching, which take advantage of the risk-pooling effect and contribute to supply-chain sustainability. Considering two types of products and two outsourcing strategies (competitive bidding, and consignment stock under the (Q, R) inventory policy with variable lead times), the study helps determine the appropriate outsourcing strategy when a firm practices demand switching. Under certain conditions, the study further identifies the proper demand-switching direction and optimum switching-rate to achieve the minimum total purchase and inventory costs in association with outsourcing. Prior research generally implies that demand switching increases costs or profit benefits. This implication, however, does not hold true in the present context. The study presents numerical examples to illustrate the derived models. The findings enrich the extant literature by incorporating demand switching into the outsourcing practices, which is beneficial to both practitioners and scholars.

1. Introduction and Literature Review

Uncertainty represents one of the most critical issues facing firms around the world. Particularly, product demand exemplifies the key source of uncertainty in a typical production-distribution system [1]. Misestimating demand uncertainty and its impact either leads to unsatisfied customers, translating to loss of market share, or excessive inventory entailing extravagant holding costs [2]. Demand uncertainty along with variable replenishment lead time in the current market settings in which the profit margins are extremely tight makes it further challenging for firms to manage inventory [3,4,5]. In supply-chain management, supply-chain sustainability is related to the environmental friendship, such as reducing goods leftovers, and economic sustainability, such as increasing return on investment [6]. Risky managerial failures result in possible planning decisions that neither protect a firm against threats nor take advantage of the opportunities that uncertainties and an unsustainable supply chain may provide. Choi and Chiu [7] propose a measurement of supply chain sustainability. They are the expected amount of goods leftovers, the rate of return on investment, and the expected sales compared to the expected amount of leftovers. There are a few studies that use these factors to analyze supply-chain sustainability. Our research focuses on sustainable supply-chain operations, in which smaller amount of obsolete inventory implies efficient inventory management (environmental sustainability), and risk-pooling suggests capital investment reduction (economic sustainability).
Researchers suggest that firms can reduce the impact arising from demand variability internally or externally [8,9]. Early research focuses on the internal approach and suggests that firms can adopt common components for different products and, for example, employ the assemble-to-order strategy [10,11]. As such, firms benefit from the risk-pooling effect [12]. Later, researchers turn their attention to a number of external approaches. Outsourcing signifies an exemplary external approach that focuses on the “supply” side. Indeed, in the 1990s outsourcing became the focus of many manufacturers [13,14]. More production enterprises choose to outsource when faced with competition from the perspective of the structural advantage of a decentralized supply chain, which may also enhance the sustainability of the supply chain [15]. Outsourcing allows firms not only to reduce capital investment and focus on core competency [16] but also to transfer demand uncertainty from their suppliers. These suppliers aggregate demand from many buying firms and thus reduce uncertainty through the risk-pooling effect, which contributes to supply-chain sustainability. On the other hand, under the return policy, the supplier can be a brand owner that focuses on production and then outsource retailing to the retailer. Thus, the cost of physical return significantly affects the rate of return on investment and the firm’s sustainability [17]. To stay flexible, firms exercise several outsourcing options or scenarios. Particularly, competitive bidding and consignment stock represent two popular forms of outsourcing [18]. When firms practice competitive bidding, they have the flexibility to select suppliers based on market conditions and thus the ability to achieve lower cost and better quality. Nonetheless, delivery lead-time and inventory become concerns. In contrast, firms may adopt the consignment stock option as an outsourcing alternative. The continuous replenishment from the supplier protects the firm against demand fluctuations per se. The firm always has raw material available and pays for raw material consumption only when the items are drawn on for use, saving holding costs as a result [19].
During the last decade, researchers have proposed another external approach centering on the “demand” side, which focuses on changing external consumers’ demand, namely, demand substitution, reshaping, or switching [20,21,22,23,24,25]. For cases in which customers switch to an available item when the original item is out of stock, Smith and Agrawal [25] have developed a methodology for selecting item inventory levels to maximize total expected profit, subject to given resource constraints. Likewise, under substitution, Mahajan and Van Ryzin [23] maintain that firms should stock more popular variants and fewer unpopular variants than a traditional newsboy analysis suggests. Even if the original product is available, Eynan and Fouque [20] argue that by reshaping demand, the total uncertainty of demand (measured as the sum of modified standard deviations) is reduced. Essentially, this approach encourages consumers to purchase a substitute item rather than the item they intend to purchase initially through marketing approaches (e.g., discounts). These practices increase the demand mean and variability of the substitute product while reducing them for the original product, bringing down the overall demand variability and thus related costs (e.g., inventory costs). Consequently, firms are able to increase their profits; the aggregate-product service level also increases, while the individual-product service levels remain unchanged. Notably, even switching a small proportion of customers results in an impressive profit increase [20]. When more than two products are considered, Hsieh [22], however, states that the firm’s profit does not necessarily increase as the switching rate increases. In some cases, the firm’s profit may even decrease as a result of demand switching. The above key literature review is summarized in Table 1.
As can be seen, these frequently endorsed approaches largely take advantage of the risk-pooling effect and supply-chain sustainability to ease the impact of demand uncertainty. Reviews of these studies suggests research opportunities to integrate these approaches. Indeed, Eynan and Fouque [8] explore the efficiencies of the two approaches based on component commonality and demand reshaping; they compare the performance and investigate the potential benefits of employing both approaches simultaneously. Likewise, the growing importance of outsourcing and the increased focus on customer demand suggests the opportunity to integrate both research avenues in outsourcing planning and demand switching. This particular opportunity, however, has attracted insufficient attention and thus warrants research.
In light of this deficiency in research, the present study aims to explore if firms, in an effort to cope with demand uncertainty, can improve their outsourcing practices through demand switching, benefiting from the risk-pooling effect and supply-chain sustainability. Specifically, our study addresses the following research questions: (1) How should firms choose between outsourcing options under demand switching? (2) What is the optimum demand-switching direction and the corresponding switching rate for each outsourcing option that yields the lowest overall cost?
Without loss of generality, the study considers a firm that sells two products with correlated demand. Under the (Q, R) inventory policy with variable lead time, the firm may implement competitive bidding or consignment stock as its outsourcing strategy. Answering the above questions contributes to existing knowledge in two ways. For academics, the developed model serves to bridge two emerging research topics on outsourcing planning and demand switching. For practitioners, the findings facilitate the decision-making process in outsourcing implementation under demand switching, which takes advantage of supply-chain sustainability.
The remaining sections of the study are structured as follows: Section 2 presents related assumptions and definitions. Identification of the appropriate outsourcing option under demand switching is demonstrated in Section 3. The study develops models to determine the optimum switching direction and rate in Section 4. Particularly, the study proposes an algorithm to determine the optimum outsourcing scenario and the corresponding demand-switching parameters. The developed models and algorithm are illustrated and evaluated with numerical examples in Section 5. Finally, Section 6 concludes the study and provides suggestions for future research.

2. Basic Definitions and Assumptions

In this section, basic definitions and assumptions are presented. These definitions are used throughout the study. Particularly, for each product i (i = 1, 2),
  • μ i = mean of the original demand per unit time,
  • σ i = standard deviation of the original demand,
  • μ L i = mean of the delivery lead-time, and
  • σ L i = standard deviation of the lead time.
Additionally, the following variables are defined:
  • ρ = correlation coefficient between products’ demands, and
  • α = switching rate—proportion of demand switched between products.
Note that 1 ρ 1 and 0 α 1 by definition. The study further assumes that the demand and delivery lead-time [19] for each product are normally distributed. For each product, the mean demand after switching (from Product 1 to Product 2) is modified as follows, in which the ‘^’ sign denotes the respective parameters after switching:
μ ^ 1 = ( 1 α ) μ 1
μ ^ 2 = α μ 1 + μ 2
Likewise, the standard deviation after switching can be calculated and is given by
σ ^ 1 = ( 1 α ) σ 1
σ ^ 2 = α 2 σ 1 2 + 2 α ρ σ 1 σ 2 + σ 2 2 .

2.1. Competitive Bidding

In this outsourcing scenario, the firm’s suppliers are not bound by long-term agreements or contracts with the firm, and the firm is responsible for the demand uncertainty by carrying inventory. Namely, the total cost ( ϕ ) incurred encompasses both the purchase cost and the inventory cost. The purchase cost for product i can be represented by c i μ i , in which c i is the purchase cost per unit in the competitive bidding scenario. The inventory cost is calculated by the holding cost per unit of product i per unit time ( h i ) multiplied by the average inventory level ( I n v i ). We have h i = I i c i , in which I i denotes the interest rate for holding product i per unit time. The study assumes that the firm employs a continuous review policy to manage its inventory, namely, (Q, R) policy—whenever inventory level falls to a reorder level R, place an order for Q units. Hence, the average inventory level can be computed as follows [26]:
I n v i = Q i 2 + z i σ x i
in which Q i = 2 K i μ i h i , Ki is the setup cost, zi (>0) is the factor that corresponds to the service level, and σ x i represents the standard deviation of demand during lead time for product i. Specifically,
σ x i = μ L i σ i 2 + μ i 2 σ L i 2
Thus, the cost function for product i (i.e., ϕ i ) can be expressed as the sum of the purchase and inventory costs. That is,
ϕ i = c i μ i + h i ( K i μ i 2 h i + z i μ L i σ i 2 + μ i 2 σ L i 2 ) .

2.2. Consignment Stock

In this outsourcing scenario, the vendors maintain the inventory at their own expense. In other words, the firm is not responsible for the inventory, and the total cost for product i encompasses only the purchase cost. That is,
ϕ i = c ¯ i μ i
in which c ¯ i denotes the purchase cost per unit of product i in the consignment stock scenario.

3. Determining the Appropriate Outsourcing Scenario under Demand Switching

When the firm exercises demand switching, the total cost in the competitive bidding scenario which includes the purchase and inventory costs for both products, becomes
ϕ c b = i c i μ ^ i + h i ( K i μ ^ i 2 h i + z i μ L i σ ^ i 2 + μ ^ i 2 σ L i 2 ) .
Likewise, the total cost in the consignment stock scenario including only the purchase cost for both products becomes
ϕ c s = i c ¯ i μ ^ i .
To focus on the effect of demand variability, the study assumes that c i = c , c ¯ i = c ¯ , I i = I , K i = K , z i = z , μ L i = μ L , and σ L i = σ L unless otherwise noted. Accordingly, h = h i = I i c i . Let φcb = φcs, we obtain c = c * . Particularly,
c * = u 2 + 2 v t u 4 + 4 v t u 2 2 v 2
in which
u = I K 2 ( ( 1 α ) μ 1 + α μ 1 + μ 2 ) , v = I z [ ( 1 α ) σ x 1 + α 2 σ x 1 2 + 2 α ρ σ 1 σ 2 μ L + σ x 2 2 + 2 α μ 1 μ 2 σ L 2 ] + μ 1 + μ 2 ,   and t = c ¯ ( μ 1 + μ 2 )
Namely, c * designates the threshold of the purchase cost per unit for the competitive bidding scenario compared to the consignment stock scenario. Additionally, let ψ denote the threshold percentage of the purchase cost per unit. That is, ψ = c * c ¯ , from which we derive the following proposition.
Proposition 1:
ψ is decreasing in ρ.
Proposition 1 can be explained as follows: as ρ decreases, the risk-pooling effect becomes prominent, which reduces the overall inventory cost in the competitive bidding scenario [22]. The reduction in inventory cost allows for more room for the purchase cost or a higher c*, which also entails the shrinkage of the difference between c* and c ¯ as c ¯ > c * . Consequently, both c* and ψ increase as ρ decreases. The technical proof of proposition 1 is relegated to the Appendix A.

4. Optimum Demand Switching Direction and Rate

4.1. Competitive Bidding

To be more specific, the study defines ϕ as the total cost resulting from a proportion α of Product-1 consumers switching to Product 2. Likewise, we let ϕ represent the symmetric case in which a firm’s effort results in the same proportion α of Product-2 consumers switching to Product 1. We obtain the following proposition to determine the optimum switching direction when μ 1 = μ 2 and σ 1 > σ 2 in the competitive bidding scenario. All of the technical proofs are relegated to the Appendix A.
Proposition 2:
Given μ 1 = μ 2 and σ 1 > σ 2 in the competitive bidding scenario, (1) ϕ c b < ϕ c b ; and (2) the difference ϕ c b ϕ c b decreases in ρ when 0 < α < 1 .
Proposition 2 suggests that it is more beneficial to switch customers from the product whose demand has a larger standard deviation to the product with the smaller standard deviation of demand only when these two products have the same mean in demand. Moreover, when two products are perfectly negatively correlated in demand, the two reversed switching directions engender a maximum cost difference. Notably, when the two products are different in mean demand, the favorable switching direction may change accordingly to the switching rate. Next, the following proposition specifies the optimum switching rate in the competitive bidding scenario.
Proposition 3:
In the competitive bidding scenario, ϕ c b ( α ) ϕ c b ( 1 ) . Specifically, ϕ c b ( α ) remains constant when ρ = C V 1 C V 2 = 1 and K = 0.
Proposition 3 implies that, in the competitive bidding scenario, firms are encouraged to switch all the demand for one product to the other to achieve the lowest total cost in general. Notably, the cost benefit due to demand switching arises from the reduction in inventory, which comprises two elements (see Expression (5)). The first element results from the fixed order quantity Q, which is determined by the fixed order cost K, whereas the safety stock contributes to the second element. When the order cost K is negligible, the first element becomes inconsequential, regardless of demand switching. Likewise, when two products are perfectly positively correlated in demand and the two demands have the same coefficient of variation, demand switching does not reduce the safety stock. Consequently, firms do no gain benefits from demand switching under the above circumstances.

4.2. Consignment Stock

When the firm chooses the scenario of consignment stock, one may expect that there is no need to switch demand, as the firm carries no inventory in this case. That is, ϕ c s = ϕ c s , and the optimum switching rate α* = 0.
Proposition 4:
In the consignment stock scenario, (1) ϕ c s = ϕ c s , and (2) ϕ c s remains constant regardless of α .
Based on the above propositions, the study proposes an algorithm to determine the appropriate outsourcing scenario and the corresponding demand switching parameters as follows:
Algorithm 1. (Determine optimum outsourcing scenario and demand-switching parameters).
Data: u i ,   σ i ,   c ,   c ¯ ,   u L ,   σ L ,   z ,   ρ ,   I ,   K .
If ρ = C V 1 C V 2 = 1 and K = 0, then α * = 0 (Proposition 3),
            otherwise α * = 1 .
If μ 1 = μ 2 and σ 1 > σ 2 , then ϕ c b * = ϕ c b (Proposition 2),
            otherwise ϕ c b * = Min [ ϕ c b , ϕ c b ] .
If c < c * , then use competitive bidding with demand switching (parameters: α * and ϕ c b * ),
     otherwise adopt consignment stock without demand switching (Proposition 4).

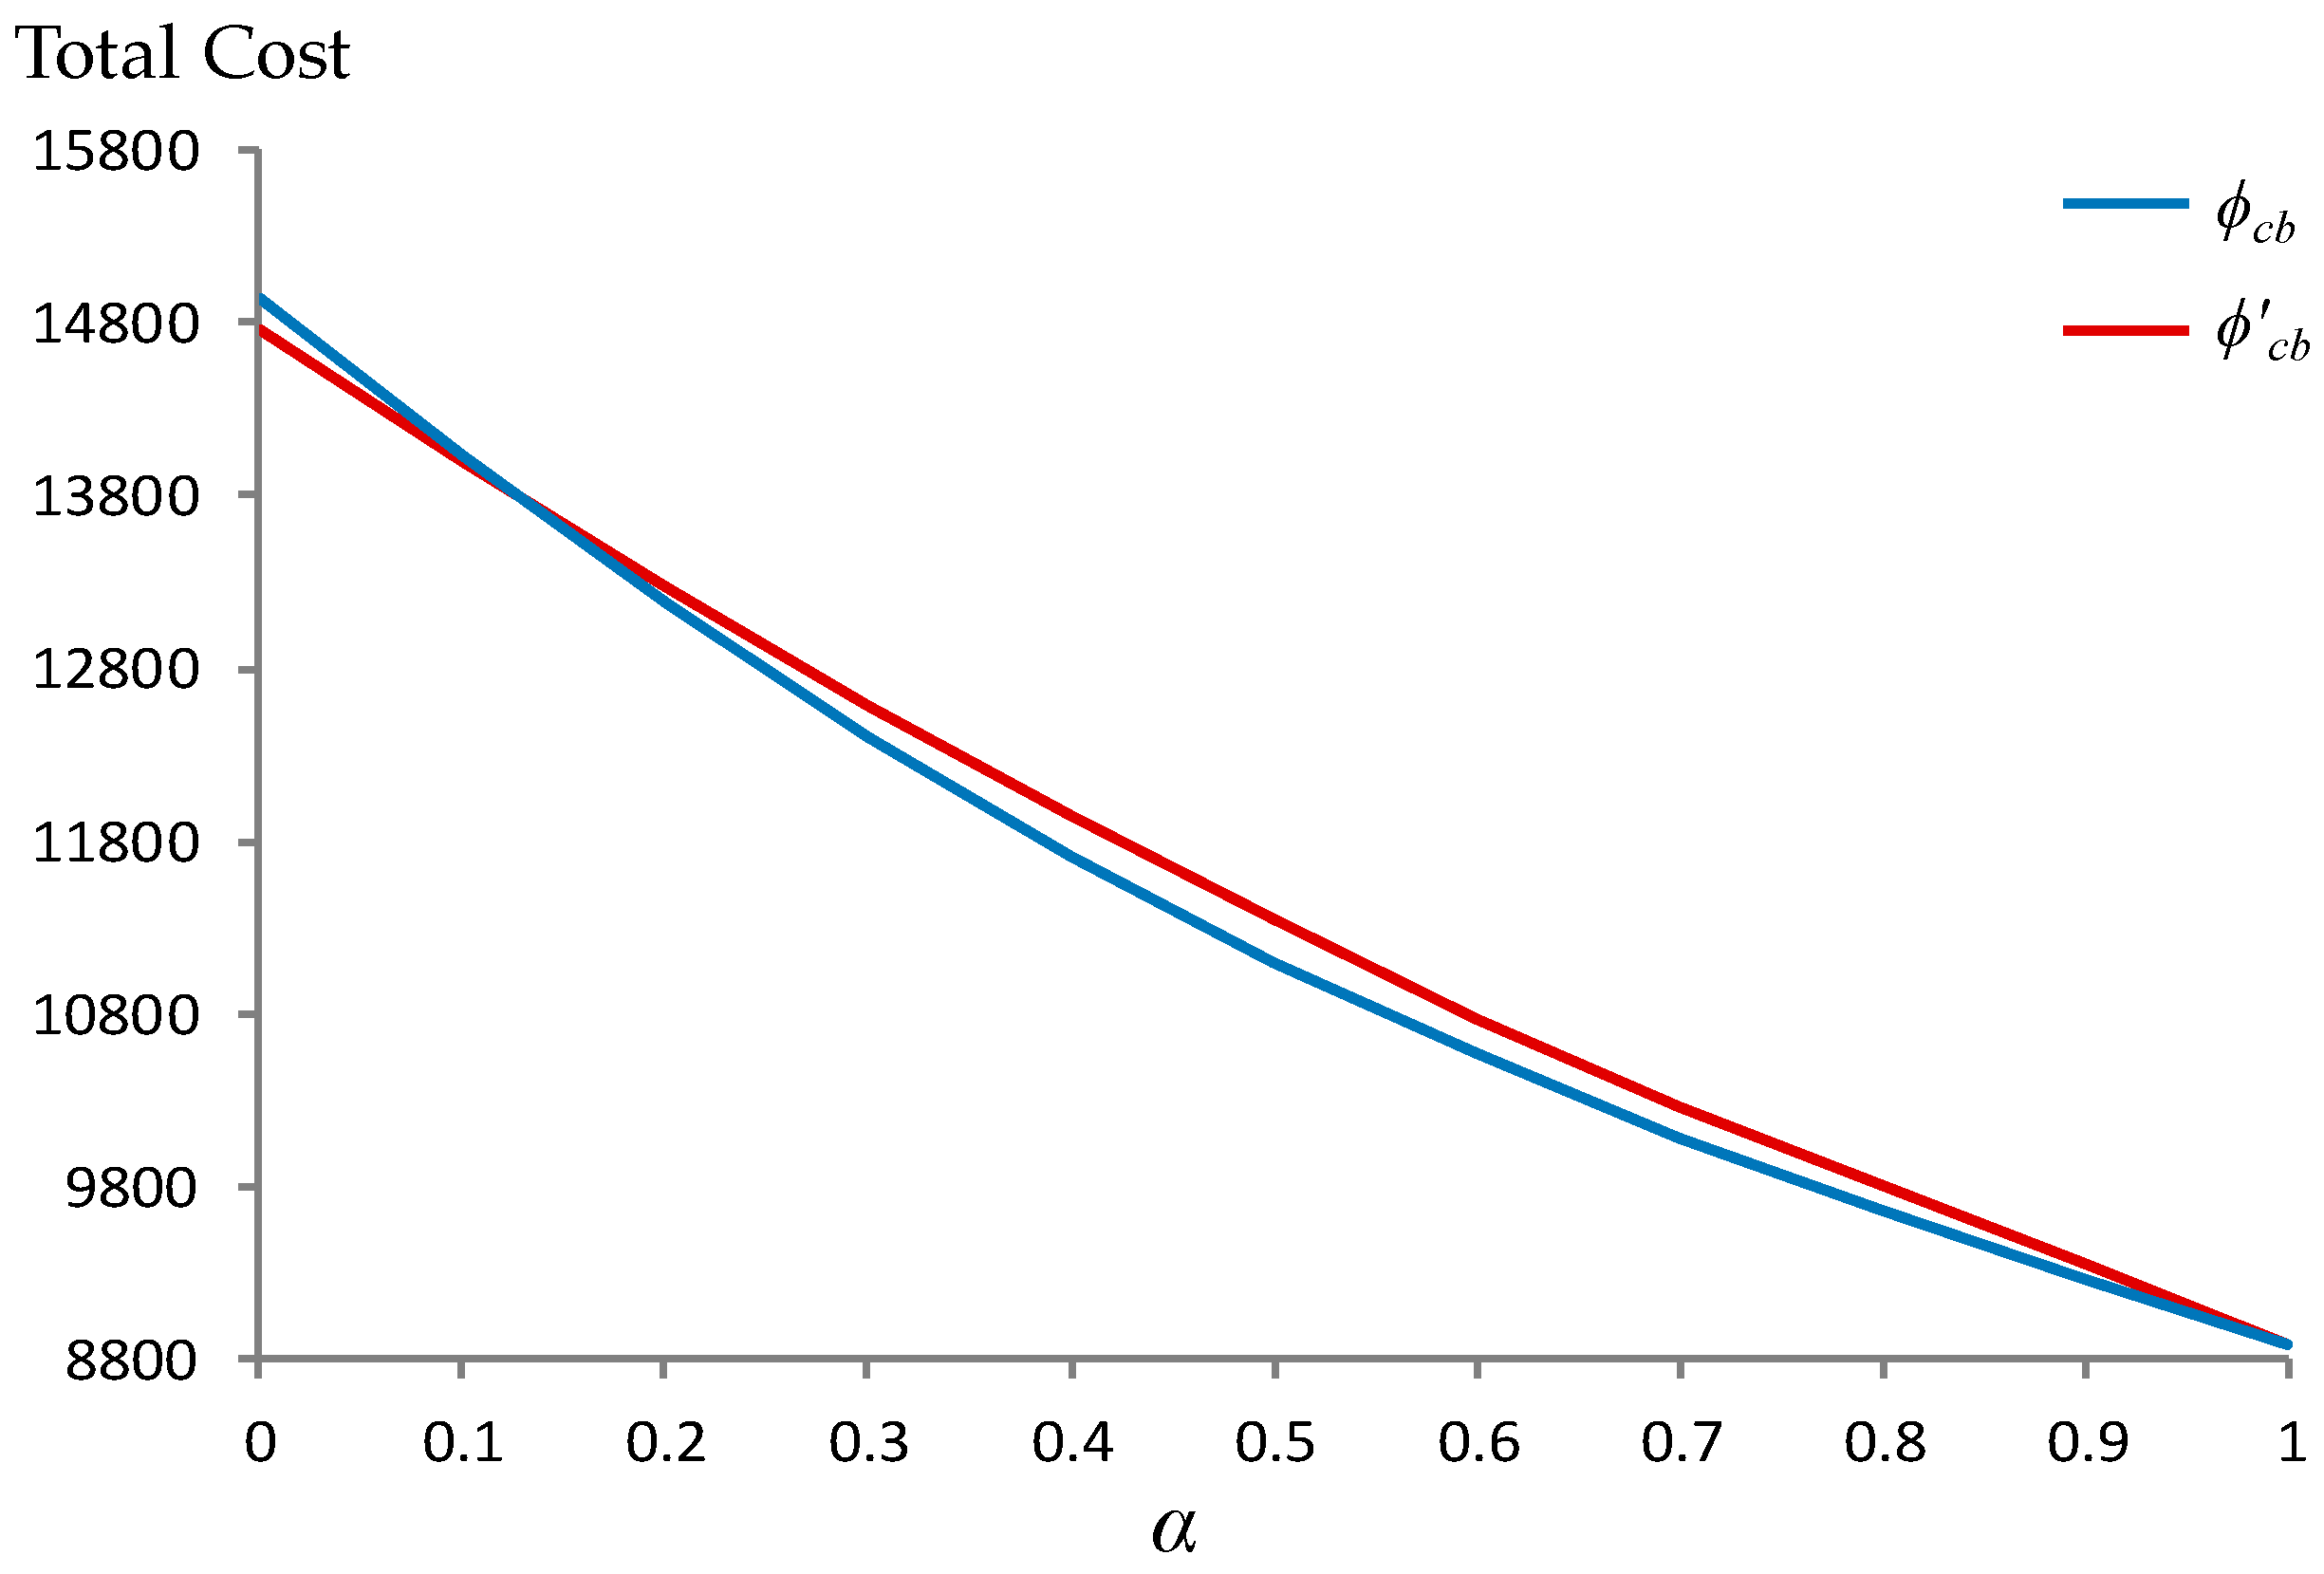
5. Numerical Examples

This section provides numerical examples to illustrate the developed models based on these parameters: c 1 ¯ = c 2 ¯ = 10 ,   u L 1 = u L 2 = 100 ,   σ L 1 = σ L 2 = 1 ,   z 1 = z 2 = 1.65 , I 1 = I 2 = 20 % ,   K 1 = K 2 = 20 , unless otherwise mentioned. The first example demonstrates how a firm determines the appropriate outsourcing scenario (competitive bidding versus consignment stock) under demand-switching using Proposition 1 ( u 1 = 3100 ,   u 2 = 2000 ,   σ 1 = 400 ,   σ 2 = 400 ,   α = 0.9 ). As Figure 1 depicts, the threshold percentage of the purchase cost per unit for the competitive bidding scenario ψ as compared to the consignment stock scenario is decreasing in ρ . Any unit purchase cost under competitive bidding c ( = c 1 = c 2 ) corresponding to the region below the curve suggests that the firm should choose the competitive bidding scenario. Otherwise, choosing the consignment stock scenario will bring forth a lower total cost. For example, the firm should consider the competitive bidding option when c < 6.63 , and it should consider the consignment stock option when c < 6.63 in the case of ρ = 0 . Furthermore, the minimum tolerable cost difference between two scenarios occurs when ρ = 1 . That is, the competitive bidding scenario is still recommended as long as the unit cost in this option is not greater than 74% of that in the consignment stock option (i.e., 7.39) when the demands are perfectly negatively correlated.
The second example demonstrates the setting of the preferred switching direction in the competitive bidding scenario ( u 1 = u 2 = 3100 ,   σ 1 = 400 ,   σ 2 = 300 ,   c 1 = c 2 = 10 ). Figure 2 suggests that given ρ = 1 , a firm is better off encouraging customers to switch from the product with the larger standard deviation (i.e., Product 1) to the one with the smaller standard deviation (i.e., Product 2) regardless of the amount being switched. Additionally, as Figure 3 shows, the cost difference resulting from the two reversed switching directions when α = 0.5 reaches a maximum level of 247.13 when the demands are perfectly negatively correlated. As noted above, when the two products are different in mean demand, the favorable switching direction may change accordingly to the switching rate. Figure 4 indicates that firms should switch from Product 2 to Product 1 when α < 0.13 , and vice versa when α 0.13 given the following parameters: u 1 = 2000 ,   u 2 = 3100 ,   σ 1 = 400 ,   σ 2 = 300 ,   c 1 = c 2 = 10 ,   ρ = 1 .
The third example illustrates the total cost change with respect to demand switching rate for various levels of correlation in the competitive bidding scenario ( u 1 = 1300 ,   u 2 = 100 ,   σ 1 = 400 , σ 2 = 30 ,   u L 1 = u L 2 = 5 ,   σ L 1 = σ L 2 = 2 ,   c 1 = c 2 = 10 ). As Figure 5 depicts, the minimum total cost of 5242.2 occurs at α = 1 when ρ = 0.5 . Namely, the firm is encouraged to switch all the demand from Product 1 to Product 2. While the optimality occurs at α = 1 , Figure 5, however, does not suggest that the more demand is switched, the more cost is saved, as Eynan and Fouque [20] indicate. Indeed, the inventory held by the firm may even increase as a result of demand switching. Figure 5 also suggests that the benefit from risk pooling decreases as the correlation between demands becomes more positive under the (Q, R) inventory policy with variable delivery lead-time. Furthermore, when the demands are perfectly positively correlated, having the same coefficient of variation, and no incurred setup cost, for example, u 1 = 4000 ,   u 2 = 3000 ,   σ 1 = 400 ,   σ 2 = 300 ,   K 1 = K 2 = 0 ,   ρ = 1 , demand-switching becomes redundant, as the total cost remains constant (=16,334) (Figure 6).
The final example demonstrates how the proposed algorithm facilitates the selection between competitive bidding and consignment stock options under demand switching. Given the parameters u 1 = u 2 = 3100 ,   σ 1 = 400 ,   σ 2 = 300 ,   c 1 = c 2 = 7 ,   ρ = 0.5 , the proposed algorithm suggests that a firm should switch all the demand of Product 1 to Product 2 to achieve the lowest total cost in the competitive bidding scenario. Since ψ = 0.72 , the firm should practice competitive bidding rather than the consignment stock option. Collectively, the result suggests the firm should adopt competitive bidding and switch all the demand of Product 1 to Product 2. The above numerical examples can be implemented with Microsoft Excel and are available upon request.

6. Conclusions

The present study integrates demand switching into outsourcing strategies to cope with uncertainty in demand. The results enrich extant literature by employing two prominent approaches concurrently (outsourcing planning and demand switching), which contribute to the risk-pooling effect and supply chain sustainability. For managers, the lessons that emerge from this paper lead to cost reduction opportunities from purchase and inventory, and return logistics, as well as potential obsolete goods. Specifically, this study demonstrates a mechanism that firms can utilize to achieve the lowest total purchase and inventory costs under the (Q, R) inventory policy. The findings and contributions are six-fold. First, the developed threshold cost model facilitates the selection between two outsourcing options: competitive bidding versus consignment stock. Particularly, the threshold of the purchase cost per unit for the competitive bidding scenario as compared to the consignment stock scenario decreases as two products become more positively correlated in demand, a result of the diminishing risk-pooling effect. Second, there are no general rules for determining the preferred switching direction under the competitive bidding scenario. When two products have the same mean demand, however, firms should choose to switch from the product with the larger standard deviation of demand to the one with the smaller standard deviation of demand. In this case, the cost difference arising from the two reversed switching directions decreases as two products become more positively correlated in demand. Third, for either switching direction, firms are encouraged to switch all the demand for one product to the other under the competitive bidding scenario. Nonetheless, demand switching has no merit when two products are perfectly positively correlated, having the same coefficient of variation in demand and incurring negligible setup cost for ordering. Fourth, demand switching appears unnecessary under the consignment stock scenario, as firms are not responsible for inventory holding costs in this case and the risk-pooling effect is not present. Fifth, from the perspective of supply-chain sustainability, outsourcing planning with inventory management strategies can take advantage of the risk-pooling effect, thereby reducing the expired/obsolete rate and achieving environmental sustainability. Sixth, under certain conditions, the study further identifies the proper demand-switching direction and optimum switching rate to achieve the minimum return rate, which contributes to economic sustainability. Namely, our research can guide companies to carry out demand-switching practices, thereby reducing the cost of return, for example, in logistics and other areas.
While this study provides insight into outsourcing planning with demand switching, the proposed model in which two products are considered under the (Q, R) inventory policy is sufficiently limited and by no means comprehensive. Although the findings are fundamental and indicative, future research is necessary to generalize the results, for example, by considering three or more product types. Likewise, exploring the effects under other types of inventory policies and/or outsourcing options warrants research efforts [27,28,29]. Particularly, researchers are encouraged to incorporate the costs of switching to capture a more realistic phenomenon. Apparently, a multitude of questions make beneficial avenues for further research into outsourcing planning with demand switching.

Author Contributions

Y.J.H. designed the research framework. H.C.C. conducted mathematical analysis and interpreted the results in both original and revised manuscript. L.Y.H. examined the article and revised the article format. All authors read and discussed the final manuscript.

Funding

This research was funded by Taiwan Ministry of Science and Technology grant number 101-2410-H-005-002.

Acknowledgments

The authors are grateful for the research assistance of Wei-Yo Lin in numerical analysis.

Conflicts of Interest

The authors declare no conflict of interest.

Appendix A. All Proof

Proof of Proposition 1.
d ψ d ρ = d ψ d v d v d ρ , d ψ d v = u ( u 2 + 3 v t ) ( u 2 + v t ) u 2 + 4 v t c ¯ v 3 u 2 + 4 v t .
Let A = u ( u 2 + 3 v t ) and B = ( u 2 + v t ) u 2 + 4 v t . Since u > 0, v > 0, and t > 0, it follows that A > 0 and B > 0. Particularly, A 2 B 2 = 4 v 3 t 3 < 0 .
Hence, A B < 0 and d ψ d v < 0 . Furthermore, when α ≠ 0
d v d ρ = I z α σ 1 σ 2 μ L α 2 σ x 1 2 + 2 α ρ σ 1 σ 2 μ L + σ x 2 2 + 2 α μ 1 μ 2 σ L 2 > 0 .
Thus, d ψ d ρ = d ψ d v d v d ρ < 0 . □
Proof of Proposition 2.
(1) From expression (9), we have
θ ϕ c b ϕ c b = c ( μ 2 + μ 1 ) + h [ ( K 2 h + ( 1 α ) μ 2 + α μ 2 + μ 1 ) + z ( ( μ L ( 1 α ) 2 σ 2 2 + ( 1 α ) 2 μ 2 2 σ L 2 ) + μ L ( α 2 σ 2 2 + 2 α ρ σ 1 σ 2 + σ 1 2 ) + ( α μ 2 + μ 1 ) 2 σ L 2 ) ] c ( μ 1 + μ 2 ) h [ ( K 2 h + ( 1 α ) μ 1 + α μ 1 + μ 2 ) + z ( ( μ L ( 1 α ) 2 σ 1 2 + ( 1 α ) 2 μ 1 2 σ L 2 ) + μ L ( α 2 σ 1 2 + 2 α ρ σ 1 σ 2 + σ 2 2 ) + ( α μ 1 + μ 2 ) 2 σ L 2 ) ]
Given that μ 1 = μ 2 = μ , θ can be simplified and re-arranged as follows:
θ = h z [ ( k n + p + k + m r ) ( l o + p + l + m r ) ] = h z [ ( k + m r l + m r ) + ( k n + p l o + p ) ] ,
in which k = ( σ 1 + α σ 2 ) 2 μ L , m = ( 1 + α ) 2 μ 2 σ L 2 , r = 2 α ( 1 ρ ) σ 1 σ 2 μ L , l = ( α σ 1 + σ 2 ) 2 μ L , n = ( 2 α σ 2 + σ 1 σ 2 ) ( σ 1 + σ 2 ) μ L , p = ( 1 α ) 2 μ 2 σ L 2 , and o = ( 2 α σ 1 σ 1 + σ 2 ) ( σ 1 + σ 2 ) μ L .
Given that σ 1 > σ 2 , 0 < α < 1 , and ( k n + p ) ( l o + p ) = ( σ 2 2 σ 1 2 ) ( 1 α ) 2 μ L < 0 , thus,
d θ d p = 1 2 ( 1 k n + p 1 l o + p ) > 0 .
Because for p = 0 (i.e., α = 1), k = l, n = o, θ = 0 it follows that for p > 0 (i.e., α < 1), and especially p = ( 1 α ) 2 μ 2 σ L 2 , θ > 0.
(2) Given that μ 1 = μ 2 = μ , σ 1 > σ 2 , 0 < α < 1 , and σ 1 + α σ 2 > α σ 1 + σ 2 , or k > l, thus, d θ d r = 1 2 ( 1 l + m r 1 k + m r ) > 0 . Furthermore, d r d ρ = 2 α σ 1 σ 2 μ L < 0 .
It implies that d θ d ρ = d θ d r d r d ρ < 0 . Namely, θ is decreasing in ρ. □
Proof of Proposition 3.
Based on expression (9), we have
ϕ c b ( α ) ϕ c b ( 1 ) = h [ ( K ( 1 α ) μ 1 2 h + K ( α μ 1 + μ 2 ) 2 h K ( μ 1 + μ 2 ) 2 h ) + z ( μ L ( 1 α ) 2 σ 1 2 + ( 1 α ) 2 μ 1 2 σ L 2 + μ L ( α 2 σ 1 2 + 2 α ρ σ 1 σ 2 + σ 2 2 ) + ( α μ 1 + μ 2 ) 2 σ L 2 μ L ( σ 1 2 + 2 ρ σ 1 σ 2 + σ 2 2 ) + ( μ 1 + μ 2 ) 2 σ L 2 ) ]
Let f = K ( 1 α ) μ 1 2 h + K ( α μ 1 + μ 2 ) 2 h K ( μ 1 + μ 2 ) 2 h and g = z ( μ L ( 1 α ) 2 σ 1 2 + ( 1 α ) 2 μ 1 2 σ L 2 + μ L ( α 2 σ 1 2 + 2 α ρ σ 1 σ 2 + σ 2 2 ) + ( α μ 1 + μ 2 ) 2 σ L 2 μ L ( σ 1 2 + 2 ρ σ 1 σ 2 + σ 2 2 ) + ( μ 1 + μ 2 ) 2 σ L 2 ) , ϕ c b ( α ) ϕ c b ( 1 ) = h ( f + g )
In particular, f = K 2 h ( q s ) in which q = ( 1 α ) μ 1 + ( α μ 1 + μ 2 ) and s = μ 1 + μ 2 .
Since q + s > 0 and q 2 s 2 = 2 μ 1 ( 1 α ) ( α μ 1 + μ 2 ) 0 , it follows that q s 0 and thus f 0 . Furthermore, since 1 ρ 1
d g d α = z μ L σ 1 2 + μ 1 2 σ L 2 + z [ μ L ( α σ 1 2 + ρ σ 1 σ 2 ) + μ 1 ( α μ 1 + μ 2 ) σ L 2 ] μ L ( α 2 σ 1 2 + 2 α ρ σ 1 σ 2 + σ 2 2 ) + ( α μ 1 + μ 2 ) 2 σ L 2 z μ L σ 1 2 + μ 1 2 σ L 2 + z [ μ L ( α σ 1 2 + ρ σ 1 σ 2 ) + μ 1 ( α μ 1 + μ 2 ) σ L 2 ] μ L ( α 2 σ 1 2 + 2 α ρ σ 1 σ 2 + ρ 2 σ 2 2 ) + ( α μ 1 + μ 2 ) 2 σ L 2 = z C 2 + μ L ( E 2 + F 2 ) + D 2 + z C 2 + 2 μ L E F + D 2 μ L ( α σ 1 + ρ σ 2 ) 2 + ( α μ 1 + μ 2 ) 2 σ L 2 ,
in which C = μ L ( α σ 1 2 + ρ σ 1 σ 2 ) , D = μ 1 σ L 2 ( α μ 1 + μ 2 ) , E = σ 1 σ L ( α μ 1 + μ 2 ) , and F = μ 1 σ L ( α σ 1 + ρ σ 2 ) .
Given that E2 + F2 2E F ≥ 0, thus, d g d α z C 2 + μ L ( E 2 + F 2 ) + D 2 + z C 2 + 2 μ L E F + D 2 μ L ( α σ 1 + ρ σ 2 ) 2 + ( α μ 1 + μ 2 ) 2 σ L 2 0 . That is, g is non-increasing in α.
Also, g ( α = 1 ) = 0 . Therefore, g 0 . We get ϕ c b ( α ) ϕ c b ( 1 ) = h ( f + g ) 0 .
Particularly, d f d α = 0 when K = 0.
Likewise, d g d α = 0 when E = F and ρ 2 = 1 (i.e., ρ = C V 1 C V 2 = 1 , in which C V i = σ i μ i ).
Therefore, ϕ c b ( α ) remains constant when ρ = C V 1 C V 2 = 1 and K = 0. □
Proof of Proposition 4.
 
ϕ c s is a function of only c ¯ and μi and not α when c ¯ i = c ¯ ; furthermore, ϕ c s ϕ c s = 0 . □

References

  1. Lalwani, C.S.; Disney, S.M.; Naim, M.M. On assessing the sensitivity to uncertainty in distribution network design. J. Phys. Distrib. Logist. Manag. 2006, 36, 5–21. [Google Scholar] [CrossRef] [Green Version]
  2. Hsieh, T.P.; Dye, C.Y. A note on “The EPQ with partial backordering and phase-dependent backordering rate”. Omega Int. J. Manag. Sci. 2012, 40, 131–133. [Google Scholar] [CrossRef]
  3. Chandra, C.; Grabis, J. Inventory management with variable lead-time dependent procurement cost. Omega Int. J. Manag. Sci. 2008, 36, 877–887. [Google Scholar] [CrossRef]
  4. Pan, K.; Lai, K.K.; Liang, L.; Leung, C.H. Two-period pricing and ordering policy for the dominant retailer in a two-echelon supply chain with demand uncertainty. Omega Int. J. Manag. Sci. 2009, 37, 919–929. [Google Scholar] [CrossRef]
  5. Zeynep Sargut, F.; Qi, L. Analysis of a two-party supply chain with random disruptions. Oper. Res. Lett. 2012, 40, 114–122. [Google Scholar] [CrossRef]
  6. Wang, F.; Zhuo, X.; Niu, B. Sustainability analysis and buy-back coordination in a fashion supply chain with price competition and demand uncertainty. Sustainability 2016, 9, 25. [Google Scholar] [CrossRef]
  7. Choi, T.M.; Chiu, C.H. Mean-downside-risk and mean-variance newsvendor models: Implications for sustainable fashion retailing. Int. J. Prod. Econ. 2012, 135, 552–560. [Google Scholar] [CrossRef]
  8. Eynan, A.; Fouque, T. Benefiting from the risk-pooling effect: Internal (component commonality) vs. external (demand reshape) efforts. Int. J. Serv. Oper. Manag. 2005, 1, 90–99. [Google Scholar] [CrossRef]
  9. Li, M.; Zhang, J. Does inventory pooling improve customer service levels? Oper. Res. Lett. 2012, 40, 96–98. [Google Scholar] [CrossRef]
  10. Baker, K.R.; Magazine, M.J.; Nuttle, H.L.W. The effect of commonality on safety stock in a simple inventory model. Manag. Sci. 1986, 32, 982–988. [Google Scholar] [CrossRef]
  11. Gerchak, Y.; Magazine, M.J.; Gamble, A.B. Component commonality with service level requirements. Manag. Sci. 1988, 34, 753–760. [Google Scholar] [CrossRef]
  12. Bar-Leva, S.K.; Schulte-Geers, E.; Stadje, W. On the demand pooling anomaly in inventory theory. Oper. Res. Lett. 2011, 39, 411–413. [Google Scholar] [CrossRef]
  13. Quinn, J. Strategic outsourcing: Leveraging knowledge capabilities. Sloan Manag. Rev. 1999, 40, 9–22. [Google Scholar]
  14. Quinn, J.; Hilmer, F. Strategic outsourcing. Sloan Manag. Rev. 1994, 35, 43–55. [Google Scholar]
  15. Wu, Y.; Wang, J.; Li, C.; Su, K. Optimal Supply Chain Structural Choice under Horizontal Chain-to-Chain Competition. Sustainability 2018, 10, 5. [Google Scholar] [CrossRef]
  16. Holcomb, T.R.; Hitt, M.A. Toward a model of strategic outsourcing. J. Oper. Manag. 2007, 25, 464–481. [Google Scholar] [CrossRef]
  17. Shen, B.; Li, Q. Impacts of returning unsold products in retail outsourcing fashion supply chain: A sustainability analysis. Sustainability 2015, 7, 1172–1185. [Google Scholar] [CrossRef]
  18. Abdel-Malek, L.; Kullpattaranirun, T.; Nanthavanij, S. A framework for comparing outsourcing strategies in multi-layered supply chains. Int. J. Prod. Econ. 2005, 97, 318–328. [Google Scholar] [CrossRef]
  19. Valentini, G.; Zavanella, L. The consignment stock of inventories: Industrial case and performance analysis. Int. J. Prod. Econ. 2003, 81–82, 215–224. [Google Scholar] [CrossRef]
  20. Eynan, A.; Fouque, T. Capturing the risk-pooling effect through demand reshape. Manag. Sci. 2003, 49, 704–717. [Google Scholar] [CrossRef]
  21. Hezarkhani, B.; Kubiak, W.; Hartman, B. Asymptotic behavior of optimal quantities in symmetric transshipment coalitions. Oper. Res. Lett. 2014, 42, 438–443. [Google Scholar] [CrossRef]
  22. Hsieh, Y.J. Demand switching criteria for multiple products: An inventory cost analysis. Omega Int. J. Manag. Sci. 2011, 39, 130–137. [Google Scholar] [CrossRef]
  23. Mahajan, S.; Van Ryzin, G. Stocking retail assortments under dynamic consumer substitution. Oper. Res. 2001, 49, 334–351. [Google Scholar] [CrossRef]
  24. Shah, J.; Avittathur, B. The retailer multi-item inventory problem with demand cannibalization and substitution. Int. J. Prod. Econ. 2007, 106, 104–114. [Google Scholar] [CrossRef]
  25. Smith, S.A.; Agrawal, N. Management of multi-item retail inventory systems with demand substitution. Oper. Res. 2000, 48, 50–64. [Google Scholar] [CrossRef]
  26. Simchi-Levi, D.; Kaminsky, P.; Simchi-Levi, E. The calculation of average inventory level. In Designing and Managing the Supply Chain, 3rd ed.; McGraw-Hill: New York, NY, USA, 2008. [Google Scholar]
  27. Yao, D.Q.; Yue, X.; Mukhopadhyay, S.K.; Wang, Z. Strategic inventory deployment for retail and e-tail stores. Omega Int. J. Manag. Sci. 2009, 37, 646–658. [Google Scholar] [CrossRef]
  28. Chang, H.C.; Ho, C.H. Exact closed-form solutions for “optimal inventory model for items with imperfect quality and shortage backordering”. Omega Int. J. Manag. Sci. 2010, 38, 233–237. [Google Scholar] [CrossRef]
  29. Hsu, W.K.; Yu, H.F. EOQ model for imperfective items under a one-time-only discount. Omega Int. J. Manag. Sci. 2009, 37, 1018–1026. [Google Scholar]
Figure 1. Change of the threshold percentage of the purchase cost per unit with respect to ρ.
Sustainability 10 04104 g001
Figure 2. Total cost change with respect to α for two reversed switching directions (u1 = u2, σ1 > σ2).
Sustainability 10 04104 g002
Figure 3. Cost difference resulting from two reversed switching directions (u1 = u2, σ1 > σ2).
Sustainability 10 04104 g003
Figure 4. Total cost change with respect to α for two reversed switching directions ( u 1 < u 2 ,   σ 1 > σ 2 ).
Sustainability 10 04104 g004
Figure 5. Total cost change with respect to α (u1 > u2, σ1 > σ2).
Sustainability 10 04104 g005
Figure 6. Total cost change with respect to α ( ρ = C V 1 C V 2 = 1 , K = 0).
Sustainability 10 04104 g006
Table 1. Summary of key literature review.
YearAuthorsKey Finding
1986Baker et al. [10]Firms can adopt common components for different products to reduce the impact arising from demand variability.
1988Gerchak et al. [11]Firms can adopt common components for different products to reduce the impact arising from demand variability.
1994Quinn & Hilmer [14]A knowledge- and service-based economy offers innumerable opportunities to increase profits through strategic outsourcing.
1999Quinn [13]Strategic outsourcing becomes the focus of many manufacturers.
2000Smith & Agrawal [25]Develop a methodology for selecting item inventory levels to maximize total expected profit.
2001Mahajan &Van Ryzin [23]Propose an external approach on the “demand” side that focuses on changing external consumers’ demand.
2003Valentini & Zavanella [19]The benefits of consignment stock of inventory policy.
2003Eynan & Fouque, [20]Even switching a small proportion of customers results in an impressive profit increase.
2005Eynan & Fouque [8]Firms can reduce the impact arising from demand variability internally or externally.
2005Abdel-Malek et al. [18]Competitive bidding and consignment stock represent two popular forms of outsourcing.
2006Lalwani et al. [1]Product demand exemplifies the key source of uncertainty in a typical production–distribution system.
2007Holcomb & Hitt [16]Outsourcing allows firms to reduce capital investment and focus on core competency.
2007Shah & Avittathur [24]Model the retailer multi-item inventory problem with demand cannibalization and substitution.
2008Wang et al. [3]Inventory management with variable lead-time-dependent procurement costs.
2008Simchi-Levi et al. [26]The calculation of average inventory level.
2009Pan et al. [4]Demand uncertainty along with variable replenishment lead-time where the profit margins are extremely tight.
2009Yao et al. [27]The optimal inventory levels in retail and e-tail stores and the respective expected profits.
2011Bar-Leva et al. [12]Firms can benefit more from demand pooling anomalies.
2011Hsieh [22]Firms can take advantage of the risk-pooling effect to increase profits.
2012Hsieh & Dye [2]Misestimating demand uncertainty will lead to a loss of market share or excessive inventory entailing extravagant holding costs.
2012Choi & Chiu [7]Propose three factors to measure supply-chain sustainability.
2012Li & Zhang [9]Firms can reduce the impact arising from demand variability internally or externally.
2015Shen & Li [17]The return of unsold products in retail outsourcing is significantly affecting sustainability factors.
2016Wang et al. [6]High demand-uncertainty results in a less sustainable supply chain, in terms of both environmental and economic sustainability.
2018Wu et al. [15]Even if the cost advantage and expertise are ignored, outsourcing itself has some structural advantages in competition.

