Indoor Air Quality: A Bibliometric Study


Department Materials, Environmental Sciences and Urban Planning (SIMAU), Università Politecnica delle Marche, 60131 Ancona, Italy
*
Author to whom correspondence should be addressed.
Sustainability 2018, 10(11), 3830; https://doi.org/10.3390/su10113830
Submission received: 25 September 2018
/
Revised: 18 October 2018
/
Accepted: 20 October 2018
/
Published: 23 October 2018
(This article belongs to the Special Issue Sustainable Buildings and Indoor Air Quality)
Abstract
:What are the actual trends in Indoor Air Quality (IAQ), and in which direction is academic interest moving? Much progress has been made in identifying and mitigating indoor pollutants, due to both prevention campaigns (e.g., smoking bans) and greater control of product emissions. However, IAQ is still of interest and the future trends are unknown. In this study, a thorough bibliometric analysis was conducted on the scientific literature available on the Web of Science database with CiteSpace from 1990 until today. It was possible to identify past trends and current advances, both with the aim of introducing the IAQ topic to those encountering it for the first time and to examine the issues that are expected to be pertinent in the future.
1. Introduction
Clean air is a basic requirement of life, together with food and water. Although the latter two have been a primary concern for many civilizations for multiple centuries, especially in more industrialized countries, shaping new lifestyles and driving new economies, air is something imposed, with no possibility of choice. Since the industrial revolution, as people started to spend most of their time in confined environments, clean air should have been considered a prerogative, as indoor air had become a leading exposure for humans. Therefore, in places of life and work, it is necessary to monitor the urban environment. For this reason, as major environmental concerns, policy directives and guidelines have recently highlighted energy use, sustainable buildings, outdoor air quality, and indoor air quality (IAQ).
Bibliometrics is the application of quantitative analysis and statistics to publications using different parameters, such as author co-citation, document co-citation, co-word analysis, and journal mapping, in order to understand emerging trends and the knowledge structure of a research field. Jointly with science mapping tools, it is possible to start from a large dataset of scientific publications in order to generate straightforward visual representations of complex structures for statistical analysis and interactive data exploration.
Using bibliometric tools to analyze the scientific literature collected by Web of Science, this article provides, firstly, an overview of the IAQ topic from 1990 to 2018, by reporting the most important publications and by collocating the existing literature in a finite number of clusters and, secondly, the latest developments and future trends. Although this work is not structured as an exhaustive review of the related literature, it does illustrate the opportunity of bibliometric techniques for exploring research gaps and new frontiers.
2. Materials and Methods
2.1. Data Collection
All data were obtained from the Web of Science Core Collection (WoSCC) by Thomson Reuters prior to 1 May 2018. In this study, the keywords used for the data retrieval strategy were as follows: TS: (“Indoor air quality” OR “IAQ”). English-only document types were articles, letters, and reviews, ranging from 1990 to 2018, from the following indexes: SCI-EXPANDED, SSCI, A&HCI, CPCI-S, CPCI-SSH, and ESCI. The final dataset contained 7389 bibliographic records of Article or Letters or Review in English.
2.2. Data Analysis
We utilized several scientific and visual analytic methods. The statistical results are displayed in CiteSpace V [1], visualization software used for analyzing data by network modeling.
For the first analysis, the overall time span adopted was 1990 through 2018, with a 1-year time slice. The Term Source included Title, Abstract, Author Keywords, and Keyword Plus; Node Type was selected according the type of analysis conducted; and Selection Criteria included the top 50. No pruning was selected. For the second part, in order to focus on the actual and future trends, a restricted dataset, in which only papers selected with the same criteria from 2010 to 2018, was used. A different thresholding method was adopted: Instead of selecting the top 50 articles of each time slice, CiteSpace thresholding parameters (citation, co-citation, and the cosine coefficient thresholds, shortened as: c, cc, and ccv) were set at 8;8;40, 6;6;30, and 2;2;10, respectively. This choice was justified by the three thresholding being respectively referred to: Begin, middle, and end of the selected period of time and, by applying more selective parameters for the first years, only the most relevant publications are reported. In the last period, a wider number of publications are reported.
3. Results
3.1. Data Description
The distribution of yearly outputs is shown in Figure 1. The publishing trend increased from 13 publications in 1990 to 786 publications in 2017, highlighting the increased global focus on the topic. In particular, since 1990, it is possible to distinguish between two different phases. During the first phase from 1990 to 2009, a slow increase in publications occurred. The second phase occurred from 2010 to 2017, with a higher growth rate, indicating the growing interest in the topic. This distinct separation coincides with the publication of the World Health Organization (WHO) guidelines for indoor air quality [2].
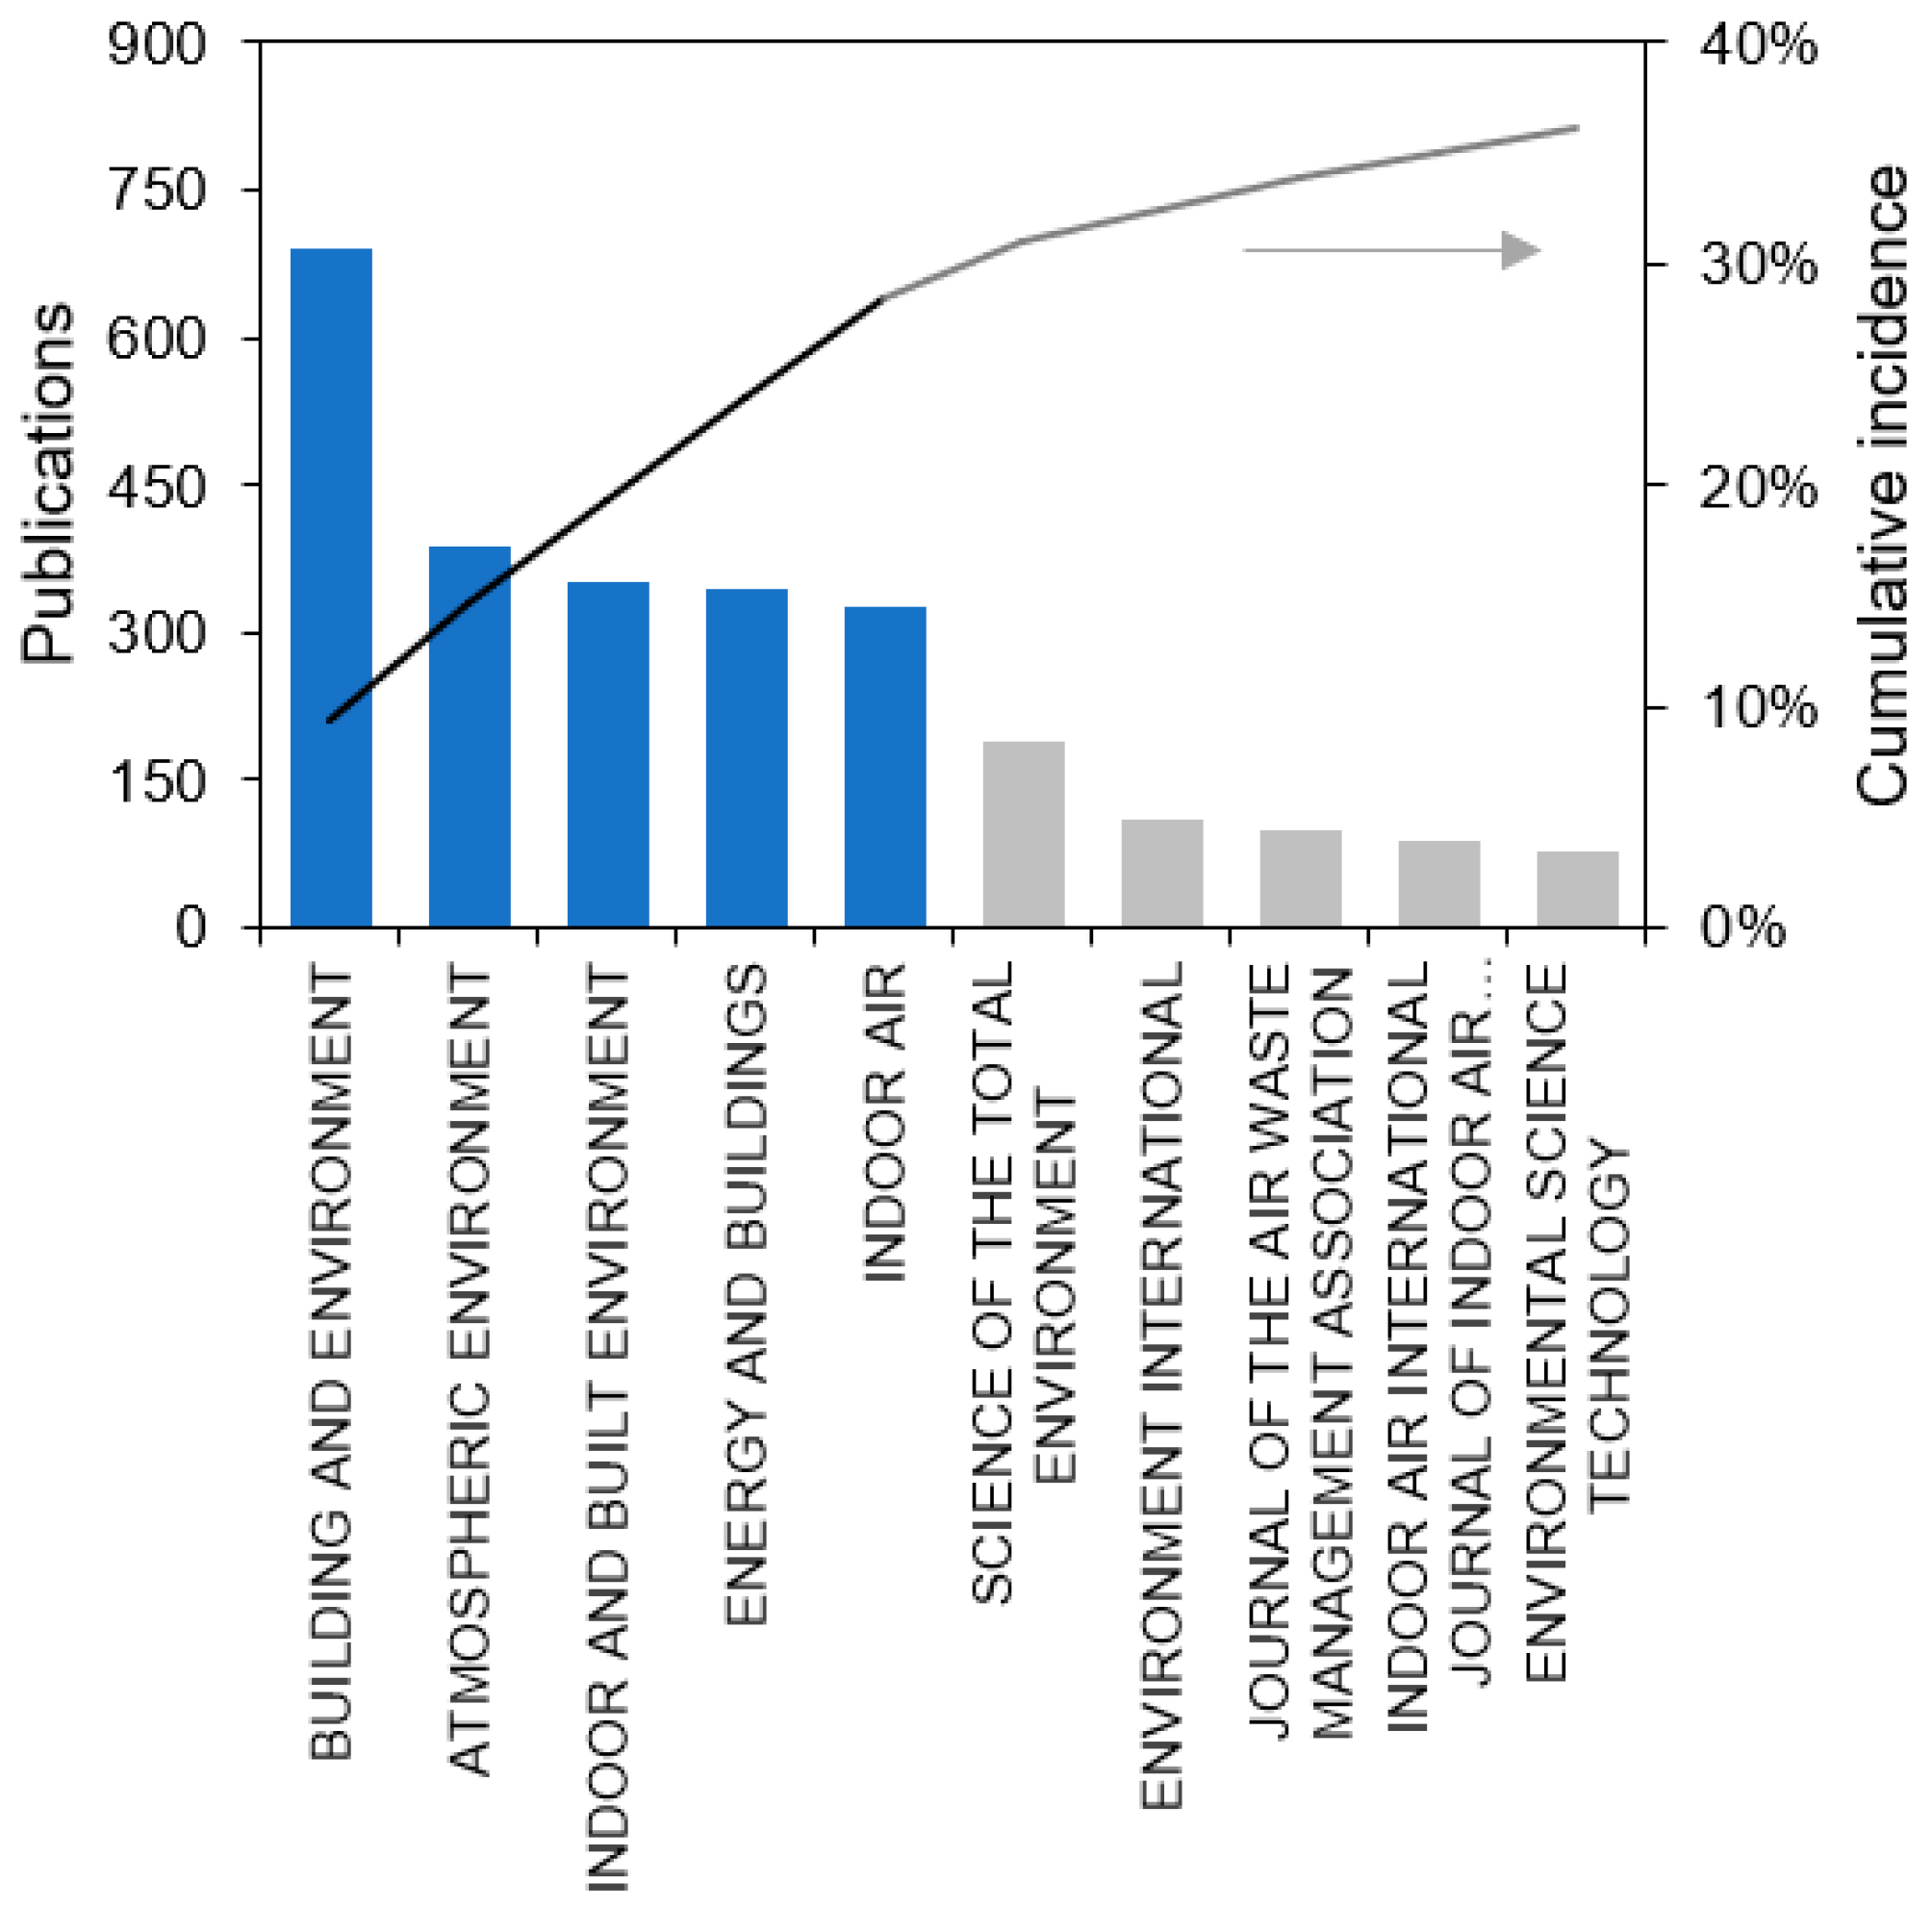
Almost 30% of the publications in the dataset were published by five scholarly journals (2102, 28.45%), each one accounting for about 350 publications. This trend is reported in Figure 2.
The top 15 contributing institutes are listed in Table 1. The University of California (3.71%) ranked first, followed by two Chinese universities: Tsinghua University (2.64%) and Hong Kong Polytechnic University (2.56%). Among the top 25 institutions, 11 are American, followed by 7 European, and 3 Chinese. However, more than one-quarter of the total records are American, followed by People’s Republic of China (PRC) (14.12%).
The top 10 contributing countries, in terms of publications, are reported in Table 2. In first place, the USA accounts for 27.5% of the total literature, with 2032 records, followed by China with 1043 records (14.12%). England, Canada, and South Korea ranked third, fourth, and fifth place, respectively, with a cumulative number of publication equal to the total number of publications in 1990, followed by four European countries and Australia.
The top 10 categories are reported in Table 3. However, only the first four constitutes the major fields. The top four categories, in order of importance, are: “Engineering”, “environmental sciences ecology”, “construction building technology”, and “public environmental occupational health”.
3.2. Categories and Journal Co-Occurring Networks
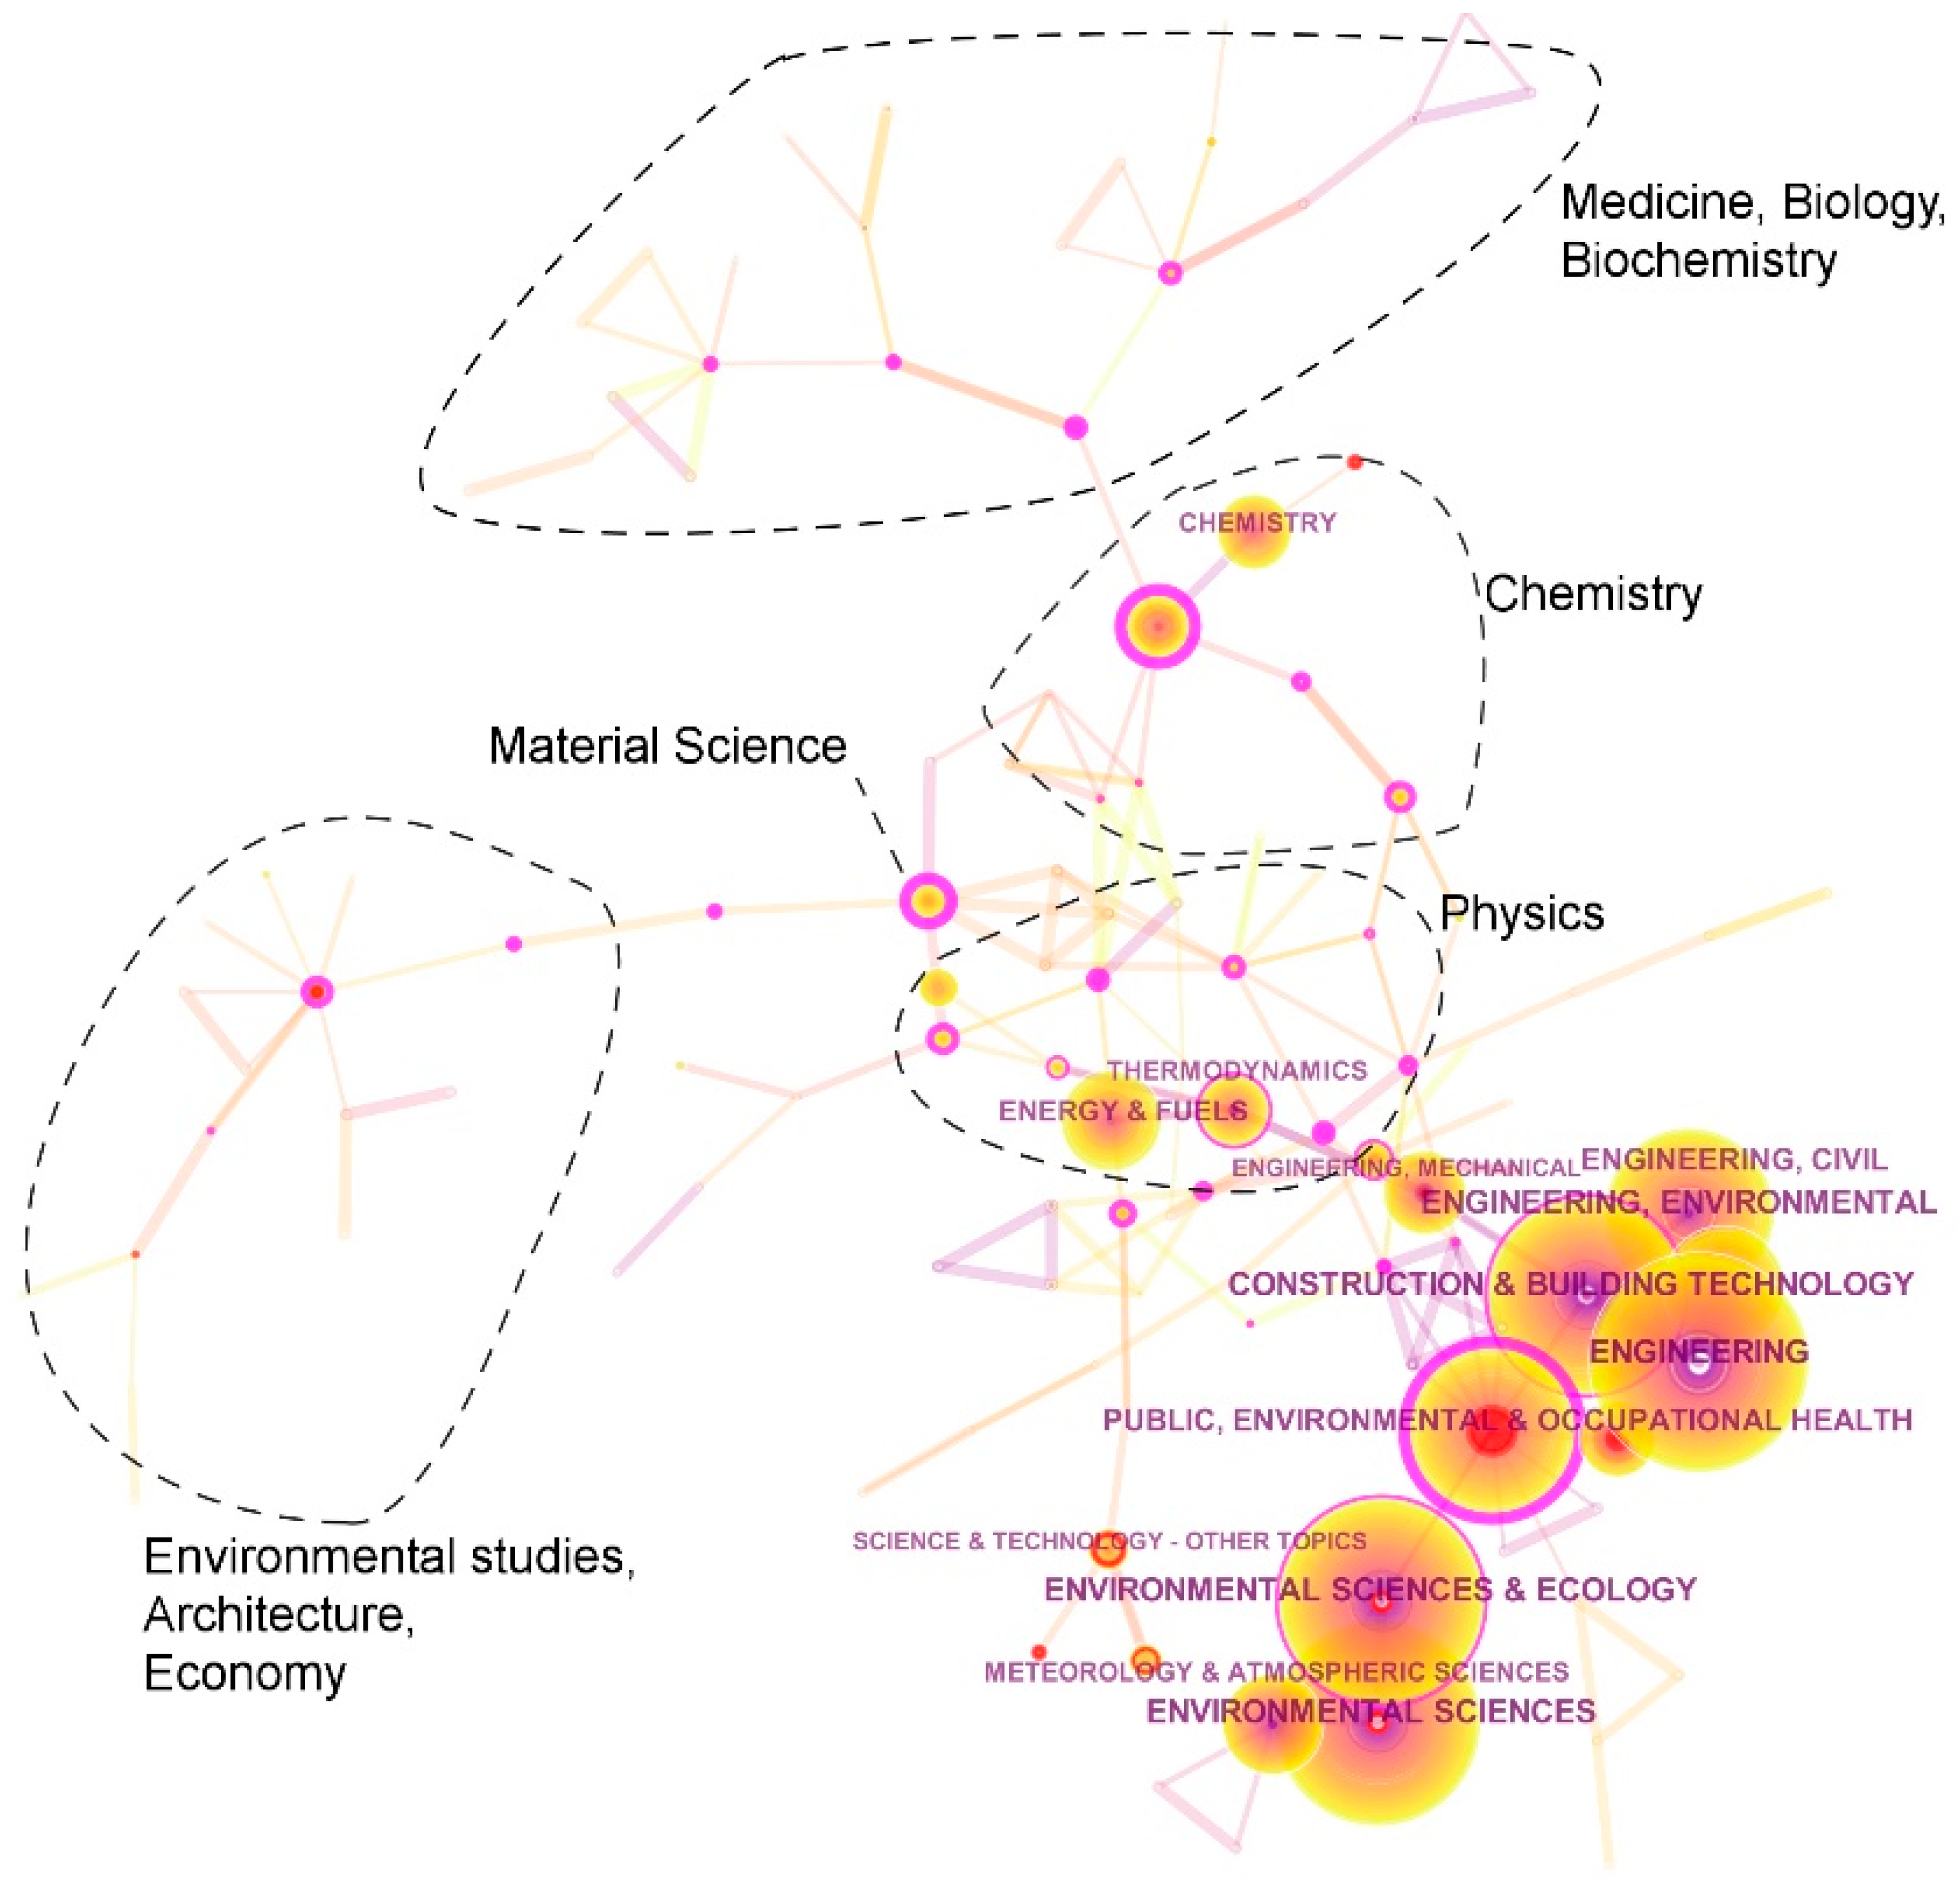
The network of co-occurring subject categories (Web of Science categories), reported in Figure 3, highlights the relationship between the main subjects and disciplines in the field. The thickness of each link represents the density of the co-occurring category and the color map refers to the average year of the node. The color of a category ring denotes the time of corresponding utilization. The thickness of a ring is proportional to how many times the category has been used in a specified time slice. Lighter colors (yellow) correspond to newer nodes, while darker colors (blue) are related to older nodes. This method enabled us to highlight the multidisciplinary and temporal evolution of the subject. We found that environmental sciences and engineering, construction and building technology, and public, environmental, and occupation health were the main subjects in the IAQ field. Minor categories, constituted mainly by unlabeled nodes because of their lower amount, have been grouped into larger areas. “Material science” is a linking node between chemistry, physics, and environmental studies and “public, environmental, and occupational health” belongs to the highest burst, as it connects the most populous nodes (construction and building engineering with environmental sciences).
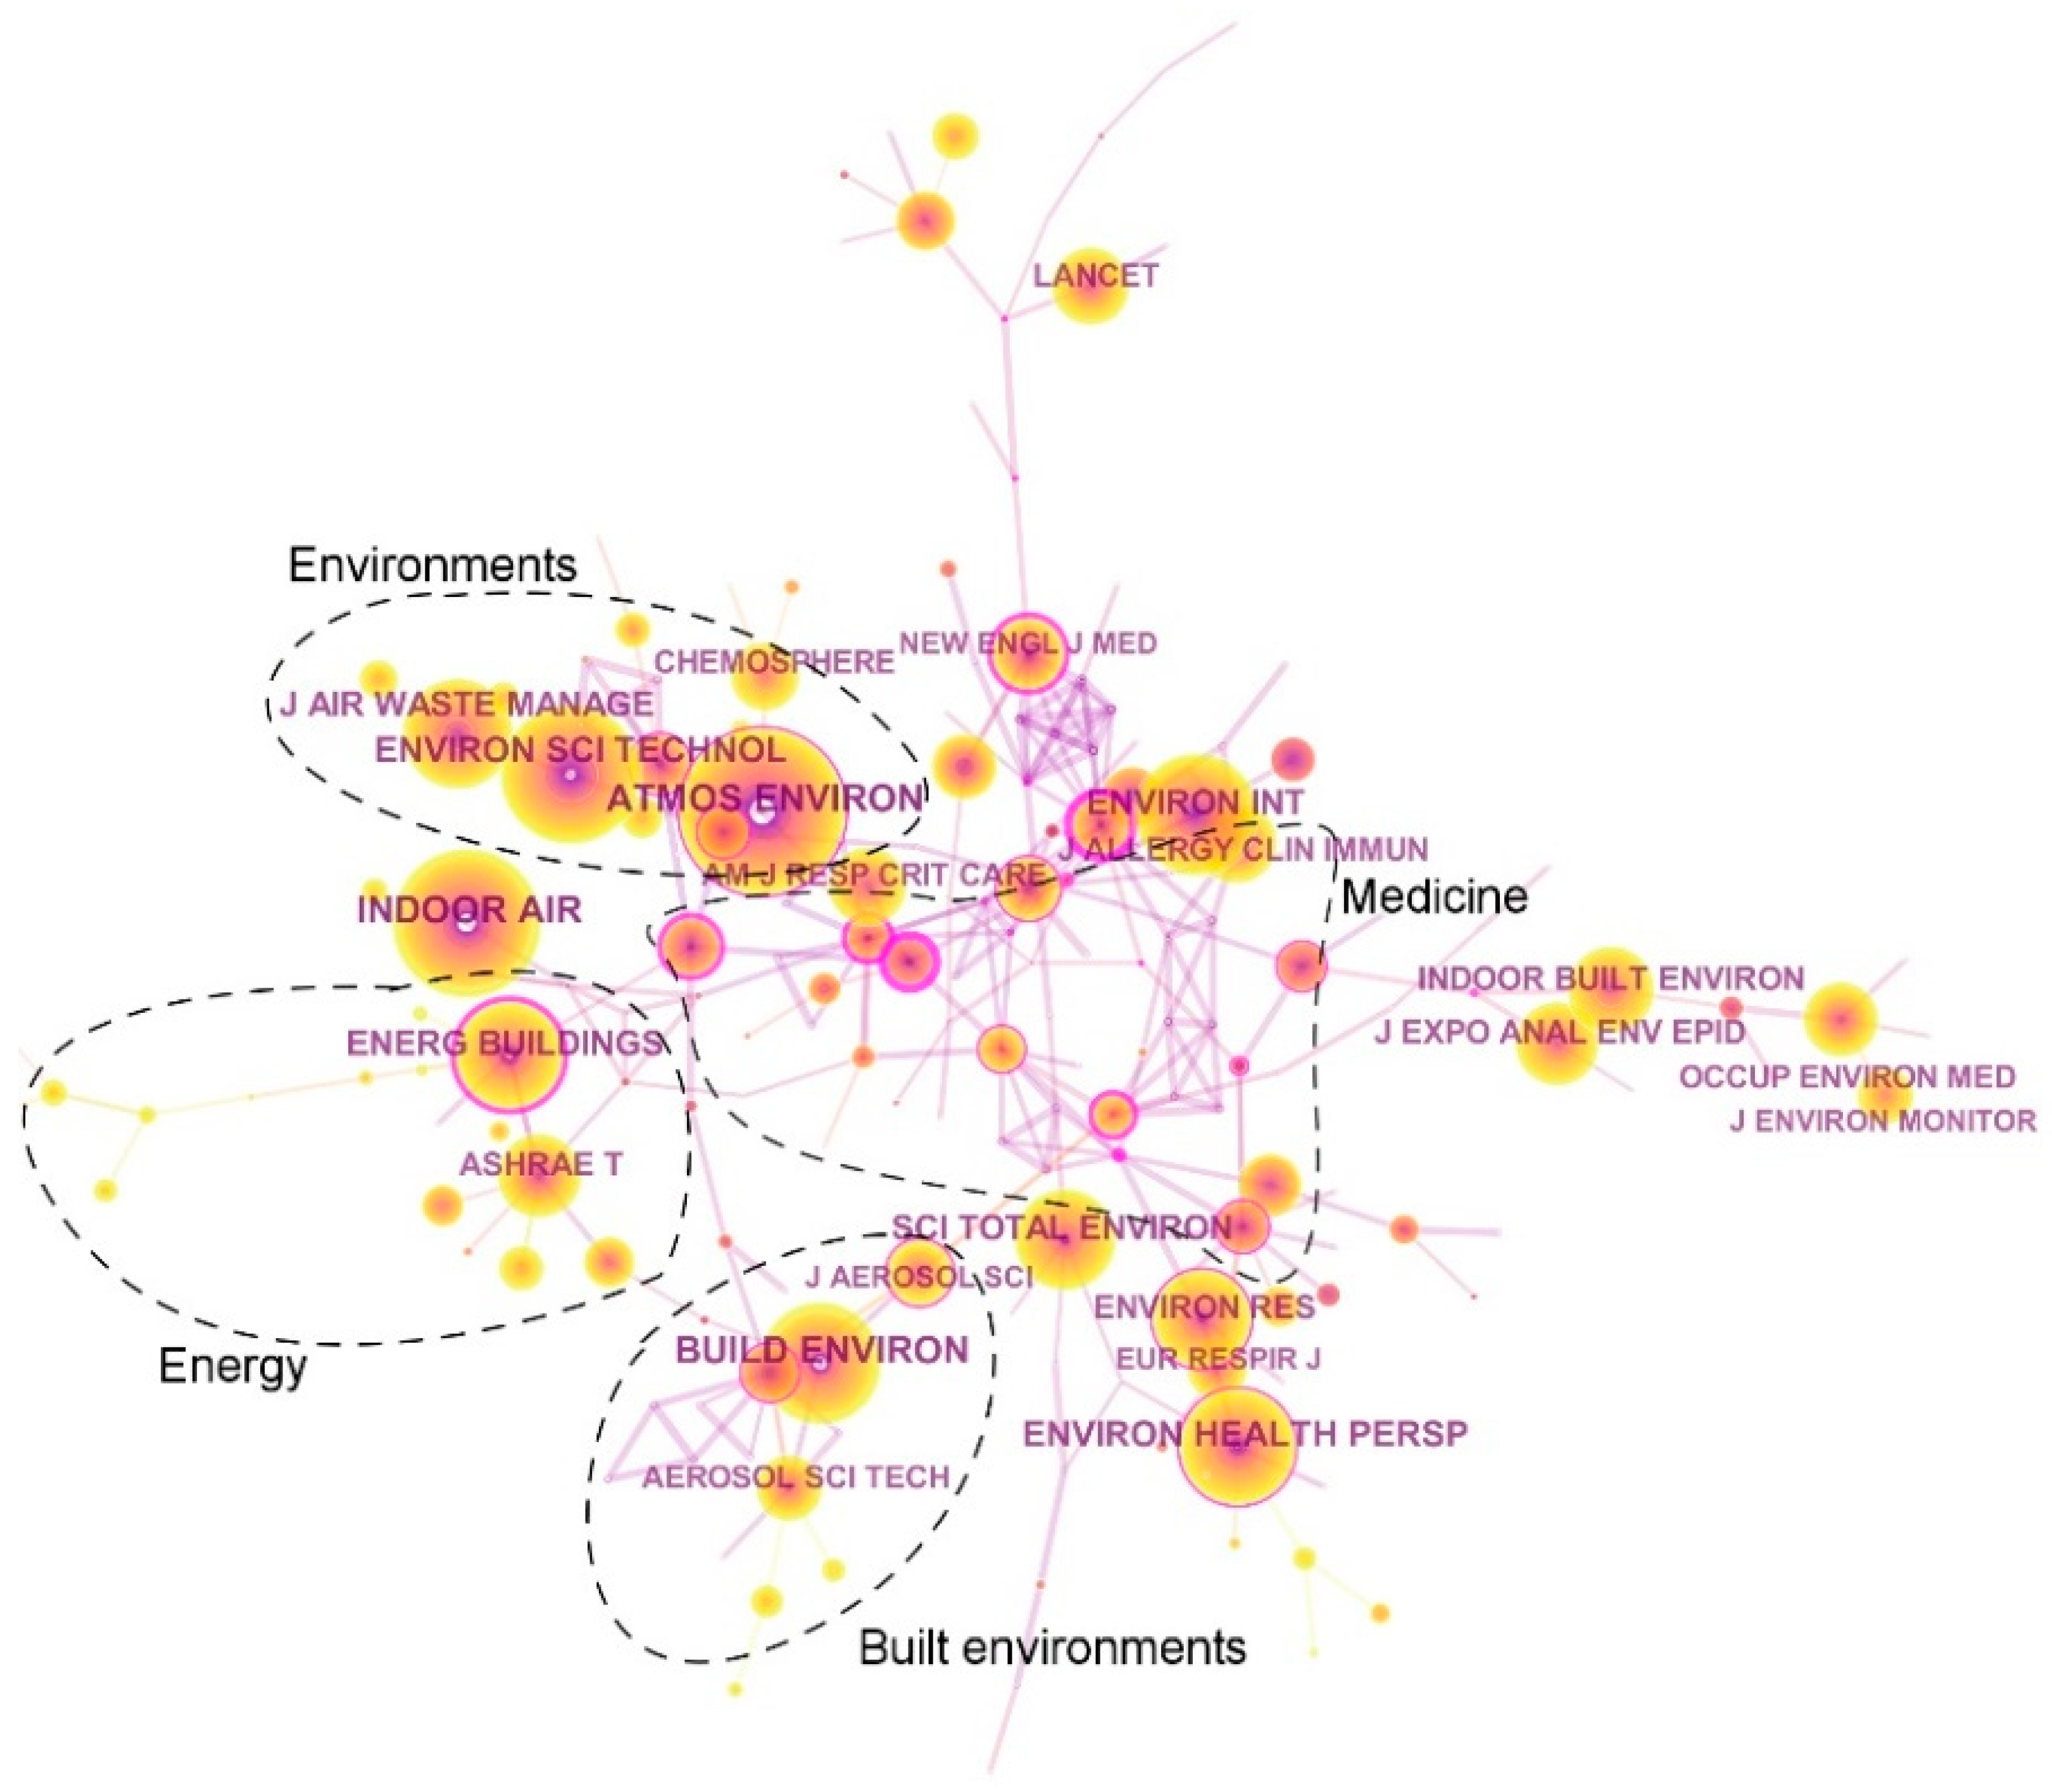
In order to outline the set of journals that are connected to the IAQ topic, the co-citation network at the journal level is shown in Figure 4. Like the previous figure, color and thickness reflect the temporal distribution of the cited journals. It was possible to categorize the journals into four macro areas: Medicine-related (center), energy-related (left), building-related (bottom), and environment-related (top). The biggest circles correspond to the most cited journals. The most-cited journals were the ones reported in Figure 2 but, while “Building and Environment”, “Atmospheric Environment”, “Indoor and Built Environment” are, the top three journals in terms of number of publications, the most-cited were “Indoor Air”, “Energy and Buildings”, and “Environmental Health Perspective”. Unlabeled nodes are minor journals given their number of citations.
3.3. Term Burst
Citation burst is an indicator of the most active part of the research. CiteSpace’s citation burst is based on Kleinberg’s algorithm [3], and it provides evidence that a particular publication (or keyword) has attracted an extraordinary degree of attention from its scientific community. The keywords in the literature can reveal the main research content, and literature citation frequency can reflect research heat. The terms (title, abstract, and keywords) having the strongest citation bursts in the dataset are reported in Table 4. The time intervals are represented by the blue line, while the periods of the burst are highlighted in red, indicating the beginning and end of each burst interval. The full list is reported in the Supplementary Materials.
From Table 4, the initial “IAQ” burst was coincident with the “sick building syndrome”, “office workers”, “environmental tobacco smoke”, and “outdoor level” term bursts. The term “sick building syndrome” (SBS) is used to describe when building occupants experience acute health and comfort effects that can be linked to the time spent in a building. The first studies were conducted in offices [4,5] in which tobacco smoke was the major pollutant [6,7], as the smoking ban in working and public places had not yet been implemented, together with the presence of contaminants from the outdoor air. By that time, several specific pollutants, like nitrogen dioxide (NO2), fungal spores, and airborne bacteria, were present as strong citation bursts for the 1996–2011. Notably, volatile organic compounds (VOCs) appeared with burst strength lower than the threshold (arbitrarily set to 7.0, which is equal to the median value of the citation burst distribution) in different time intervals; for this reason, they are not reported in Table 4.
All the citation burst still active started after 2013. The introduction of other physical and psychological aspects of indoor life led to the definition of Indoor Environmental Quality (IEQ), within which IAQ occurs. In this last time interval, pollutants with a strong, still active burst are related to fine particulate matter (PM2.5), carbon dioxide (CO2), and “energy saving” fields. Also, the “residential buildings” term appears, which may indicate the shift of academic attention from the work place to private homes, together with increased attention focused on building energy saving and thermal comfort of occupants
3.4. Document Co-Citation Network
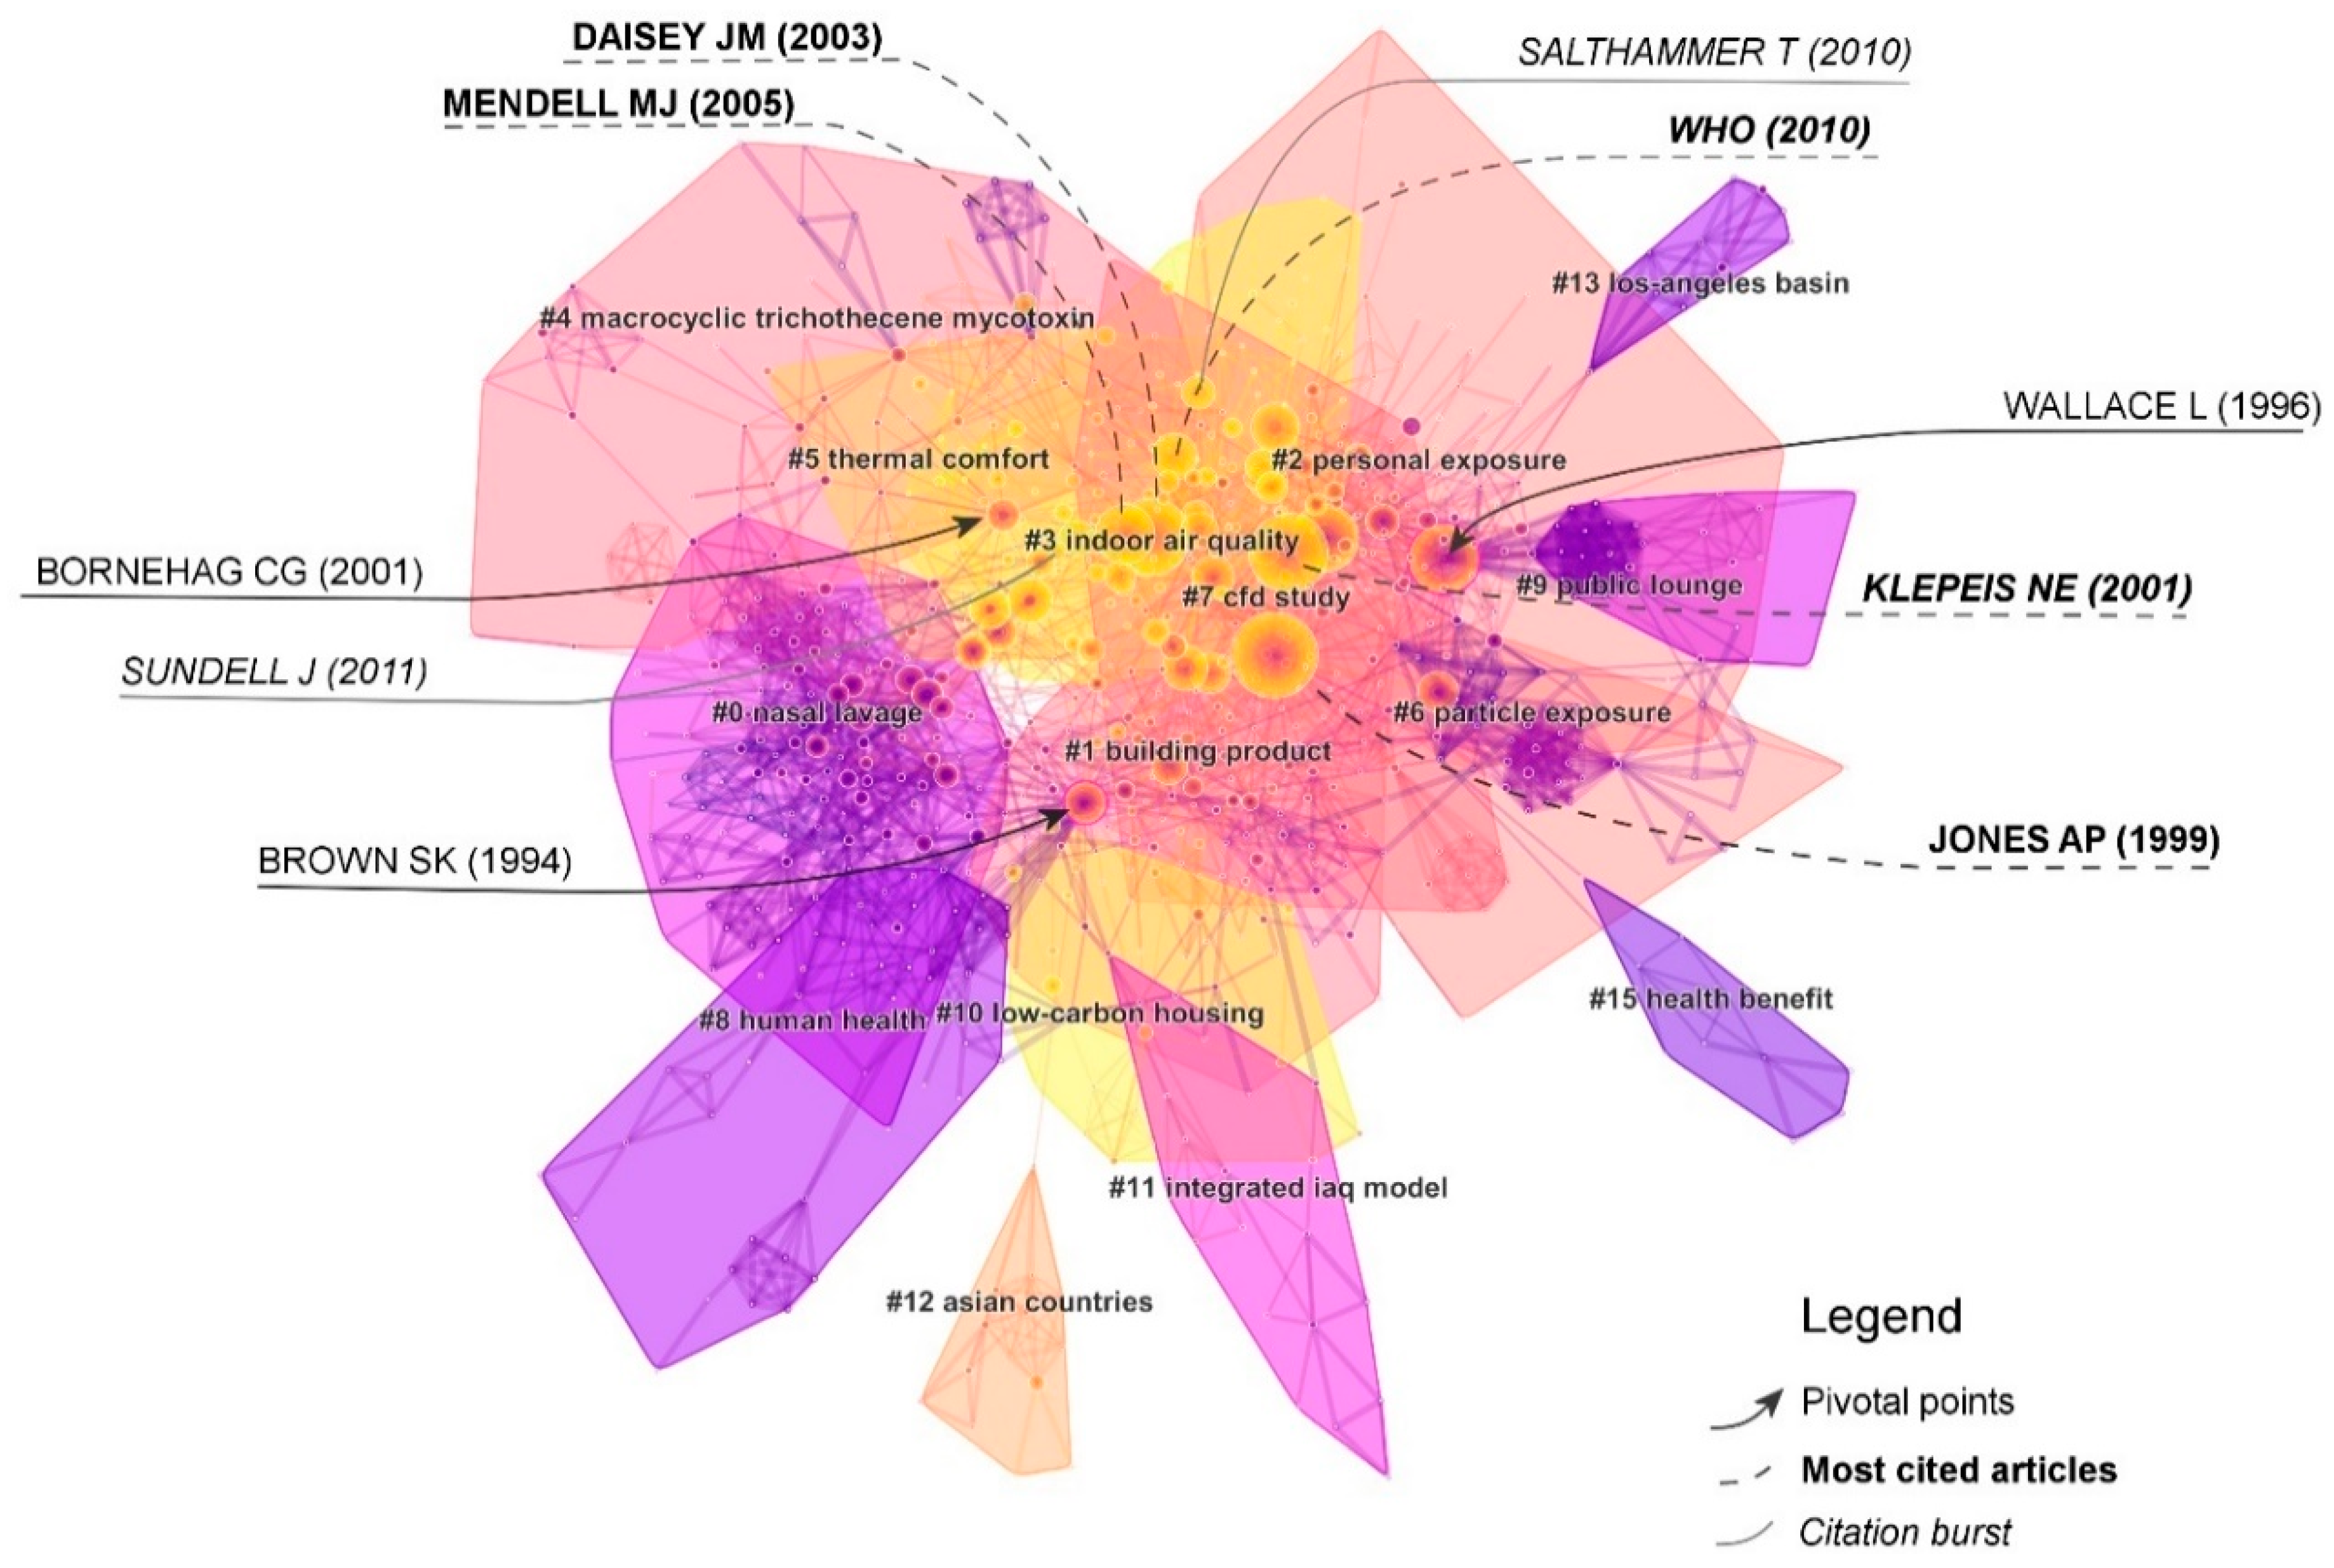
A document co-citation network represents a network of references that have been co-cited by a set of publications. Time was divided into a number of one-year slices, and an individual co-citation network was derived from each time slice. In order to reduce the dimension of every single slice, the top 50 most-cited publications in each year were used to build a network of cited references in that particular year. Subsequently, individual networks were merged. The merged network reported in Figure 5 depicts a spatial visualization of the network, which represents the development of the IAQ topic over time, showing the most important footprints of the related research activities. Each colored node represents a cited reference.
The network in Figure 5 is divided into 19 co-citation clusters. These clusters are labeled by index terms from their own citers. The numbers in front of the cluster’s name are identifiers rank the size of the clusters. The “silhouette” value is a descriptor of the homogeneity of a cluster, and it ranges between −1 and 1; higher values indicate meaningful clusters [8], while the “modularity” measures the extent to which a network can be divided into independent blocks, which ranges from zero to one [9]. The network has a modularity of 0.7437, which is considered to be high, suggesting that the specialties in IAQ are clearly defined in terms of co-citation clusters. The average silhouette score of 0.2579 is low mainly because of the presence of numerous small clusters. Different colors indicate the time when co-citation links in those areas appeared for the first time. Purple areas were generated earlier than yellow areas. Important publications have been reported in the network visualization.
The importance of clustering publications lies in identifying the most important thematic macro areas and to see how they are related to each other. Cluster descriptors in Figure 5 are reported in Table 5. The “size” column refers to the number of publications within the cluster. The “name” tag was generated by the Log-likelihood algorithm from the articles’ indexing terms [10]. The Log-likelihood algorithm was chosen as it better reflected the cluster topic. The “description” column was manually filled after analyzing the top articles of each cluster having high coverage value. The “range” is the period in which the cluster evolves, or the period covered, by the various publications within the cluster A straightforward visual representation of this parameter is reported in Figure 6.
Cluster #0 is the largest cluster, containing 145 publications and having a silhouette value of 0.866. It is labeled as “nasal lavage”. The first five publications, with the highest coverage in this cluster, are by Wieslander [11,12], followed by Brooks [13], and Nordstorm [14]. They all investigated the health effects (nasal and ocular) of sick building syndrome in hospitals and public facilities. This cluster collects the first comprehensive studies between built environments through monitoring of chemical and physical parameters (pollutants concentrations, temperature, and humidity) and symptoms of indoor occupants. Publications ranged between 1980 and 1999.
The second largest cluster (#1) has 125 members and a silhouette value of 0.725. While it is the lowest among all clusters, it had a relatively high level of homogeneity. The cluster is labeled “building product”. This second cluster is related to the factors are connected to the presence of gaseous pollutants. The top five, in order of citations, are: Ozone [15], VOC emission from building products [16], NOx and O3 concentration [17], terpene/ozone mixtures [18], and carbonyl compounds [19]. It ranges from 1973 to 2010.
The third largest cluster (#2) has 109 members and a silhouette value of 0.766. It is labeled “personal exposure”. It is representative of the personal exposure to fine particulate matter (PM2.5 and PM10). Articles with the highest coverage are by Bahadori [20], Janssen [21], and Micallef [22]. This cluster, as with the previous one, started after the previous one, but it terminated more recently. It covered 1981–2015.
The fourth largest cluster (#3) has 105 members and a silhouette value of 0.753. It is labeled “indoor air quality”. This cluster collects studies of indoor pollution in schools. While all the population is vulnerable to air pollution, the children are the most at risk. This constitutes a trend of actual interest, starting in 1992 up to current. The measurement of pollutant concentrations [23,24,25] and the risk assessments [26,27,28] are the main topics in this cluster.
The fifth largest cluster (#4) has 63 members and a silhouette value of 0.908. It is labeled “macrocyclic trichothecene mycotoxin”. The trichothecene mycotoxins are a group of toxins produced by some fungi. Some of these substances may be present as contaminants in mold and transported through aerosols. This cluster is representative of bacterial and fungal aerosols, as well the role of environmental factors in asthma. This cluster extends from 1958 to 2011.
The sixth largest cluster (#5) has 43 members and a silhouette value of 0.884. It is labeled “thermal comfort” and includes research papers on thermal personal comfort, Heating, Ventilation and Air Conditioning (HVAC), and the effect of relative humidity. This cluster extended from 1970 to 2016.
The seventh largest cluster (#6) has 41 members and a silhouette value of 0.916. It is labeled as “particle exposure” and collects publications about the environmental tobacco smoke. This cluster started in 1982 and ended in 2013, probably due to the implementation of non-smoking laws, which reduced the exposure to these pollutants.
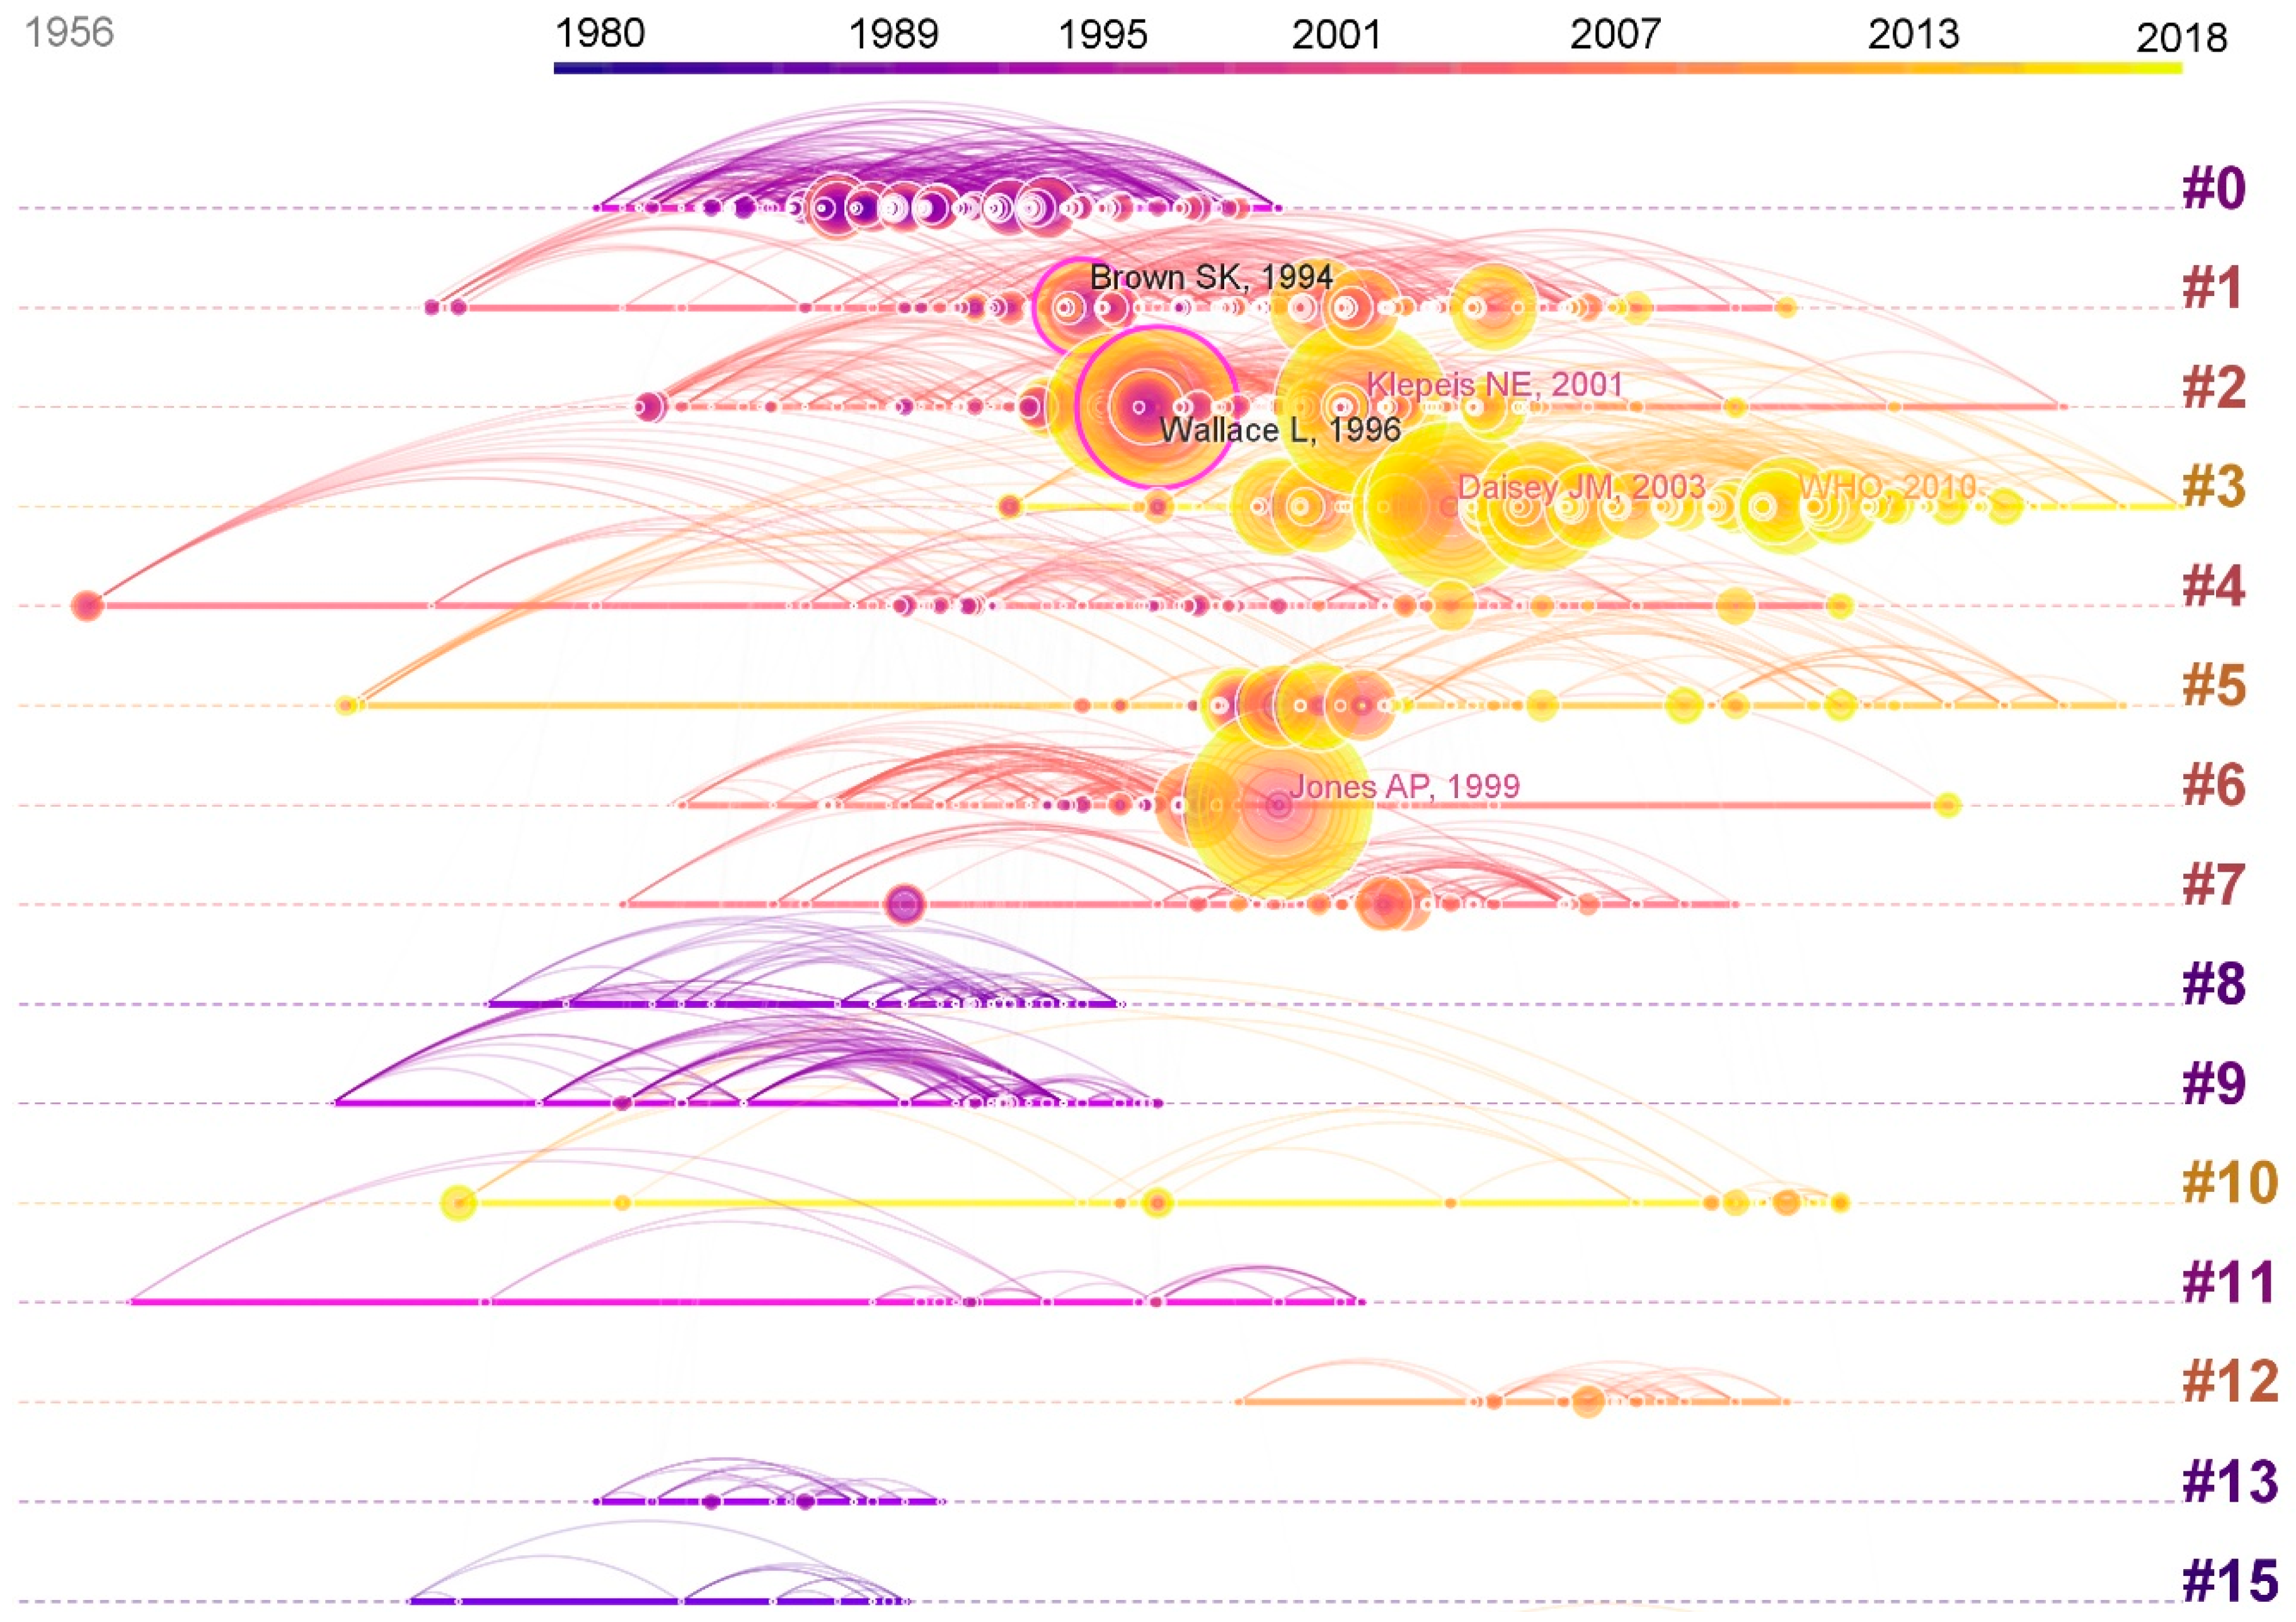
Figure 6 shows the timeline visualization in CiteSpace, in which clusters are distributed along the horizontal timeline, reported in the top view. In black are the top two items ranked by centrality, while the colors represent the top three most cited articles. The full list of articles, ordered by coverage for each cluster, is reported in the Supplementary file.
3.4.1. Most-Cited Articles
The top-ranked item by citation counts is a comprehensive review of the relationship between indoor air pollution and health by Jones [29] in Cluster #6, with 262 citation counts. The second most-cited article is by Klepeis [30] in Cluster #2, with the publication of the National Human Activity Pattern Survey (NHAPS): A two-year probability-based telephone survey, sponsored by the U.S. Environmental Protection Agency (EPA), to assess the population exposure to environmental pollutants, with 261 citation counts. The third most-cited article is by Daisey [31] in Cluster #3, with 233 citation counts. In this review, data about ventilation rates, pollutants concentrations, and symptoms related to indoor air contaminants in schools were collected. The results highlighted the limited knowledge on the topic and it was a starting point for all current research on IAQ in schools, as shown in Figure 6, Cluster #3. The fourth is the “Indoor Air Quality Guidelines” by the World Health Organization (WHO) in 2010 [2] (Cluster #3) with 151 citation counts. The guidelines identified in benzene, carbon monoxide, formaldehyde, naphthalene, nitrogen dioxide, polycyclic aromatic hydrocarbons, radon, trichloroethylene, and tetrachloroethylene, the selected indoor pollutants. The choice was made for three reasons: (1) These compounds have indoor sources; (2) they are known because of their hazardousness to health; and (3) they are often found indoors in concentrations of health concern. Particulate matter (PM) was exempt from the list, as it appears into the WHO guidelines on particulate matter were updated in 2005 [32], which also apply to indoor spaces. Mendell [33] in Cluster #3, who reviewed the literature on school environments and performance, had the same number of citations.
3.4.2. Citation Bursts
As previously reported, citations bursts are a strong indicator of scholarly impact in terms of the attention of the research community. Table 6 reports the first five citation bursts. The top-ranked item by citation bursts is the WHO guideline for indoor air quality [2], in Cluster #3. The second is a multidisciplinary review of the scientific literature on ventilation rates and occupant health by Sundell [34] and the third is by Klepeis [30]. Following these are two reviews about the relationship between indoor and outdoor particles by Chen et al. [35] and about formaldehyde by Salthammer [36]. These first five publications bursts belong to Clusters #2 and #3. Clusters with numerous nodes with strong citation bursts can be considered an emerging trend, so for this reason, Cluster #3 is of a particular interest.
3.4.3. Pivotal Points
Nodes that have high betweenness centrality scores, as defined by Freeman [38], are an indicator of how strongly a reference connects references associated with two or more clusters. Centrality is normalized to the unit interval of [0, 1]. The sigma score (Σ) of a node is a composite metric of the betweenness centrality and the citation burstness of the node, computed as [9].
The 1994 Brown paper (centrality = 0.14, Σ = 3.22) [39] is a typical pivot node; it is a strong contact point mainly between the two biggest clusters, and to a lesser extent between Cluster #8 and Cluster #10, as shown in Figure 5. This review systematically compared the concentration of VOCs in the indoor air of buildings of different classifications and categories, drawing mainly from the articles in Cluster #0 (1980–1999). Results suggested that indoor concentrations were significantly elevated above those outdoors, indicating that they were emitted from indoor sources. The aspect of source emission and modeling was afterward deepened by the publications gathered in Cluster #1 (as reported in Table 5).
Contemporary to the work of Brown about the analysis of the relationships between VOCs is the work of Wallace (centrality = 0.13, Σ = 9.05) [40], in which particle concentrations and sources in homes and buildings were summarized in detail. The conclusions suggested tobacco smoking as the leading source of indoor PM and secondary, cooking. Many links to Cluster #9 (topic—environmental tobacco smoke) highlight this aspect. Different from the previous study, PM infiltrations from the outdoors were found to contribute significantly to indoor PM. These first two papers have the highest centrality for Clusters #1 and #2, respectively.
The work of Bornehag (centrality = 0.06, Σ = 2.47) [41] is part of Cluster #5 (topic—“thermal comfort, relative humidity, HVAC”). In this study, the relationship between “dampness” in building and health was considered, concluding that there is evidence for a strong association between them. Dampness is usually related to the presence of microbial agents (supporting the closeness to Cluster #4) as airborne molds and bacteria. However, due to the limited knowledge about the mechanisms behind the association between ‘dampness’ and health effects, it is difficult to intervene to limit this problem, unlike other known major pollutants.
3.5. Actual and Future Trends
In the second part of the analysis, a restricted dataset (from 2010 to 2018) was used. The results of the selection are reported in Table 7. For each year slice, in the “Criteria” column, the interpolated citation, co-citation, and the cosine coefficient thresholds are reported [42]. The “Space” column reports the number of articles having at least one citation within the related year-slice.
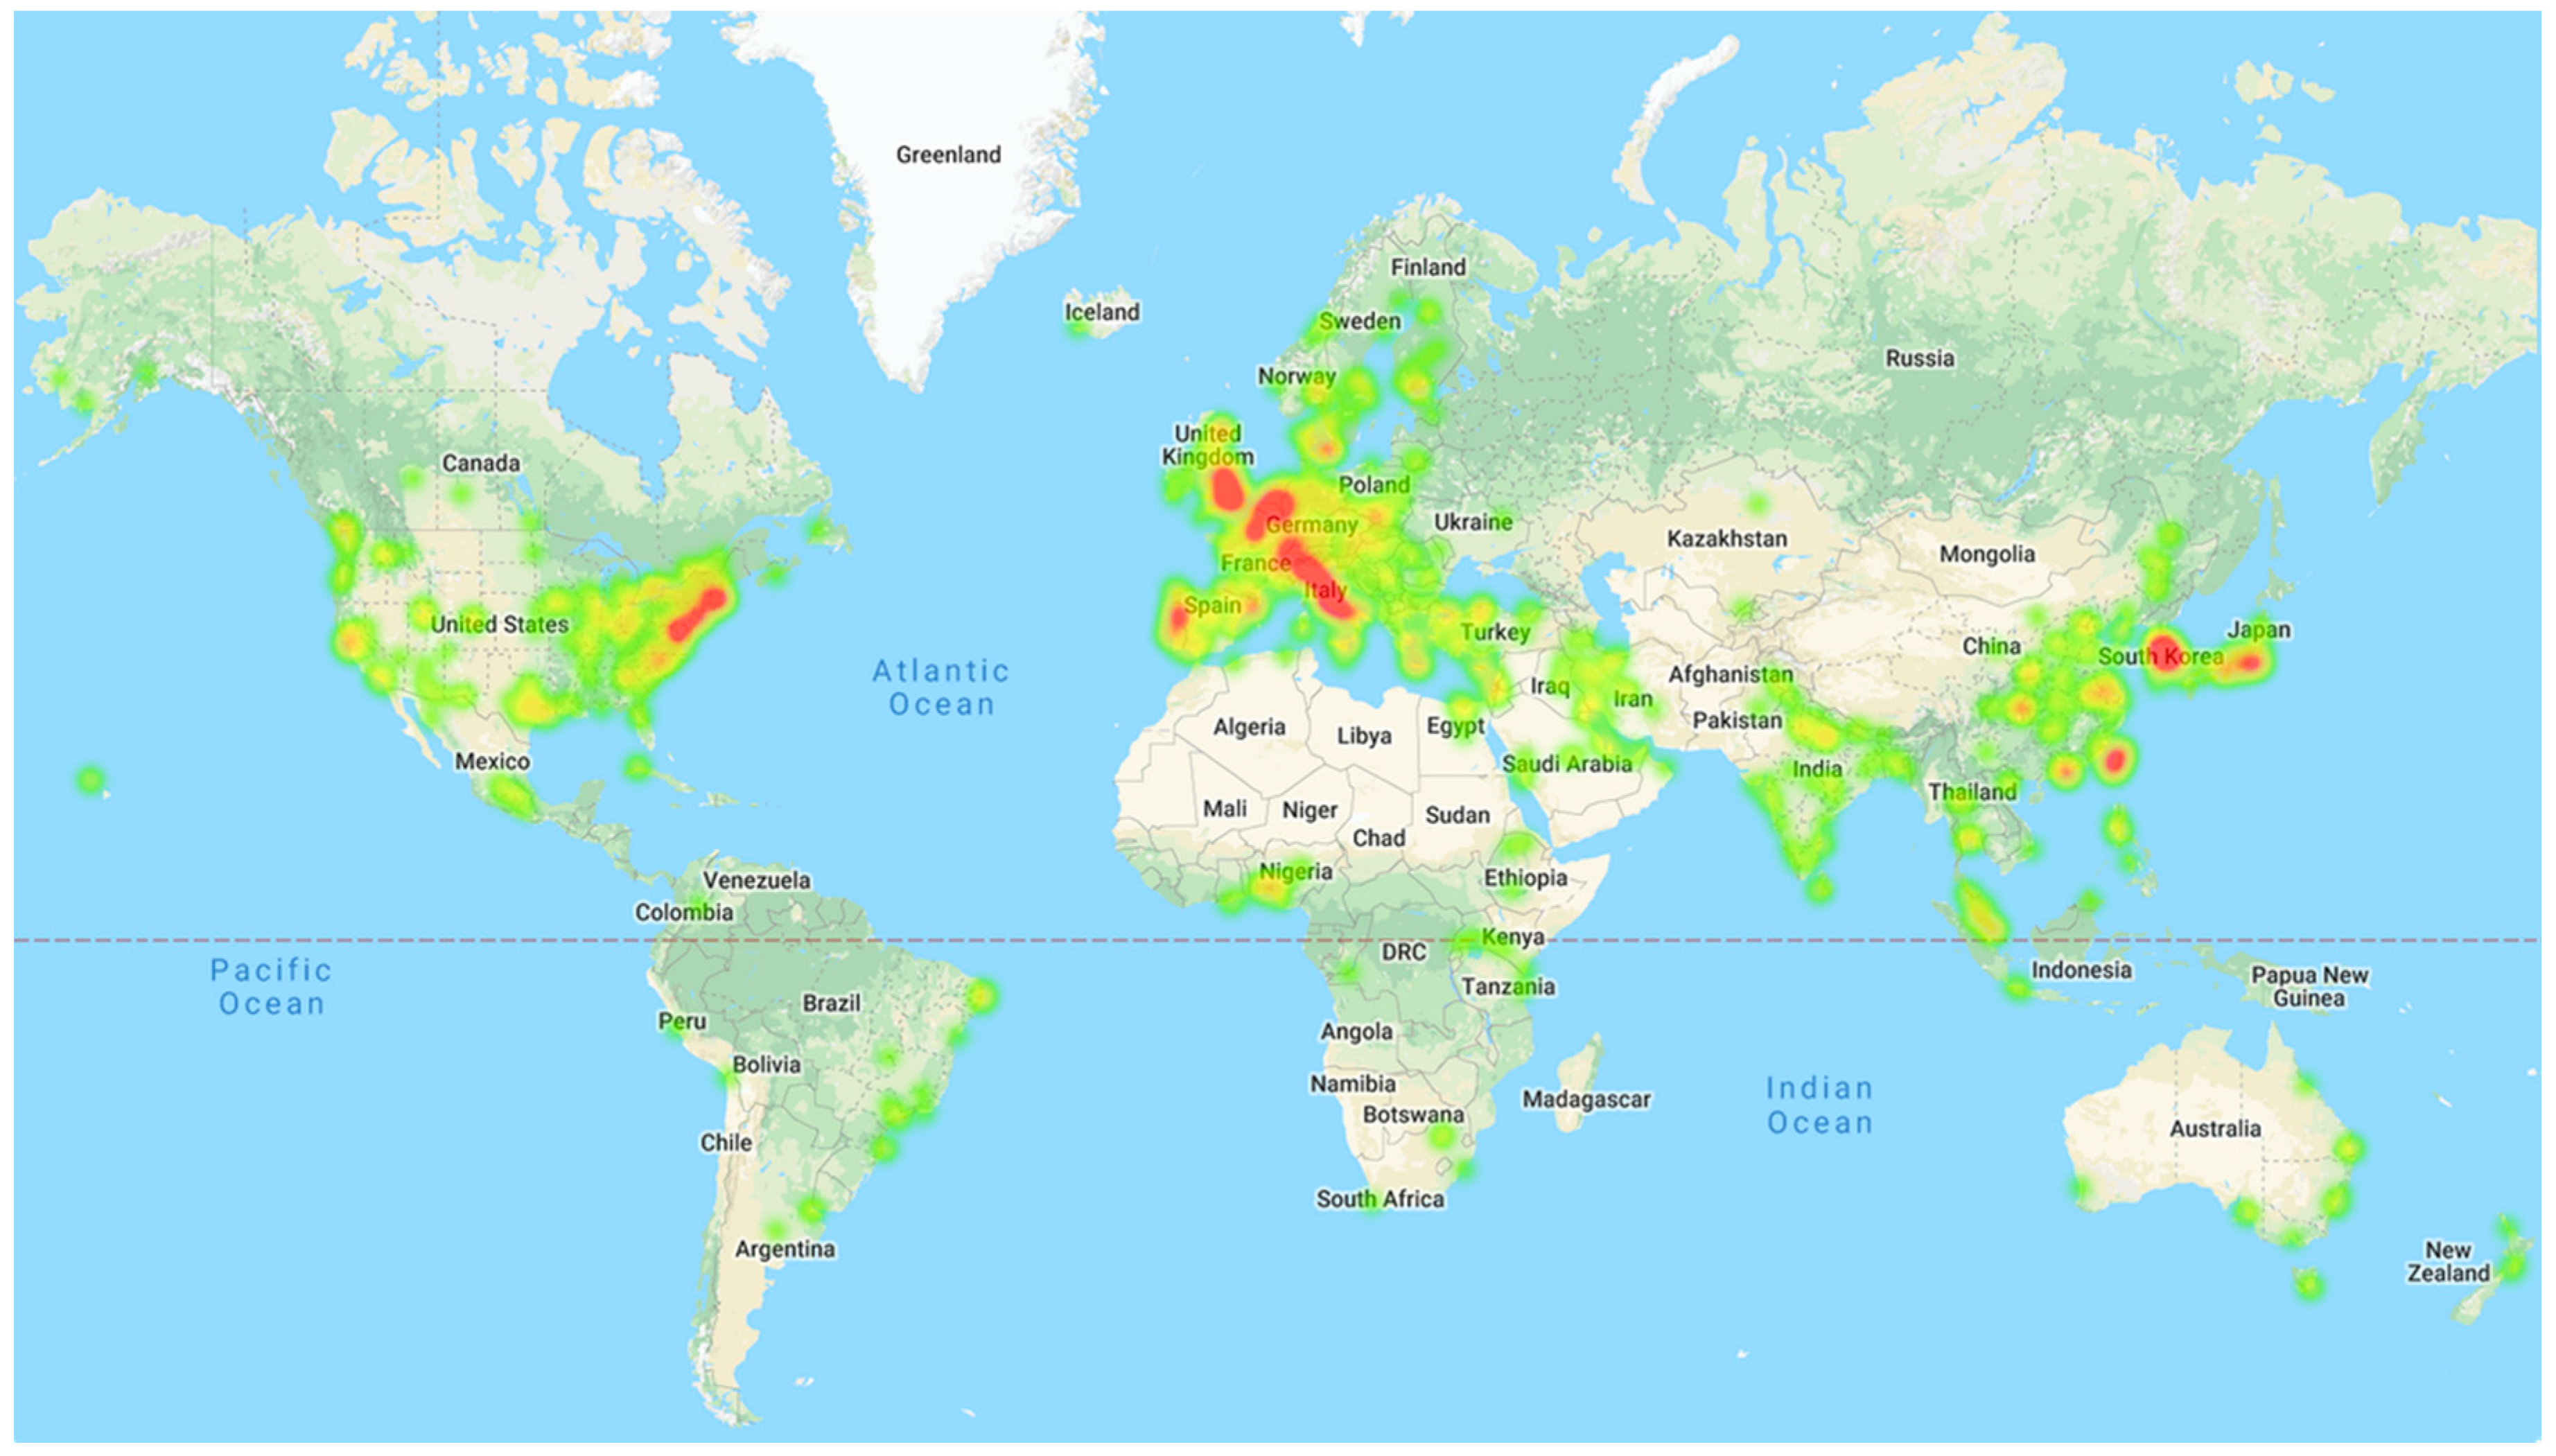
In this last period, the most active institutions are reported using a geographical distribution map, which was created using “Generate Google Earth Maps” in CiteSpace (Figure 7). The colors on the maps show the institution that published papers about IAQ during the last eight years. The most active areas are colored in red. Notably, this map only highlights the quantity and not the quality of the publications.
Figure 7 shows that countries and territories in Europe, Northeast U.S., and East Asia participated actively in IAQ research in the recent years. The results of the actual geographical map were consistent with the total contribution by country, reported in Table 2, which referred to the complete dataset.
Articles with high citation bursts in the development of IAQ, between 2010 and 2018 are reported in the following list, ordered in ascending initial burst date. References with strong values in the “Strength” column can be considered relevant in the last eight years for the IAQ field. The “Topic” column summarizes the content of the publication. The “Begin” and “End” columns report, respectively, the beginning and end of the citation burst.
The first milestone, in the last eight years of study, is the IAQ guidelines published by the WHO. Notably, 10 of the 25 publications reported in Table 8 are related to the school environment, and this constitutes a major topic. Another topic common between articles having a strong citation burst is the relationship between indoor and outdoor pollutants, followed by studies on ventilation.
4. Discussion
The categories and journals co-occurrence analysis showed the multidisciplinary nature of the IAQ topic and the most relevant categories. Although only a few journals are now the most active, the network of co-occurring journals reported an articulated structure, groupable into four macro thematic areas: Medicine, energy, buildings, and environments. Temporal patterns showed IAQ is a theme that has changed over time, often due to new external stimuli (different sources of pollution, different environments, and new emerging countries), and the result of new laws enacted, due to a greater awareness of the topic, such as non-smoking laws. Cluster analysis found 15 well-defined clusters, of which two (Cluster #2, “personal exposure” and Cluster #5, “thermal comfort”) are still active.
This study, although not comparable to a systematic and in-depth study of the issue, has allowed us to delineate the past and present of IAQ research. The analysis of when the meaningful terms had a citation burst, together with the study of the cluster timeline, shows how the concept of IAQ has blossomed, starting from a medical point of view, i.e., from the study of the symptoms of SBS in places of work. Over the years, the focus has shifted to the characterization of pollutants and risk assessment. With the introduction of the ban on smoking in public places and workplaces, one of the prevailing indoor sources has been greatly reduced.
At the same time, academic attention initially focused on workplaces, and then moved to public buildings, especially schools and hospitals. The implementation of non-smoking laws has reduced the focus on the Environmental Tobacco Smoke (ETS), despite the recent introduction of electronic cigarettes on the market.
Although many studies have been completed on indoor and outdoor sources of pollutants and risk assessments on poor air exposure, in many parts of the world, these sources have been abruptly reduced (ETS, for example), so IAQ remains important.
From the presence of new sources, ignored until a few years ago as niche or because they were non-existent (3D printers, electronic cigarettes), the field has evolved from the need to make workplaces as appropriate and pleasant as possible (by thinking of a broader concept of Indoor Environmental Quality, in which more environmental parameters are considered to increase productivity), due to the ubiquitous use of new available technologies (low-cost sensors and DNA sequencing techniques), to the new frontiers in indoor chemistry and transformation of indoor pollutants. These are just a few examples of the challenges that the scientific community working on the issue of IAQ has encountered in recent years, without considering the research based on non-major fields. These challenges range from the impact of clothing on exposure, to smart technologies, from the study of phytoremediation and materials able to passively improve air quality [63,64,65] to new technologies and purification processes [46,64,66,67,68]. The monitoring of indoor airborne pollutants is a necessary step for assessing personal exposure to pollutants not previously considered. Many of the chemicals presently found in indoor environments were not present in the past, and concentrations have varied over time due to the use of different building materials, new consumer products, electrical appliances, and cleaning products. For this reason, new monitoring campaigns, as well as new sampling methods, are required. Passive samplers are popular and convenient for distributed and long-term exposure assessment, but they cannot provide a short time-resolved picture of the indoor air, which can be completed by using more expensive analyzers. Widespread low-cost sensors are valuable resource that could be coupled with well-established monitoring techniques because, even if they have recently shown an improvement in power consumption, sensitivity, and resolution, they still have problems in selectivity. So, at the time of writing the present article, only laser scattering-based sensors for PM measurement provide acceptable results [69,70].
The collection of big data obtained from ubiquitous sensor networks [69,71,72] requires determining how to process and extract useful information from the raw data, and semantic frameworks can be a useful tool to address this challenge [73].
From another point of view, 1.2 billion people from developing countries are without access to electricity, while nearly 3 billion people worldwide are exposed to the threat of household air pollution every day from the use of solid fuel for cooking, heating, and lighting [74,75].
These are only a few aspects the indoor air community has to consider. Scientometric tools can be useful to analyze, categorize, and identify milestone and turning points if the scientific literature. However, these tools cannot be considered exhaustive and scientific advances will probably be driven by new multidisciplinary contaminations into the discipline.
Supplementary Materials
The following are available online at https://www.mdpi.com/2071-1050/10/11/3830/s1, Table S1: Publications with the highest coverage for each cluster, Table S2: Terms with the strongest citation burst.
Author Contributions
Conceptualization, M.P. and M.L.R.; Methodology, M.P.; Software, M.P.; Validation, M.P., M.L.R.; Investigation, M.P.; Data Curation, M.P.; Writing-Original Draft Preparation, M.P.; Writing-Review and Editing, M.L.R.; Visualization, M.P.; Supervision, M.L.R.; Project Administration, M.L.R.
Funding
This research received no external funding.
Conflicts of Interest
The authors declare no conflict of interest.
References
- Chen, C. Searching for intellectual turning points: Progressive knowledge domain visualization. Proc. Natl. Acad. Sci. USA 2004, 101, 5303–5310. [Google Scholar] [CrossRef] [PubMed] [Green Version]
- WHO. WHO Guidelines for Indoor Air Quality: Selected Pollutants; WHO: Geneva, Switzerland, 2010. [Google Scholar]
- Kleinberg, J. Bursty and hierarchical structure in streams. Data Min. Knowl. Discov. 2002, 91–101. [Google Scholar] [CrossRef]
- Molina, C.; Pickering, A.C.; Valjbjorn, O.; De Bartoli, M. Sick Building Syndrome. A Practical Guide; Office for Official Publications of the European Communities: Luxembourg, 1989; p. 36. [Google Scholar]
- Skov, P.; Valbjorn, O.; Pedersen, B.V. Influence of indoor climate on the sick building syndrome in an office environment. The Danish Indoor Climate Study Group. Scand. J. Work. Environ. Health 1990, 16, 363–371. [Google Scholar] [CrossRef] [PubMed]
- Spengler, J.D. Buildings operations and ETS exposure. Environ. Health Perspect. 1999, 107 (Suppl. 2), 313–317. [Google Scholar] [PubMed]
- Hodgson, M.J. Environmental tobacco smoke and the sick building syndrome. Occup. Med. 1989, 4, 735–740. [Google Scholar] [PubMed]
- Rousseeuw, P.J. Silhouettes: A graphical aid to the interpretation and validation of cluster analysis. J. Comput. Appl. Math. 1987, 20, 53–65. [Google Scholar] [CrossRef]
- Chen, C.; Ibekwe-SanJuan, F.; Hou, J. The Structure and Dynamics of Co-Citation Clusters: A Multiple-Perspective Co-Citation Analysis. J. Am. Soc. Inf. Sci. Technol. 2010. [Google Scholar] [CrossRef] [Green Version]
- Dunning, T. Accurate Methods for the Statistics of Surprise and Coincidence. Comput. Linguist. 1993, 19, 61–74. [Google Scholar]
- Wieslander, G.; Norbäck, D.; Nordström, K.; Wålinder, R.; Venge, P. Nasal and ocular symptoms, tear film stability and biomarkers in nasal lavage, in relation to building-dampness and building design in hospitals. Int. Arch. Occup. Environ. Health 1999, 72, 451–461. [Google Scholar] [CrossRef] [PubMed]
- Wieslander, G.; Norbäck, D.; Wålinder, R.; Erwall, C.; Venge, P. Inflammation markers in nasal lavage, and nasal symptoms in relation to relocation to a newly painted building: A longitudinal study. Int. Arch. Occup. Environ. Health 1999, 72, 507–515. [Google Scholar] [CrossRef] [PubMed]
- Brooks, B.O.; Utter, G.M.; DeBroy, J.A.; Schimke, R.D. Indoor Air Pollution: An Edifice Complex. J. Toxicol. Clin. Toxicol. 1991, 29, 315–374. [Google Scholar] [CrossRef] [PubMed]
- Nordström, K.; Norbäck, D.; Wieslander, G. Subjective Indoor Air Quality in Geriatric Hospitals. Indoor Built Environ. 1999, 8, 49–57. [Google Scholar] [CrossRef]
- Weschler, C.J. Ozone in Indoor Environments: Concentration and Chemistry. Indoor Air 2000, 10, 269–288. [Google Scholar] [CrossRef] [PubMed] [Green Version]
- Wolkoff, P. How to measure and evaluate volatile organic compound emissions from building products. A perspective. Sci. Total Environ. 1999, 227, 197–213. [Google Scholar] [CrossRef]
- Drakou, G.; Zerefos, C.; Ziomas, I. A Sensitivity Study of Parameters in the Nazaroff-Cass IAQ Model with Respect to Indoor Concentrations of O3, NO, NO2. Environ. Technol. 2000, 21, 483–503. [Google Scholar] [CrossRef]
- Wolkoff, P.; Clausen, P.A.; Wilkins, C.K.; Nielsen, G.D. Formation of Strong Airway Irritants in Terpene/Ozone Mixtures. Indoor Air 2000, 10, 82–91. [Google Scholar] [CrossRef] [PubMed]
- Feng, Y.; Wen, S.; Wang, X.; Sheng, G.; He, Q.; Tang, J.; Fu, J. Indoor and outdoor carbonyl compounds in the hotel ballrooms in Guangzhou, China. Atmos. Environ. 2004, 38, 103–112. [Google Scholar] [CrossRef]
- Bahadori, T.; Suh, H.; Koutrakis, P. Issues in Human Particulate Exposure Assessment: Relationship between Outdoor, Indoor, and Personal Exposures. Hum. Ecol. Risk Assess. Int. J. 1999, 5, 459–470. [Google Scholar] [CrossRef]
- Janssen, N.A.; Hoek, G.; Brunekreef, B.; Harssema, H. Mass concentration and elemental composition of PM10 in classrooms. Occup. Environ. Med. 1999, 56, 482–487. [Google Scholar] [CrossRef] [PubMed] [Green Version]
- Micallef, A.; Colls, J.J.; Caldwell, J. Measurement of vertical concentration profiles of airborne particulate matter in indoor environments: Implications for refinement of models and monitoring campaigns. Int. J. Environ. Health Res. 1999, 9, 5–18. [Google Scholar] [CrossRef]
- Braniš, M.; Šafránek, J. Characterization of coarse particulate matter in school gyms. Environ. Res. 2011, 111, 485–491. [Google Scholar] [CrossRef] [PubMed]
- Braniš, M.; Šafránek, J.; Hytychová, A. Indoor and outdoor sources of size-resolved mass concentration of particulate matter in a school gym—Implications for exposure of exercising children. Environ. Sci. Pollut. Res. 2011, 18, 598–609. [Google Scholar] [CrossRef] [PubMed]
- Fuoco, F.; Stabile, L.; Buonanno, G.; Trassiera, C.; Massimo, A.; Russi, A.; Mazaheri, M.; Morawska, L.; Andrade, A. Indoor Air Quality in Naturally Ventilated Italian Classrooms. Atmosphere (Basel) 2015, 6, 1652–1675. [Google Scholar] [CrossRef] [Green Version]
- Mejía, J.F.; Choy, S.L.; Mengersen, K.; Morawska, L. Methodology for assessing exposure and impacts of air pollutants in school children: Data collection, analysis and health effects—A literature review. Atmos. Environ. 2011, 45, 813–823. [Google Scholar] [CrossRef]
- Pacitto, A.; Stabile, L.; Viana, M.; Scungio, M.; Reche, C.; Querol, X.; Alastuey, A.; Rivas, I.; Álvarez-Pedrerol, M.; Sunyer, J.; et al. Particle-related exposure, dose and lung cancer risk of primary school children in two European countries. Sci. Total Environ. 2018, 616–617, 720–729. [Google Scholar] [CrossRef] [PubMed]
- Pacitto, A.; Stabile, L.; Moreno, T.; Kumar, P.; Wierzbicka, A.; Morawska, L.; Buonanno, G. The influence of lifestyle on airborne particle surface area doses received by different Western populations. Environ. Pollut. 2018, 232, 113–122. [Google Scholar] [CrossRef] [PubMed]
- Jones, A.P. Indoor air quality and health. Atmos. Environ. 1999, 33, 4535–4564. [Google Scholar] [CrossRef]
- Klepeis, N.E.; Nelson, W.C.; Ott, W.R.; Robinson, J.P.; Tsang, A.M.; Switzer, P.; Behar, J.V.; Hern, S.C.; Engelmann, W.H. The National Human Activity Pattern Survey (NHAPS): A resource for assessing exposure to environmental pollutants. J. Expo. Sci. Environ. Epidemiol. 2001, 11, 231–252. [Google Scholar] [CrossRef] [PubMed]
- Daisey, J.M.; Angell, W.J.; Apte, M.G. Indoor air quality, ventilation and health symptoms in schools: An analysis of existing information. Indoor Air 2003, 13, 53–64. [Google Scholar] [CrossRef] [PubMed]
- World Health Organization (WHO). Air Quality Guidelines for Particulate Matter, Ozone, Nitrogen Dioxide and Sulfur Dioxide: Global Update 2005: Summary of Risk Assessment; WHO: Geneva, Switzerland, 2006; pp. 1–22. [Google Scholar] [CrossRef]
- Mendell, M.J.; Heath, G.A. Do indoor pollutants and thermal conditions in schools influence student performance? A critical review of the literature. Indoor Air 2005, 15, 27–52. [Google Scholar] [CrossRef] [PubMed] [Green Version]
- Sundell, J.; Levin, H.; Nazaroff, W.W.; Cain, W.S.; Fisk, W.J.; Grimsrud, D.T.; Gyntelberg, F.; Li, Y.; Persily, A.K.; Pickering, A.C.; et al. Ventilation rates and health: Multidisciplinary review of the scientific literature. Indoor Air 2011, 21, 191–204. [Google Scholar] [CrossRef] [PubMed]
- Chen, C.; Zhao, B. Review of relationship between indoor and outdoor particles: I/O ratio, infiltration factor and penetration factor. Atmos. Environ. 2011, 45, 275–288. [Google Scholar] [CrossRef]
- Salthammer, T.; Mentese, S.; Marutzky, R. Formaldehyde in the Indoor Environment. Chem. Rev. 2010, 110, 2536–2572. [Google Scholar] [CrossRef] [PubMed]
- Chow, J.C. Health Effects of Fine Particulate Air Pollution: Lines that Connect. J. Air Waste Manag. Assoc. 2006, 56, 707–708. [Google Scholar] [CrossRef] [PubMed] [Green Version]
- Freeman, L.C. A Set of Measures of Centrality Based on Betweenness. Sociometry 1977, 40, 35. [Google Scholar] [CrossRef]
- Brown, S.K.; Sim, M.R.; Abramson, M.J.; Gray, C.N. Concentrations of Volatile Organic Compounds in Indoor Air—A Review. Indoor Air 1994, 4, 123–134. [Google Scholar] [CrossRef]
- Wallace, L. Indoor Particles: A Review. J. Air Waste Manag. Assoc. 1996, 46, 98–126. [Google Scholar] [CrossRef] [PubMed] [Green Version]
- Bornehag, C.-G.; Blomquist, G.; Gyntelberg, F.; Jarvholm, B.; Malmberg, P.; Nordvall, L.; Nielsen, A.; Pershagen, G.; Sundell, J. Dampness in Buildings and Health. Nordic Interdisciplinary Review of the Scientific Evidence on Associations between Exposure to “Dampness” in Buildings and Health Effects (NORDDAMP). Indoor Air 2001, 11, 72–86. [Google Scholar] [CrossRef] [PubMed]
- Chen, C. The CiteSpace Manual. Coll. Comput. Inform. 2014, 1–84. [Google Scholar] [CrossRef]
- Yu, C.W.F.; Kim, J.T. Building Pathology, Investigation of Sick Buildings—VOC Emissions. Indoor Built Environ. 2010, 19, 30–39. [Google Scholar] [CrossRef]
- Yu, C.W.F.; Jeong, T.K. Building environmental assessment schemes for rating of IAQ in sustainable buildings. Indoor Built Environ. 2011, 20, 5–15. [Google Scholar] [CrossRef]
- Dimitroulopoulou, C. Ventilation in European dwellings: A review. Build. Environ. 2012, 47, 109–125. [Google Scholar] [CrossRef]
- Zhang, Y.; Mo, J.; Li, Y.; Sundell, J.; Wargocki, P.; Zhang, J.; Little, J.C.; Corsi, R.; Deng, Q.; Leung, M.H.K.; et al. Can commonly-used fan-driven air cleaning technologies improve indoor air quality? A literature review. Atmos. Environ. 2011, 45, 4329–4343. [Google Scholar] [CrossRef]
- Almeida, S.M.; Canha, N.; Silva, A.; do Carmo Freitas, M.; Pegas, P.; Alves, C.; Evtyugina, M.; Pio, C.A. Children exposure to atmospheric particles in indoor of Lisbon primary schools. Atmos. Environ. 2011, 45, 7594–7599. [Google Scholar] [CrossRef]
- Lim, S.S.; Vos, T.; Flaxman, A.D.; Danaei, G.; Shibuya, K.; Adair-Rohani, H.; AlMazroa, M.A.; Amann, M.; Anderson, H.R.; Andrews, K.G.; et al. A comparative risk assessment of burden of disease and injury attributable to 67 risk factors and risk factor clusters in 21 regions, 1990–2010: A systematic analysis for the Global Burden of Disease Study 2010. Lancet 2012, 380, 2224–2260. [Google Scholar] [CrossRef]
- Hospodsky, D.; Qian, J.; Nazaroff, W.W.; Yamamoto, N.; Bibby, K.; Rismani-Yazdi, H.; Peccia, J. Human Occupancy as a Source of Indoor Airborne Bacteria. PLoS ONE 2012, 7, e34867. [Google Scholar] [CrossRef] [PubMed] [Green Version]
- Satish, U.; Mendell, M.J.; Shekhar, K.; Hotchi, T.; Sullivan, D.; Streufert, S.; Fisk, W.J. Is CO2 an Indoor Pollutant? Direct Effects of Low-to-Moderate CO2 Concentrations on Human Decision-Making Performance. Environ. Health Perspect. 2012. [Google Scholar] [CrossRef] [PubMed]
- Geiss, O.; Giannopoulos, G.; Tirendi, S.; Barrero-Moreno, J.; Larsen, B.R.; Kotzias, D. The AIRMEX study—VOC measurements in public buildings and schools/kindergartens in eleven European cities: Statistical analysis of the data. Atmos. Environ. 2011, 45, 3676–3684. [Google Scholar] [CrossRef]
- Pegas, P.N.; Alves, C.A.; Evtyugina, M.G.; Nunes, T.; Cerqueira, M.; Franchi, M.; Pio, C.A.; Almeida, S.M.; Verde, S.C.; Freitas, M.C. Seasonal evaluation of outdoor/indoor air quality in primary schools in Lisbon. J. Environ. Monit. 2011, 13, 657. [Google Scholar] [CrossRef] [PubMed]
- Guo, H.; Morawska, L.; He, C.; Zhang, Y.L.; Ayoko, G.; Cao, M. Characterization of particle number concentrations and PM2.5 in a school: Influence of outdoor air pollution on indoor air. Environ. Sci. Pollut. Res. 2010, 17, 1268–1278. [Google Scholar] [CrossRef] [PubMed] [Green Version]
- Logue, J.M.; McKone, T.E.; Sherman, M.H.; Singer, B.C. Hazard assessment of chemical air contaminants measured in residences. Indoor Air 2011, 21, 92–109. [Google Scholar] [CrossRef] [PubMed] [Green Version]
- Pegas, P.N.; Evtyugina, M.G.; Alves, C.A.; Nunes, T.; Cerqueira, M.; Franchi, M.; Pio, C.; Almeida, S.M.; Freitas, M.D.C. Outdoor/indoor air quality in primary schools in Lisbon: A preliminary study. Quim. Nova 2010, 33, 1145–1149. [Google Scholar] [CrossRef]
- Qian, J.; Hospodsky, D.; Yamamoto, N.; Nazaroff, W.W.; Peccia, J. Size-resolved emission rates of airborne bacteria and fungi in an occupied classroom. Indoor Air 2012, 22, 339–351. [Google Scholar] [CrossRef] [PubMed] [Green Version]
- Wichmann, J.; Lind, T.; Nilsson, M.A.-M.; Bellander, T. PM2.5, soot and NO2 indoor–outdoor relationships at homes, pre-schools and schools in Stockholm, Sweden. Atmos. Environ. 2010, 44, 4536–4544. [Google Scholar] [CrossRef]
- Pegas, P.N.; Alves, C.A.; Evtyugina, M.G.; Nunes, T.; Cerqueira, M.; Franchi, M.; Pio, C.A.; Almeida, S.M.; Freitas, M.C. Indoor air quality in elementary schools of Lisbon in spring. Environ. Geochem. Health 2011, 33, 455–468. [Google Scholar] [CrossRef] [PubMed]
- Pegas, P.N.; Nunes, T.; Alves, C.A.; Silva, J.R.; Vieira, S.L.A.; Caseiro, A.; Pio, C.A. Indoor and outdoor characterisation of organic and inorganic compounds in city centre and suburban elementary schools of Aveiro, Portugal. Atmos. Environ. 2012, 55, 80–89. [Google Scholar] [CrossRef]
- Annesi-Maesano, I.; Baiz, N.; Banerjee, S.; Rudnai, P.; Rive, S.; Sinphonie Group. Indoor Air Quality and Sources in Schools and Related Health Effects. J. Toxicol. Environ. Health Part B 2013, 16, 491–550. [Google Scholar] [CrossRef] [PubMed]
- Fabi, V.; Andersen, R.V.; Corgnati, S.; Olesen, B.W. Occupants’ window opening behaviour: A literature review of factors influencing occupant behaviour and models. Build. Environ. 2012, 58, 188–198. [Google Scholar] [CrossRef]
- Mendell, M.J.; Eliseeva, E.A.; Davies, M.M.; Spears, M.; Lobscheid, A.; Fisk, W.J.; Apte, M.G. Association of classroom ventilation with reduced illness absence: A prospective study in California elementary schools. Indoor Air 2013, 23, 515–528. [Google Scholar] [CrossRef] [PubMed]
- Pierpaoli, M.; Fava, G. A passive opportunity for improving air quality in the schools environment: A real-world scale testing. Am. J. Environ. Sci. 2016, 12, 206–212. [Google Scholar] [CrossRef]
- Pierpaoli, M.; Giosuè, C.; Ruello, M.L.; Fava, G. Appraisal of a hybrid air cleaning process. Environ. Sci. Pollut. Res. 2017, 24, 12638–12645. [Google Scholar] [CrossRef] [PubMed]
- Giosuè, C.; Pierpaoli, M.; Mobili, A.; Ruello, M.L.; Tittarelli, F. Influence of binders and lightweight aggregates on the properties of cementitious mortars: From traditional requirements to indoor air quality improvement. Materials (Basel) 2017, 10. [Google Scholar] [CrossRef] [PubMed]
- Pichat, P.; Disdier, J.; Hoang-Van, C.; Mas, D.; Goutailler, G.; Gaysse, C. Purification/deodorization of indoor air and gaseous effluents by TiO2 photocatalysis. Catal. Today 2000, 63, 363–369. [Google Scholar] [CrossRef]
- Chen, W.; Chen, W.; Zhang, J.S. Performance of air cleaners for removing multi- volatile organic compounds in indoor air. ASHRAE Trans. 2005, 111, 1101–1114. [Google Scholar]
- Pierpaoli, M.; Ruello, M.; Fava, G. Enhanced Adsorption of Organic Compounds over an Activated Carbon Cloth by an External-Applied Electric Field. Environments 2017, 4, 33. [Google Scholar] [CrossRef]
- Zikova, N.; Hopke, P.K.; Ferro, A.R. Evaluation of new low-cost particle monitors for PM2.5 concentrations measurements. J. Aerosol Sci. 2017. [Google Scholar] [CrossRef]
- Morawska, L.; Thai, P.K.; Liu, X.; Asumadu-Sakyi, A.; Ayoko, G.; Bartonova, A.; Bedini, A.; Chai, F.; Christensen, B.; Dunbabin, M.; et al. Applications of low-cost sensing technologies for air quality monitoring and exposure assessment: How far have they gone? Environ. Int. 2018, 116, 286–299. [Google Scholar] [CrossRef] [PubMed]
- Ali, A.S.; Zanzinger, Z.; Debose, D.; Stephens, B. Open Source Building Science Sensors (OSBSS): A low-cost Arduino-based platform for long-term indoor environmental data collection. Build. Environ. 2016, 100, 114–126. [Google Scholar] [CrossRef]
- Cannistraro, M.; Restivo, R. Monitoring of indoor microclimatic conditions of an eighteenth-century church, with wireless sensors. Adv. Model. Anal. B 2018, 61, 28–36. [Google Scholar] [CrossRef]
- Delgoshaei, P.; Heidarinejad, M.; Austin, M. Semantic Frameworks for Model-based Assessment and Management of Indoor Air Quality. In Proceedings of the Indoor Air, Philadelphia, PA, USA, 22 July 2018. [Google Scholar]
- Gordon, S.B.; Bruce, N.G.; Grigg, J.; Hibberd, P.L.; Kurmi, O.P.; Lam, K.H.; Mortimer, K.; Asante, K.P.; Balakrishnan, K.; Balmes, J.; et al. Respiratory risks from household air pollution in low and middle income countries. Lancet Respir. Med. 2014, 2, 823–860. [Google Scholar] [CrossRef] [Green Version]
- Schluger, N. Household air quality in high-income countries: Forgotten but not gone. Lancet Respir. Med. 2014, 2, 781–783. [Google Scholar] [CrossRef]
Figure 1.
Temporal distribution of the bibliographic set.

Figure 2.
Top 10 journals with the highest number of publications. The line represents the cumulative incidence of the entire dataset.
Figure 2.
Top 10 journals with the highest number of publications. The line represents the cumulative incidence of the entire dataset.

Figure 3.
Network of co-occurring subject categories.

Figure 4.
Network of co-occurring Journals.

Figure 5.
Landscape views of the resulted network. The arrow indicates the pivotal points; the most cited articles are written in bold and the citation bursts in italic.
Figure 5.
Landscape views of the resulted network. The arrow indicates the pivotal points; the most cited articles are written in bold and the citation bursts in italic.

Figure 6.
Timeline view of the clusters.

Figure 7.
Geographical distribution of published paper in the 2010–2018 dataset.


Table 1.
Top 15 contributing institutions.
| Organizations | Records | % of 7389 | Country |
|---|---|---|---|
| University of California System | 274 | 3.71% | USA |
| Tsinghua University | 195 | 2.64% | China |
| Hong Kong Polytechnic University | 189 | 2.56% | China |
| University of California Berkeley | 186 | 2.52% | USA |
| United States Department of Energy DOE | 158 | 2.14% | USA |
| Technical University of Denmark | 141 | 1.91% | Denmark |
| United States Environmental Protection Agency | 127 | 1.72% | USA |
| Lawrence Berkeley National Laboratory | 126 | 1.71% | USA |
| Harvard University | 123 | 1.67% | USA |
| Centre National de la Recherche Scientifique CNRS | 91 | 1.23% | France |
| Chinese Academy of Sciences | 85 | 1.15% | China |
| University of London | 82 | 1.11% | UK |
| Finland National Institute for Health Welfare | 80 | 1.08% | Finland |
| Uppsala University | 77 | 1.04% | Sweden |
| Centers for Disease Control Prevention USA | 71 | 0.96% | USA |
Table 2.
Top 10 contributing countries.
| Country | Records | % of 7389 |
|---|---|---|
| USA | 2032 | 27.50% |
| China | 1043 | 14.12% |
| England | 444 | 6.01% |
| Canada | 375 | 5.08% |
| South Korea | 371 | 5.02% |
| Italy | 369 | 4.99% |
| France | 355 | 4.80% |
| Germany | 288 | 3.90% |
| Denmark | 282 | 3.82% |
| Australia | 241 | 3.26% |
Table 3.
Top 10 categories.
| Field | Record Count | % of 7389 |
|---|---|---|
| Engineering | 2839 | 38.42% |
| Environmental Sciences Ecology | 2426 | 32.83% |
| Construction Building Technology | 2285 | 30.92% |
| Public Environmental Occupational Health | 1748 | 23.66% |
| Energy Fuels | 719 | 9.73% |
| Meteorology Atmospheric Sciences | 627 | 8.49% |
| Chemistry | 458 | 6.20% |
| Thermodynamics | 374 | 5.06% |
| Science Technology Other Topics | 280 | 3.79% |
| Toxicology | 275 | 3.72% |
| Materials Science | 184 | 2.49% |
| Agriculture | 142 | 1.92% |
| Allergy | 104 | 1.41% |
| Instruments Instrumentation | 104 | 1.41% |
| Mechanics | 102 | 1.38% |
Table 4.
Terms having high citation burst strengths.
| Terms | Strength | Begin | End | 1990–2018 |
|---|---|---|---|---|
| Indoor Air-Quality | 47.64 | 1990 | 1995 | ▃▃▃▃▃▃▂▂▂▂▂▂▂▂▂▂▂▂▂▂▂▂▂▂▂▂▂▂▂ |
| Sick Building Syndrome | 27.26 | 1991 | 2006 | ▂▃▃▃▃▃▃▃▃▃▃▃▃▃▃▃▃▂▂▂▂▂▂▂▂▂▂▂▂ |
| Office Workers | 10.43 | 1991 | 2004 | ▂▃▃▃▃▃▃▃▃▃▃▃▃▃▃▂▂▂▂▂▂▂▂▂▂▂▂▂▂ |
| Environmental Tobacco Smoke | 33.26 | 1991 | 2004 | ▂▃▃▃▃▃▃▃▃▃▃▃▃▃▃▂▂▂▂▂▂▂▂▂▂▂▂▂▂ |
| Outdoor Level | 9.54 | 1991 | 2008 | ▂▃▃▃▃▃▃▃▃▃▃▃▃▃▃▃▃▃▃▂▂▂▂▂▂▂▂▂▂ |
| Nitrogen Dioxide | 11.89 | 1996 | 2002 | ▂▂▂▂▂▂▃▃▃▃▃▃▃▂▂▂▂▂▂▂▂▂▂▂▂▂▂▂▂ |
| Personal Exposures | 10.57 | 1998 | 2005 | ▂▂▂▂▂▂▂▂▃▃▃▃▃▃▃▃▂▂▂▂▂▂▂▂▂▂▂▂▂ |
| Fungal Spores | 8.63 | 1998 | 2006 | ▂▂▂▂▂▂▂▂▃▃▃▃▃▃▃▃▃▂▂▂▂▂▂▂▂▂▂▂▂ |
| Respiratory Symptoms | 8.79 | 1999 | 2008 | ▂▂▂▂▂▂▂▂▂▃▃▃▃▃▃▃▃▃▃▂▂▂▂▂▂▂▂▂▂ |
| Displacement Ventilation | 9.68 | 2002 | 2007 | ▂▂▂▂▂▂▂▂▂▂▂▂▃▃▃▃▃▃▂▂▂▂▂▂▂▂▂▂▂ |
| Airborne Bacteria | 10.56 | 2002 | 2011 | ▂▂▂▂▂▂▂▂▂▂▂▂▃▃▃▃▃▃▃▃▃▃▂▂▂▂▂▂▂ |
| Air-Conditioning System | 10.19 | 2004 | 2011 | ▂▂▂▂▂▂▂▂▂▂▂▂▂▂▃▃▃▃▃▃▃▃▂▂▂▂▂▂▂ |
| Health Effects | 9.02 | 2005 | 2010 | ▂▂▂▂▂▂▂▂▂▂▂▂▂▂▂▃▃▃▃▃▃▂▂▂▂▂▂▂▂ |
| Computational Fluid Dynamics | 9.48 | 2007 | 2012 | ▂▂▂▂▂▂▂▂▂▂▂▂▂▂▂▂▂▃▃▃▃▃▃▂▂▂▂▂▂ |
| Air-Conditioned Offices | 13.81 | 2007 | 2009 | ▂▂▂▂▂▂▂▂▂▂▂▂▂▂▂▂▂▃▃▃▂▂▂▂▂▂▂▂▂ |
| Fresh Air | 12.19 | 2008 | 2012 | ▂▂▂▂▂▂▂▂▂▂▂▂▂▂▂▂▂▂▃▃▃▃▃▂▂▂▂▂▂ |
| Ultrafine Particles | 11.36 | 2010 | 2015 | ▂▂▂▂▂▂▂▂▂▂▂▂▂▂▂▂▂▂▂▂▃▃▃▃▃▃▂▂▂ |
| Practical Implications | 12.12 | 2010 | 2012 | ▂▂▂▂▂▂▂▂▂▂▂▂▂▂▂▂▂▂▂▂▃▃▃▂▂▂▂▂▂ |
| Indoor Environmental Quality | 16.88 | 2013 | 2018 | ▂▂▂▂▂▂▂▂▂▂▂▂▂▂▂▂▂▂▂▂▂▂▂▃▃▃▃▃▃ |
| CO2 Concentration | 22.72 | 2014 | 2018 | ▂▂▂▂▂▂▂▂▂▂▂▂▂▂▂▂▂▂▂▂▂▂▂▂▃▃▃▃▃ |
| Indoor PM2.5 | 19.85 | 2014 | 2018 | ▂▂▂▂▂▂▂▂▂▂▂▂▂▂▂▂▂▂▂▂▂▂▂▂▃▃▃▃▃ |
| Air Conditioning System | 8.00 | 2014 | 2016 | ▂▂▂▂▂▂▂▂▂▂▂▂▂▂▂▂▂▂▂▂▂▂▂▂▃▃▃▂▂ |
| Indoor Temperature | 8.81 | 2014 | 2015 | ▂▂▂▂▂▂▂▂▂▂▂▂▂▂▂▂▂▂▂▂▂▂▂▂▃▃▂▂▂ |
| Energy Efficiency | 8.86 | 2015 | 2018 | ▂▂▂▂▂▂▂▂▂▂▂▂▂▂▂▂▂▂▂▂▂▂▂▂▂▃▃▃▃ |
| Public Health | 9.11 | 2015 | 2016 | ▂▂▂▂▂▂▂▂▂▂▂▂▂▂▂▂▂▂▂▂▂▂▂▂▂▃▃▂▂ |
| Air Temperature | 9.50 | 2016 | 2018 | ▂▂▂▂▂▂▂▂▂▂▂▂▂▂▂▂▂▂▂▂▂▂▂▂▂▂▃▃▃ |
| Residential Buildings | 15.25 | 2016 | 2018 | ▂▂▂▂▂▂▂▂▂▂▂▂▂▂▂▂▂▂▂▂▂▂▂▂▂▂▃▃▃ |
| Indoor Air Temperature | 14.62 | 2016 | 2018 | ▂▂▂▂▂▂▂▂▂▂▂▂▂▂▂▂▂▂▂▂▂▂▂▂▂▂▃▃▃ |
| Energy Saving | 12.56 | 2016 | 2018 | ▂▂▂▂▂▂▂▂▂▂▂▂▂▂▂▂▂▂▂▂▂▂▂▂▂▂▃▃▃ |
| Thermal Comfort | 11.83 | 2016 | 2018 | ▂▂▂▂▂▂▂▂▂▂▂▂▂▂▂▂▂▂▂▂▂▂▂▂▂▂▃▃▃ |
| Outdoor PM2.5 | 15.36 | 2016 | 2018 | ▂▂▂▂▂▂▂▂▂▂▂▂▂▂▂▂▂▂▂▂▂▂▂▂▂▂▃▃▃ |
Table 5.
Clusters description.
| # | Size | Silhouette | Name | Description | Range (Years) |
|---|---|---|---|---|---|
| 0 | 145 | 0.866 | Nasal Lavage | Correlation between physical/chemical parameters and occupants symptoms. | 1980–1999 |
| 1 | 125 | 0.725 | Building Product | Gaseous pollutants: Source, modeling, concentrations. Indoor sources. | 1973–2010 |
| 2 | 109 | 0.766 | Personal Exposure | Personal exposure to particulate matter. | 1981–2006 |
| 3 | 105 | 0.753 | Indoor Air Quality (IAQ) | Air quality in school and residential homes. | 1992–2017 |
| 4 | 63 | 0.908 | Macrocyclic Trichothecene Mycotoxins | Asthma, bacterial and fungal aerosols. | 1958–2011 |
| 5 | 43 | 0.884 | Thermal comfort | Thermal comfort, relative humidity, HVAC. | 1970–2016 |
| 6 | 41 | 0.916 | Particle exposure | Risk assessment. Environmental tobacco smoke. | 1982–2013 |
| 7 | 41 | 0.94 | CFD study | Ventilation. CFD modeling. | 1980–2009 |
| 8 | 35 | 0.962 | Human Health | Epidemiology of SBS and related symptoms | 1975–1995 |
| 9 | 27 | 0.912 | Public Lounge | Environmental tobacco smoke. | 1969–1996 |
| 10 | 17 | 0.971 | Low-Carbon Housing | Air purification techniques. Numerical modeling. | 1974–2011 |
| 11 | 16 | 0.974 | Integrated IAQ Model | VOC emissions. | 1960–2001 |
| 12 | 14 | 0.999 | Asian countries | * | 1998–2010 |
| 13 | 11 | 0.997 | Los Angeles Basin | * | 1975–1990 |
| 15 | 10 | 0.989 | Health benefit | * | 1974–1989 |
* The cluster shows a high silhouette, but it’s difficult to identify a common topic. VOC, volatile organic; HVAC, Heating, Ventilation and Air Conditioning; CVD, Computational Fluid Dynamics.
Table 6.
Top 5 citation bursts.
| Bursts | References | Cluster | |
|---|---|---|---|
| 44.37 | World Health Organization (WHO) Guidelines For Indoor Air Quality | [2] | 3 |
| 37.81 | Ventilation rates and health: Multidisciplinary review of the scientific literature | [34] | 3 |
| 33.83 | The National Human Activity Pattern Survey (NHAPS): A resource for assessing exposure to environmental pollutants | [30] | 2 |
| 28.03 | Health Effects of Fine Particulate Air Pollution: Lines that Connect | [37] | 3 |
| 27.76 | Formaldehyde in the Indoor Environment | [36] | 3 |
Table 7.
Description of the new restricted dataset, resulting from the thresholding.
| 1-Year Slices | Criteria | Space | Nodes | Links/All |
|---|---|---|---|---|
| 2010–2010 | 8 | 8 | 0.4 | 6116 | 4 | 0/2 |
| 2011–2011 | 7 | 7 | 0.38 | 7577 | 22 | 8/86 |
| 2012–2012 | 7 | 7 | 0.36 | 7352 | 24 | 8/80 |
| 2013–2013 | 6 | 6 | 0.34 | 9311 | 46 | 26/187 |
| 2014–2014 | 6 | 6 | 0.32 | 9511 | 87 | 103/841 |
| 2015–2015 | 6 | 6 | 0.3 | 13,675 | 109 | 218/1497 |
| 2016–2016 | 4 | 4 | 0.23 | 14,241 | 404 | 808/7267 |
| 2017–2017 | 3 | 3 | 0.17 | 16,496 | 1001 | 2002/19654 |
| 2018–2018 | 2 | 2 | 0.1 | 7117 | 618 | 1236/7066 |
Table 8.
A list of 25 articles having a strong (“strength” > 5) citation burst over a total of 83.
| References | Topic | Strength | Range | 2010–2018 | |
|---|---|---|---|---|---|
| Yu, C.W.F., 2010 | [43] | VOCs and formaldehyde emissions | 15.73 | 2011–2014 | ▂▃▃▃▃▂▂▂▂ |
| WHO, 2010 | [2] | IAQ: WHO guidelines | 23.65 | 2012–2015 | ▂▂▃▃▃▃▂▂▂ |
| Yu, C.W.F., 2011 | [44] | IEQ assessment: Standards and certifications | 13.93 | 2012–2013 | ▂▂▃▃▂▂▂▂▂ |
| Chen, C., 2011 | [35] | Indoor/outdoor particles relation | 11.44 | 2013–2015 | ▂▂▂▃▃▃▂▂▂ |
| Dimitroulopoulou, C., 2012 | [45] | Ventilation in European dwellings | 8.58 | 2013–2015 | ▂▂▂▃▃▃▂▂▂ |
| Zhang, Y.P., 2011 | [46] | A review on fan-driven air cleaning technologies | 7.18 | 2013–2015 | ▂▂▂▃▃▃▂▂▂ |
| Salthammer, T., 2010 | [36] | Indoor Formaldehyde | 8.76 | 2013–2015 | ▂▂▂▃▃▃▂▂▂ |
| Sundell, J., 2011 | [34] | Ventilation rates and health | 16.36 | 2013–2015 | ▂▂▂▃▃▃▂▂▂ |
| Almeida, S.M., 2011 | [47] | Children exposure to PM in primary schools | 19.63 | 2013–2015 | ▂▂▂▃▃▃▂▂▂ |
| Lim, S.S., 2012 | [48] | Risk assessment of disease burden caused by different risks | 11.43 | 2014–2015 | ▂▂▂▂▃▃▂▂▂ |
| Hospodsky, D., 2012 | [49] | Human occupancy as a source of indoor airborne bacteria | 5.41 | 2014–2015 | ▂▂▂▂▃▃▂▂▂ |
| Satish, U., 2012 | [50] | Effects of CO2 on human decision-making performance | 5.93 | 2014–2015 | ▂▂▂▂▃▃▂▂▂ |
| Geiss, O., 2011 | [51] | VOC in public buildings, schools, kindergartens | 5.15 | 2014–2015 | ▂▂▂▂▃▃▂▂▂ |
| Pegas, P.N., 2011 | [52] | Outdoor/indoor air quality in primary schools | 8.67 | 2014–2015 | ▂▂▂▂▃▃▂▂▂ |
| Guo, H., 2010 | [53] | PM2.5 in school | 9.39 | 2014–2015 | ▂▂▂▂▃▃▂▂▂ |
| Logue, J.M., 2011 | [54] | Hazard assessment of chemical air contaminants in houses | 5.14 | 2014–2015 | ▂▂▂▂▃▃▂▂▂ |
| Pegas, P.N., 2010 | [55] | Outdoor/indoor air quality in primary schools | 10.06 | 2014–2015 | ▂▂▂▂▃▃▂▂▂ |
| Qian, J., 2012 | [56] | Emission rates of airborne bacteria and fungi in classroom | 6.31 | 2014–2015 | ▂▂▂▂▃▃▂▂▂ |
| Wichmann, J., 2010 | [57] | PM2.5, soot and NO2: Indoor/outdoor relationships | 6.54 | 2014–2015 | ▂▂▂▂▃▃▂▂▂ |
| Branis, M., 2011 | [23] | PM in school gyms | 6.69 | 2014–2015 | ▂▂▂▂▃▃▂▂▂ |
| Pegas, P.N., 2011 | [58] | Indoor air quality in schools | 9.93 | 2014–2015 | ▂▂▂▂▃▃▂▂▂ |
| Pegas, P.N., 2012 | [59] | Pollutants inside school | 6.43 | 2014–2015 | ▂▂▂▂▃▃▂▂▂ |
| Annesi-Maesano, I., 2013 | [60] | IAQ in school | 5.20 | 2014–2016 | ▂▂▂▂▃▃▃▂▂ |
| Fabi, V., 2012 | [61] | Occupants’ window opening behavior | 5.38 | 2015–2016 | ▂▂▂▂▂▃▃▂▂ |
| Mendell, M.J., 2013 | [62] | Classroom ventilation and reduced illness absence | 6.77 | 2015–2016 | ▂▂▂▂▂▃▃▂▂ |
© 2018 by the authors. Licensee MDPI, Basel, Switzerland. This article is an open access article distributed under the terms and conditions of the Creative Commons Attribution (CC BY) license (http://creativecommons.org/licenses/by/4.0/).
Share and Cite
MDPI and ACS Style
Pierpaoli, M.; Ruello, M.L. Indoor Air Quality: A Bibliometric Study. Sustainability 2018, 10, 3830. https://doi.org/10.3390/su10113830
AMA Style
Pierpaoli M, Ruello ML. Indoor Air Quality: A Bibliometric Study. Sustainability. 2018; 10(11):3830. https://doi.org/10.3390/su10113830
Chicago/Turabian StylePierpaoli, Mattia, and Maria Letizia Ruello. 2018. "Indoor Air Quality: A Bibliometric Study" Sustainability 10, no. 11: 3830. https://doi.org/10.3390/su10113830
Note that from the first issue of 2016, this journal uses article numbers instead of page numbers. See further details here.