Thermal and Vibration Comfort Analysis of a Nearly Zero-Energy Building in Poland

 , , ,
, , ,
Abstract
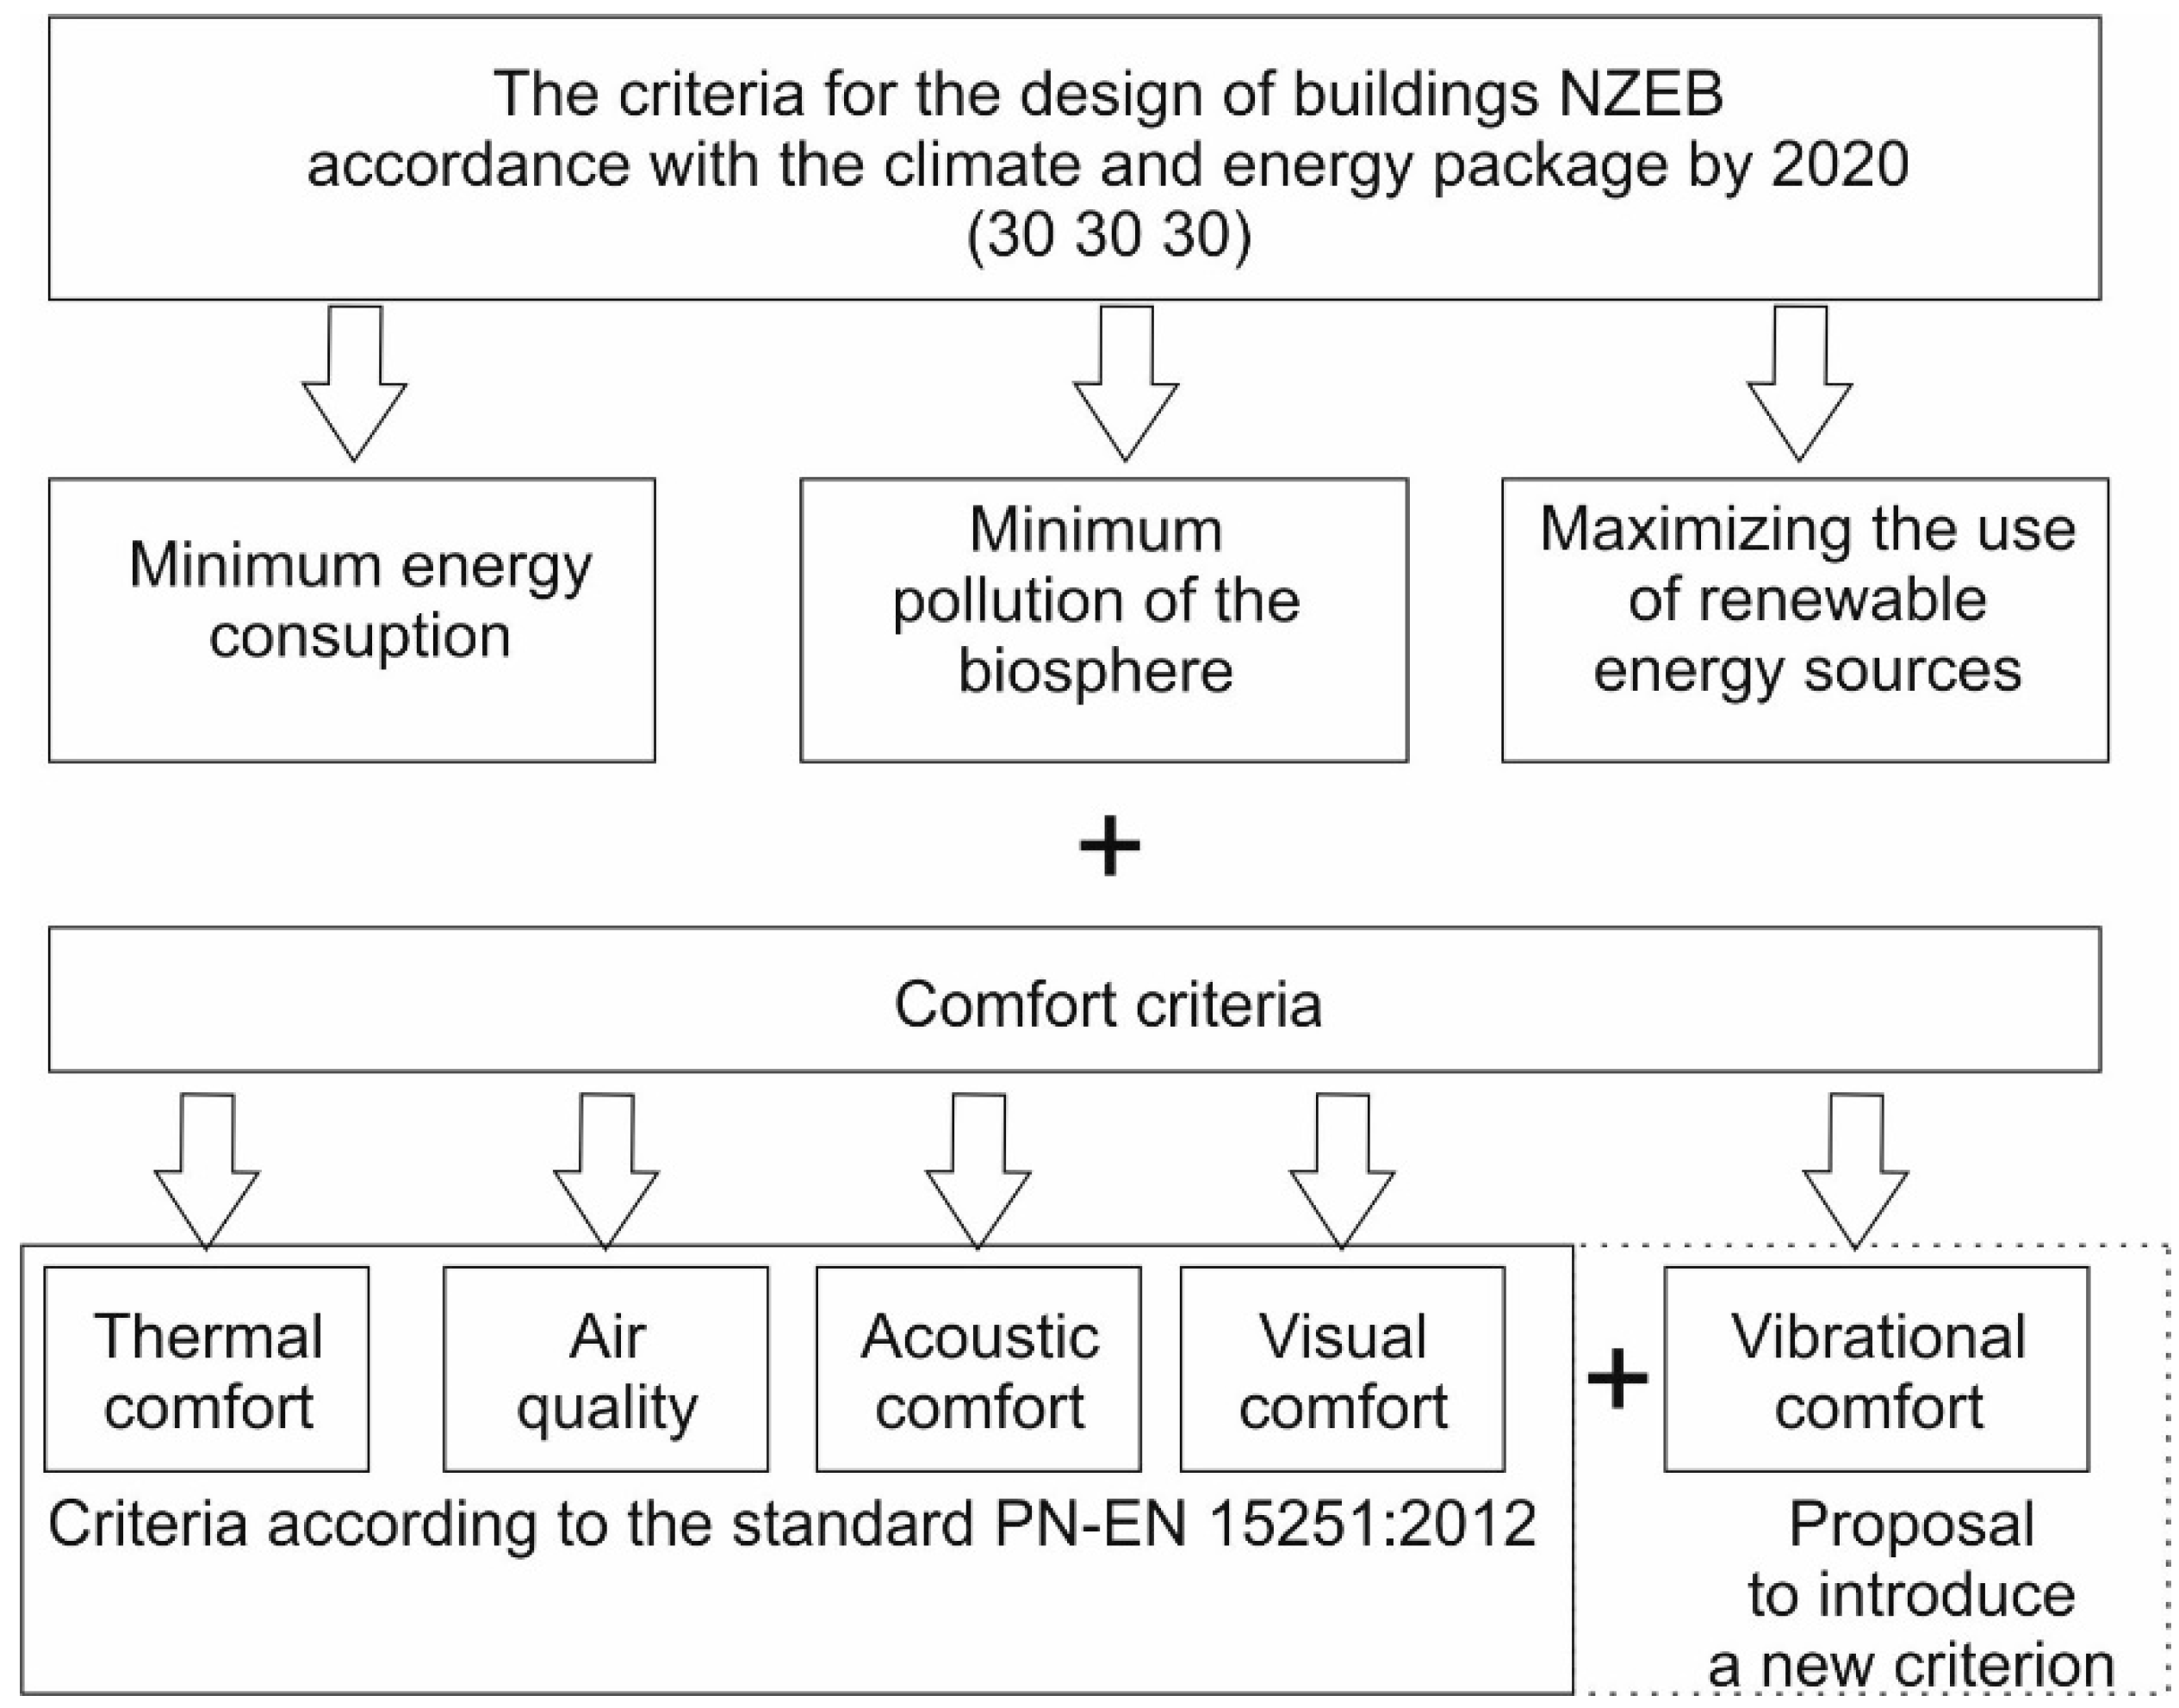
:1. Introduction
2. Materials and Methods
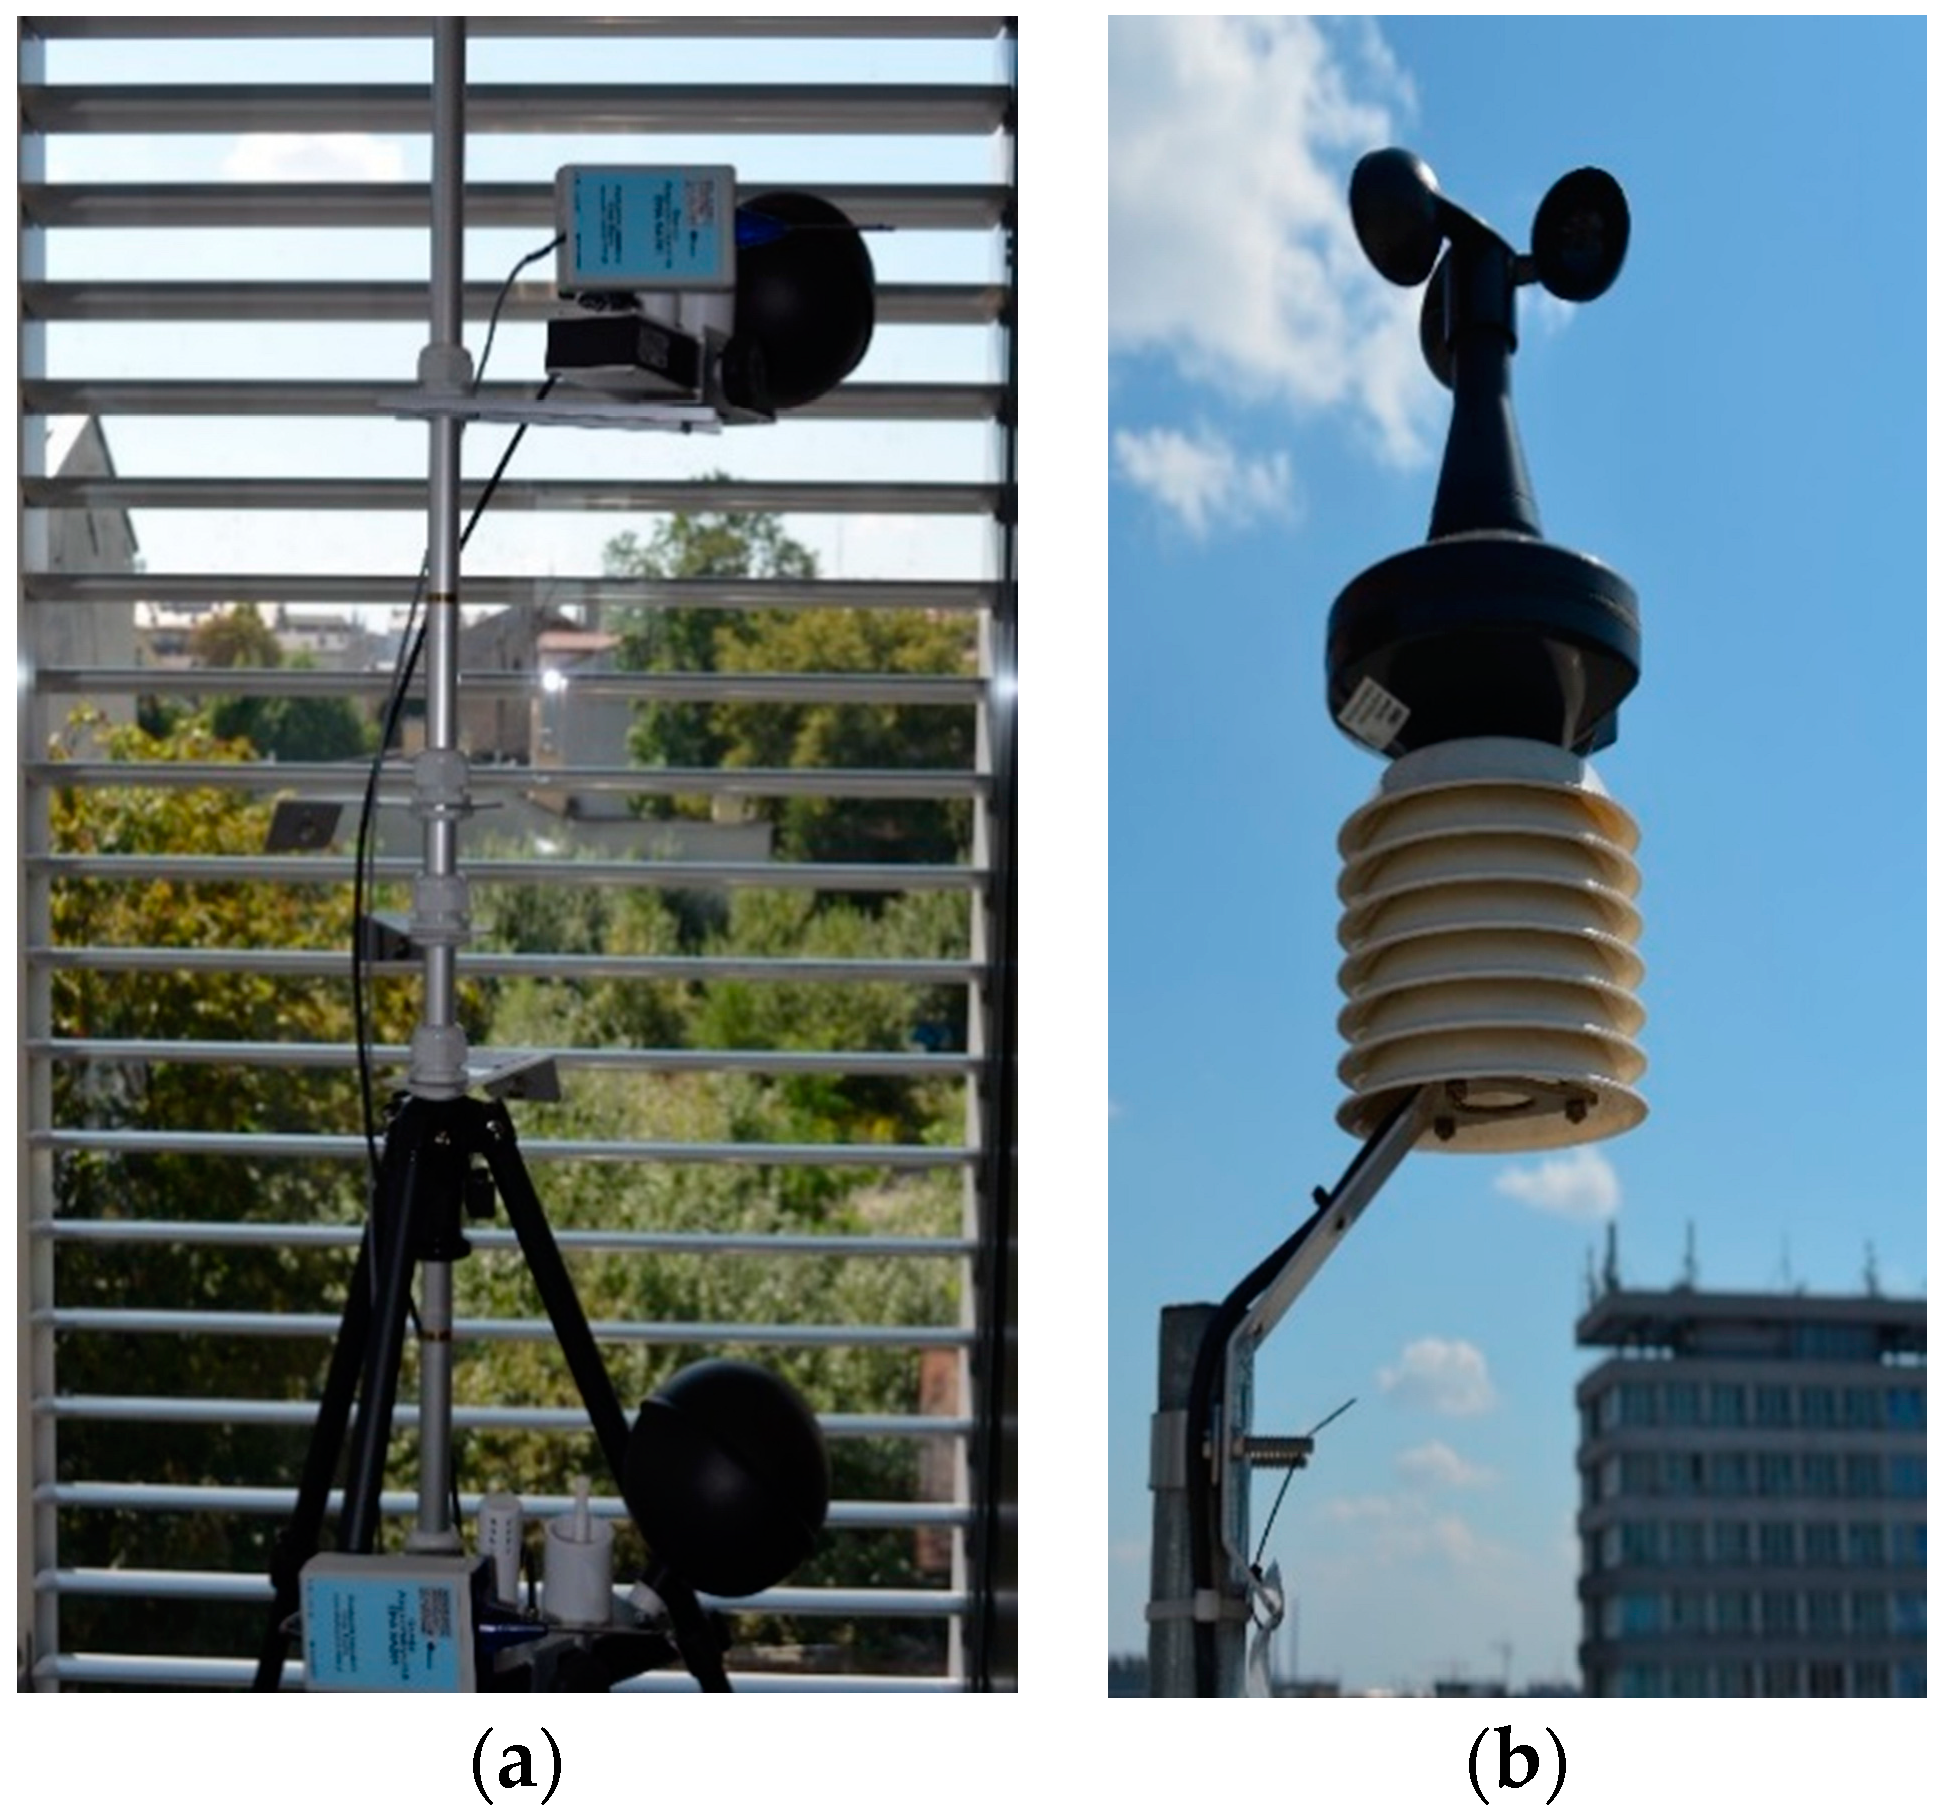
2.1. The Criterion for Ensuring Thermal Comfort
- (a)
- from equations, through computer simulations, e.g., in BASIC (the norm gives the formula for the program);
- (b)
- directly from the tables included in the norm [16]; these values are estimated values;
- (c)
- measured directly with an integrated sensor.
- ta—air temperature measurement;
- tg—temperature of blackened sphere (heat radiation meter)—the black sphere, in agreement with the norms, should be 15 cm in diameter;
- tnw—natural wet-bulb temperature measurement;
- RH—measurement of relative air humidity;
- Va—measurement of air flow speed.
−0.42 × [(M − W) − 58.15] − 1.7 × 10⁻⁵ × M × (5867 − pa) − 0.0014 × M × (34 − ta)
−3.96 × 10⁻⁸ × fcl × [(tcl + 273)4 − (t-r + 273)4] − fcl × hc × (tcl − ta))
tcl = 35.7 − 0.028 × (M − W) − Icl{3.96 × 10⁻⁸ × fcl × [(tcl + 273)4 − (t-r + 273)4] + fcl × hc × (tcl − ta)}
- M—the amount of metabolism (W/m2)
- W—the density of energy loss in the form of mechanical work (W/m2)
- Icl—clothing insulation (m2K/W)
- fcl—surface of clothes (m2)
- ta—air temperature (°C)
- t-r—average radiation temperature (°C)
- tcl—temperature of the clothes surface (°C)
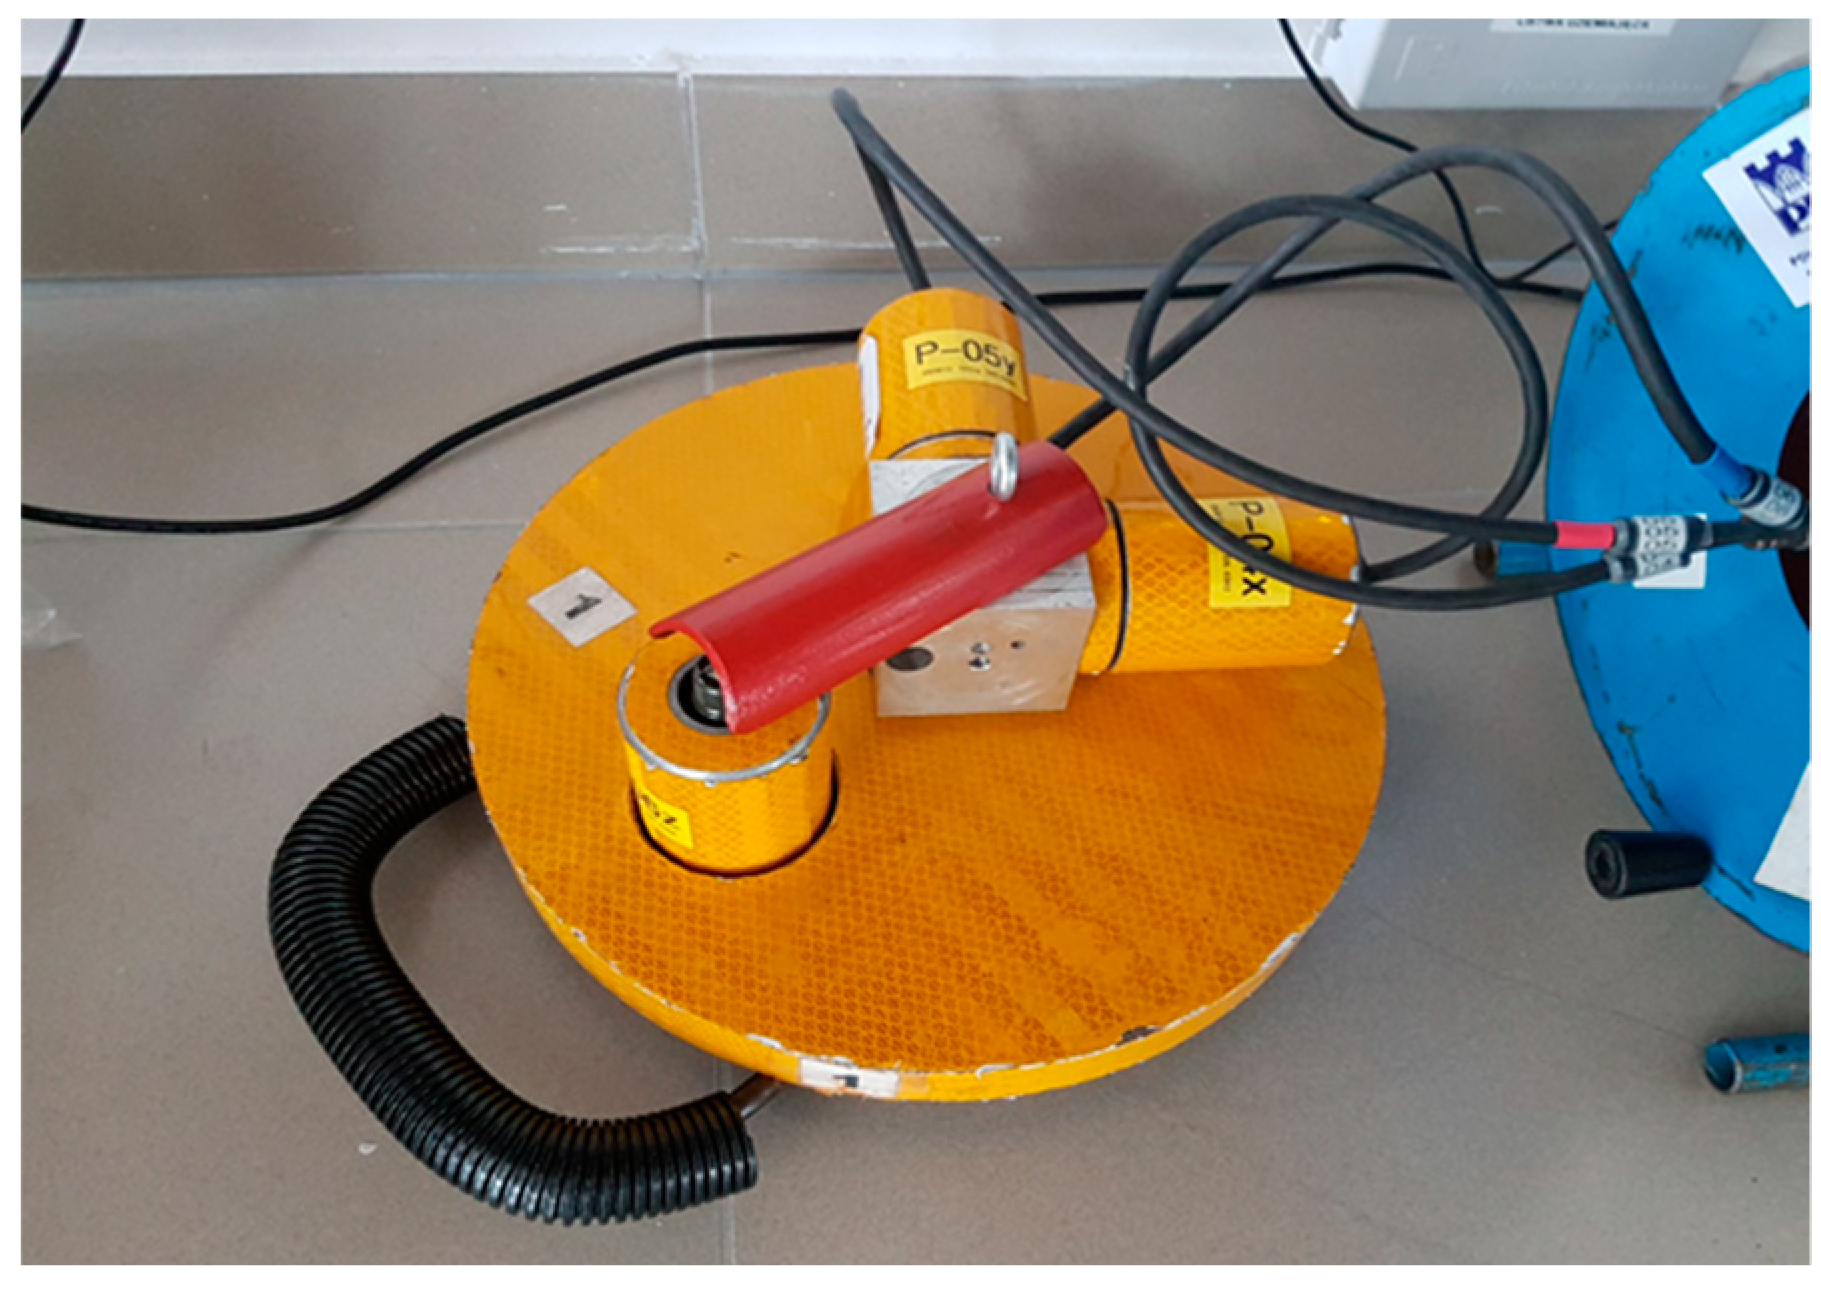
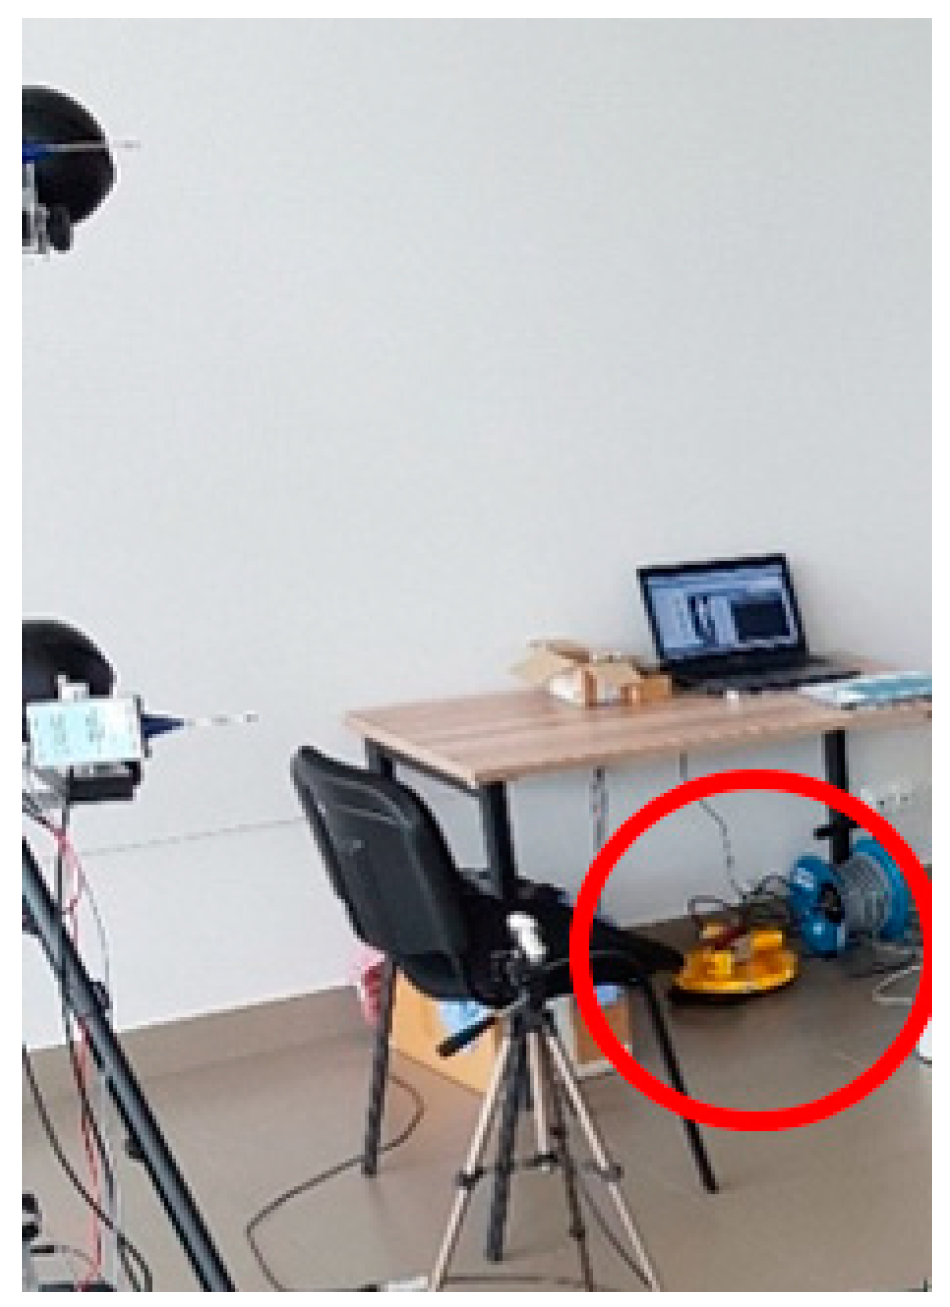
2.2. The Criterion for Ensuring Vibrational Comfort
- 393B12 type piezoelectric accelerometers PCBs;
- the ESAM Traveler Plus electronic data registration system;
- PA16000 EC Electronics signal conditioning system;
- LMS SCADAS Mobile analyzer (recording and analyzing system);
- measurement data analysis software (Matlab 7.3).
3. Results
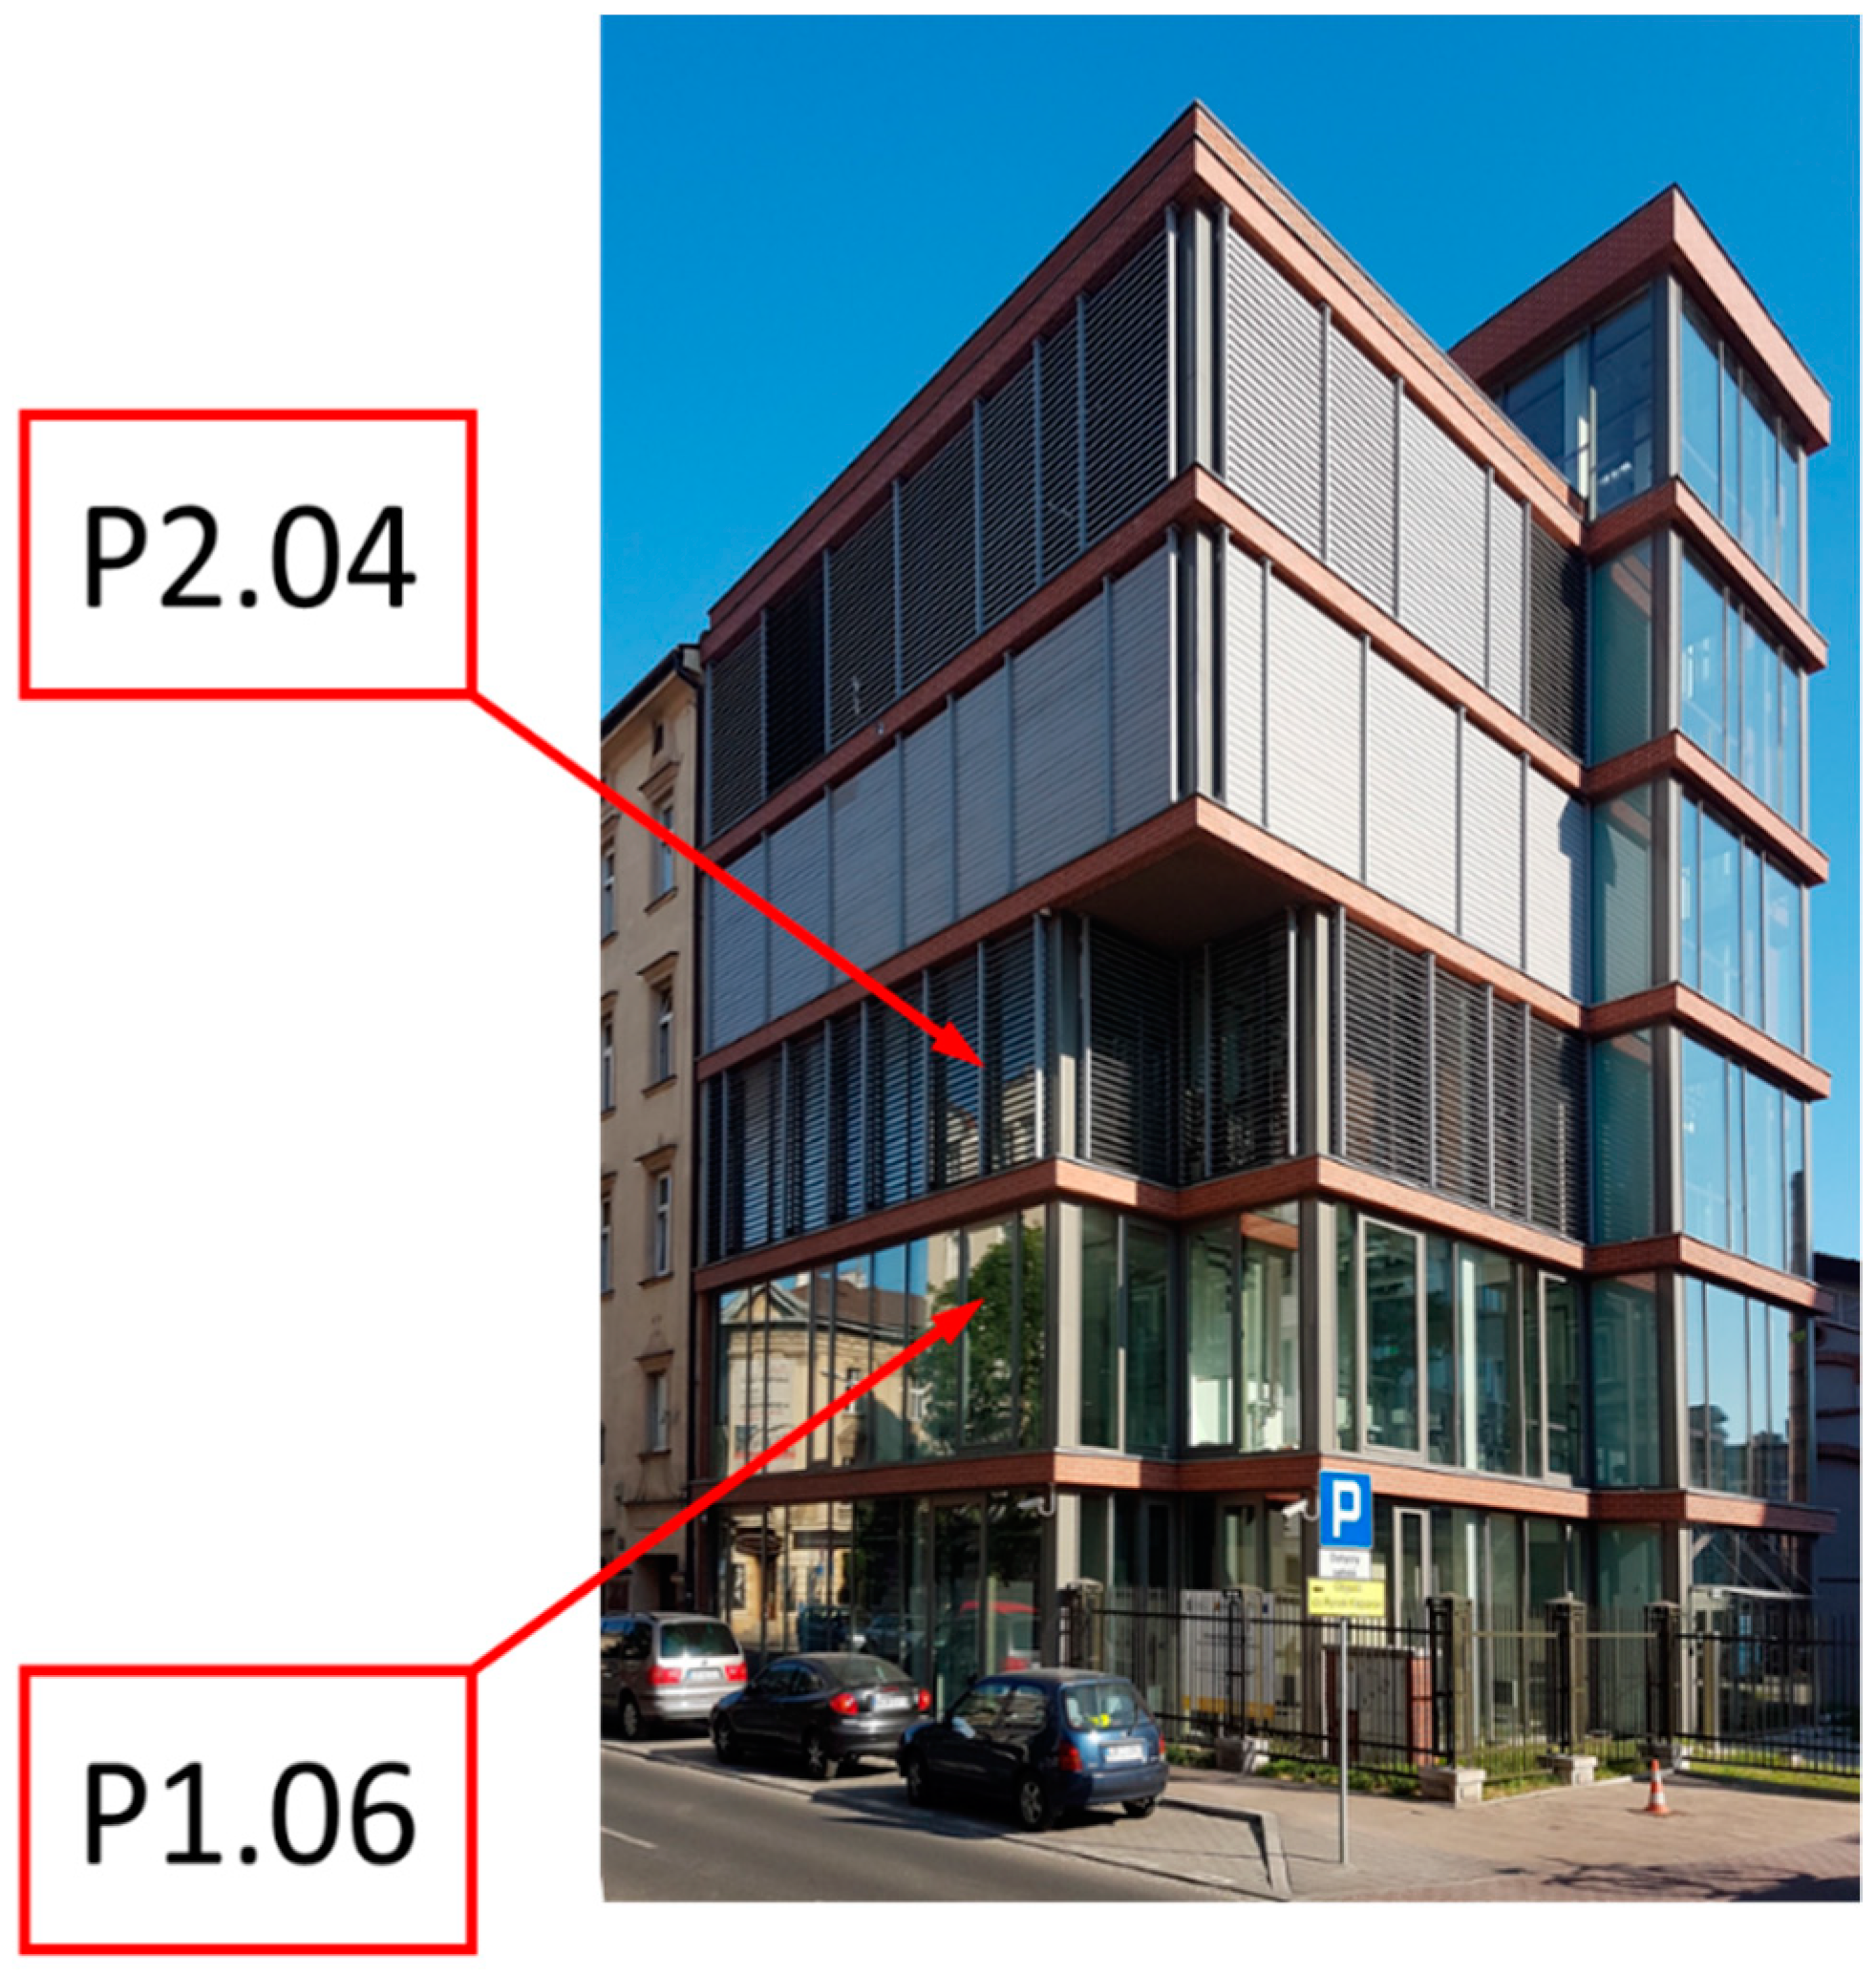
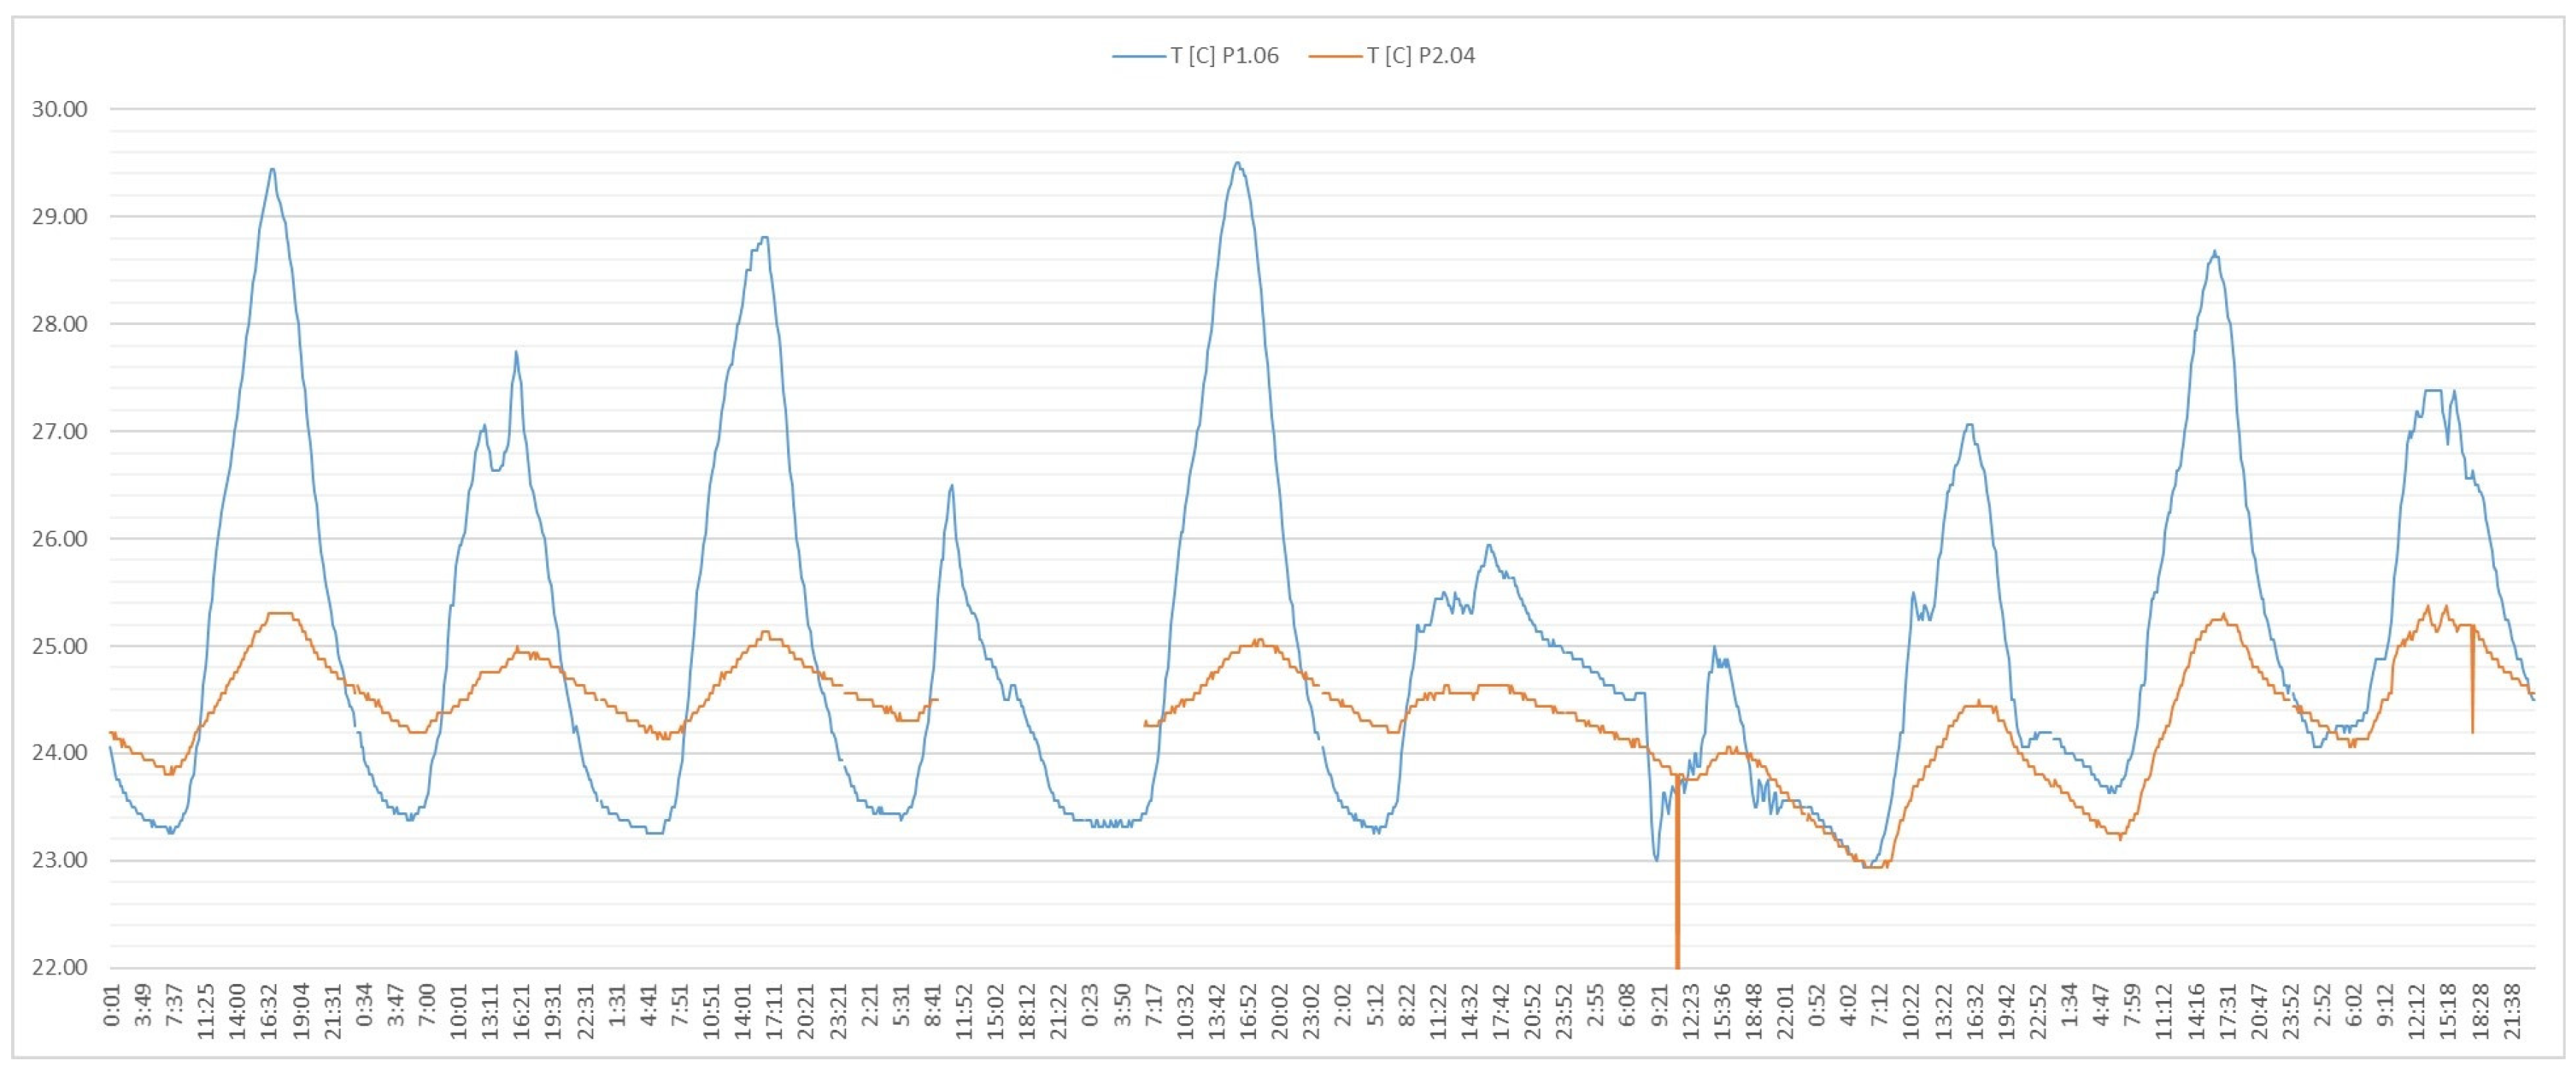
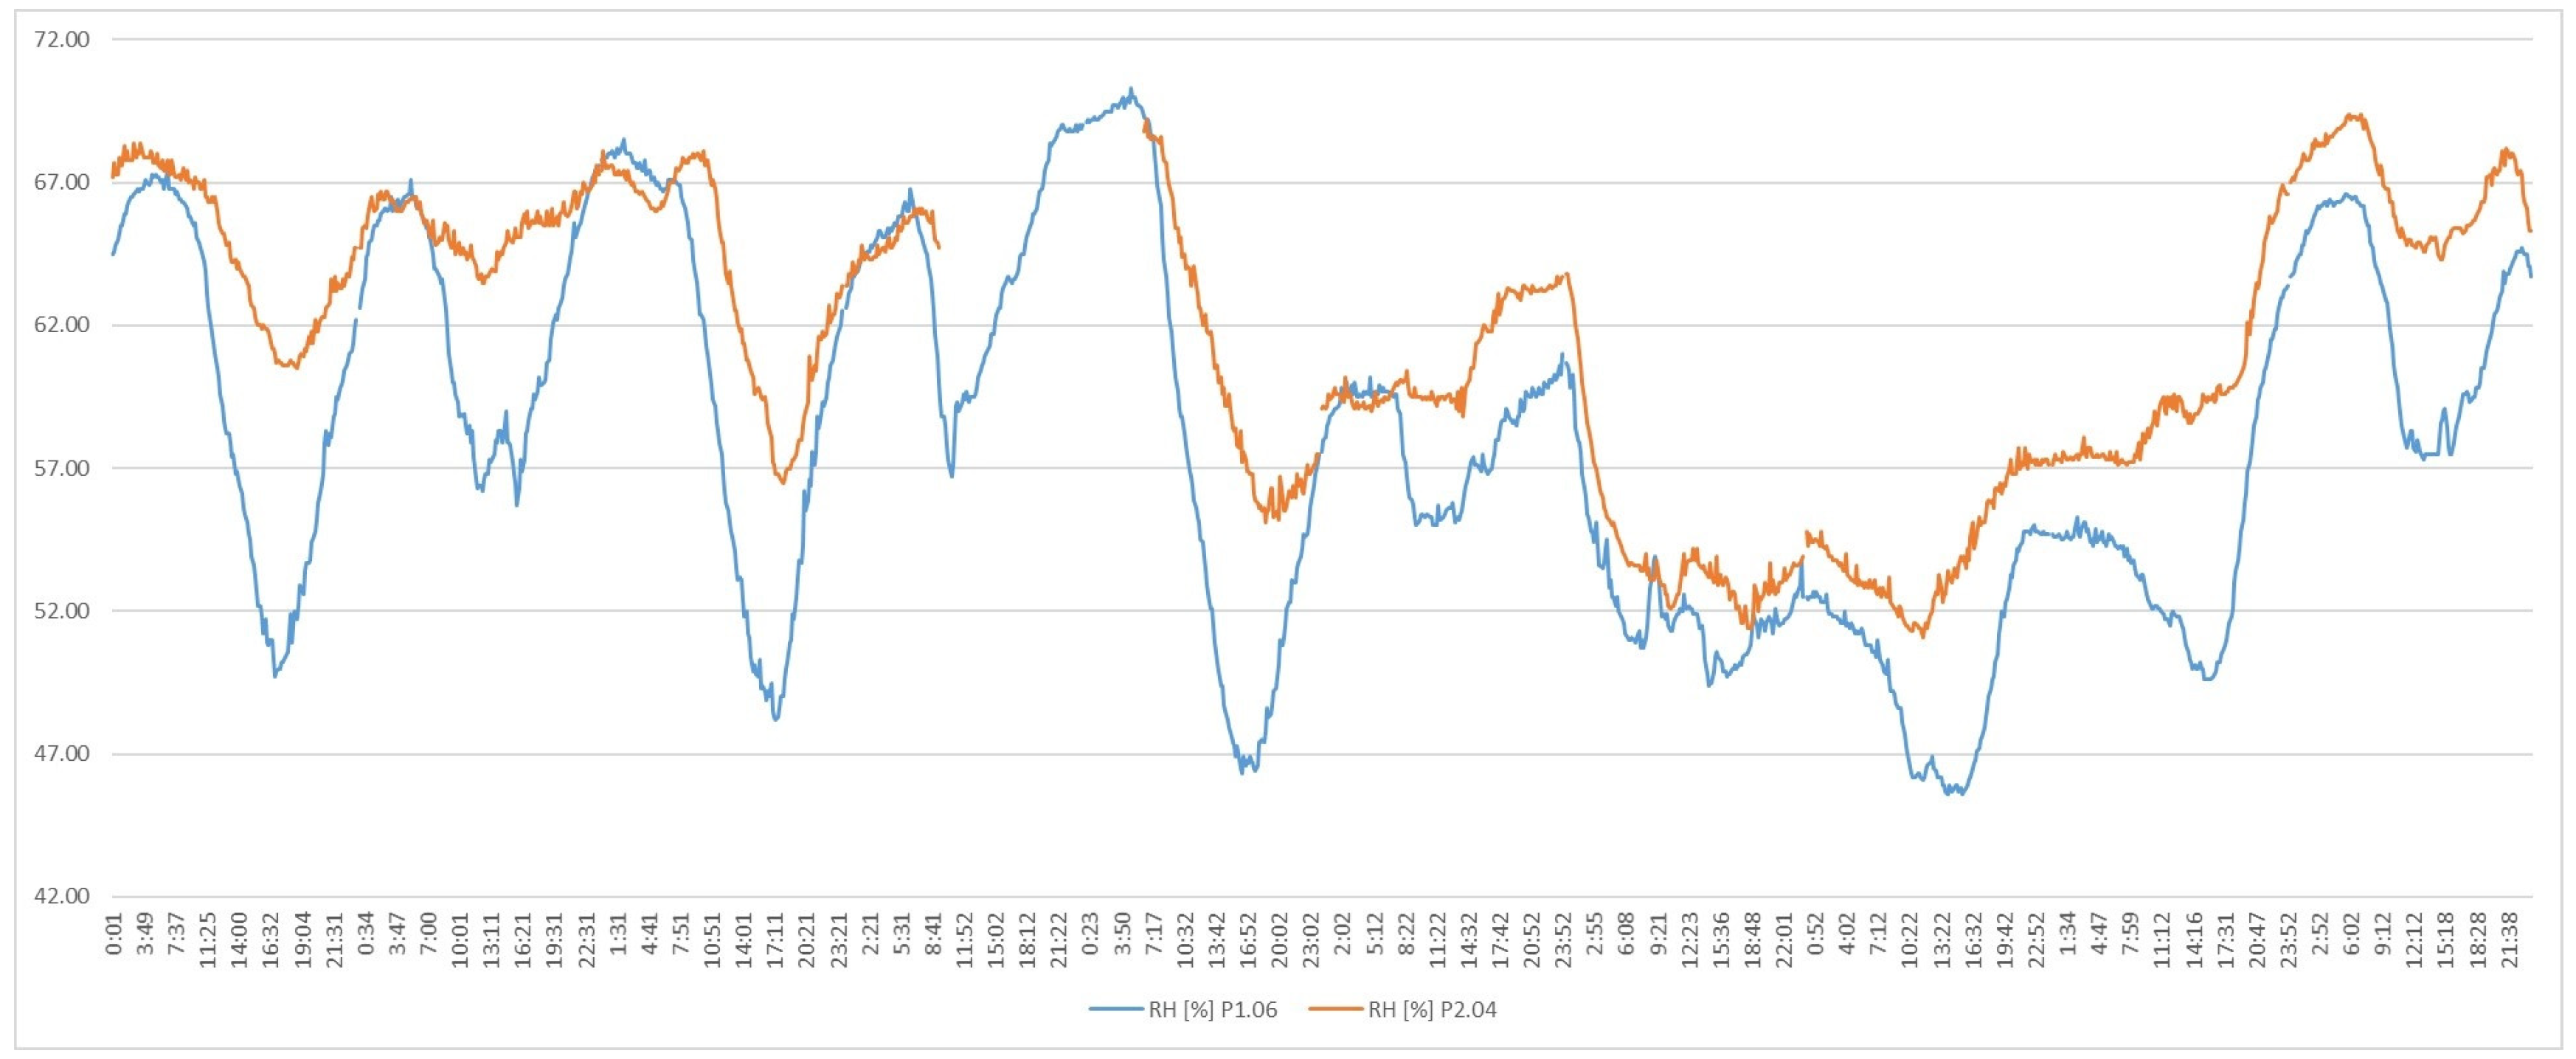
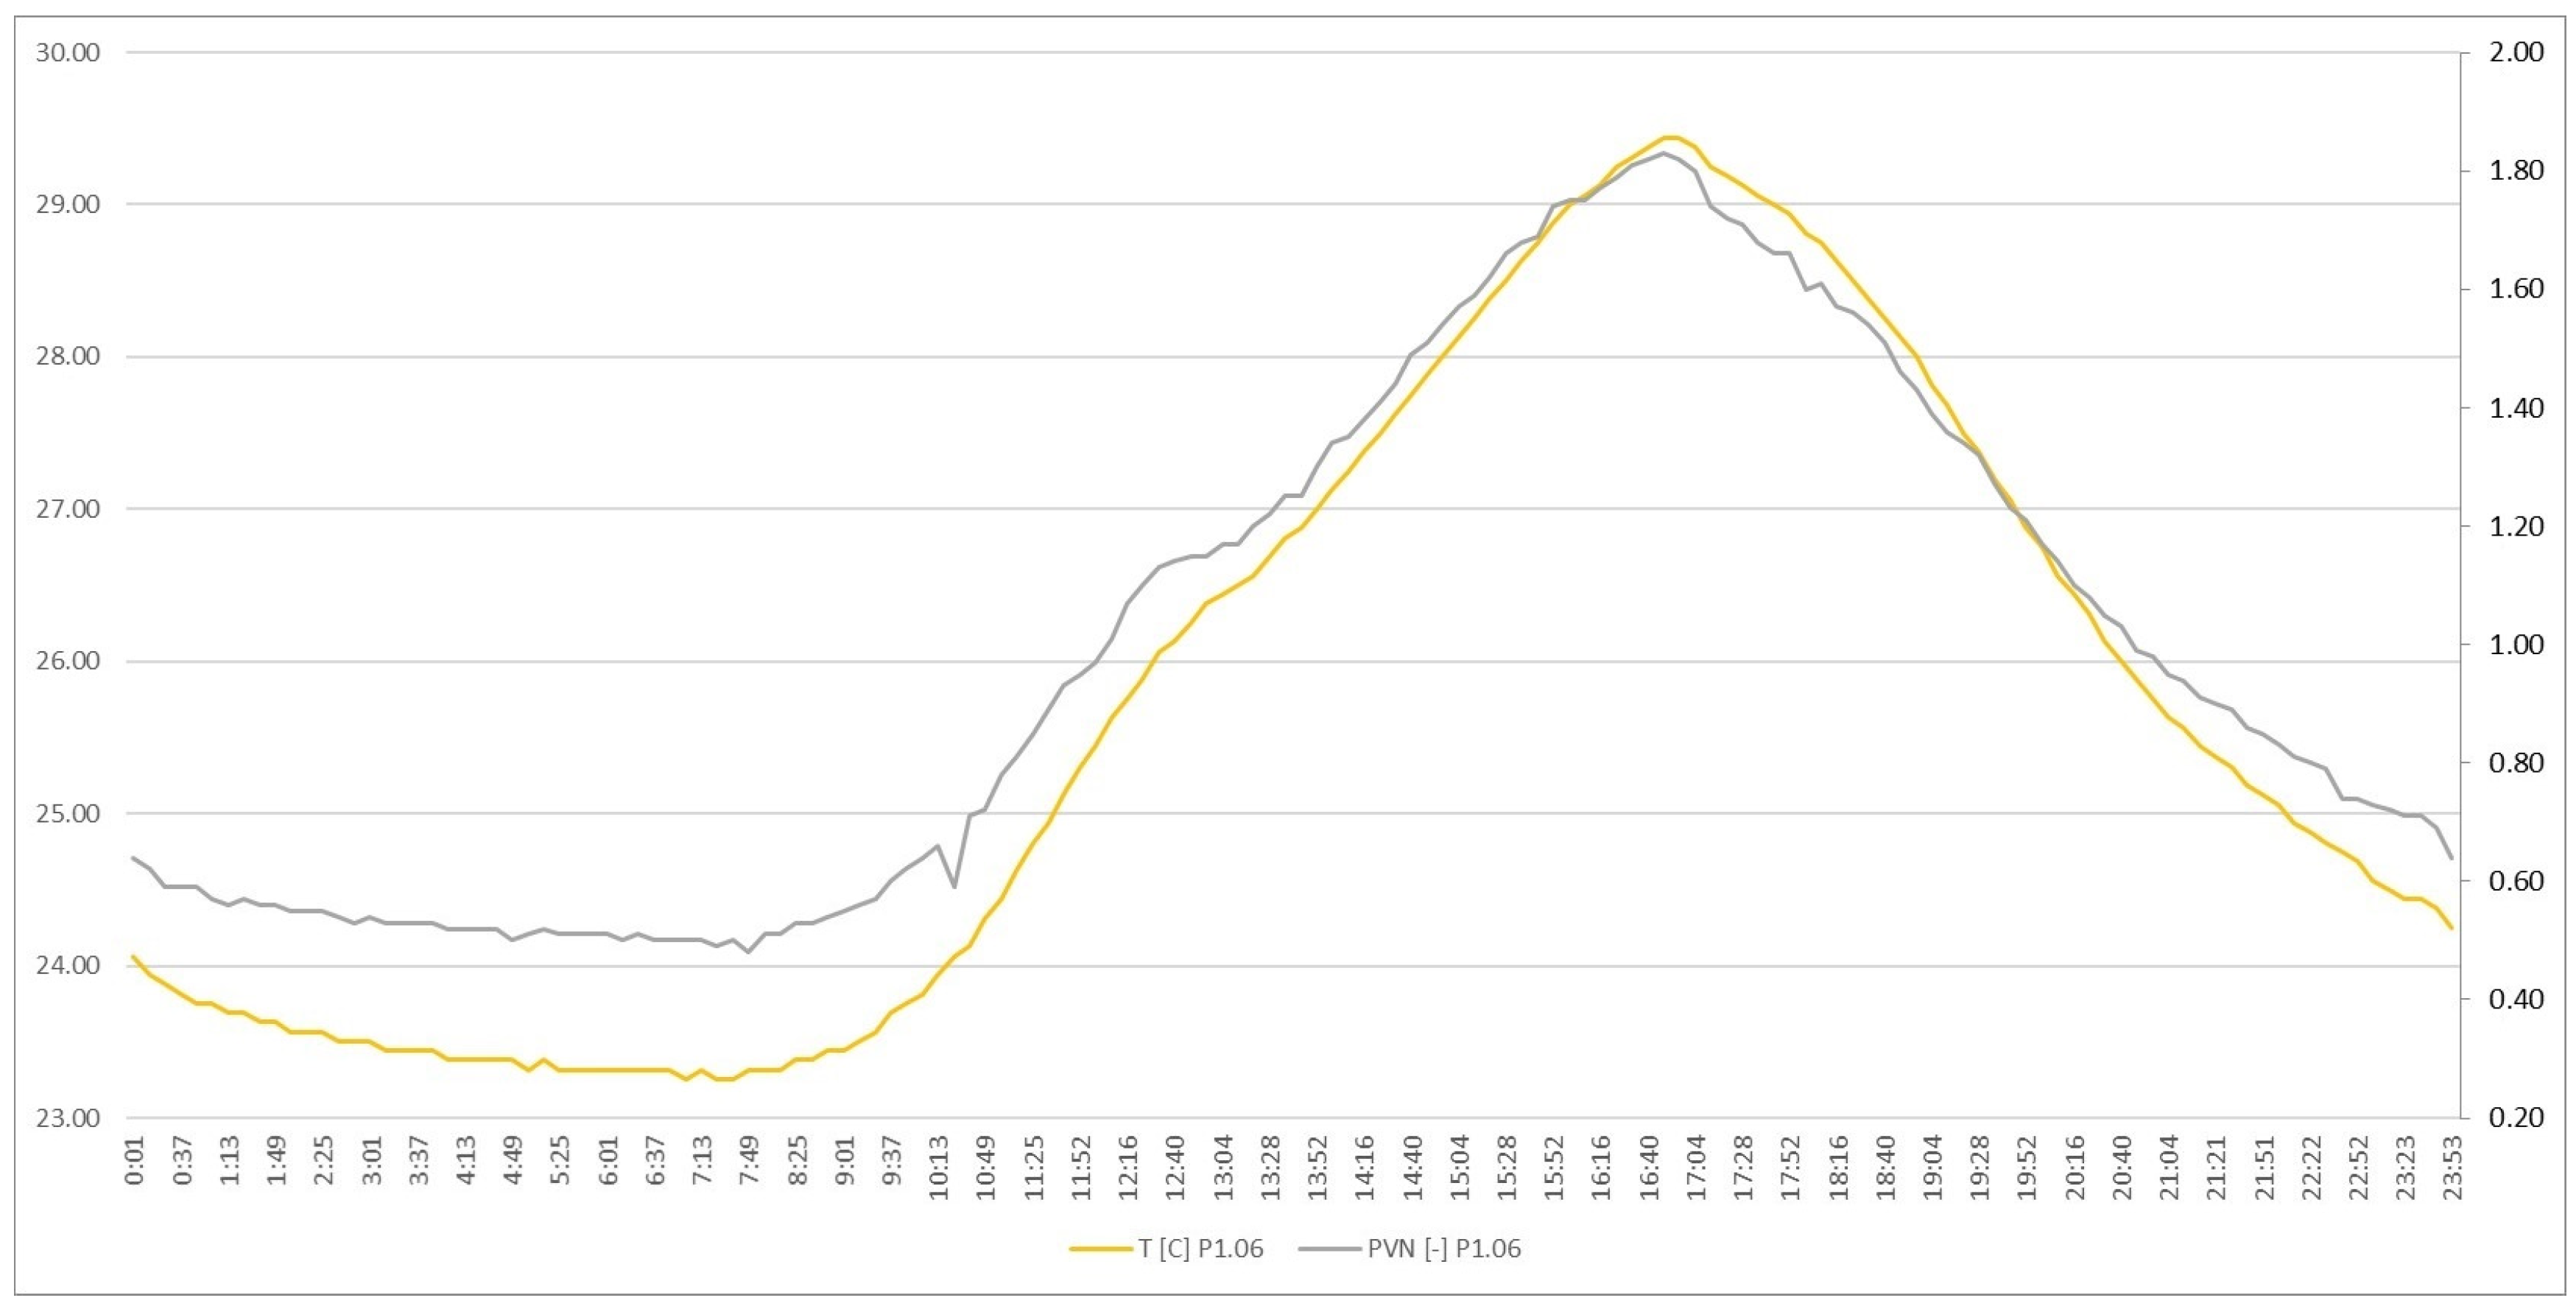
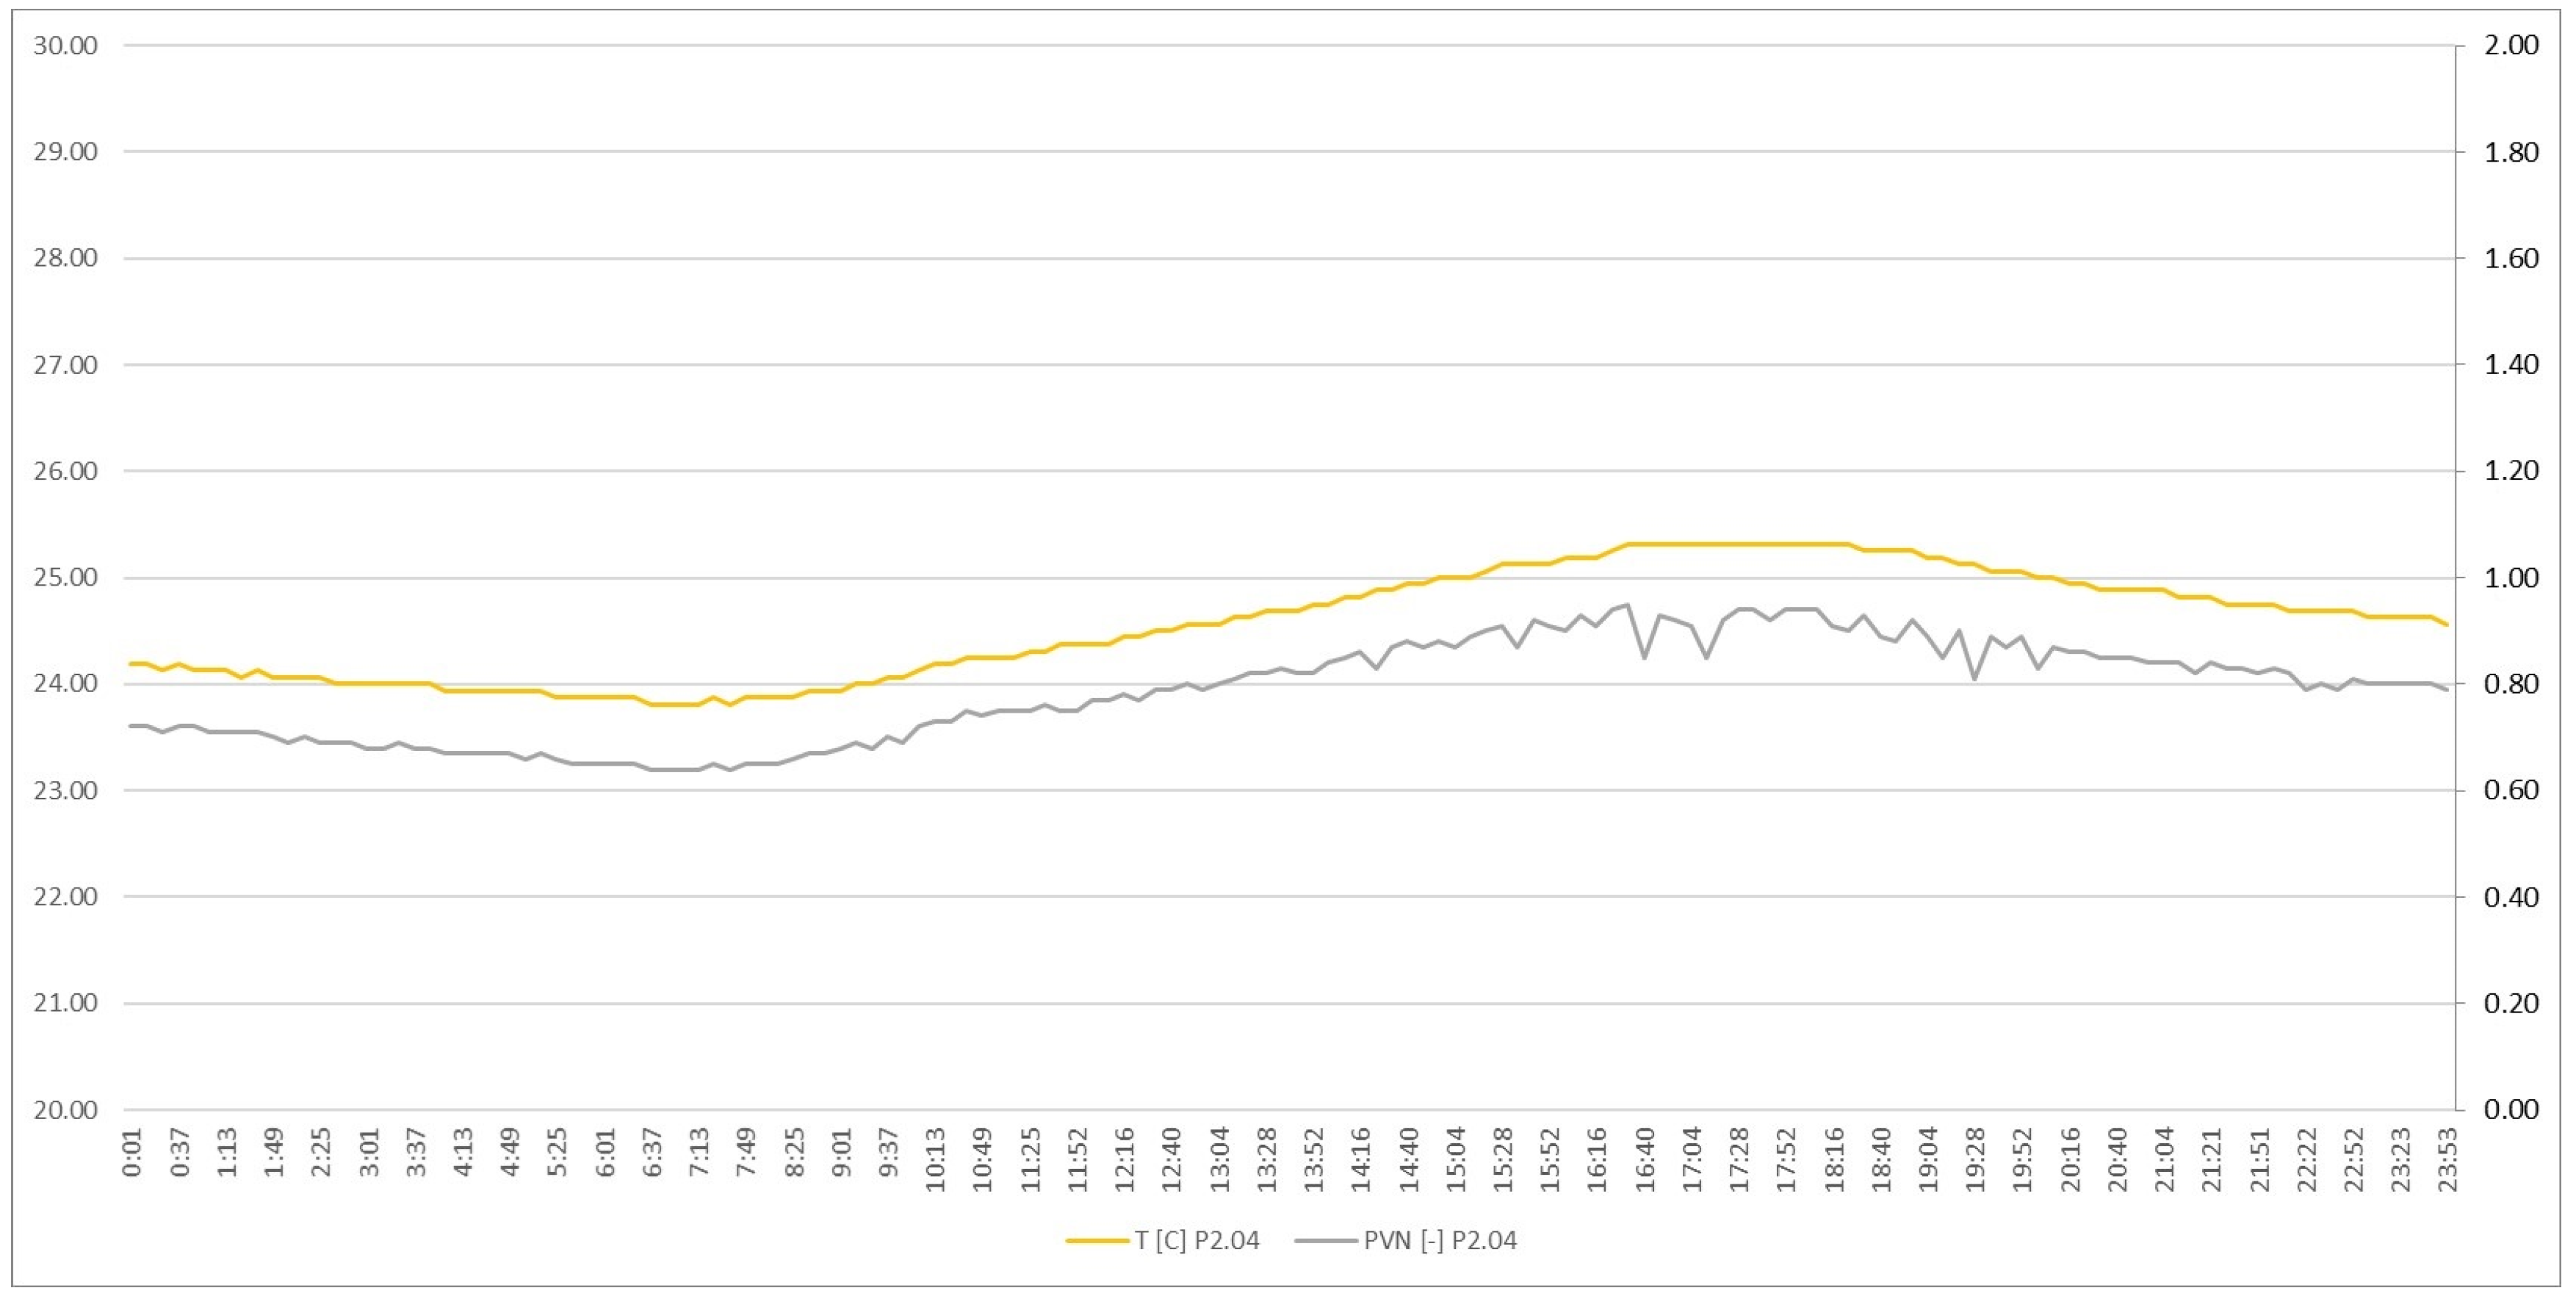
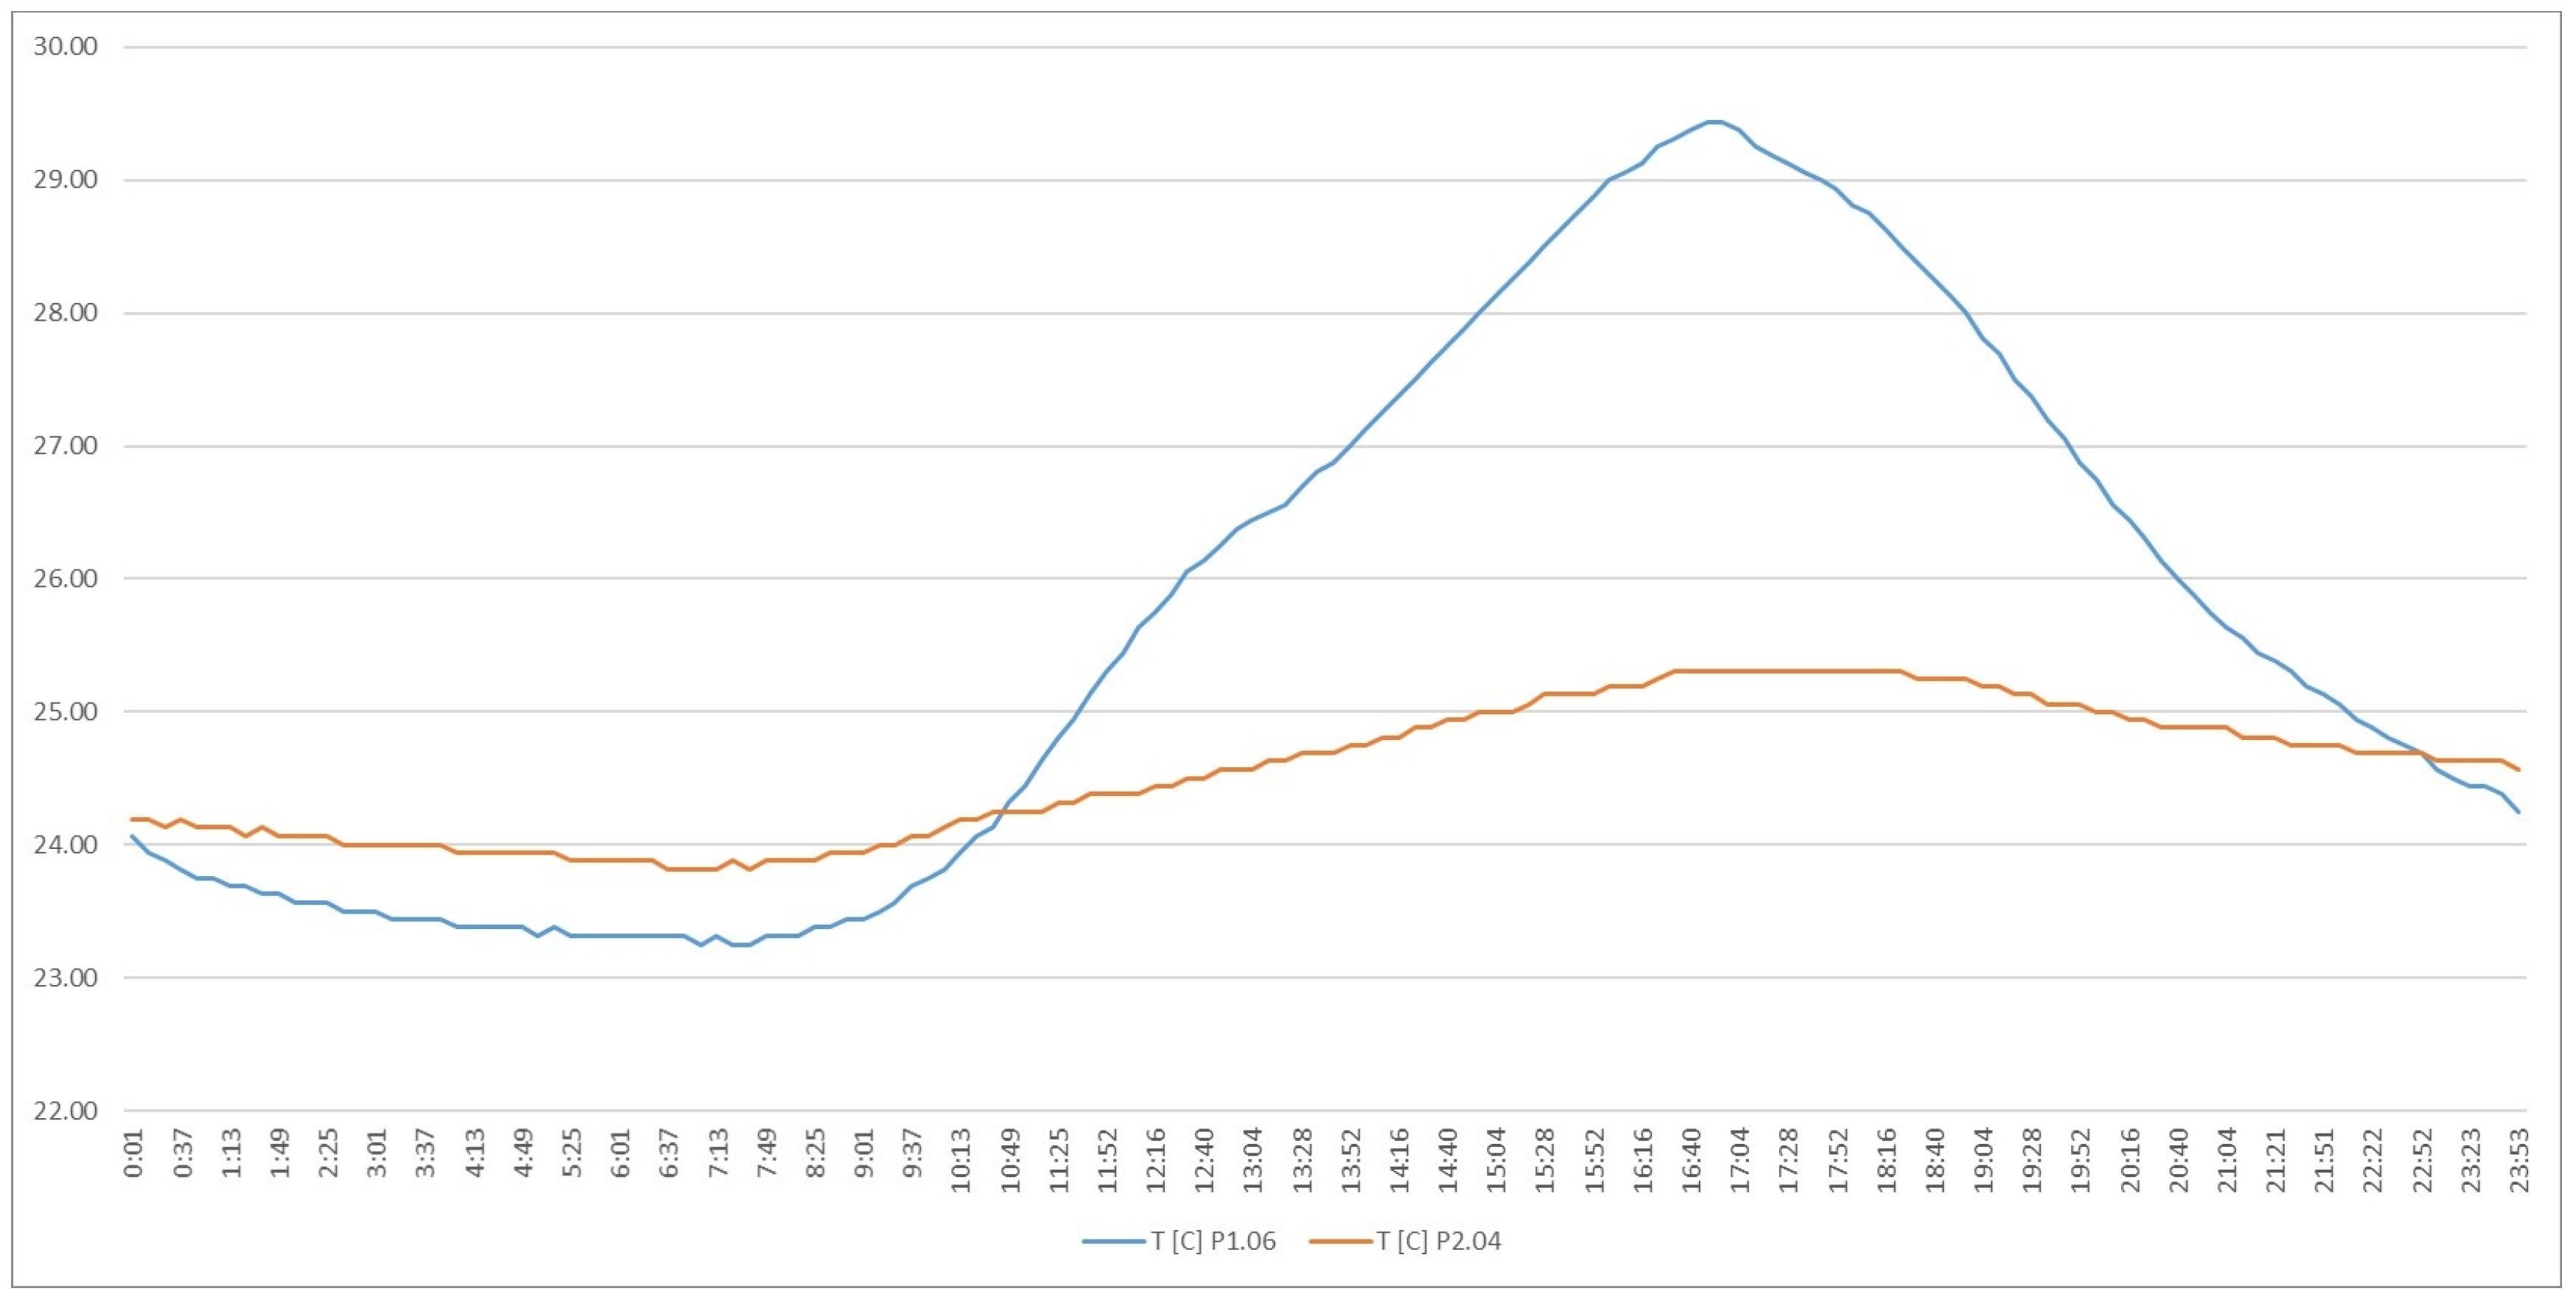
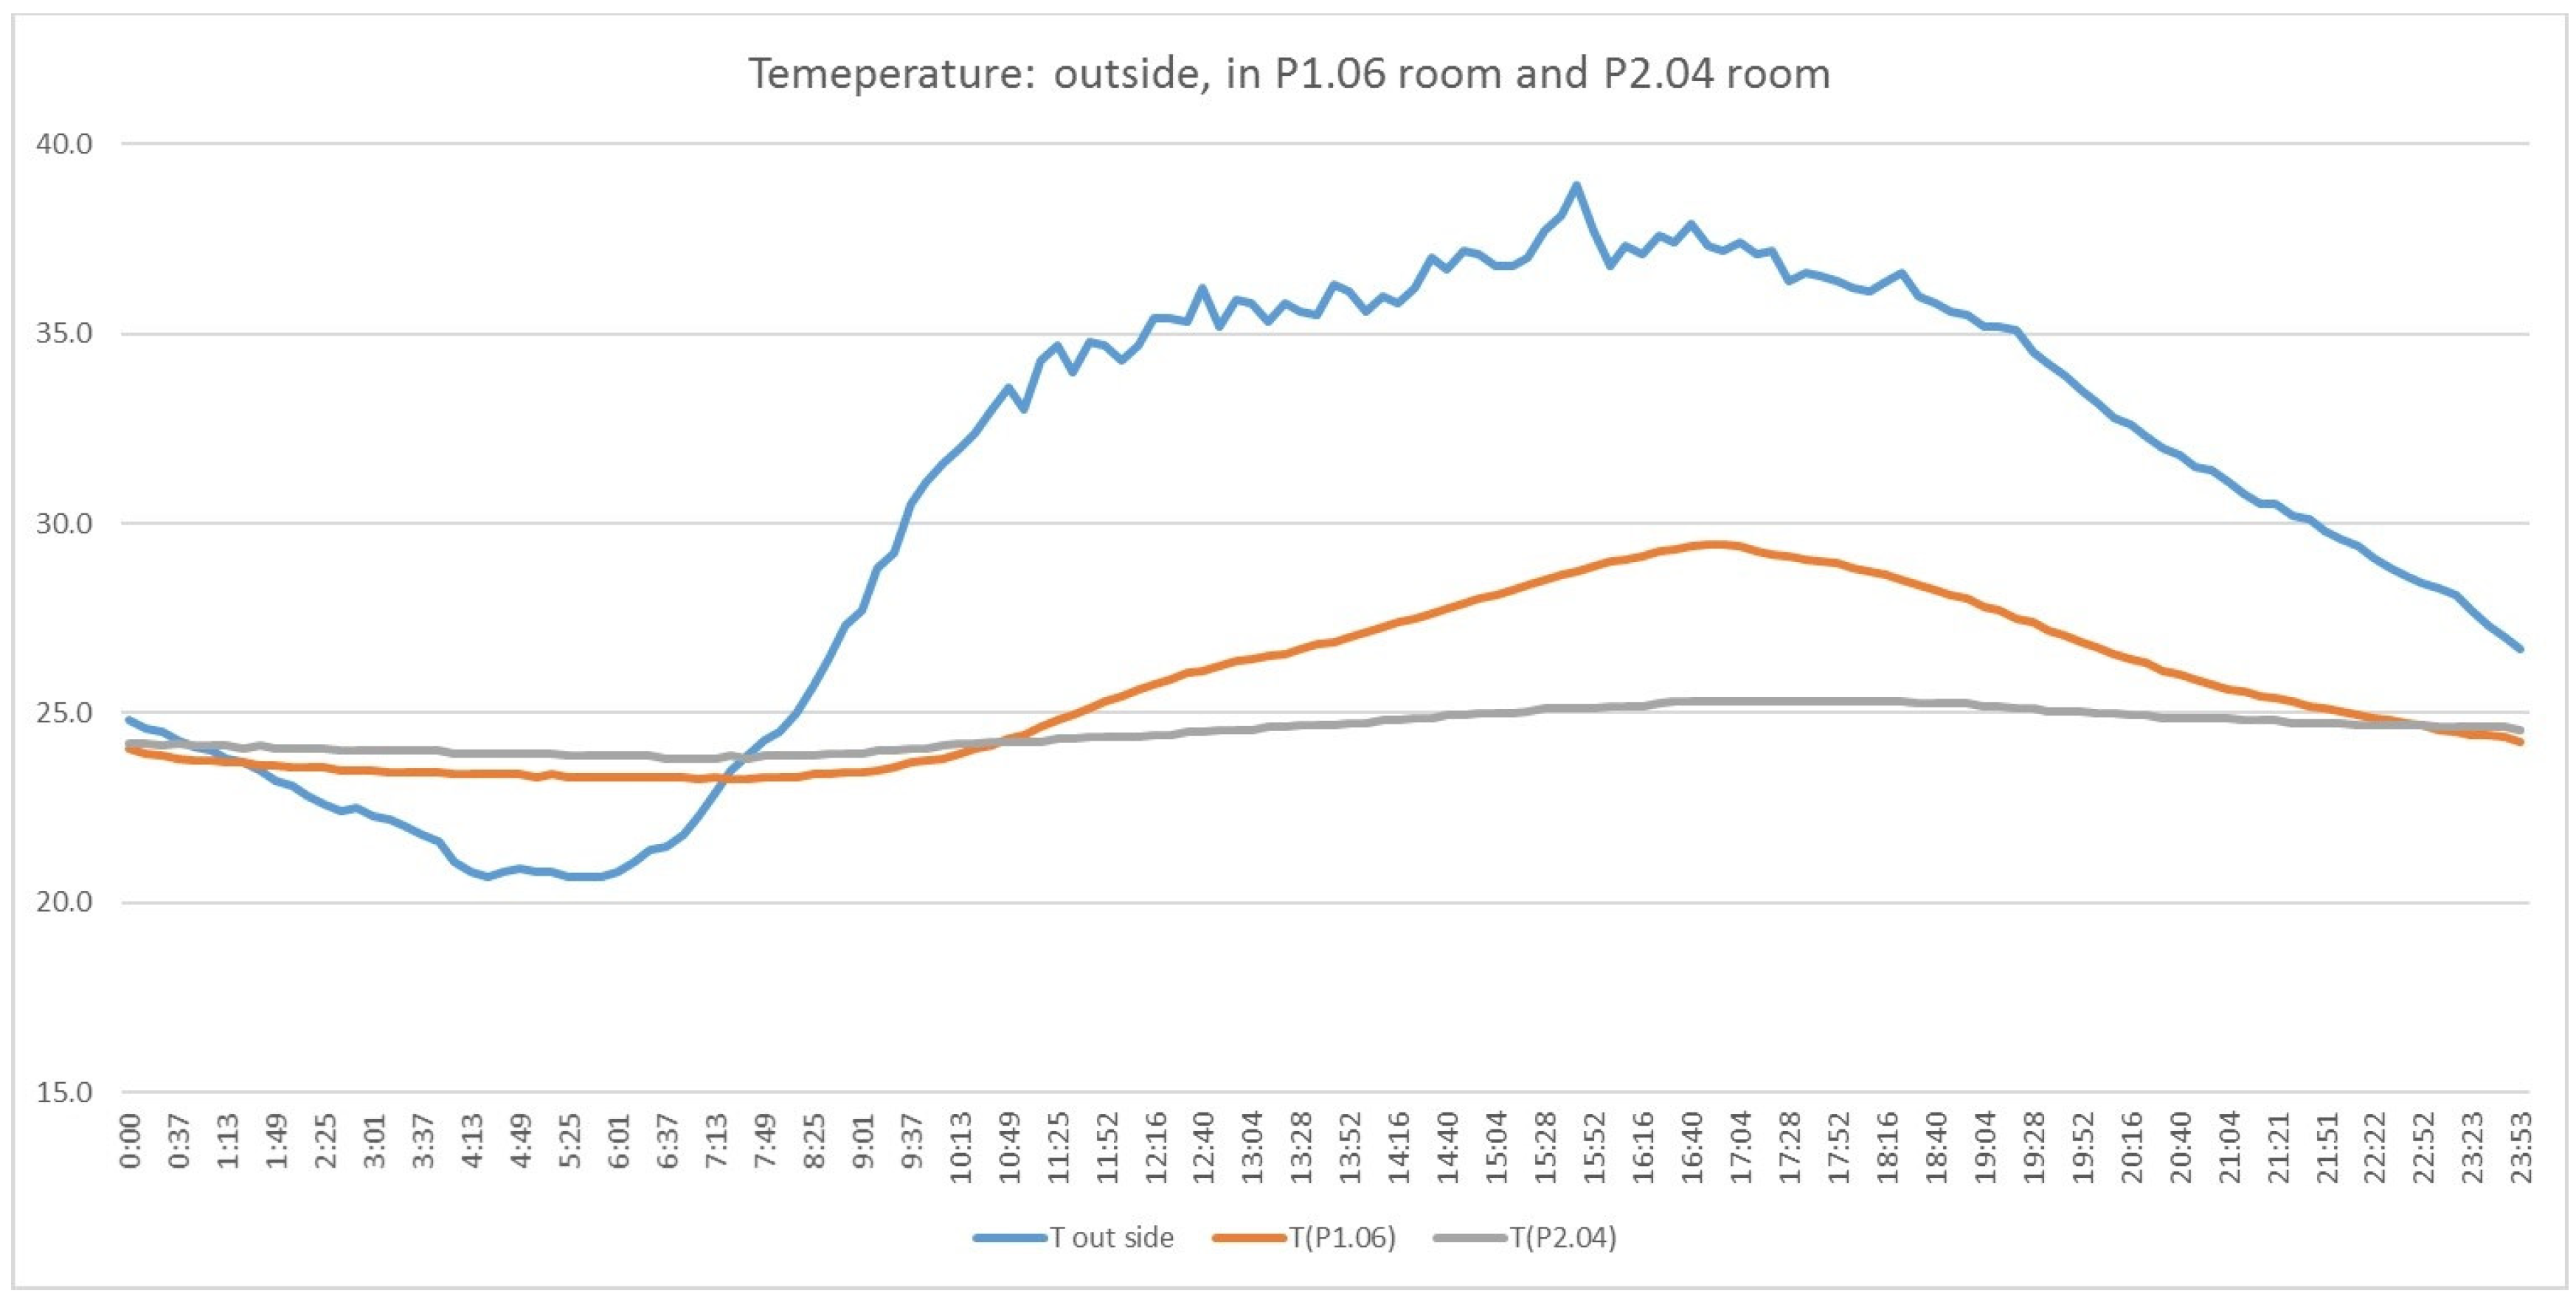
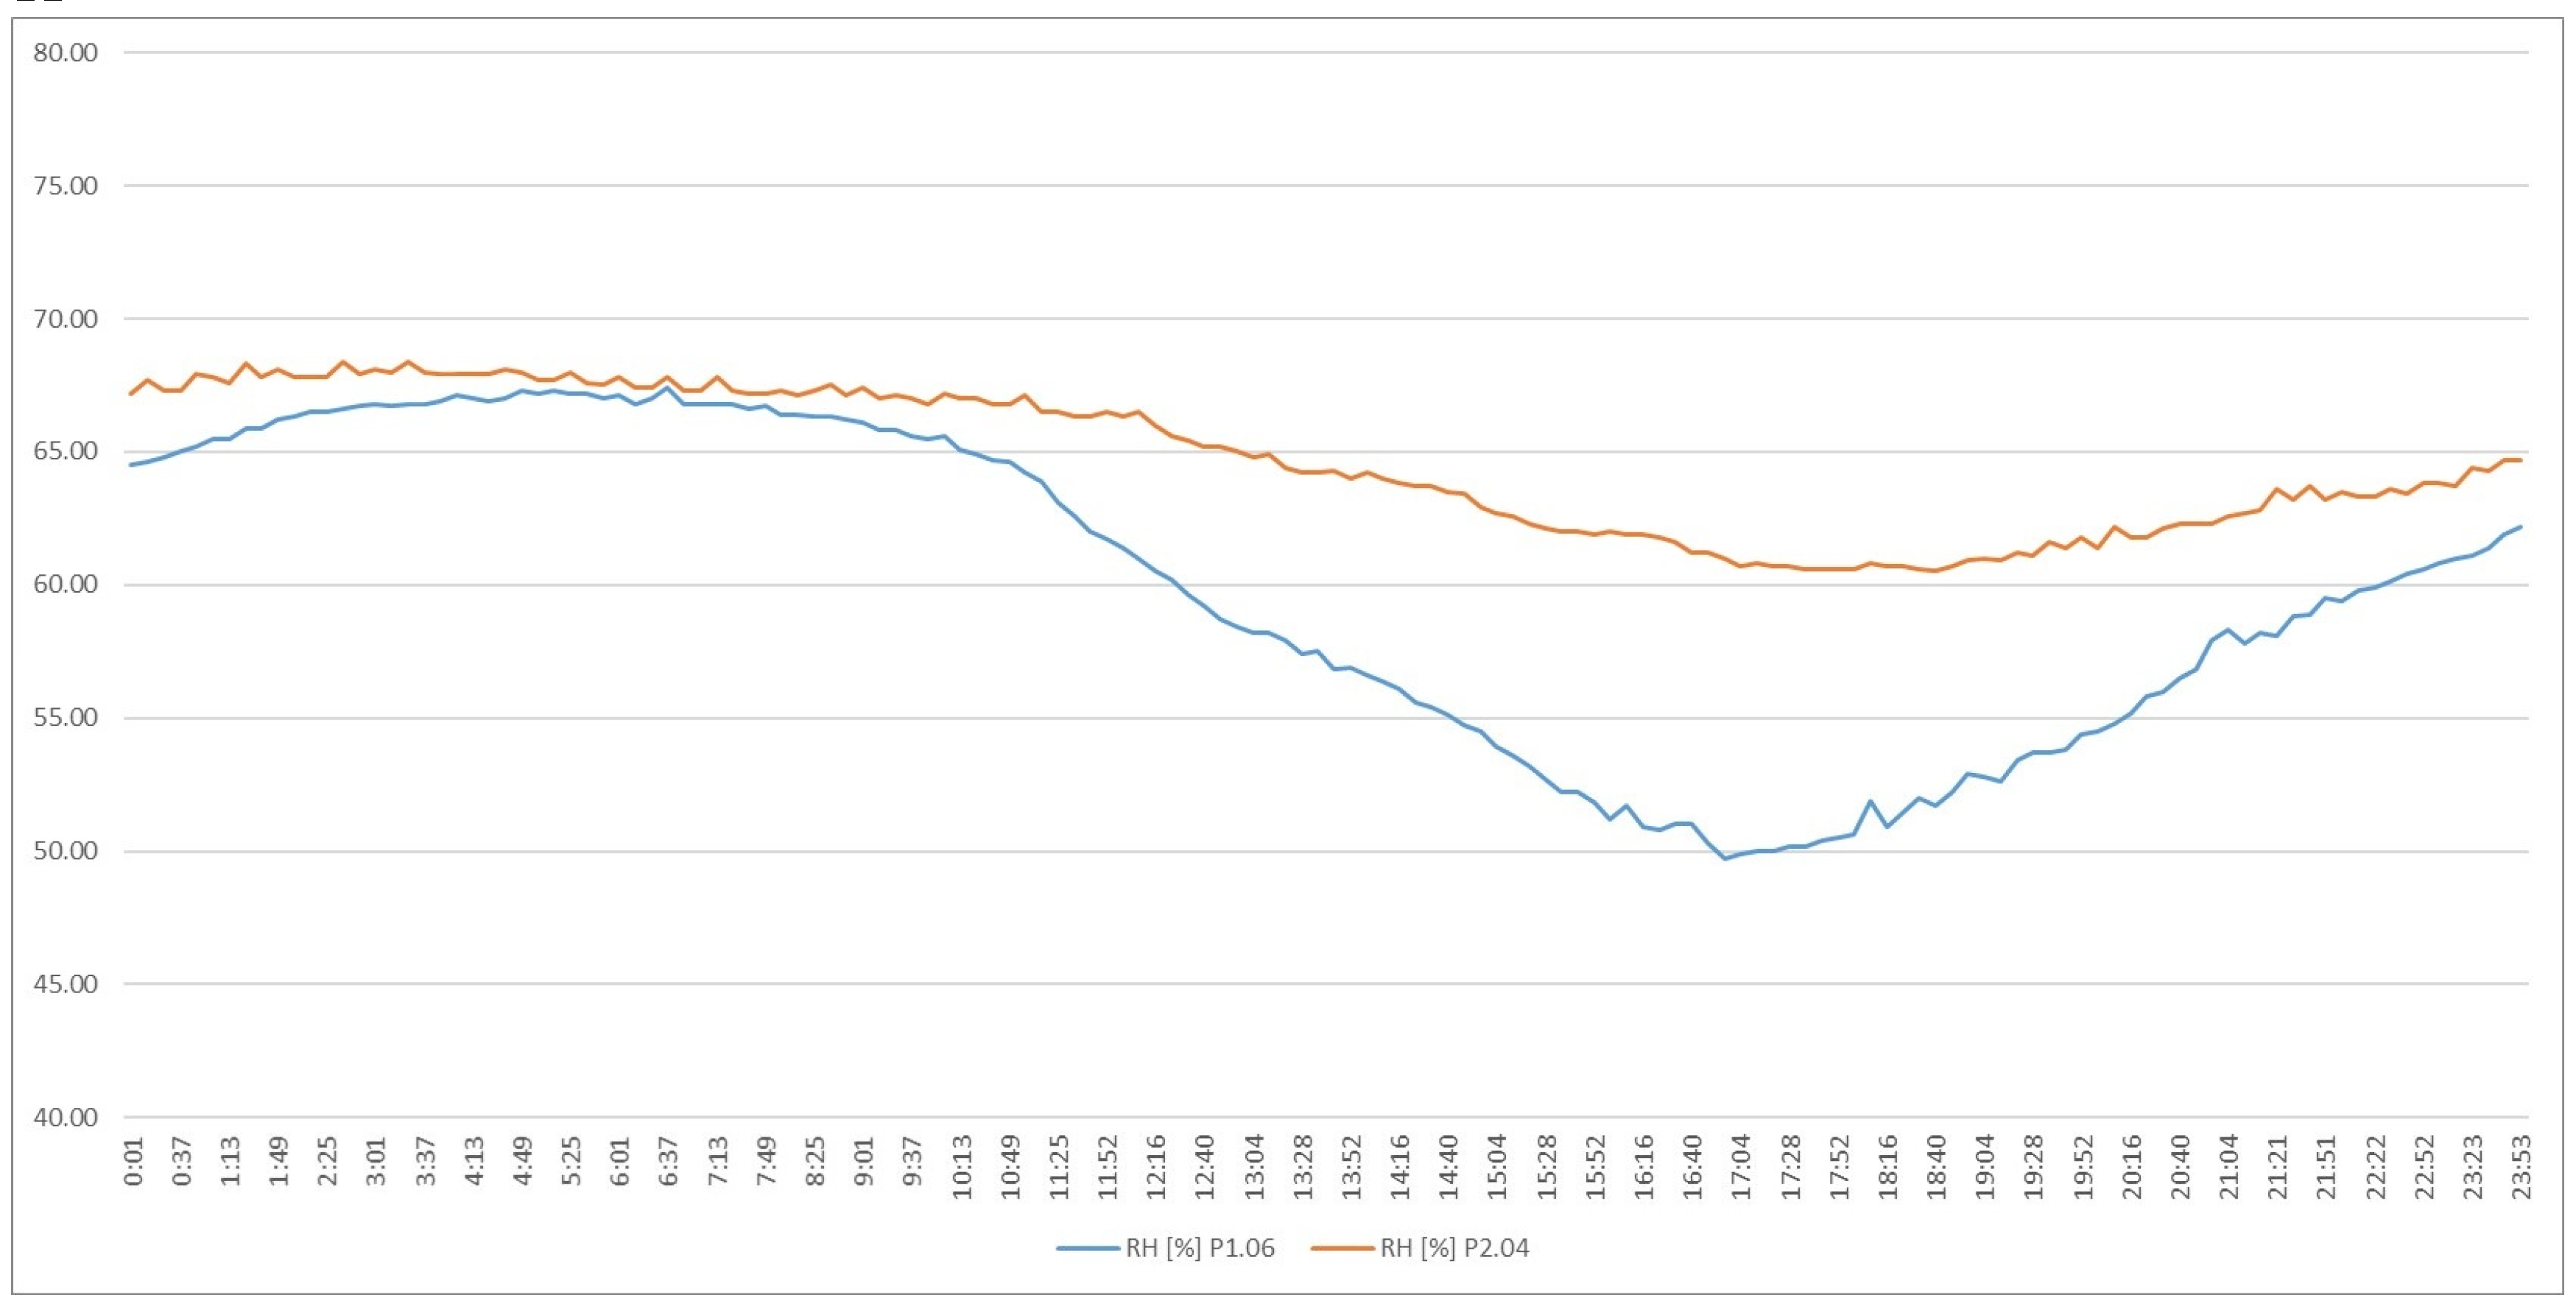
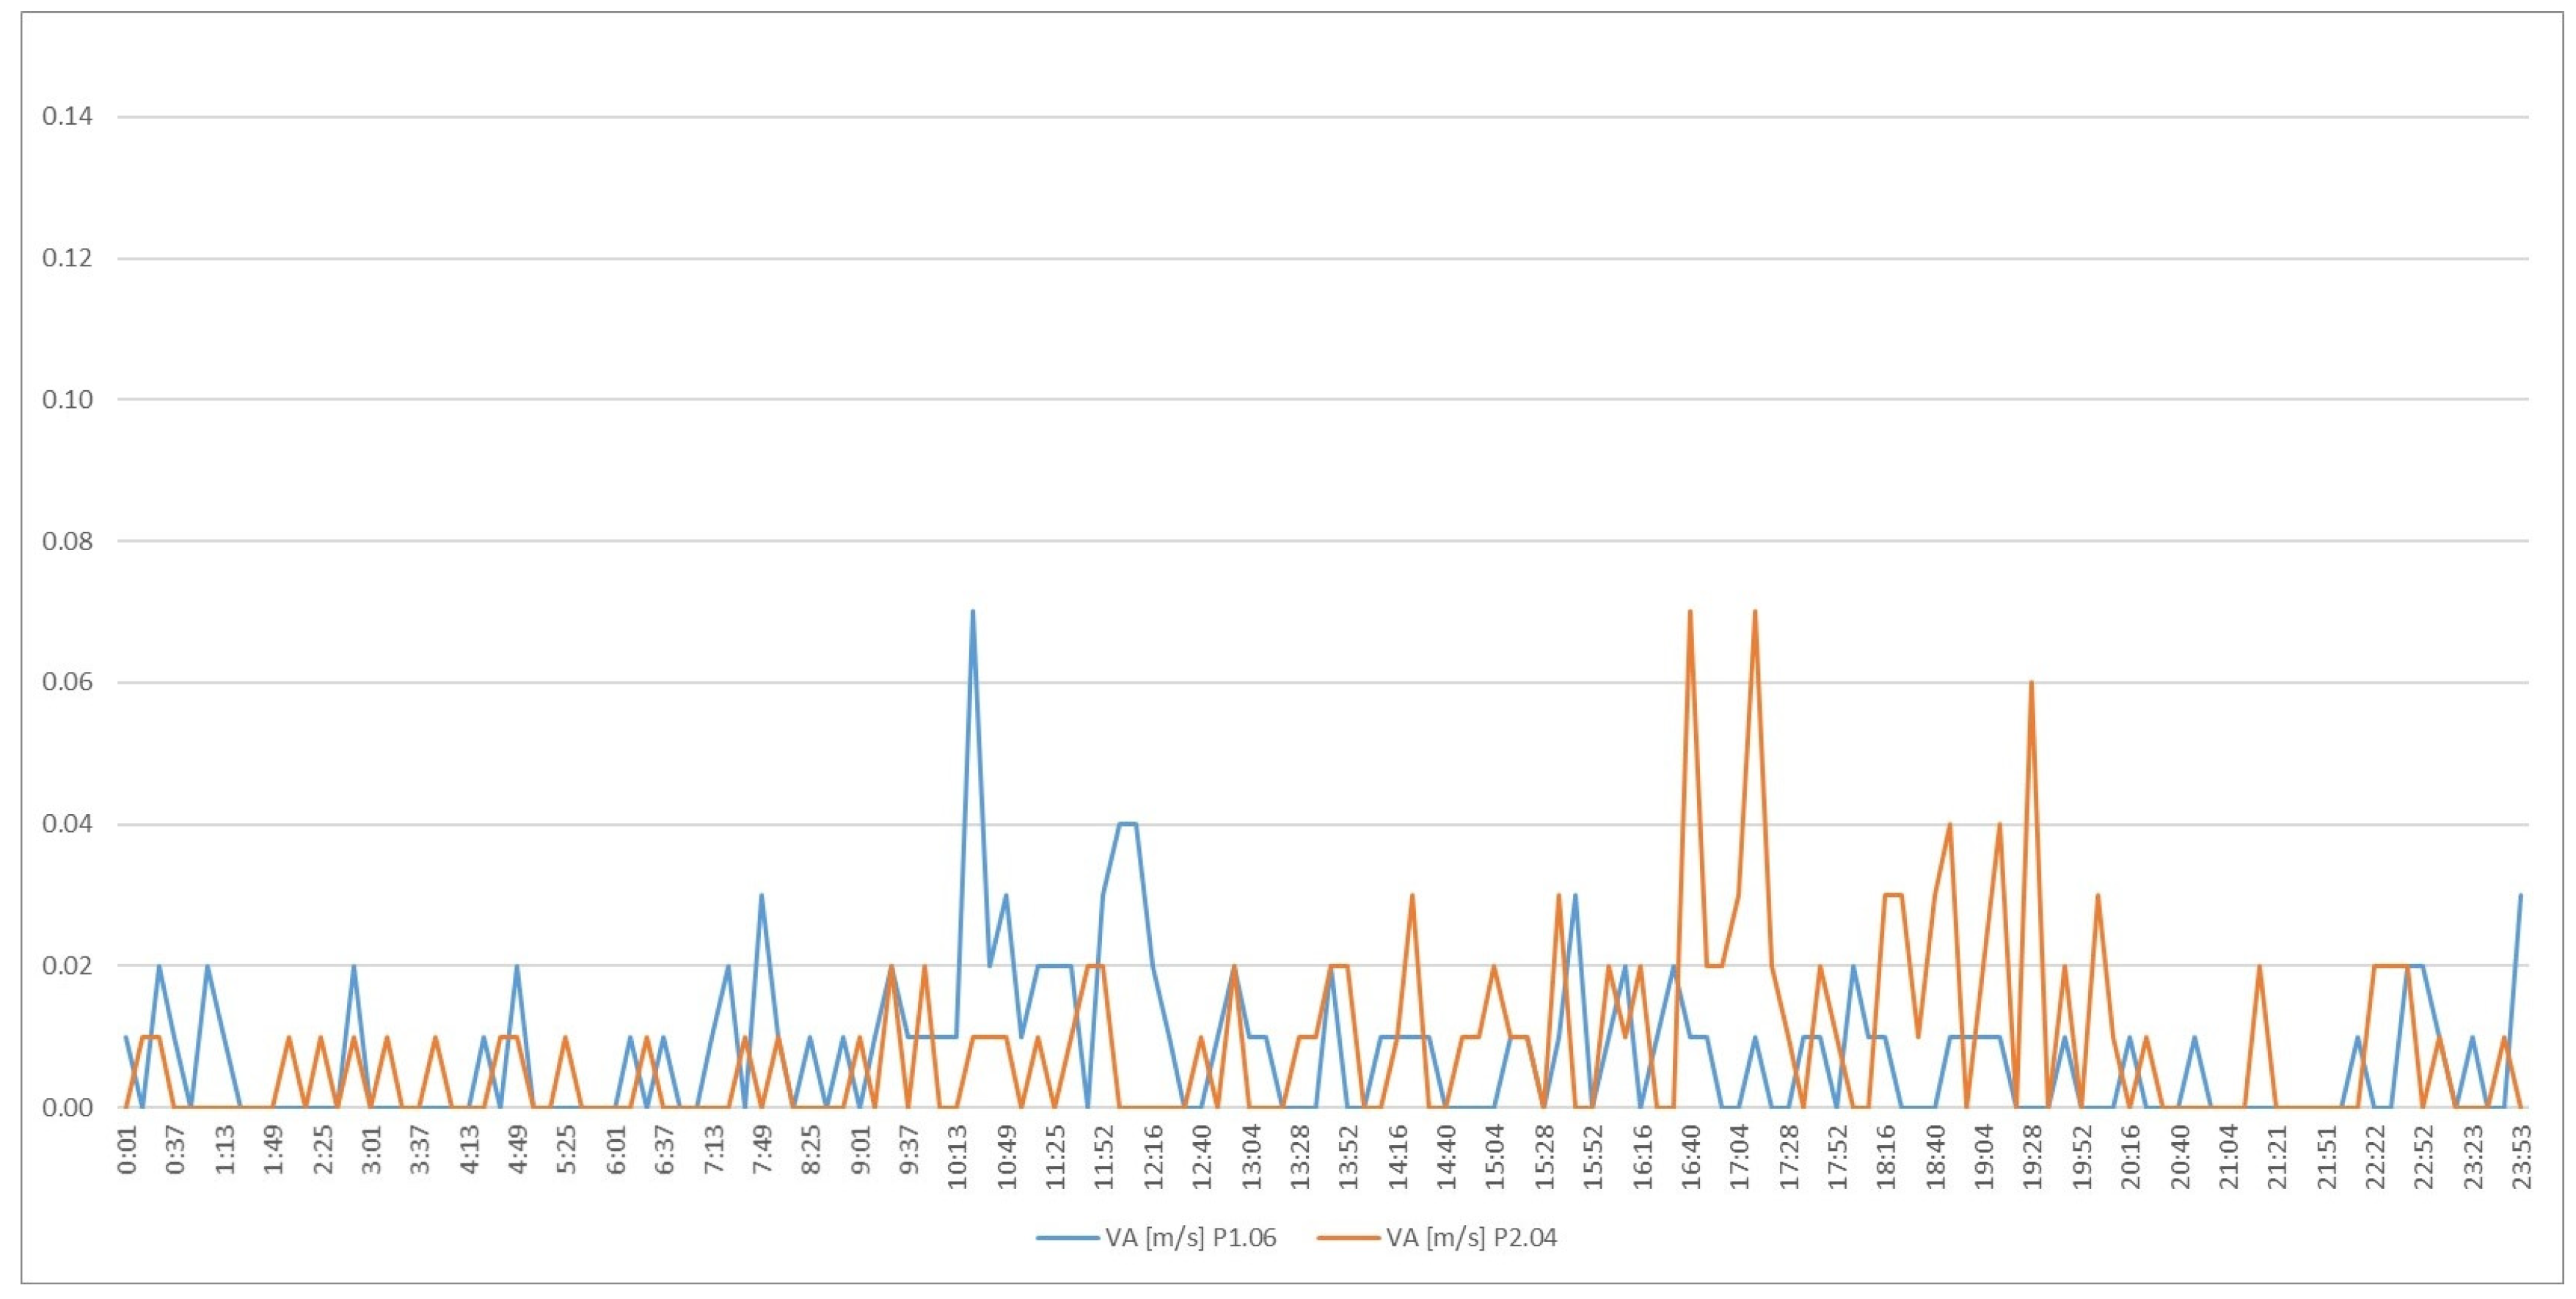
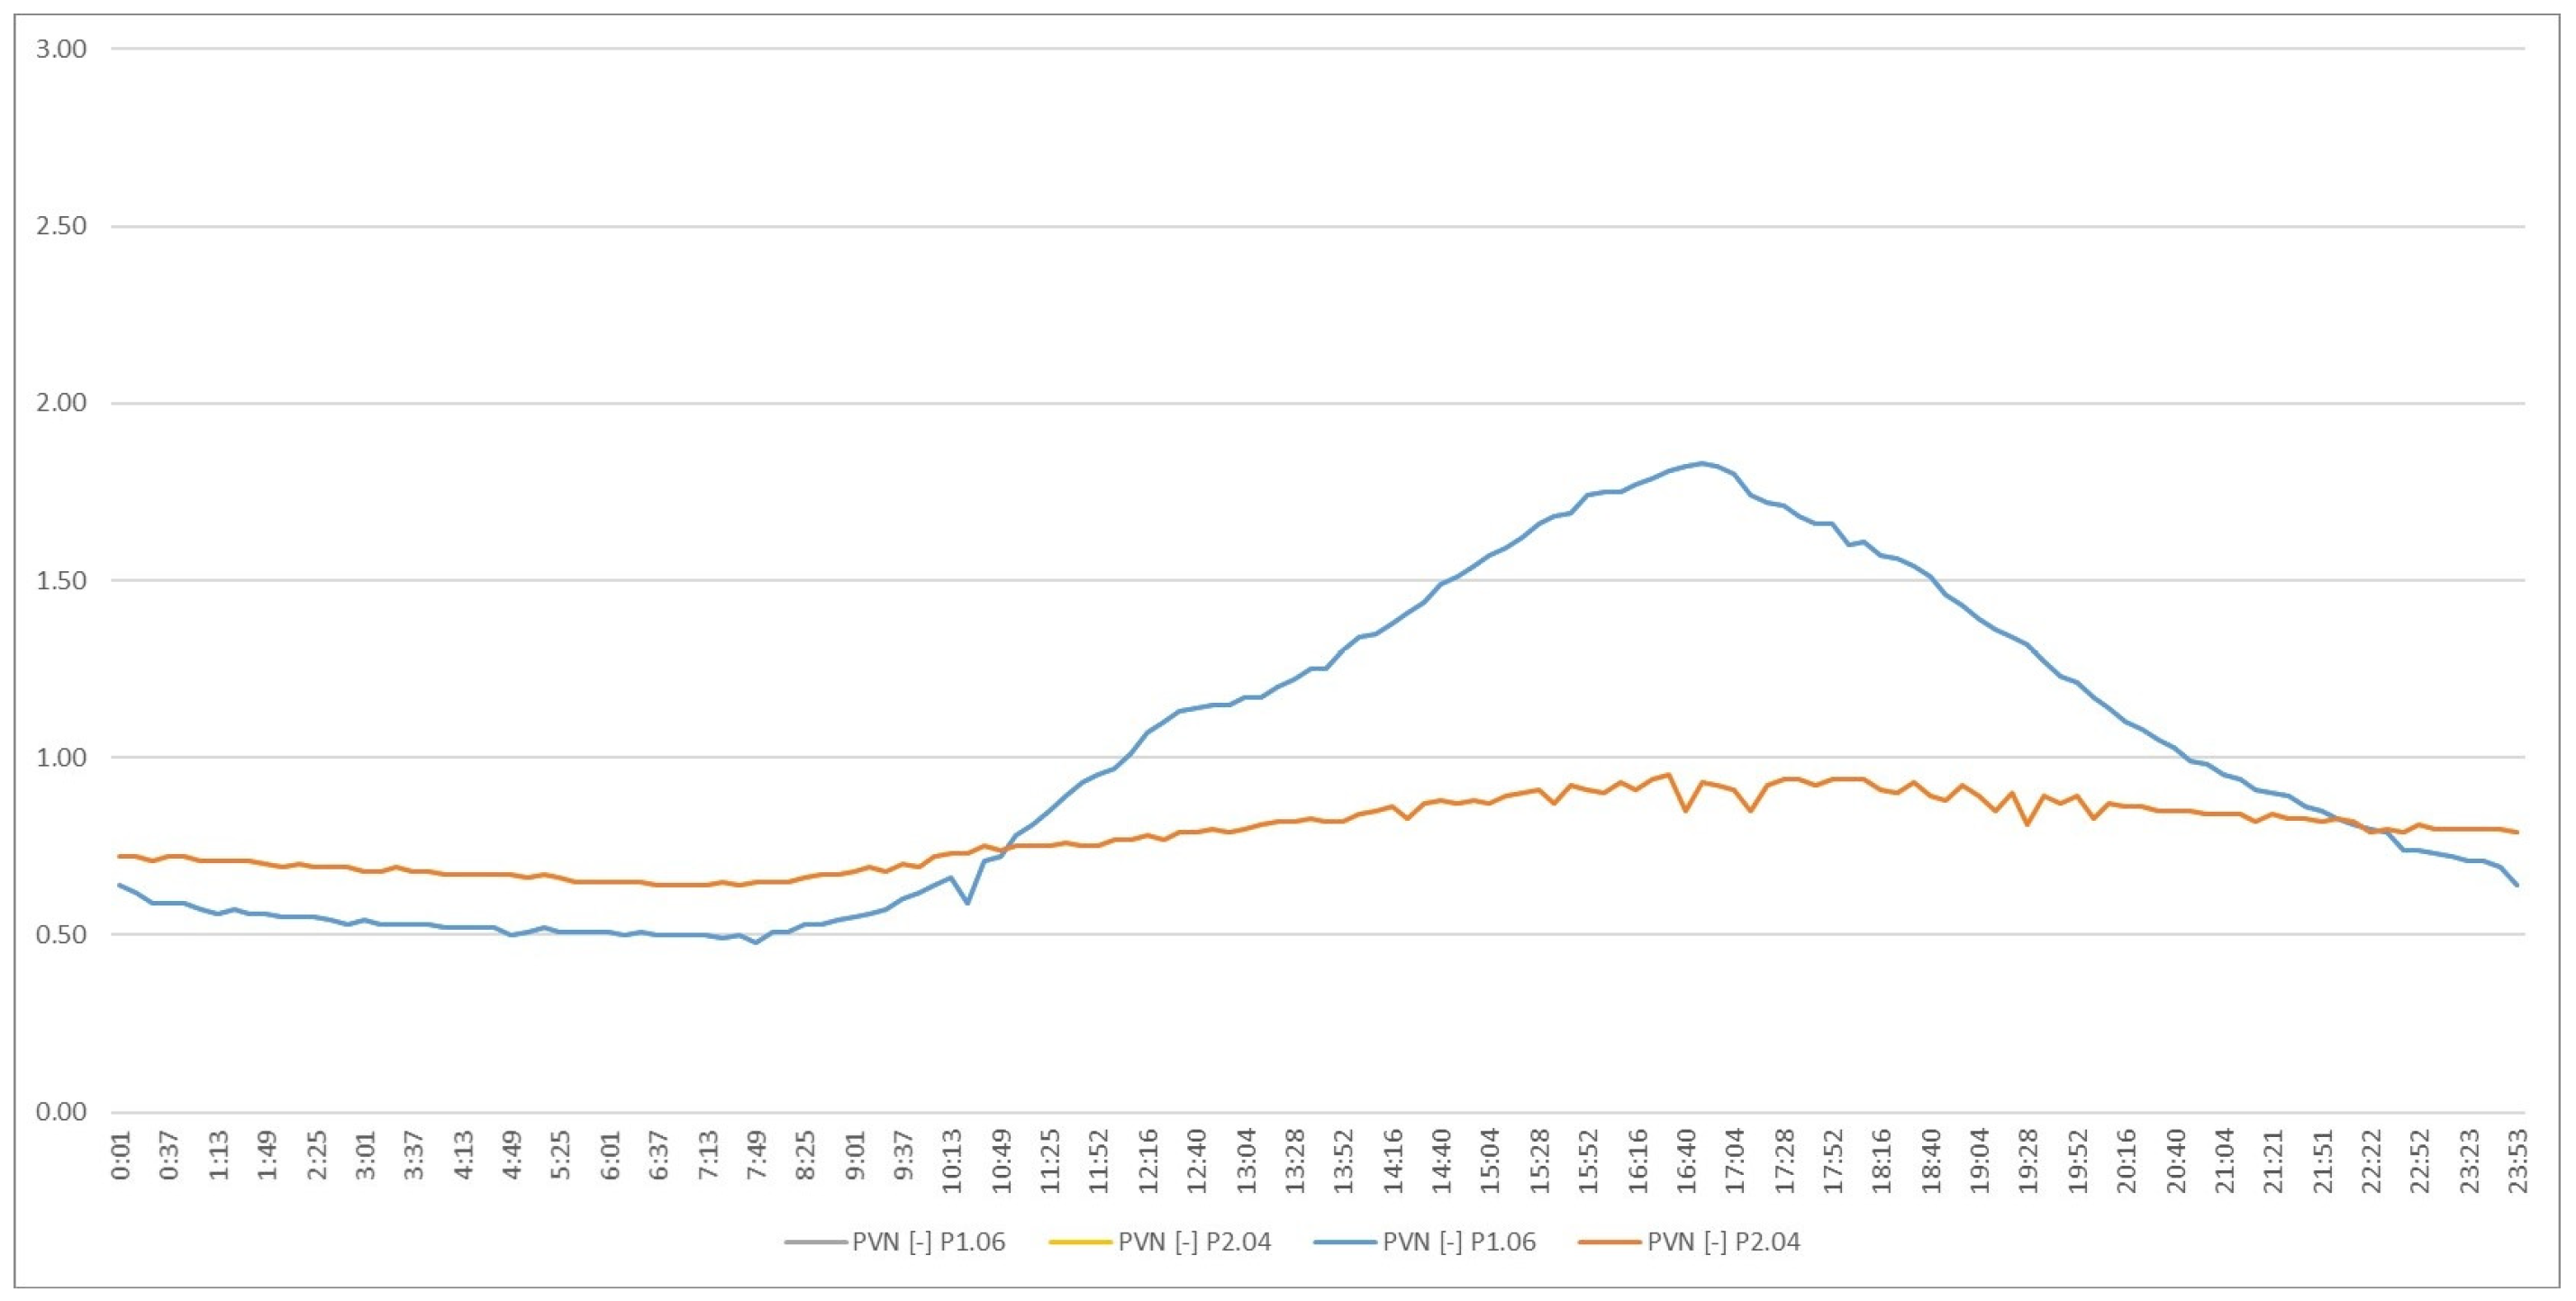
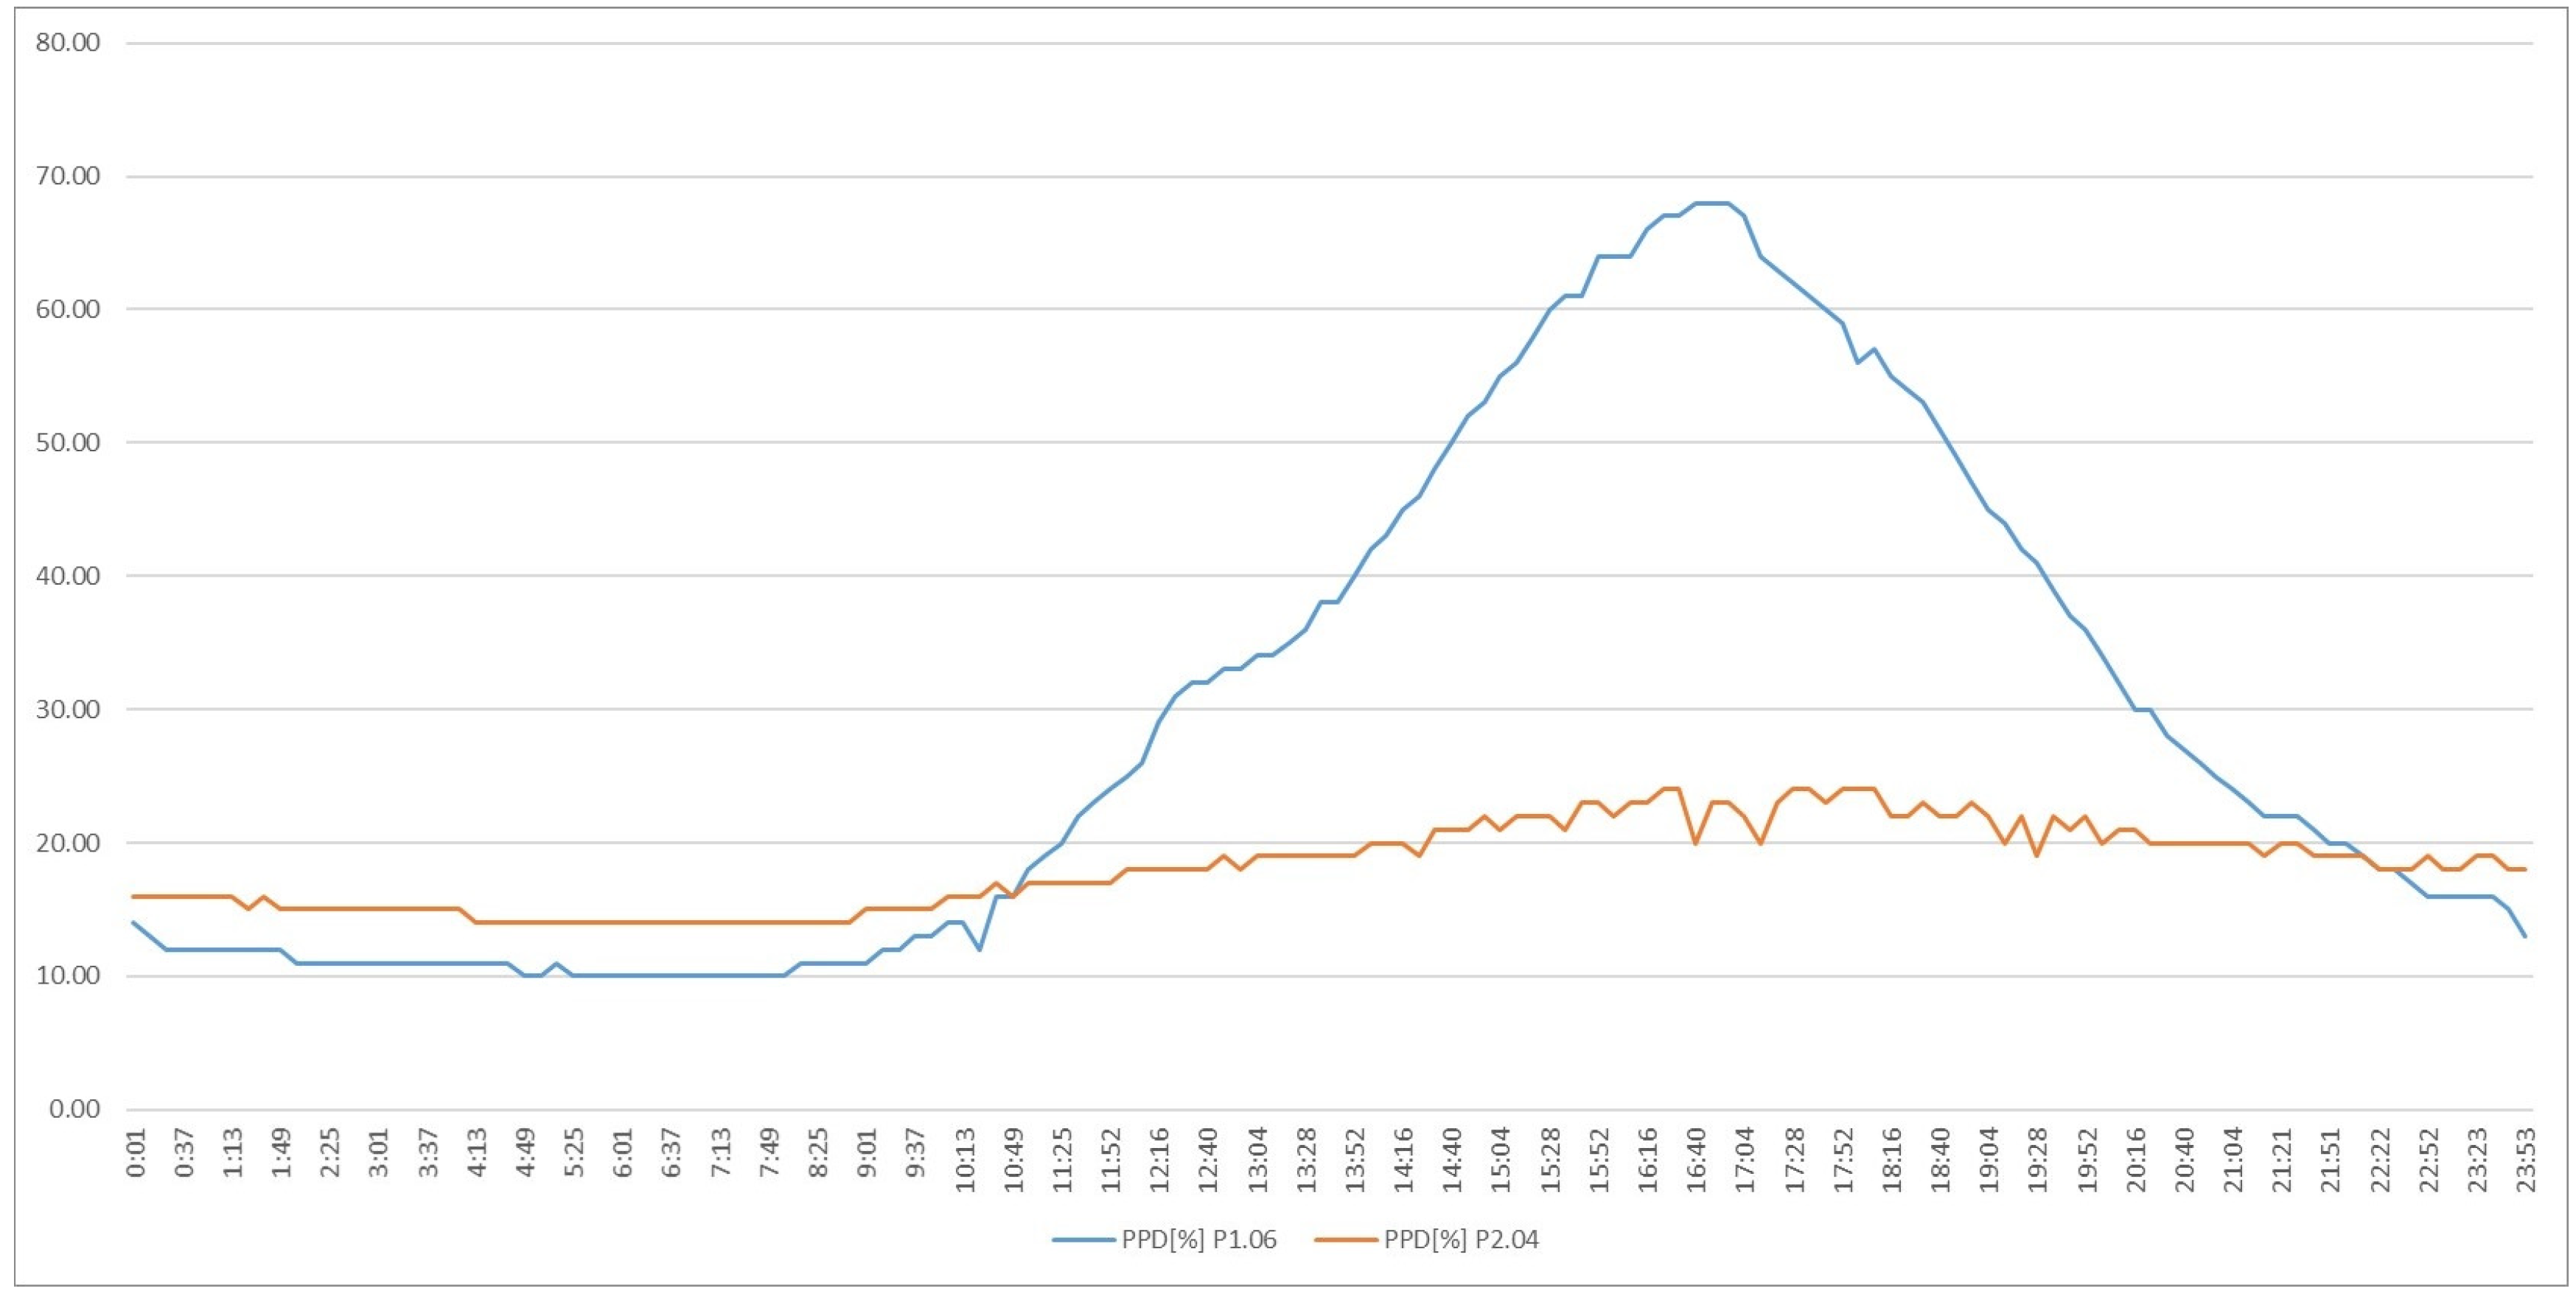
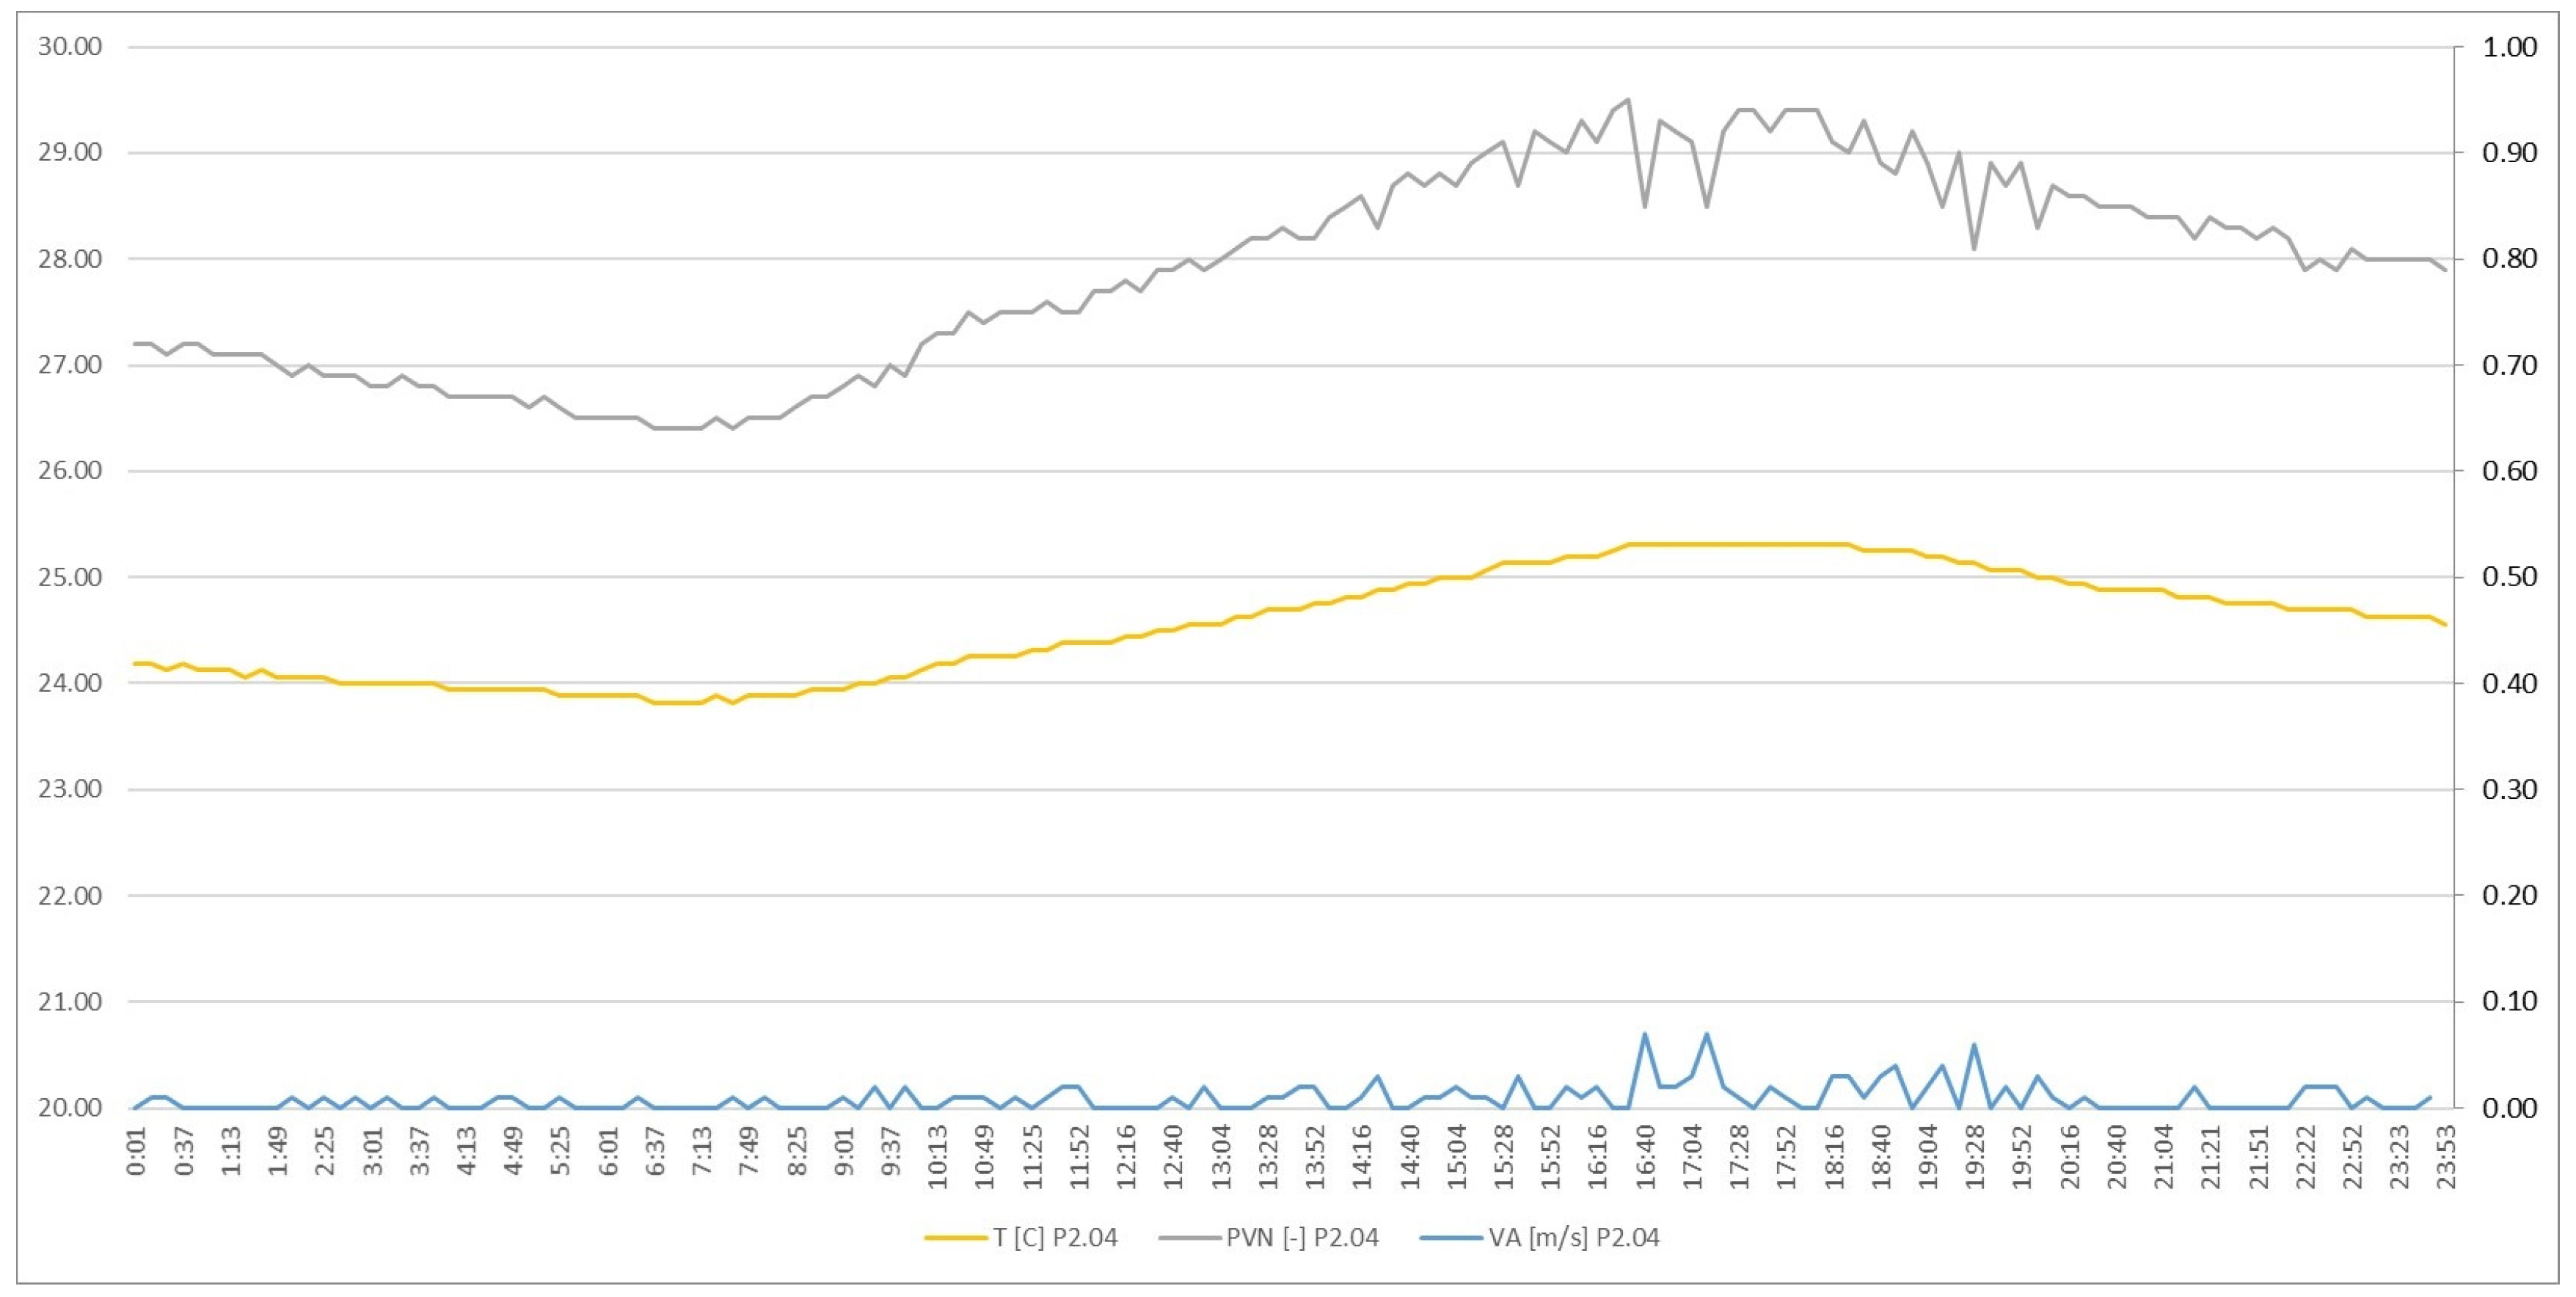
3.1. Result of Tests the Thermal Comfort. Comparison of Prevailing Conditions in Rooms P1.06 and P2.04
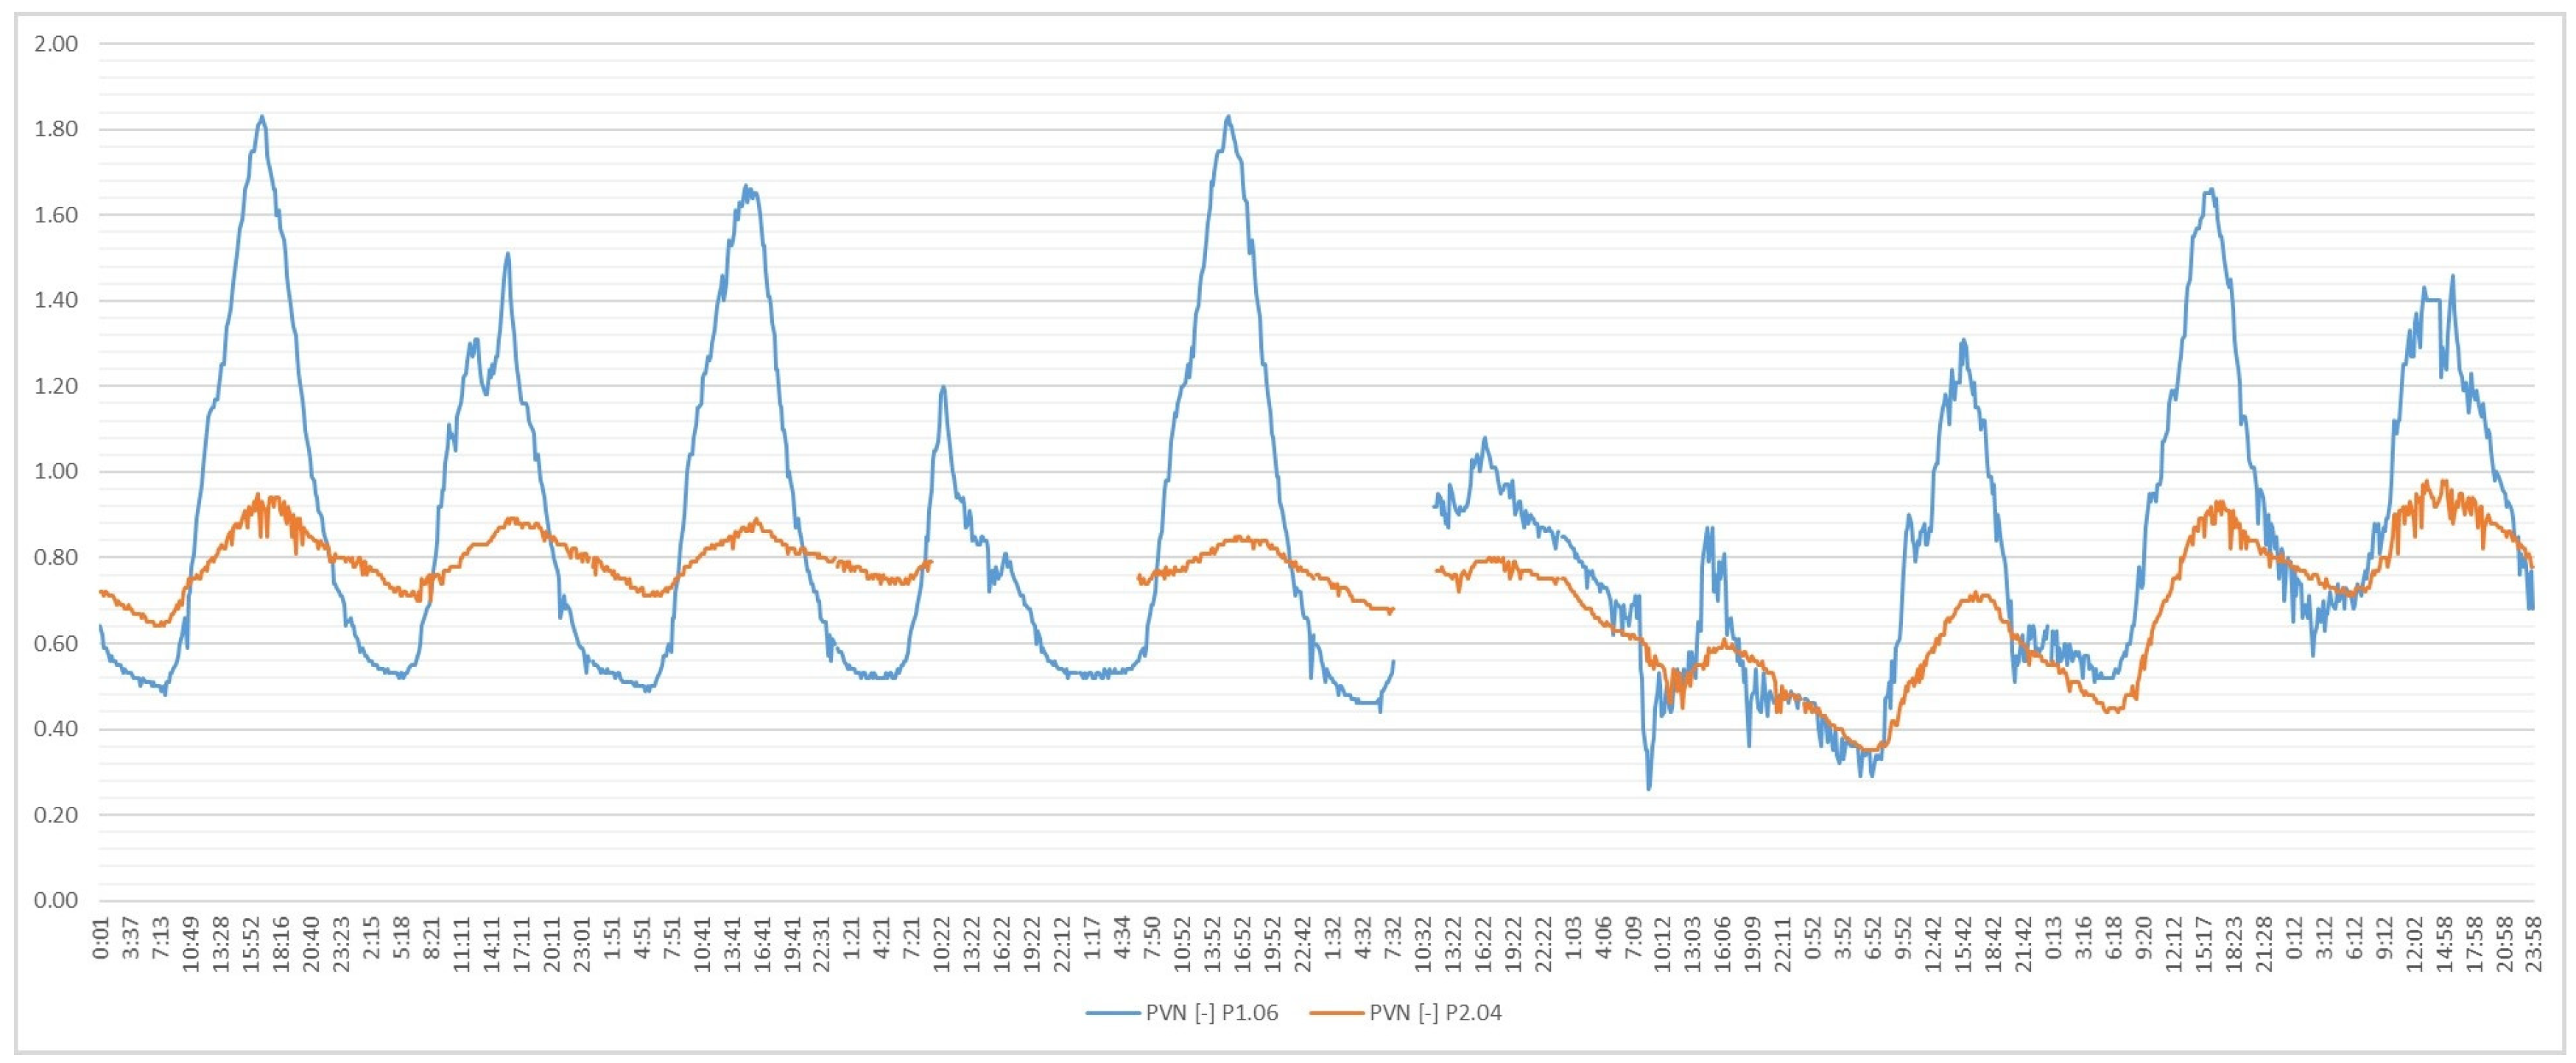
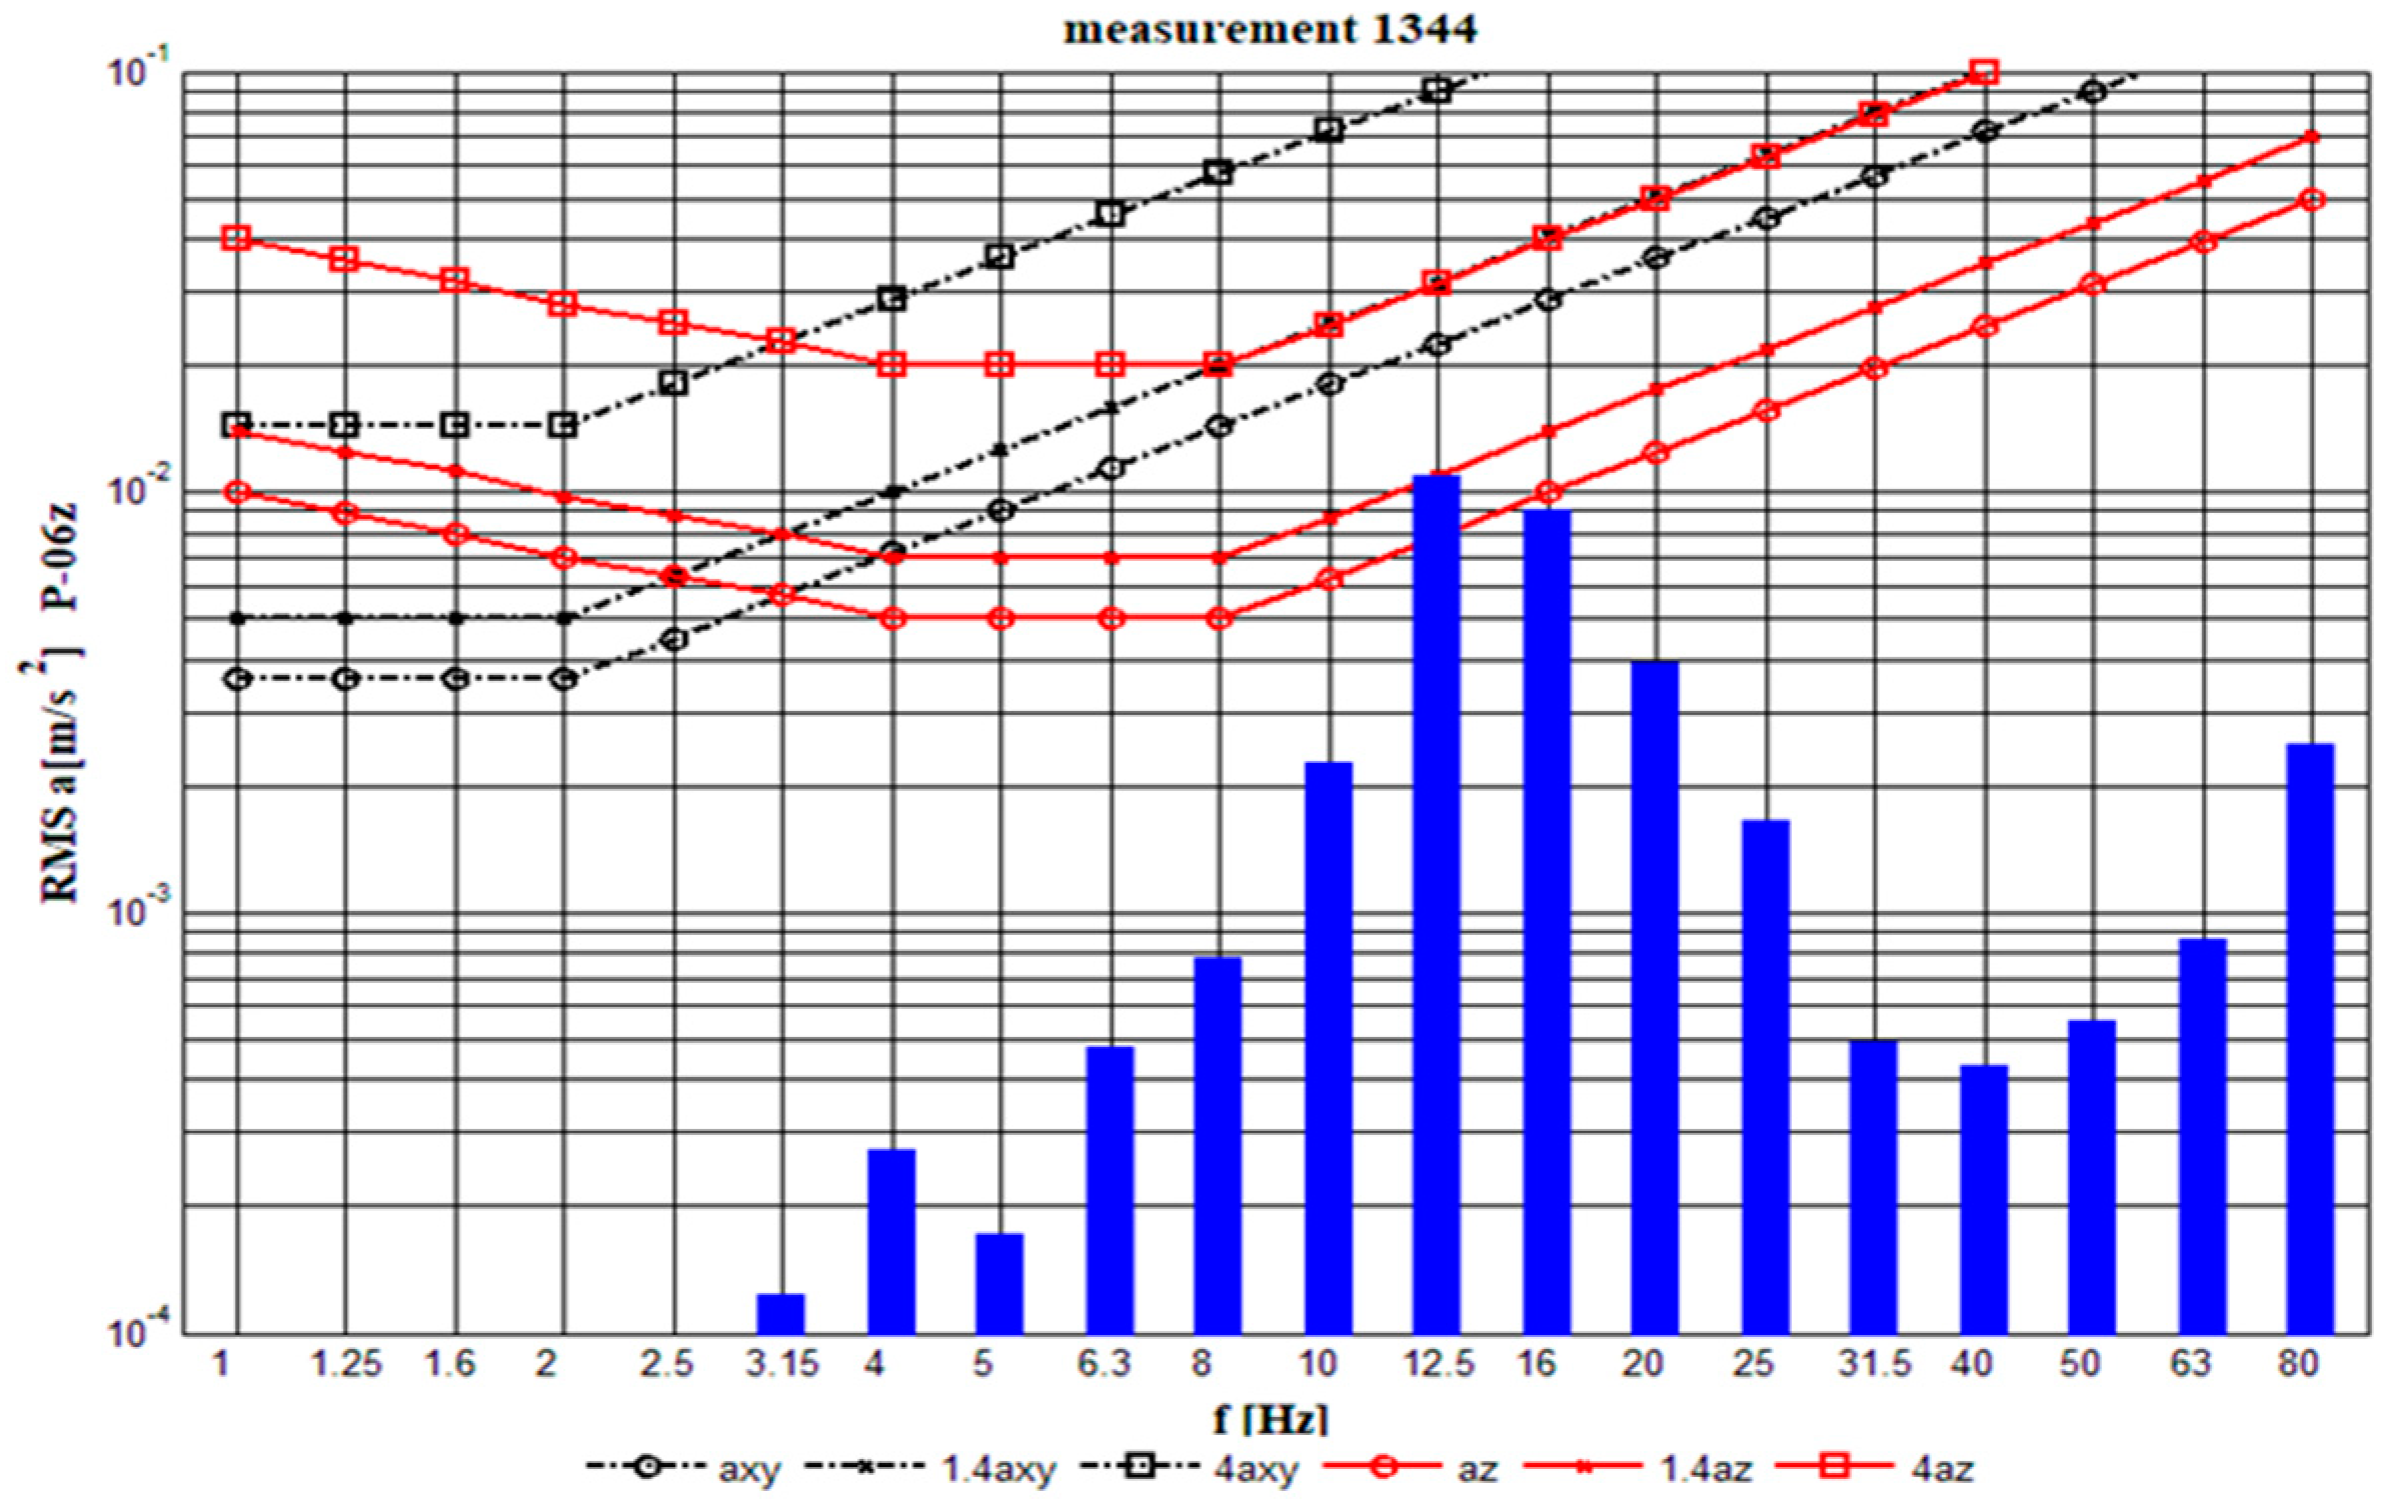
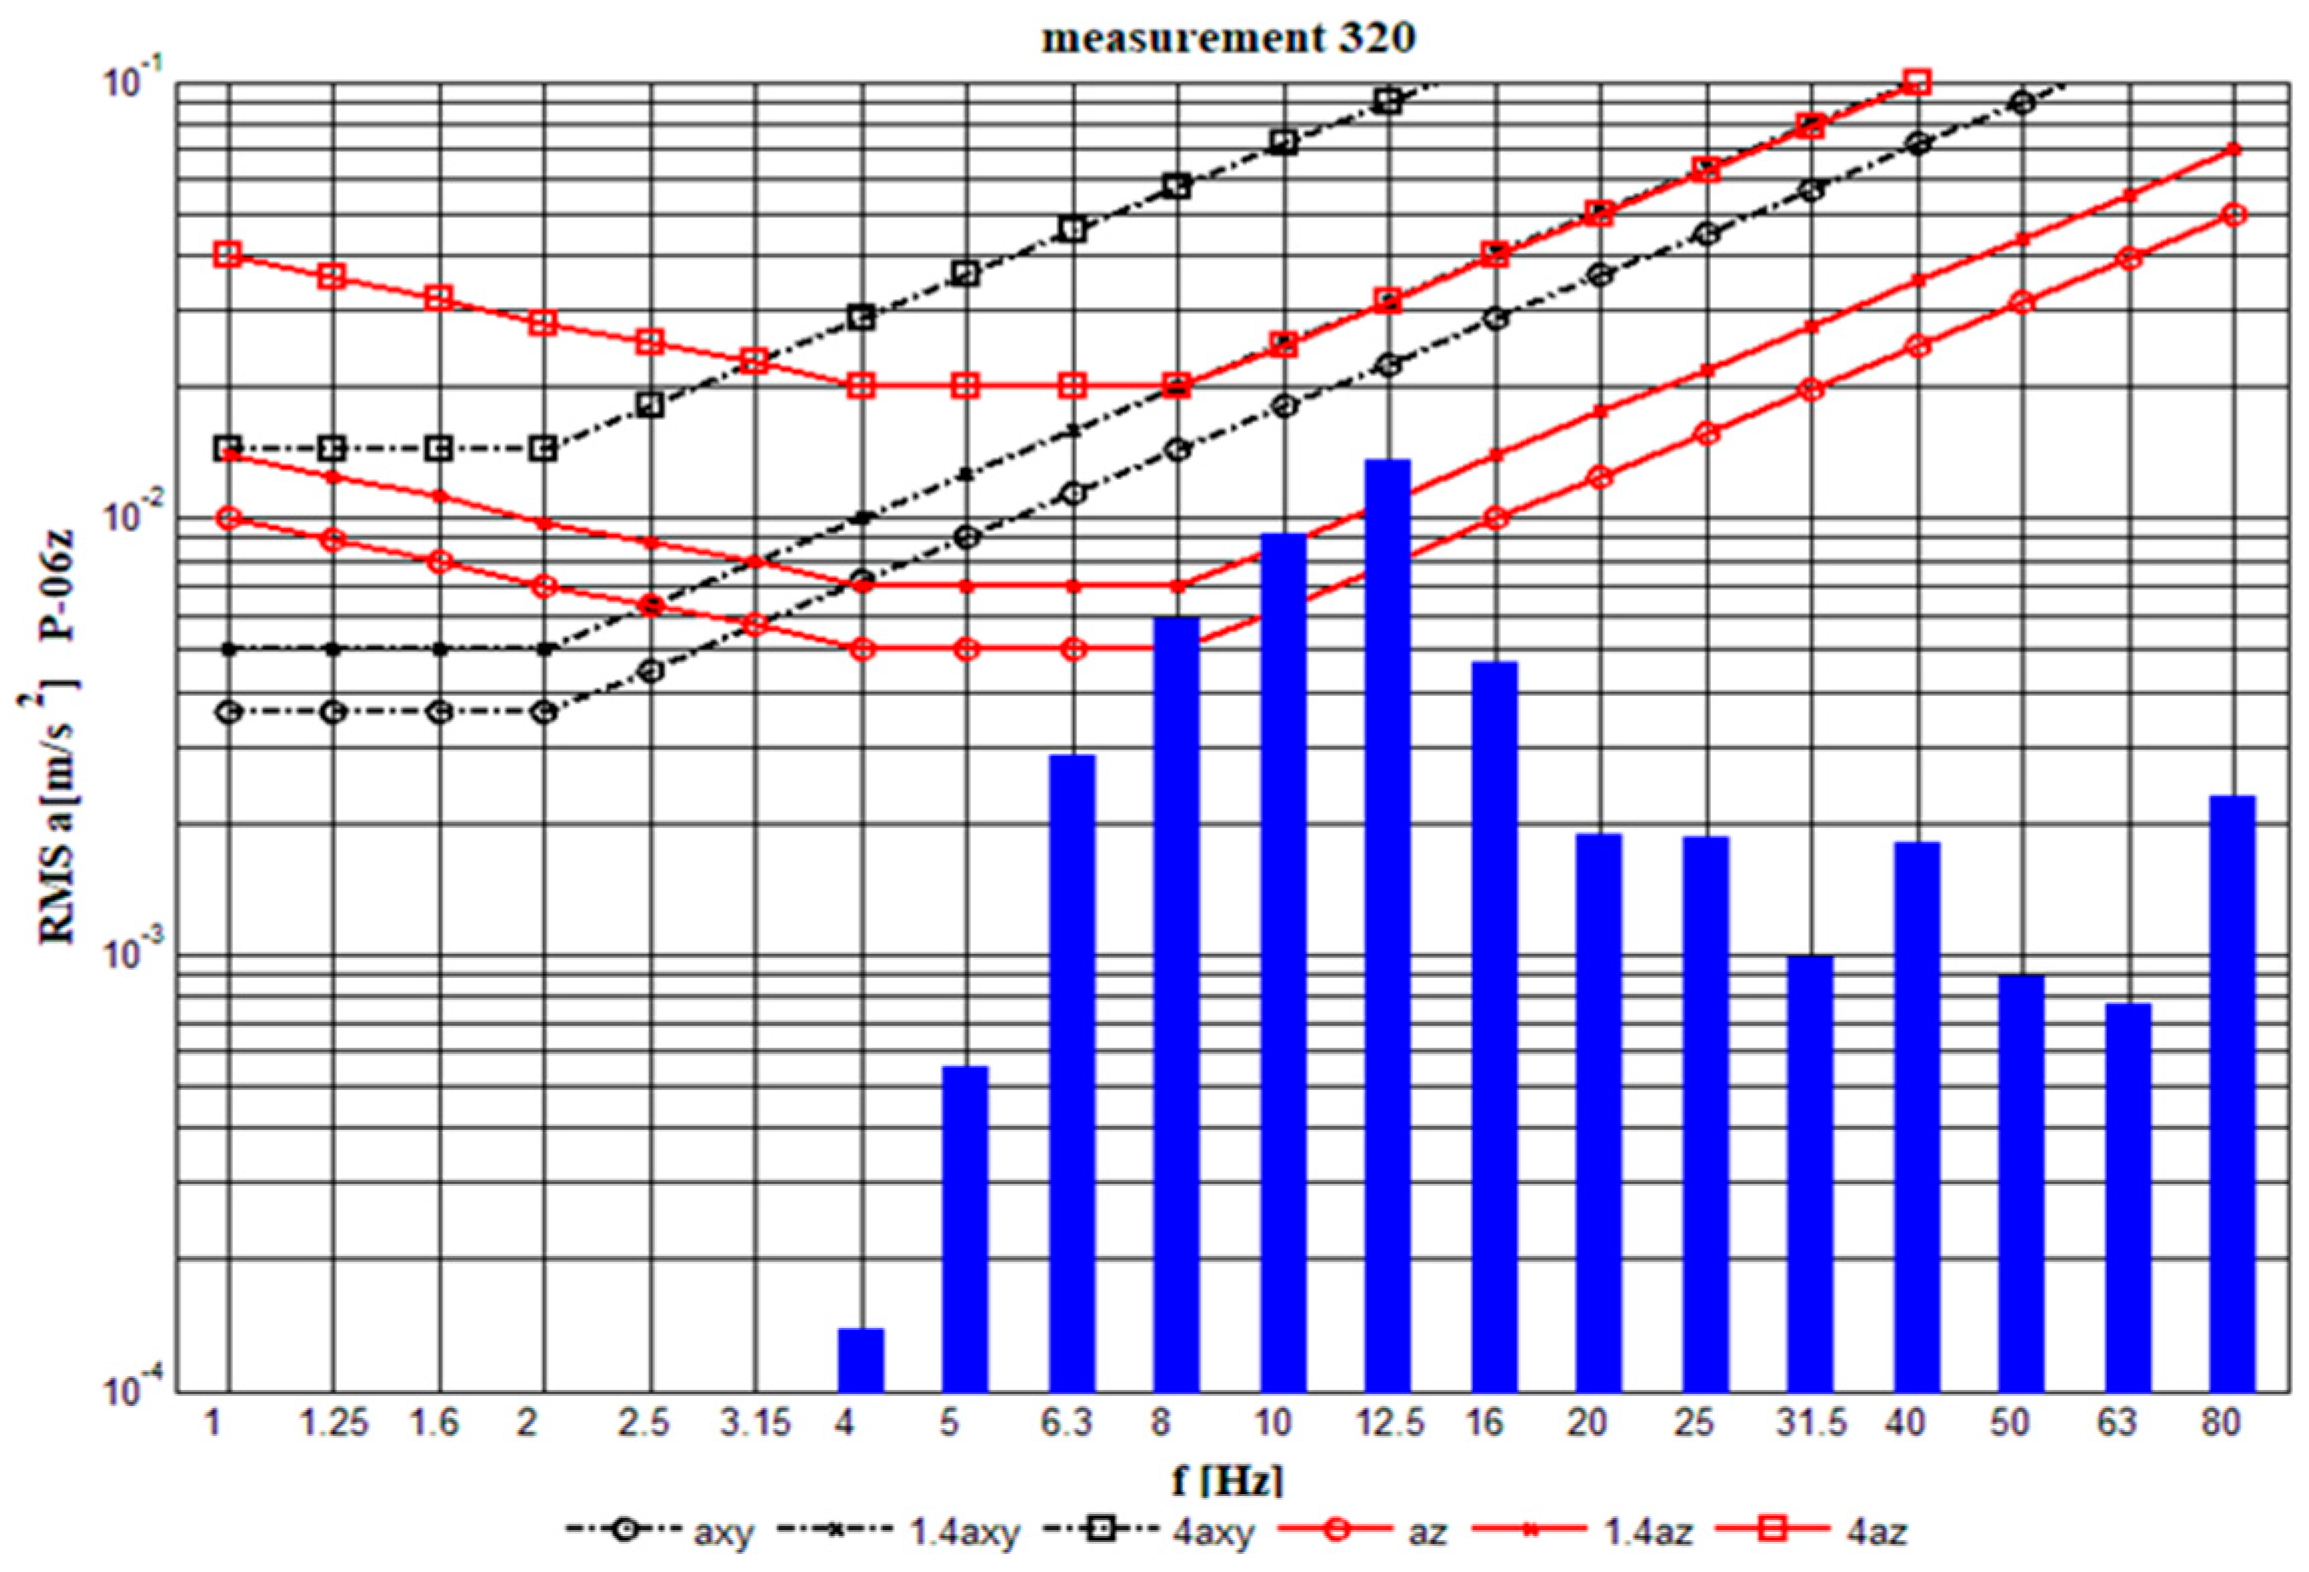
3.2. Vibrational Comfort
4. Discussion
- -
- The tests that were carried out by the authors confirmed that the application of only the energy efficiency requirements contained in Polish Regulation [4] does not ensure the comfort of use of NZEB buildings. The Technical and Building Conditions [4] that are applicable in Poland and concern the design of buildings should include requirements (and not recommendations) of using sun blinds, especially in buildings with large glazing on the south side.
- -
- The second postulate resulting from the conducted research is the necessity to introduce requirements ensuring vibratory comfort to standards defining the assurance of the quality of the internal environment (PN–EN 15251: 2012 standard) [5]. Vibration comfort is just as important as thermal, acoustic, and visual comfort. The research that was carried out by the authors is a guide for designers to pay more attention to ensuring the comfort of using NZEB and passive buildings.
5. Conclusions
Author Contributions
Funding
Acknowledgments
Conflicts of Interest
References
- Dudzińska, A. Effectiveness of sunshades in shaping thermal comfort in a passive public building. J. Civ. Eng. Environ. Arch. 2015, XXXII, s39–s48. [Google Scholar]
- The European Parliament and the Council of the European Union. Directive 2010/31/EU of the European Parliament and of the Council of 19 May 2010 on the Energy Performance of Buildings (Recast); the European Union: Brussels, Belgium, 2010.
- Criteria for the Passive House, EnerPHit and PHI Low Energy Building Standard. Available online: https://passiv.de/downloads/03_building_criteria_en.pdf (accessed on 1 October 2018).
- Regulation of the Minister of Infrastructure and Construction Regarding Technical Requirements Which Should Be Met by Buildings and Their Location; Official Journal of the Republic of Poland. Available online: http://prawo.sejm.gov.pl/isap.nsf/download.xsp/WDU20150001422/O/D20151422.pdf (accessed on 11 October 2018).
- Indoor Environmental Input Parameters for Design and Assessment of Energy Performance of Buildings Addressing Indoor Air Quality, Thermal Environment, Lighting and Acoustics. Available online: http://www.cres.gr/greenbuilding/PDF/prend/set4/WI_31_Pre-FV_version_prEN_15251_Indoor_Environment.pdf (accessed on 17 October 2018).
- Kisilewicz, T. Overheating of Low-Energy Buildings. Available online: http://beta.nis.com.pl/userfiles/editor/nauka/122013_n/Kisilewicz_12-2013.pdf (accessed on 17 October 2018).
- Bzowska, D. Risk of Overheating of Heat Insulated Buildings in the Summer Time. J. Civ. Eng. Environ. Arch. 2016, XXXIII, s43–s52. [Google Scholar]
- Bzowska, D. Changes in temperature in buildings in response to the changing climate. Tech. Trans. 2012, 3, 37–44. (In Polish) [Google Scholar]
- Dudzińska, A. Analysis of the influence of the surface of transparent partitions on the microclimate of a passive public building. J. Civ. Eng. Environ. Arch. 2017, XXXIV, s139–s146. [Google Scholar] [CrossRef]
- Fanger, P.O. Thermal Comfort: Analysis and Applications in Environmental Engineering; Danish Technical Press: Copenhagen, Denmark, 1970. [Google Scholar]
- Shukuya, M. Exergetic Aspect of Human Thermal Comfort and Adaptation. In Sustainable Houses and Living in the Hot-Humid Climates of Asia; Springer: Singapore, 2018; pp. 123–129. [Google Scholar]
- Prek, M. Exergy analysis of thermal comfort. Int. J. Exergy 2004, 1, 303–315. [Google Scholar] [CrossRef]
- Kubota, T.; Rijal, H.R.; Takaguchi, H. (Eds.) Sustainable Houses and Living in the Hot-Humid Climates of Asia Project: Research on Human-Adaptable Built Environment Suiting to Local Climate with the Use of Natural Exergy; Springer: Singapore, 2018; pp. 13–23. [Google Scholar] [CrossRef]
- Praca w Wysokich Temperaturach. Available online: https://asystentbhp.pl/praca-w-wysokich-temperaturach-1041/ (accessed on 17 October 2018).
- American Society of Heating, Refrigeation and Air-Conditioning Engineers. Thermal Environmental Conditions for Human Occupancy. Available online: https://www.ashrae.org/technical-resources/bookstore/thermal-environmental-conditions-for-human-occupancy (accessed on 17 October 2018).
- ISO. Ergonomics of the Thermal Environment—Analytical Determination and Interpretation of Thermal Comfort Using Calculation of the PMV and PPD Indices and Local Thermal Comfort Criteria; International Organization for Standarization: Geneve, Switzerland, 2005. [Google Scholar]
- Nicol, F.; Humphreys, M.; Sykes, O.; Roaf, S. Standards for Thermal Comfort; Tailor & Francis: London, UK, 2015; ISBN 0 41902.0420 2. [Google Scholar]
- Fedorczak-Cisak, M.; Furtak, M.; Kotowicz, A. Aspects and implementation of low-energy buildings design. J. Natl. Univ. Lviv Polytech. 2016, 1, 253–259. [Google Scholar]
- Fedorczak-Cisak, M.; Kowalska-Koczwara, A.; Romańska-Zapała, A. Energy Simulations of Residential Building Using a Dynamic Energy-Balanced Software. Available online: http://www.inase.org/library/2015/zakynthos/bypaper/CIMC/CIMC-36.pdf (accessed on 17 October 2018).
- Parsons, K. Human Thermal Environments; CRC Press: London, UK, 2003; ISBN 978-1-4665-9599-6. [Google Scholar]
- Öhrström, E.; Skånberg, A.-B. A field survey on effects of exposure to noise and vibration from railway traffic, part I: Annoyance and activity disturbance effects. J. Sound Vib. 1996, 193, 39–47. [Google Scholar] [CrossRef]
- Trollé, A.; Marquis-Favre, C.; Parizet, E. Perception and Annoyance Due to Vibrations in Dwellings Generated from Ground Transportation: A Review. J. Low Freq. Noise Vib. Act. Control 2015, 34, 413–457. [Google Scholar] [CrossRef]
- Han, J.; Kwon, S.; Chun, C. Indoor environment and passengers’ comfort in subway stations in Seoul. Build. Environ. 2016, 104, 221–231. [Google Scholar] [CrossRef]
- Liang, L.; Tian, S.; Xiao, P.; Jiang, X.; Xiao, L. Shenyang Urban Noise Monitoring—In Shenyang Subway Line 1 and Subway Line 2 for Example. J. Liaoning Univ. (Natural Sci. Ed.) 2015, 2015-01. Available online: http://en.cnki.com.cn/Article_en/CJFDTotal-LNDZ201501017.htm (accessed on 17 October 2018).
- Cik, M.; Lercher, P. Ground-borne vibrations, sounds and secondary airborne sounds from tramways: a psychoacoustic evaluation including health. In Proceedings of the INTER-NOISE and NOISE-CON Congress and Conference, Melbourne, Australia, 16–19 November 2014; pp. 1–9. [Google Scholar]
- Croy, I.; Smith, M.G.; Waye, K.P. Effects of train noise and vibration on human heart rate during sleep: An experimental study. BMJ Open 2013, 3, e002655. [Google Scholar] [CrossRef] [PubMed]
- Smith, M.G.; Croy, I.; Ögren, M.; Waye, K.P. On the Influence of Freight Trains on Humans: A Laboratory Investigation of the Impact of Nocturnal Low Frequency Vibration and Noise on Sleep and Heart Rate. PLoS ONE 2013, 8, e55829. [Google Scholar] [CrossRef] [PubMed]
- ISO. Ergonomics of the Thermal Environment—Devices for Measuring Physical Quantities; International Organization for Standarization: Geneve, Switzerland, 1998. [Google Scholar]
- Polish Standard Committee. Evaluation of Human Exposure to Vibration in Buildings; Polish Standard Committee: Warsaw, Poland, 2017. [Google Scholar]
- ISO. Guide to the Evaluation of Human Exposure to Whole Body Vibration. Part 2—Vibration in Buildings; International Organization for Standardization: Geneva, Switzerland, 2003. [Google Scholar]
- Tamura, Y.; Kawana, S.; Nakamura, O.; Kanda, J.; Nakatà, S. Evaluation perception of wind-induced vibration in buildings. Struct. Build. 2006, 159, 1–11. [Google Scholar] [CrossRef]
- Kwok, K.C.S.; Hitchcock, P.A.; Burton, M.D. Perception of vibration and occupant comfort in wind-excited tall buildings. J. Wind Eng. Ind. Aerodyn. 2009, 97, 368–380. [Google Scholar] [CrossRef]
- Waddington, D.C.; Woodcock, J.; Peris, E.; Condie, J.; Sica, G.; Moorhouse, A.T.; Steele, A. Human response to vibration in residential environments. J. Acoust. Soc. Am. 2014, 135, 182–193. [Google Scholar] [CrossRef] [PubMed]
- Raish, J. Thermal Comfort: Designing for People; Lang, W., McClain, A., Eds.; School of Architecture, The University of Texas: Austin, TX, USA, 2008. [Google Scholar]
- Huang, Q.; Lu, C.; Shaurette, M.; Cox, R. An environmental network of solar energy sensors for monitoring buildings. In Proceedings of the 28th International Symposium on Automatics and Robotics in Construction, Seoul, Korea, 29 June–2 July 2011; pp. 1376–1380. [Google Scholar]
- Huang, Q.; Ge, Z.; Lu, C. Estimation of occupancy in intelligent buildings using sound processing techniques. In Proceedings of the 16th International Conference on Calculation in Civil Engineering and Construction, Hong Kong, China, 11–13 December 2016; pp. 1413–1420. [Google Scholar]
- Habash, G.; Chapotchkine, D.; Fisher, P.; Rancourt, A.; Habash, R.I.; Norris, W. Sustainable Design of a Nearly Zero Energy Building Facilitated by a Smart Microgrid. J. Renew. Energy 2014, 2014, 725850. [Google Scholar] [CrossRef]


| Type of Sensor | Measurement Range | Scale | Accuracy |
|---|---|---|---|
| Temperature sensors | –20 °C + 50 °C (wet thermometer 0 °C + 50 °C) | 0.01 °C | ±0.4 °C |
| Humidity sensors | 0–100% | 0.1 RH (relative humidity) | ±2% RH (relative humidity) |
| Air velocity sensors | 0–5 m/s | 0.01 m/s | for 0-1 m/s +/0.05+0.05 × Va m/s, for 1-5 m/s ±5% |
| Category | Comfort Coefficients | |
|---|---|---|
| PPD (%) | PMV (Without Units) | |
| I | <6 | −0.2 < PMV < +0.2 |
| II | <10 | −0.5 < PMV < +0.5 |
| III | <15 | −0.7 < PMV < +0.7 |
| IV | >15 | PMV < −0.7 or PMV > +0.7 |
| f (Hz) | WODL (Without a Unit) |
|---|---|
| 12.50 | 1.41 |
| 16.00 | 0.91 |
© 2018 by the authors. Licensee MDPI, Basel, Switzerland. This article is an open access article distributed under the terms and conditions of the Creative Commons Attribution (CC BY) license (http://creativecommons.org/licenses/by/4.0/).
Share and Cite
Fedorczak-Cisak, M.; Furtak, M.; Gintowt, J.; Kowalska-Koczwara, A.; Pachla, F.; Stypuła, K.; Tatara, T. Thermal and Vibration Comfort Analysis of a Nearly Zero-Energy Building in Poland. Sustainability 2018, 10, 3774. https://doi.org/10.3390/su10103774
Fedorczak-Cisak M, Furtak M, Gintowt J, Kowalska-Koczwara A, Pachla F, Stypuła K, Tatara T. Thermal and Vibration Comfort Analysis of a Nearly Zero-Energy Building in Poland. Sustainability. 2018; 10(10):3774. https://doi.org/10.3390/su10103774
Chicago/Turabian StyleFedorczak-Cisak, Małgorzata, Marcin Furtak, Jolanta Gintowt, Alicja Kowalska-Koczwara, Filip Pachla, Krzysztof Stypuła, and Tadeusz Tatara. 2018. "Thermal and Vibration Comfort Analysis of a Nearly Zero-Energy Building in Poland" Sustainability 10, no. 10: 3774. https://doi.org/10.3390/su10103774