Article

Estimating Avocado Sales Using Machine Learning Algorithms and Weather Data

by
Juan Rincon-Patino
*,
Emmanuel Lasso
and
Juan Carlos Corrales
Grupo de ingeniería Telemática, Universidad del Cauca, Campus Tulcán, Popayán 190002, Colombia
*
Author to whom correspondence should be addressed.
Sustainability 2018, 10(10), 3498; https://doi.org/10.3390/su10103498
Submission received: 20 August 2018 / Revised: 18 September 2018 / Accepted: 26 September 2018 / Published: 29 September 2018
(This article belongs to the Special Issue Economics of Climate Smart Agriculture)

Abstract

:
Persea americana, commonly known as avocado, is becoming increasingly important in global agriculture. There are dozens of avocado varieties, but more than 85% of the avocados harvested and sold in the world are of the Hass one. Furthermore, information on the market of agricultural products is valuable for decision-making; this has made researchers try to determine the behavior of the avocado market, based on data that might affect it one way or another. In this paper, a machine learning approach for estimating the number of units sold monthly and the total sales of Hass avocados in several cities in the United States, using weather data and historical sales records, is presented. For that purpose, four algorithms were evaluated: Linear Regression, Multilayer Perceptron, Support Vector Machine for Regression and Multivariate Regression Prediction Model. The last two showed the best accuracy, with a correlation coefficient of 0.995 and 0.996, and a Relative Absolute Error of 7.971 and 7.812, respectively. Using the Multivariate Regression Prediction Model, an application that allows avocado producers and sellers to plan sales through the estimation of the profits in dollars and the number of avocados that could be sold in the United States was created.

Graphical Abstract

1. Introduction

Persea americana, commonly known as avocado, first appeared in Mexico thousands of years ago, but it was not until 1871 that it was brought to California, United States. By the 1950s, there were dozens of varieties being sold in the markets of the country, with Fuerte being the most consumed variety. About twenty years later, this situation changed, and the Hass avocado started to be the most consumed variety in the country and in the world. At present, avocado consumption happens not only due to its flavor, but also due to its healthy contribution to people’s diets [1].
Currently, 85% of the avocados produced and sold in the world are of the Hass variety. This variety grows almost the whole year round and in different regions. Some of the leading producing countries are Mexico, United States, Chile, Australia, South Africa and Israel, with Mexico being the largest producer in the world, representing about a third of the worldwide production [2]. The United States is the leading country concerning imports, and has evolved towards a market of almost a million tons of avocados [3]. The avocado market has grown 16% every year since 2008 in the United States, and this trend is expected to continue, at least in the medium term. States like Florida, California and Hawaii are producers of avocado in this country, but the production does not meet the market demands, so avocados are imported from Mexico, Chile, Peru, New Zealand and the Dominican Republic, among other countries. However, avocado consumption is not uniform across the country. For example, about 90% of the families in California consume avocados, in a proportion of more than three units per month. However, in some states of the Great Plains, only a little more than half of the families consume this fruit, in a proportion of no more than two units per month [3].
Collecting information on the market and on better practices concerning avocado cultivation would be of great help to producers, vendors, associations, and companies. This could be used to choose the right places to sell avocados, to carry out successful marketing campaigns or to develop innovations for the production and sales of such product. An example of this fact is that about fifty million dollars are spent annually on advertising and promotional activities on healthy avocado consumption [3].
Several authors have found that weather is one of the factors affecting economic and commercial behavior [4,5,6,7]. In order to predict future behaviors or relationships, there is a subset of artificial intelligence called machine learning, which includes building classification and regression models [8]. For example, crop production [9] and disease incidence [10,11] can be predicted by using several machine learning techniques and also weather data collection. Models used to predict avocado sales in the United States can be generated using weather and market data.
In this study, machine learning techniques were used to estimate the number of units sold monthly and the total sales of avocados in several cities of the United States, taking into consideration weather data. This will allow avocado producers to plan sales through a mobile application that uses a model trained with regression trees and support vector machines. With this innovative solution, producers, vendors, associations and companies can get to know the sales expected to be registered in advance. It could be an essential input for making rational decisions regarding the avocado market, such as encouraging consumption or shifting supplies to markets of high demand for the product. The mobile application shows avocado sales expected in different cities in the United States and allows users to receive alerts and recommendations for selling the product, to examine general information on the leading markets and to know where the largest and the lowest sales will be registered. Additionally, the application presents a list of frequently asked questions concerning avocados, with topics such as sowing, harvesting, transportation, sales and their healthy consumption. The outline of this paper is organized as follows: Section 2 shows the pre-processing of market and weather data; Section 3 exposes the trained models, the experimental evaluation, and the mobile application and Section 4 shows the discussion and future works.

2. Materials and Methods

According to the authors of [6], the weather is closely related to how much consumers spend in the market. Variables such as temperature, humidity, snowfalls and sunlight can drastically affect sales. The process performed to obtain the dataset will be presented next.

2.1. Data Sources

A dataset was built, for the training of the models, which contains records on weather and sales in several cities in the United States. We used the Hass Avocado Board program (HAB) as the source of the avocado market data and Weather Underground as the source of weather data.
The Hass Avocado Board is a program sponsored by the United States government and financed by a tax applied to all Hass avocados sold in the markets of the country, both imported or locally produced. The majority of its funds are destined to advertising and promotion programs [12]. Additionally, on its website, HAB collects, tracks, analyzes and disseminates information on avocado sales in the United States markets. All of this information is normally used for research and for making decisions on the cultivation, harvesting, distribution, and marketing of avocados [13]. For the study, we extracted market data from this website, considering four-week periods (from January 2013 to June 2017), about 43 cities in the United States, including Atlanta, Boston, Chicago, Detroit, Los Angeles, New York, etc.
We used Weather Underground as the weather data source. This service provides real-time weather information for a large number of cities around the world. For this research, more specifically, we used data on temperature (maximum, minimum and average), humidity (maximum, minimum and average) and precipitation in the 43 cities, during the same periods mentioned above.

2.2. Data Selection and Cleaning

Data acquired in Section 2.1 was prepared and cleaned in order to obtain an appropriate dataset for understanding the fluctuation of the avocado market in the United States, based on different weather conditions. For this purpose, we followed the Cross Industry Standard Process for Data Mining (CRISP-DM) methodology [14] and the data cleaning process proposed in [15]. Figure 1 exposes the data preparation tasks that were considered.
As a first step, data was selected. The number of avocados sold over a four-week period in two different years (the current year and the immediately previous one) were labeled as units-cy and units-py, respectively. The total sales in dollars for the same years, labeled as sales-cy, and sales-py, were chosen from the data on the market in different cities in the United States that had been retrieved. Concerning the weather, we selected the variables of maximum temperature (°C), minimum temperature (°C), average temperature (°C), maximum humidity (%), minimum humidity (%), average humidity (%) and precipitation (mm).
Afterwards, we cleaned the two datasets following the data cleaning tasks presented in Figure 2.
  • Searching for missing values: blank spaces, words such as “NaN” or “null” and special characters such as “*” or “?” were searched for, as to verify if there were any missing values in the datasets. There was missing data only on the weather; this may be due to failures in the operation of the meteorological stations that capture such data. Since there was little data missing (a total of five records), we decided to delete those instances in both the weather and the market data. Finally, no data imputation process was implemented.
  • Outliers detection: to detect if there were values that significantly deviated from the others, we used Clustering (DBSCAN, Density-based spatial clustering of applications with noise) and Distance (LOF, Local Outlier Factor) algorithms. No outliers or extreme values were found for the two datasets.
  • Searching for duplicated instances: We used a filter in order to detect if there were repeated instances. The filter found no instances with this problem, since we constructed the datasets carefully and imputation algorithms were not implemented in the previous steps.
  • Dimensionality reduction: an algorithm for this task was applied. Typically, the algorithm searches for a subset of most relevant features to represent the dataset. The objective is to contribute to learning accuracy. Considering the limited data dimensionality of the datasets used, the dimensionality was not reduced.

2.3. Dataset Construction

As a third step, we performed a data normalization of the dataset. For this purpose, we made a research on the population of each city on the official website of the United States Census Bureau, the government agency responsible for the census in that country. This population data was used to normalize the number of avocados sold and the total sales per inhabitant in each city. Thus, four new attributes were created for the current and the previous year: the number of avocados sold divided by the population, labeled as units-cy/population and units-py/population, and the total sales divided by the population, labeled as sales-cy/population and sales-py/population. Due to the detection of heteroscedasticity in the data and because its distribution was highly skewed [16,17,18], the four attributes were normalized otherwise, using the Natural Logarithm function, thus creating four new ones. The four new attributes are: the natural logarithm of the number of avocados sold, labeled as Ln(units-cy) and Ln(units-py) and the natural logarithm of the total sales, Ln(sales-cy) and Ln(sales-py). The dataset is available in the Supplementary Materials section.
After the normalization, the dataset contained six classes. Therefore, it was divided in six different datasets for the next stage of modeling, as presented in Table 1. Each dataset consists of nine attributes and 2400 instances.

3. Results

3.1. Modeling for the Forecasting of the Avocado Market

Aiming at observing the fluctuation of the avocado market in the United States based on weather conditions, several machine learning techniques were evaluated to estimate the number of avocados sold and the total sales (in dollars) of this agricultural product. For this purpose, we used the datasets listed in Section 2.3 and four algorithms of the Weka toolkit:
  • Linear Regression: a technique used to determine the relationship of a y variable with one or many other x1, …, xk variables. In a machine learning approach, it searches for several functions that model the relationship between the variables and selects the one that most closely approximates to or fits the data given in the class [19].
  • Multilayer Perceptron: consists of units, called neurons, interconnected and organized in layers. Each neuron processes information, converting the input it receives into processed output. Through the links of neurons, knowledge is generated [20].
  • Support Vector Machine for Regression: these algorithms seek to estimate a function from a training data. For this purpose, an initial set of points is required, which also contains two other subsets of points and which belongs to one of two possible classes. Based on these, the support vector machine creates a hyper-plane in order to find the largest distance separating the classes and thus builds a model that is capable of predicting which class a new point belongs to [21].
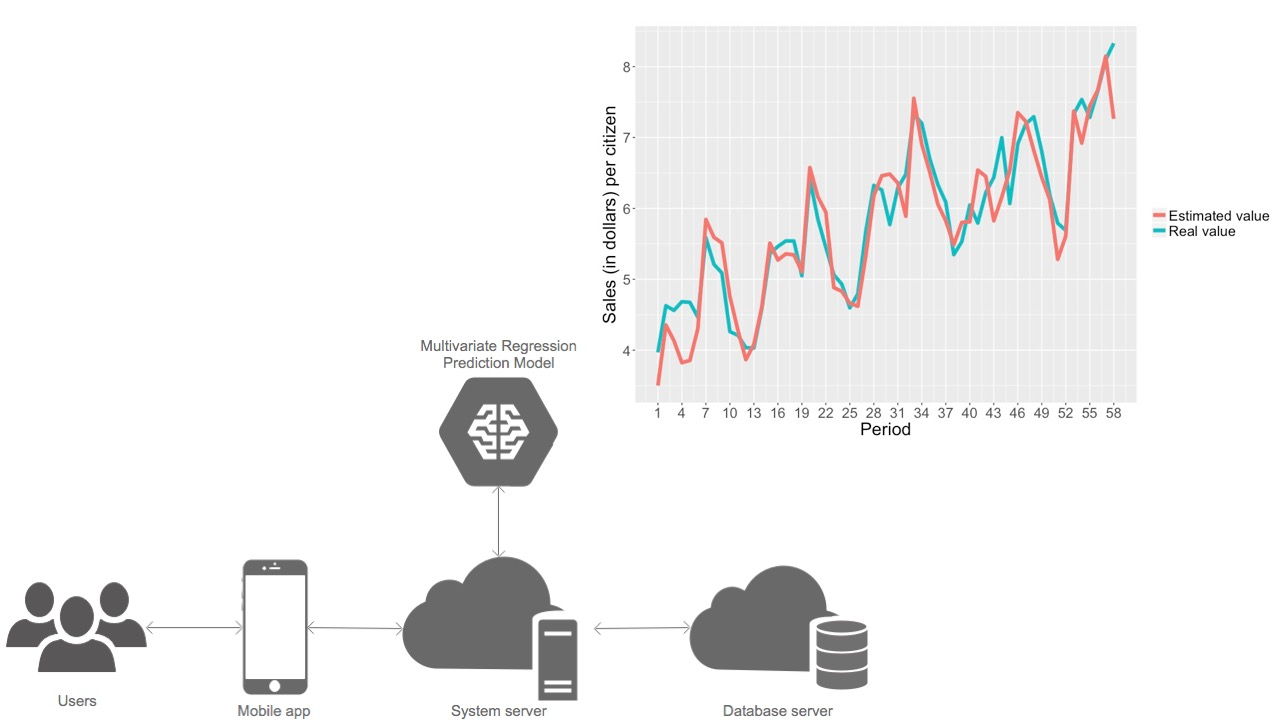
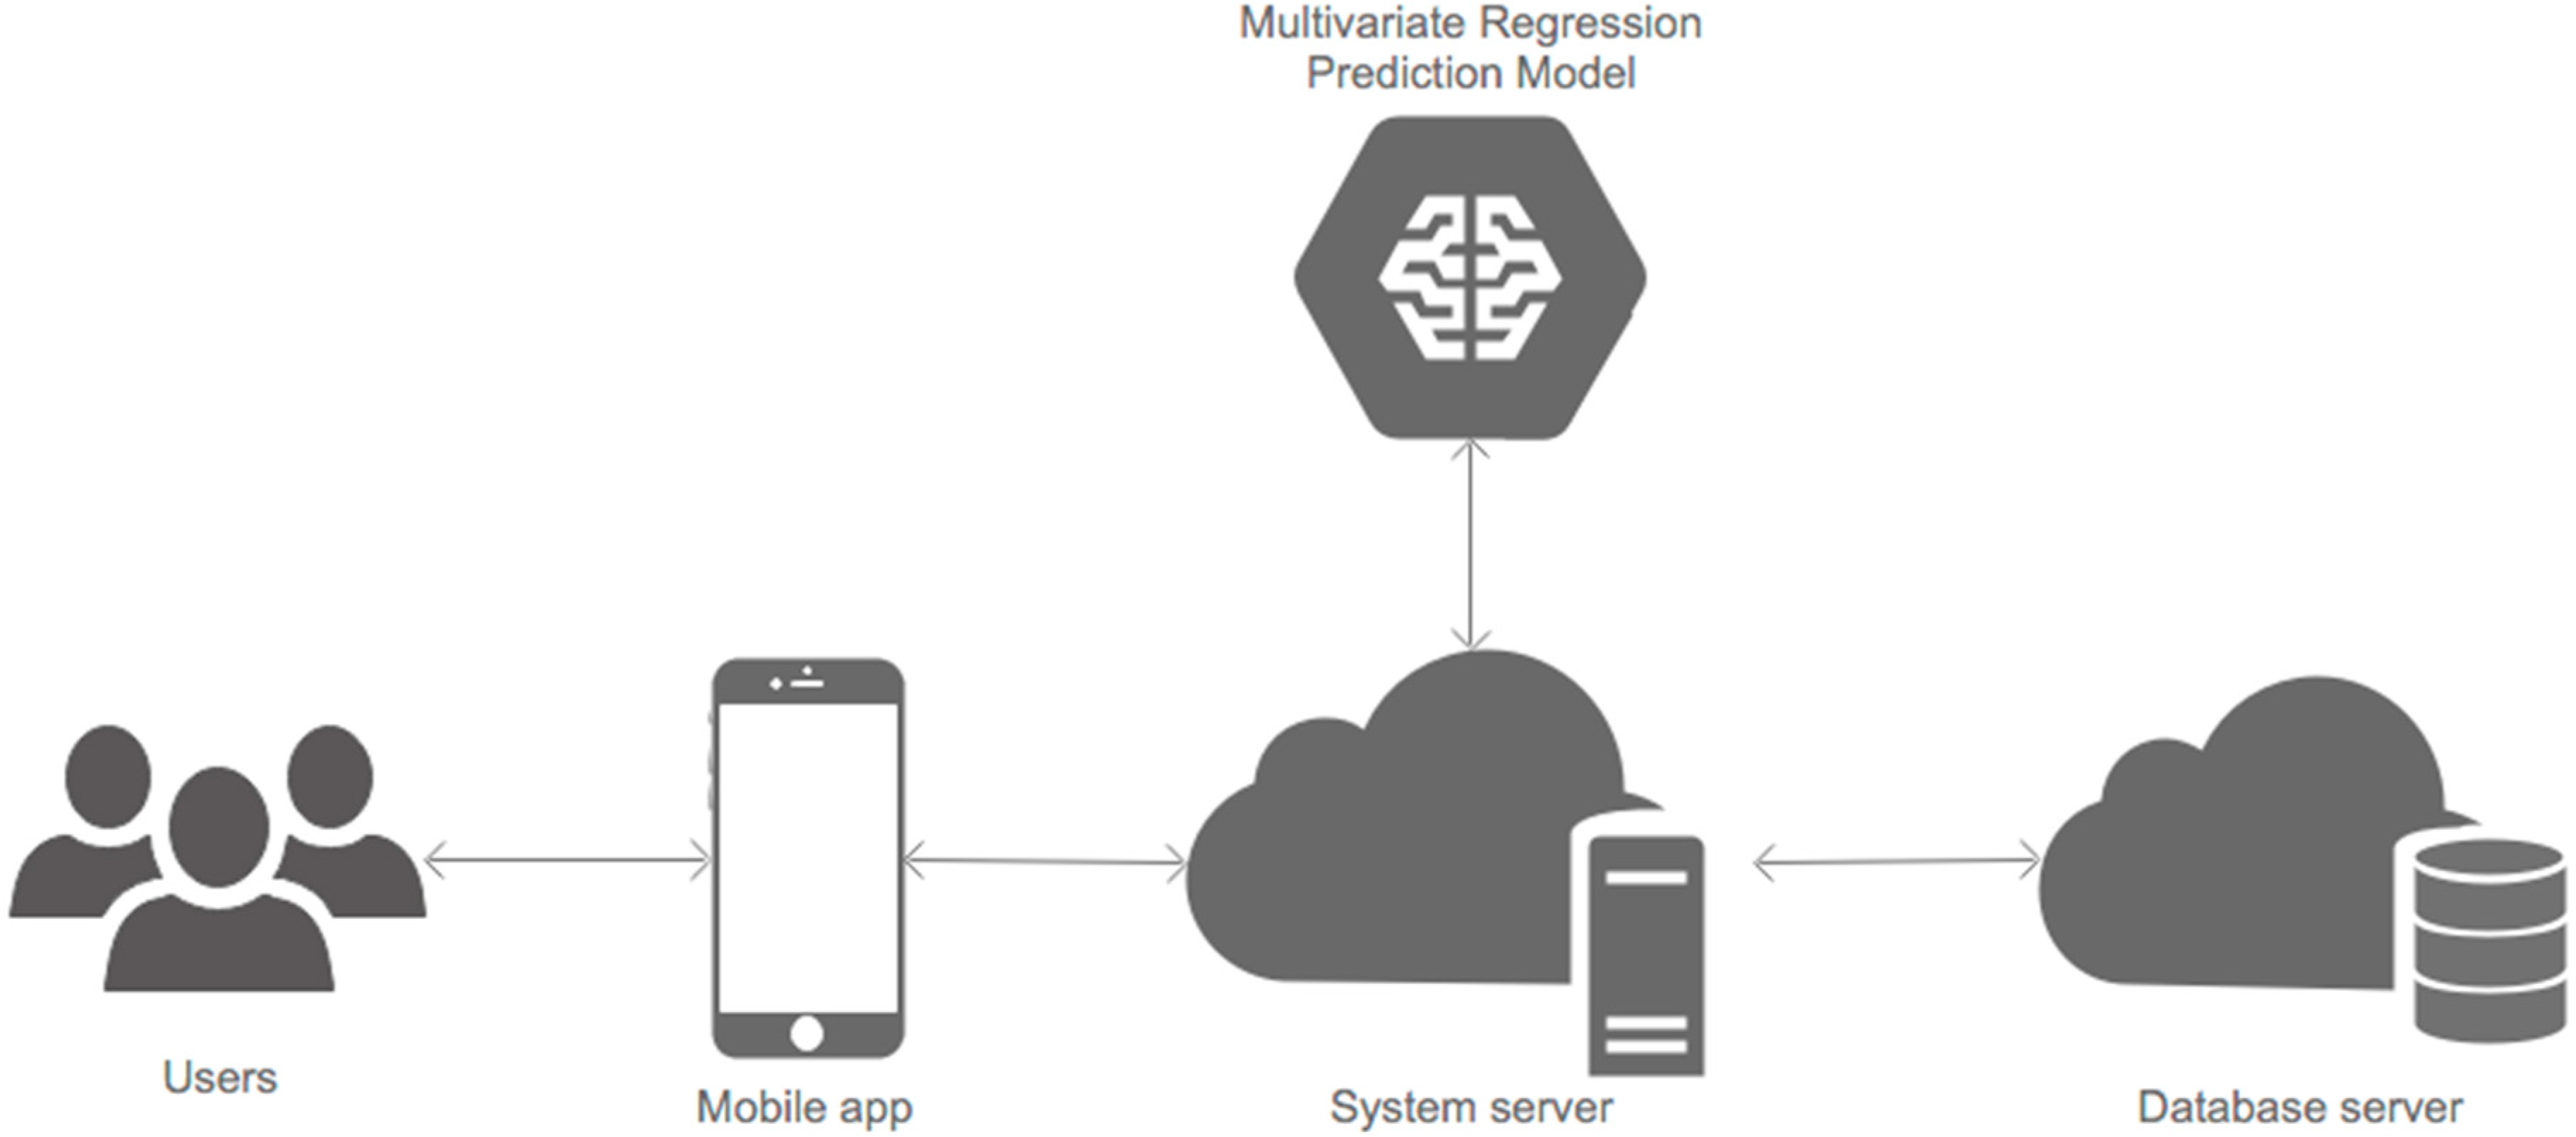
  • Multivariate Regression Prediction Model: an algorithm that associates traditional decision trees with linear regression functions. To some special nodes, commonly known as leaves, the algorithm assigns a probability vector that indicates the chances that a class will take a certain value. The instances are classified following a path from the root of the tree to a leaf, according to the results of the tests performed in each of the test nodes [22].
To evaluate the predictive models, a 10-fold cross-validation method [23] was used. In addition, we compared the models generated using the Correlation Coefficient (CC), Mean Absolute Error (MAE) and the Relative Absolute Error (RAE). Table 2 and Table 3 show the results obtained.
It is important to mention that the high MAE records in Table 2 and Table 3 appeared because the respective datasets (DS1 and DS2) contain values in terms of millions of units and dollars.
Several conclusions can be drawn from the tables mentioned. On the one hand, the two normalization processes that were carried out, either by using the Natural Logarithm function or by dividing the units and sales by the total population of each city, considerably improved the accuracy of the models generated. Normalizing the avocado units (dataset DS5) and the sales (dataset DS6), using the population of each city, produces the best outcomes for the modeling process. On the other hand, the process of forecasting the total sales (in dollars) of avocados, according to climatic conditions, presents the best accuracy rate compared to the estimated number of units sold.
With the purpose of estimating the number of units sold and the total sales of avocados in different cities in the United States, the algorithm that generated the best model, out of the four studied in this paper, was the Multivariate Regression Prediction Model algorithm. The main characteristics of the selected model are presented below. For the forecasting of the number of units sold:
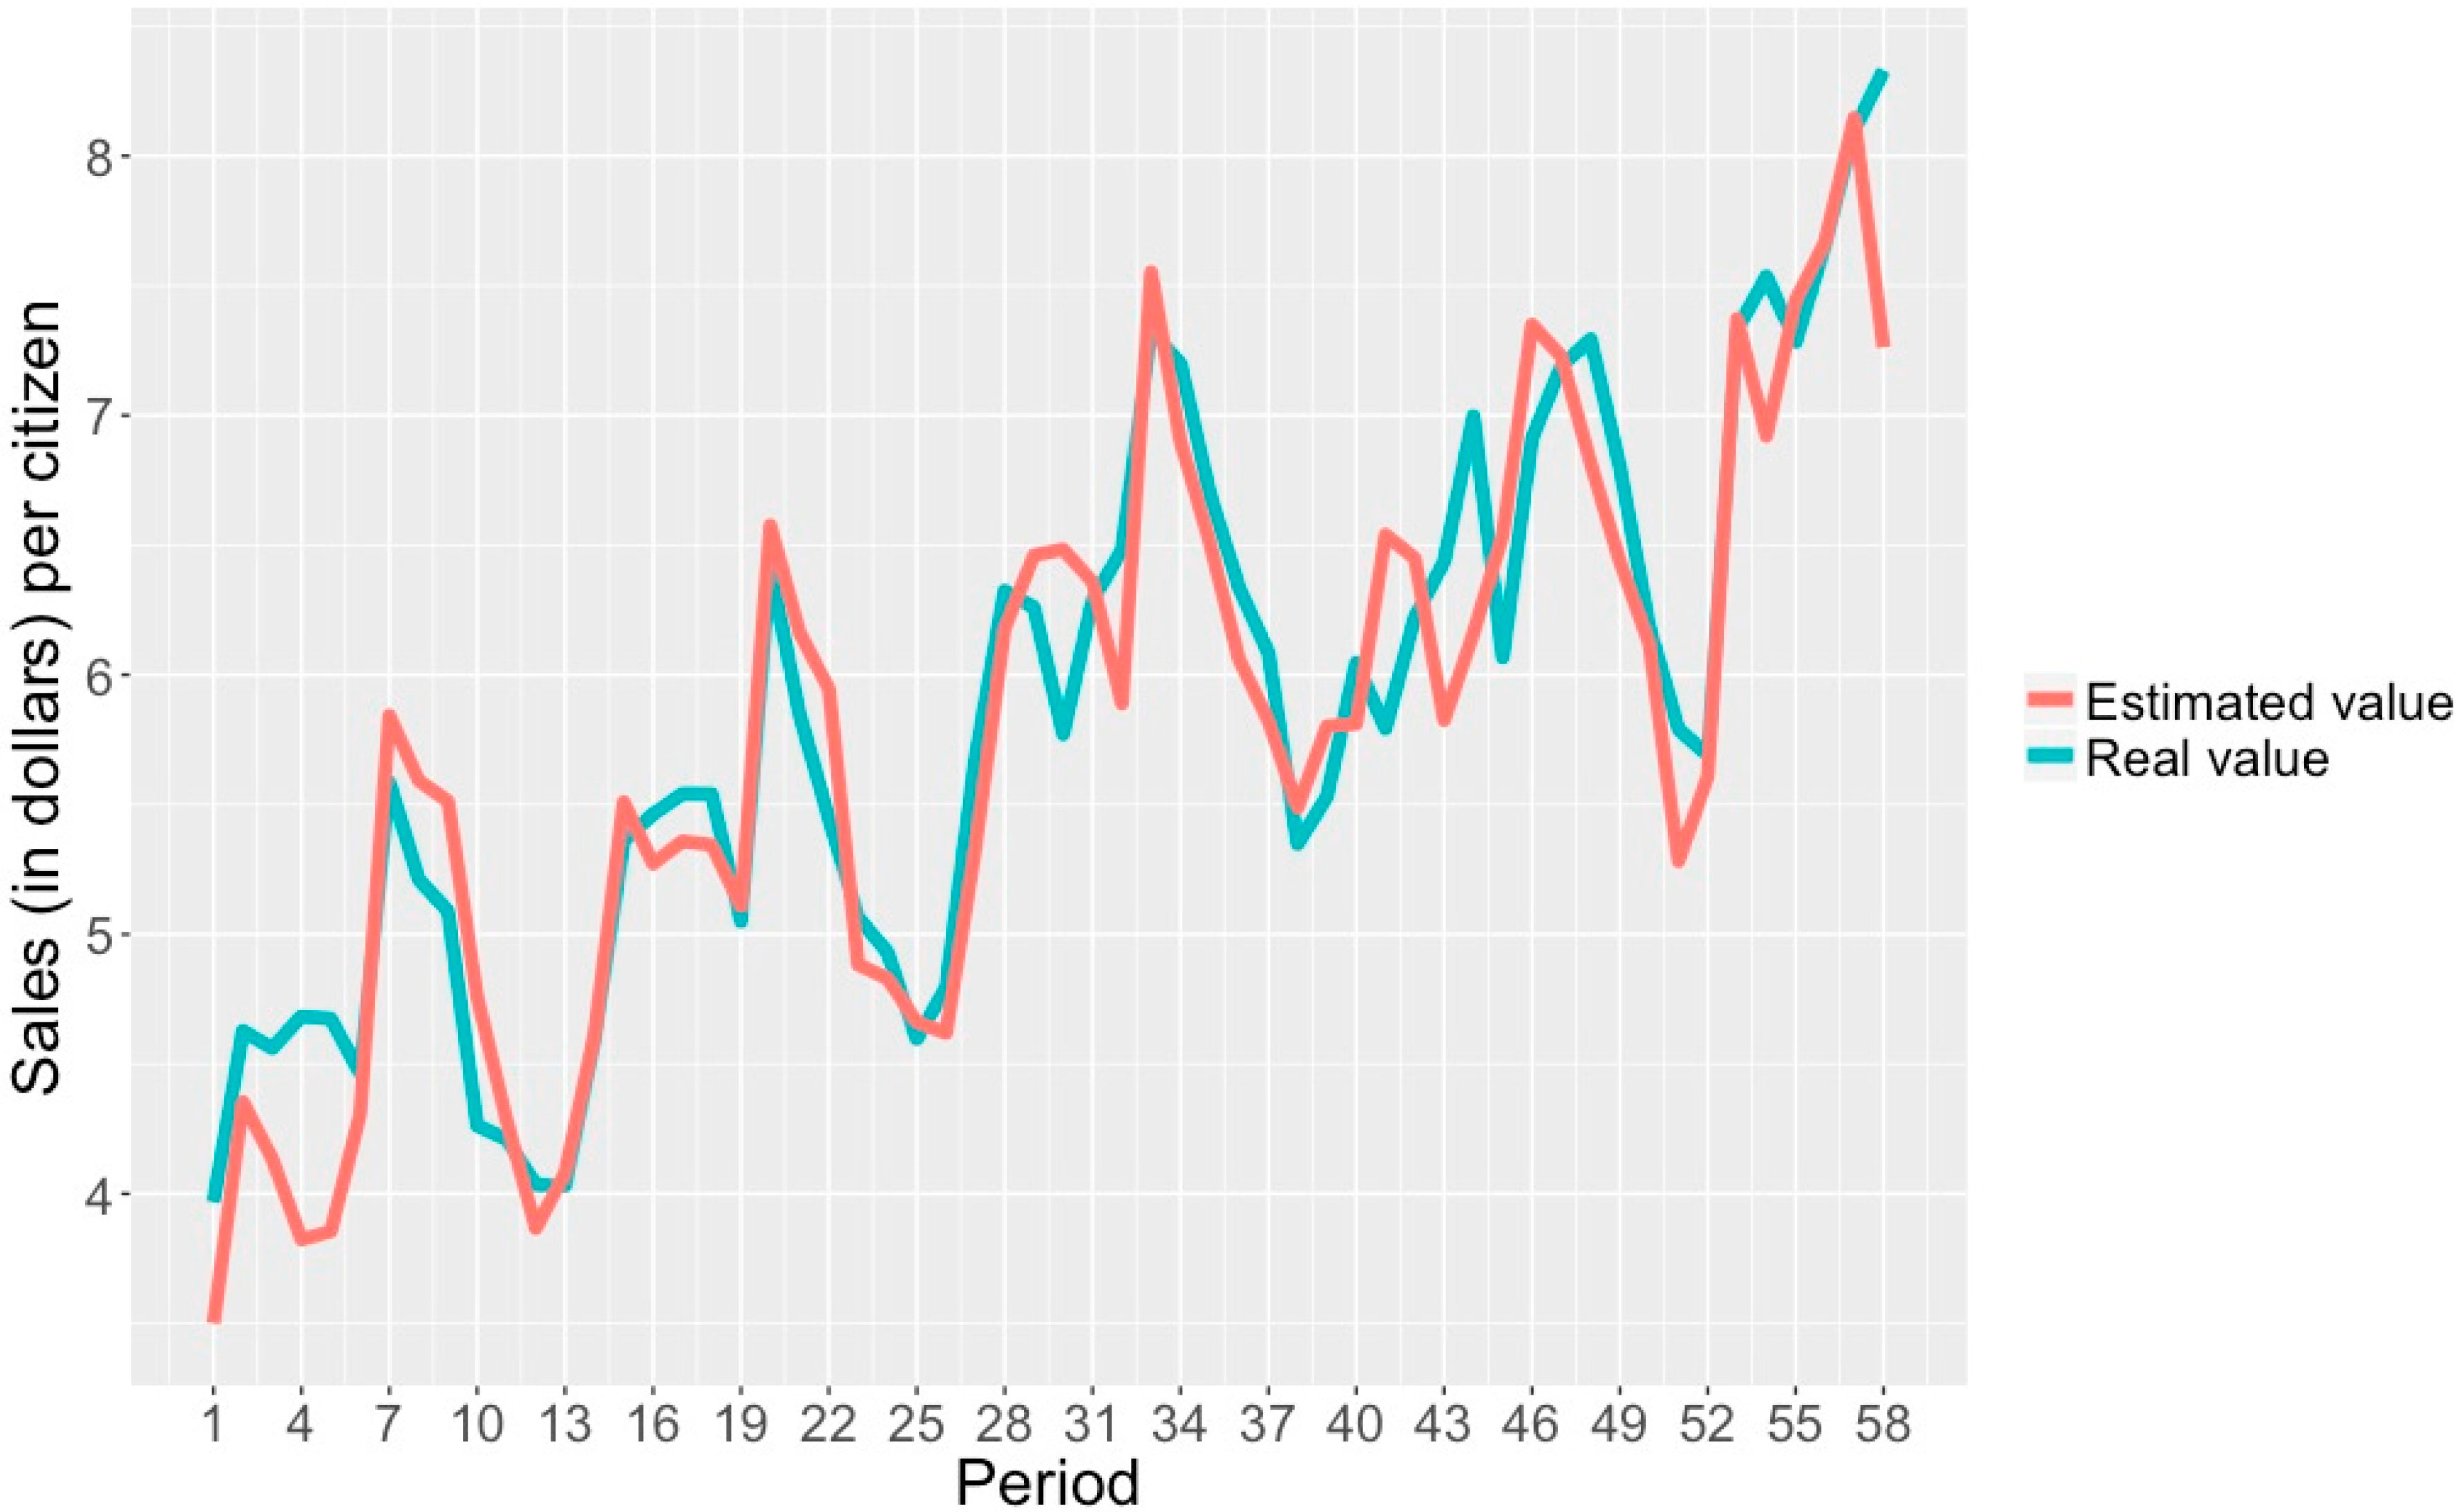
  • A correlation coefficient of 0.991, which indicates a high correlation between the attributes and the class studied.
  • An MAE of 0.564, showing the average difference of units/inhabitant between an estimated and a real class.
  • An RAE of 11.832%, indicating the percentage at which an estimated and a real class can differ.
The following are the main characteristics of the model generated for estimating the total sales:
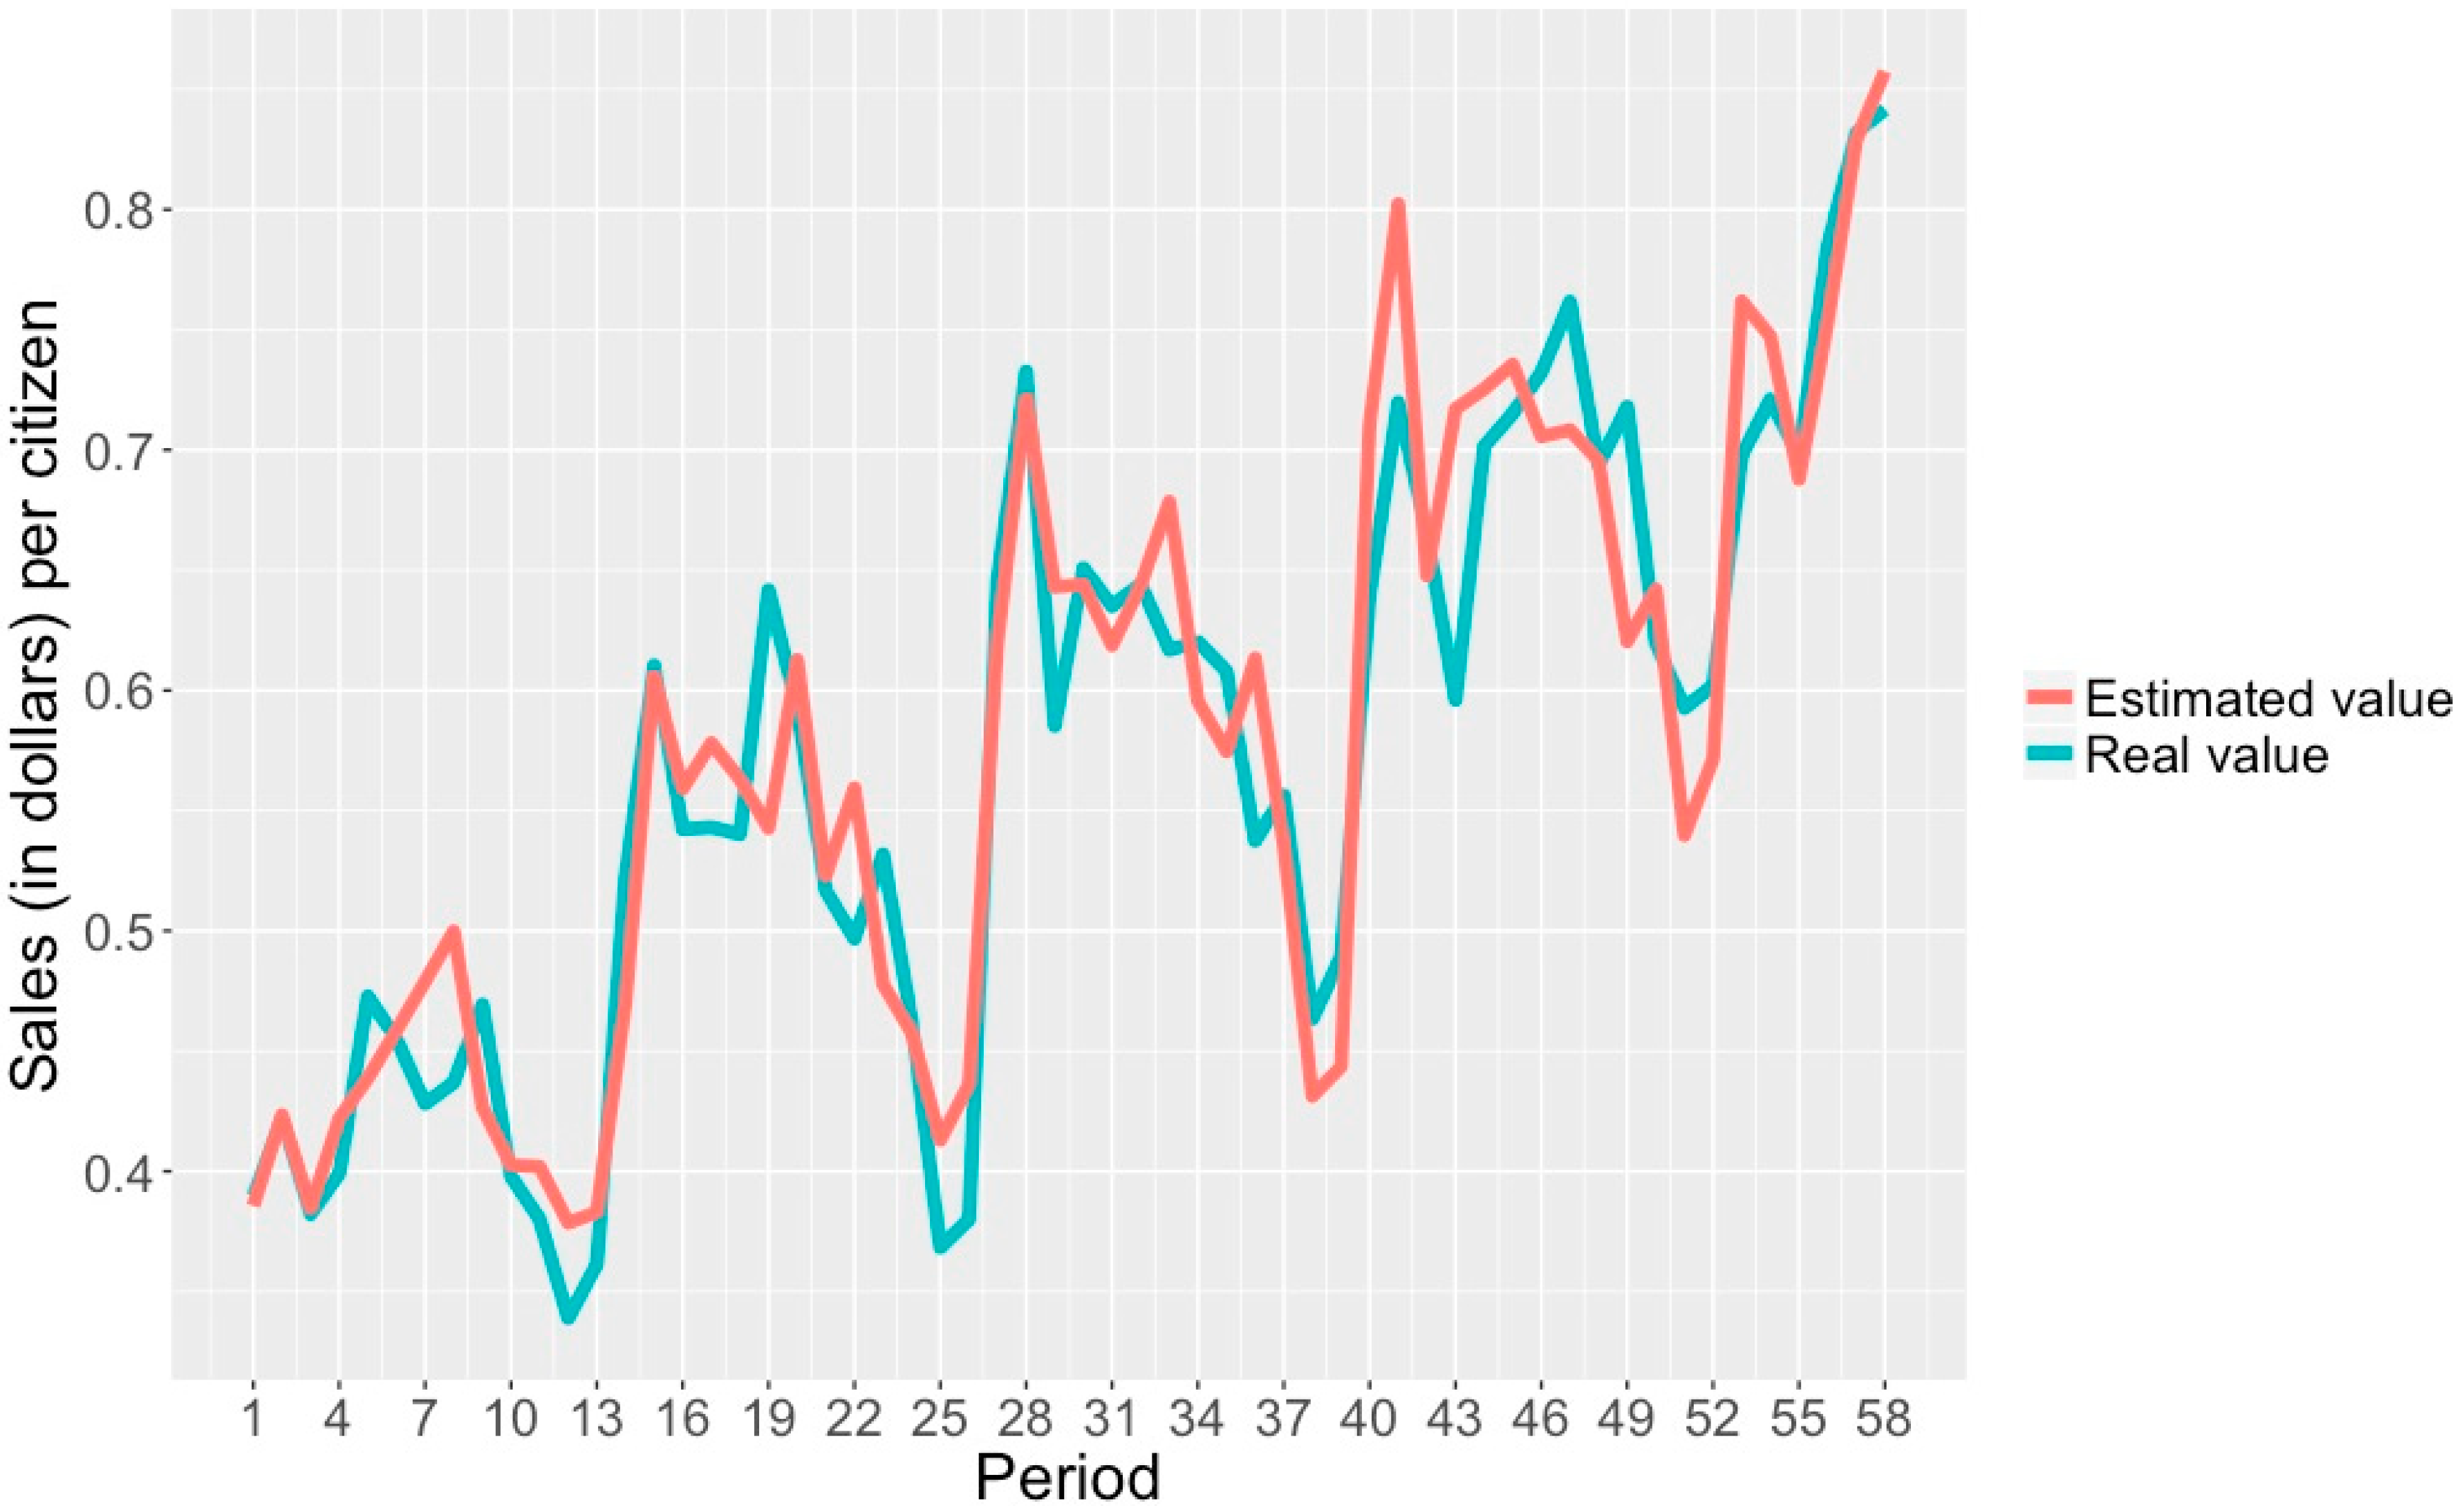
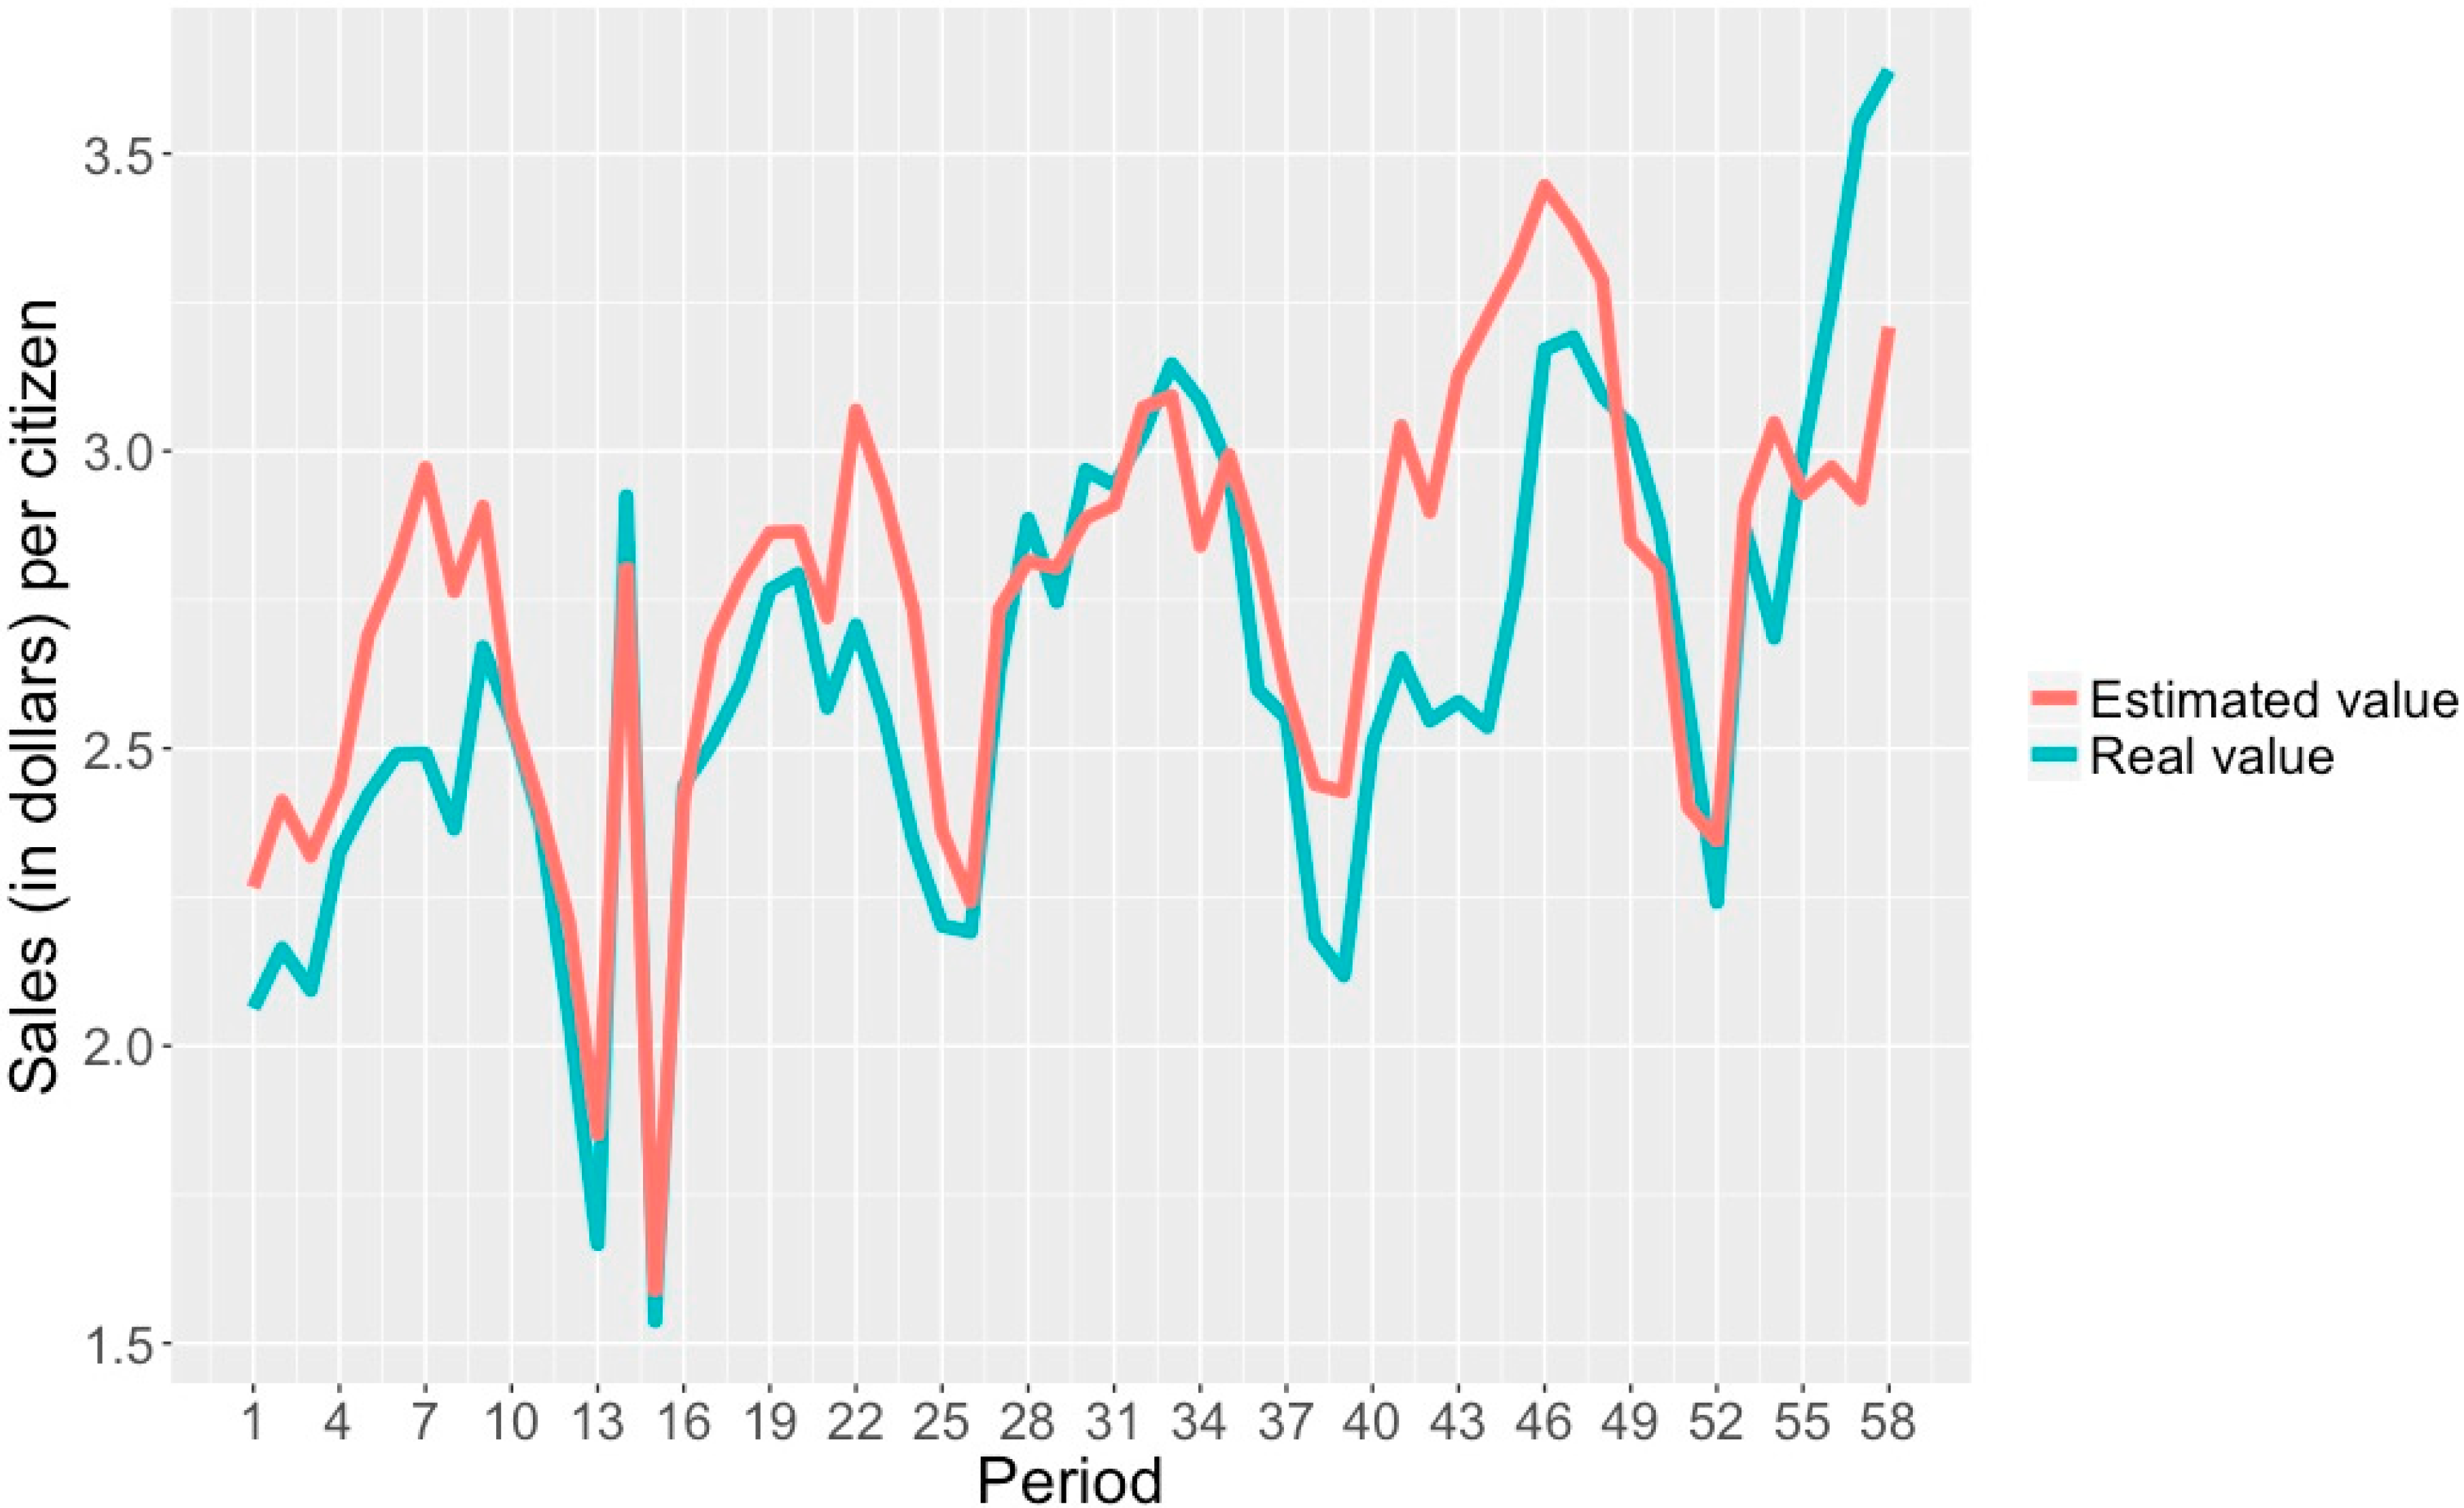
  • A correlation coefficient of 0.996, which shows a high correlation between attributes and class.
  • An MAE of 0.420, which indicates the average sales/inhabitant difference between an estimated class and a real class.
  • An RAE of 7.812%, showing the percentage at which an estimated and a real class can differ.
Once the appropriate algorithm was chosen, it was used to estimate the sales of avocados in different cities in the United States (in dollars), under certain weather conditions. Fifty-eight consecutive four-week periods were used to analyze the estimated value of the model against the real value. Figure 3 and Figure 4 show the comparison that was made with the real values of the classes, for the two cities of the dataset that have the highest (Orlando) and the lowest sales (Louisville).
In addition to the two cities with the highest and the lowest sales, a comparison was also made between two different cities in the United States. Figure 5 and Figure 6 show the analysis performed for Houston and Los Angeles, respectively.
From Figure 3, Figure 4, Figure 5 and Figure 6, actual data from the United States avocado market are compared to the data that was estimated using the models generated in the present investigation. These figures show the precision of the models that were created for forecasting the units sold and the total sales of avocados per inhabitant. Thus, such models can be an adequate tool to predict the fluctuation of the avocado market in the United States, knowing the weather conditions and the sales records of the immediately preceding year.

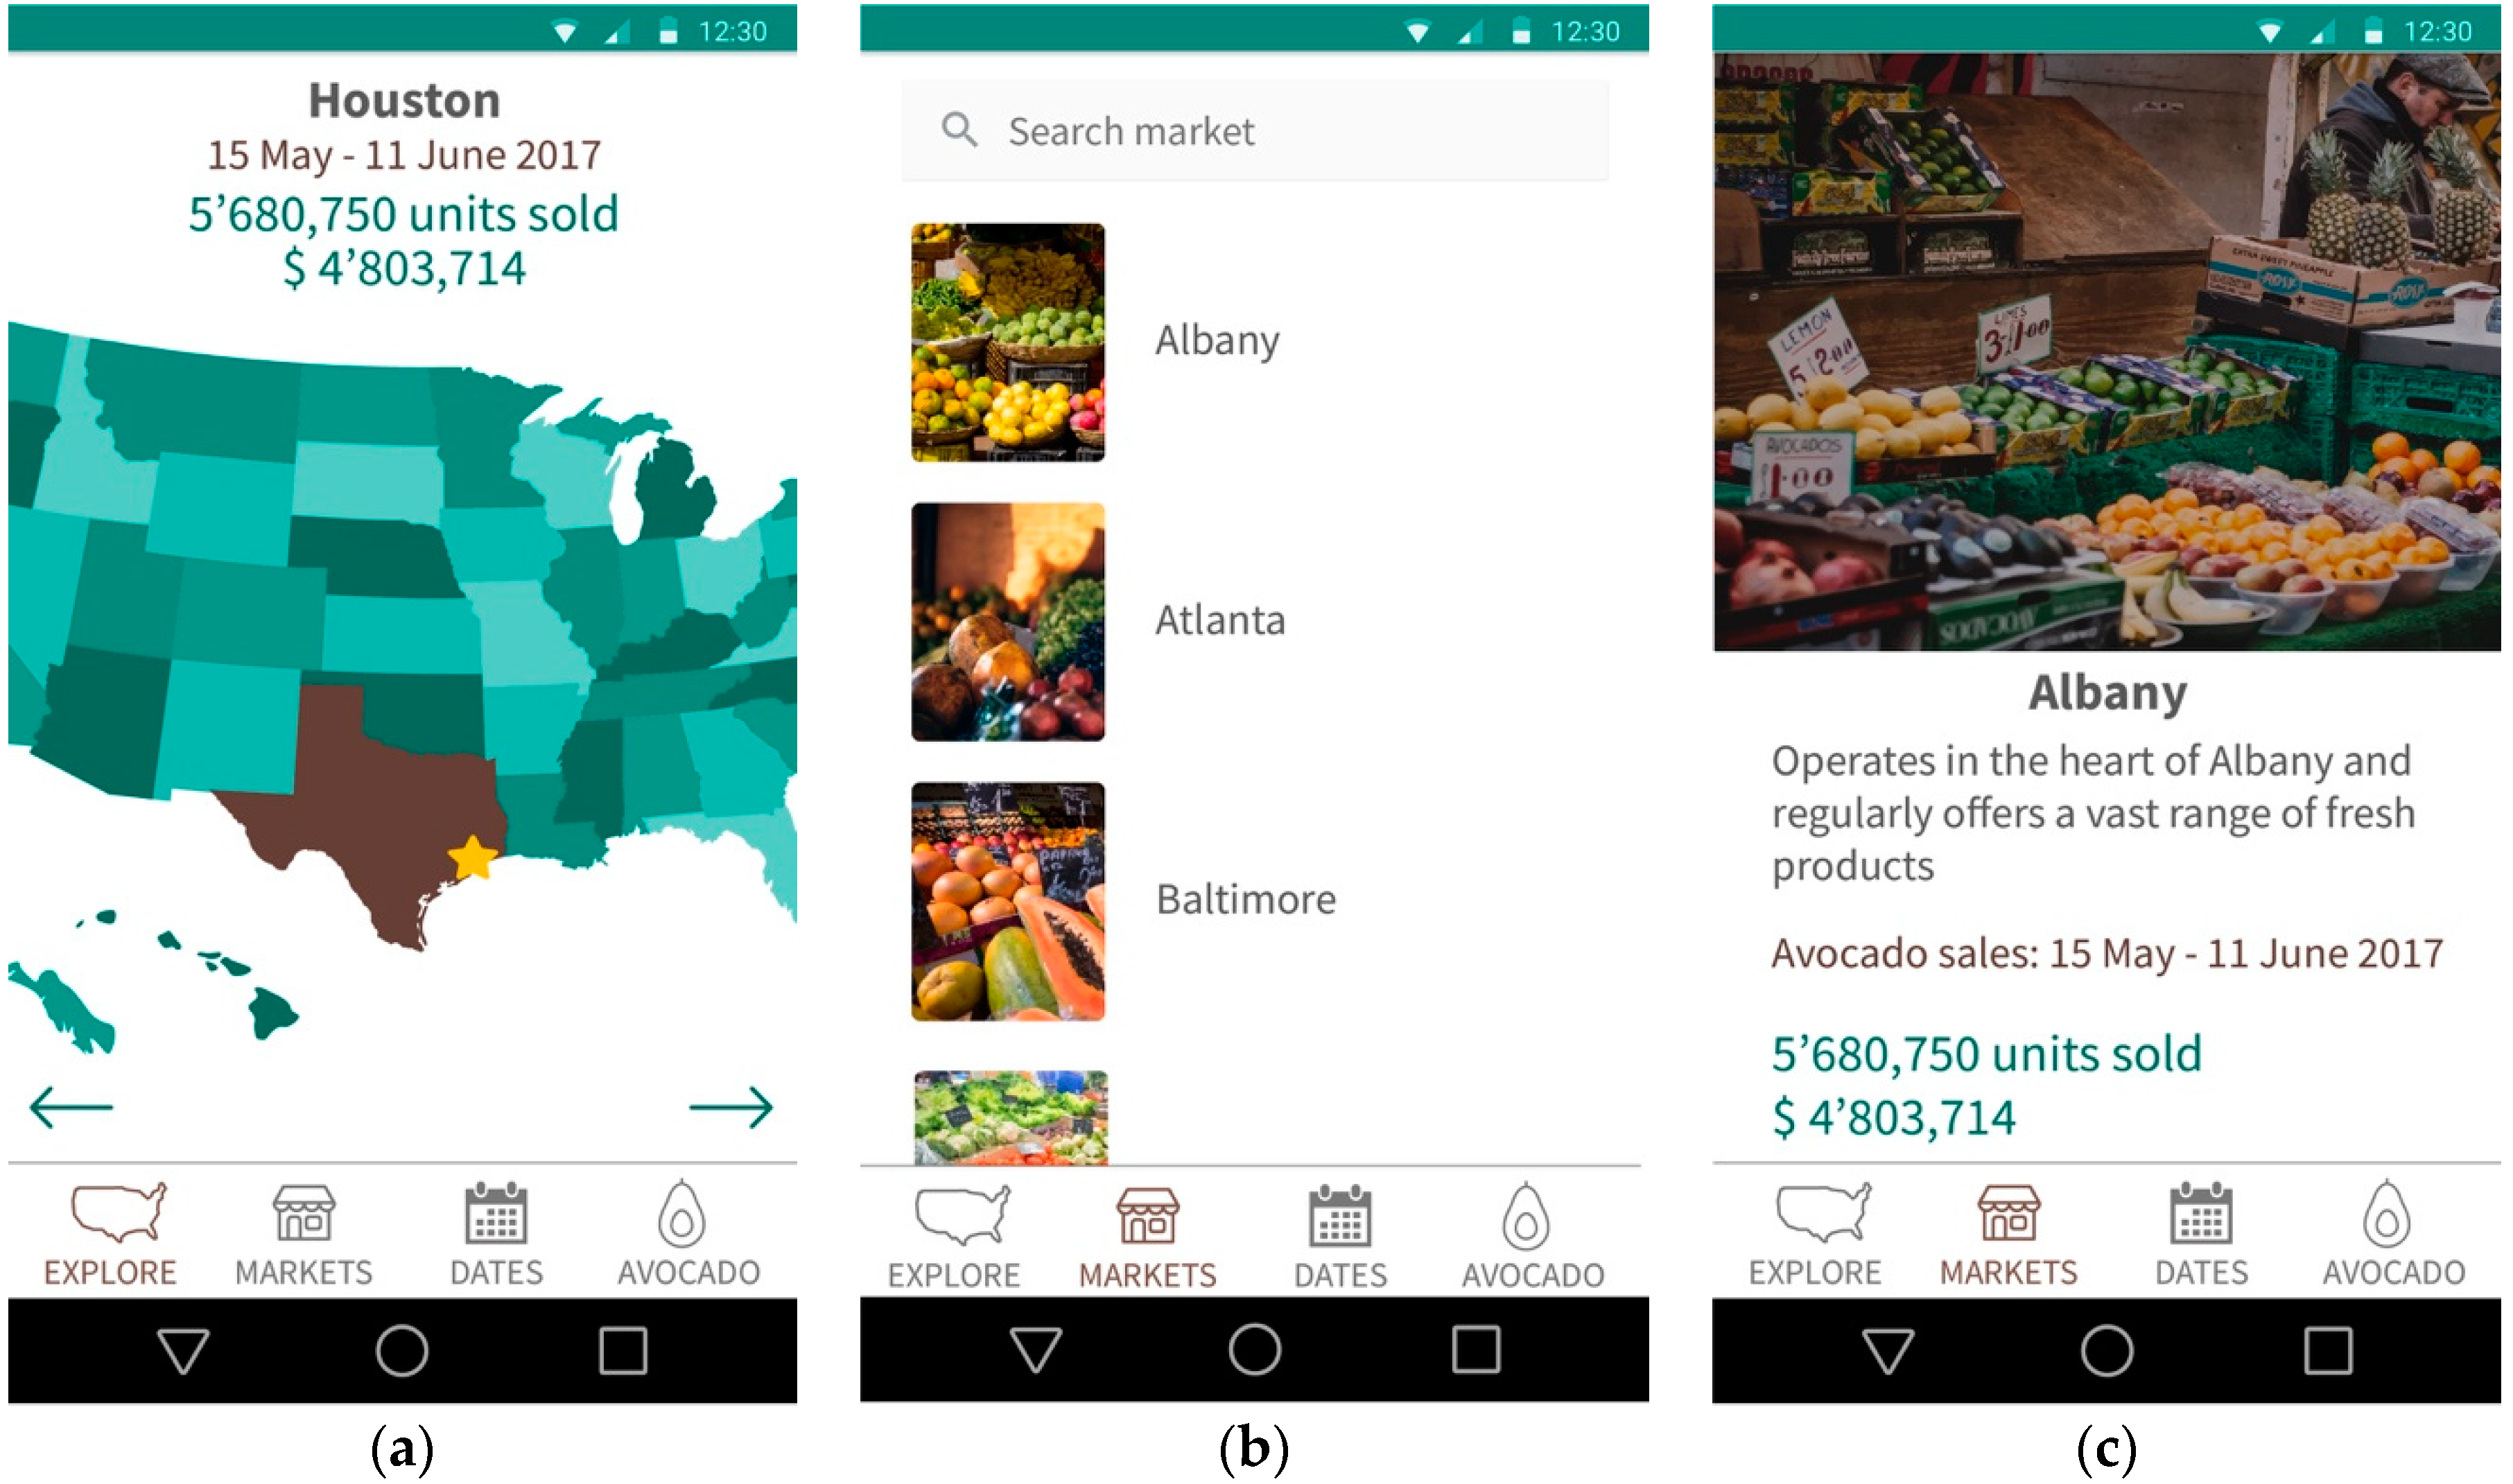
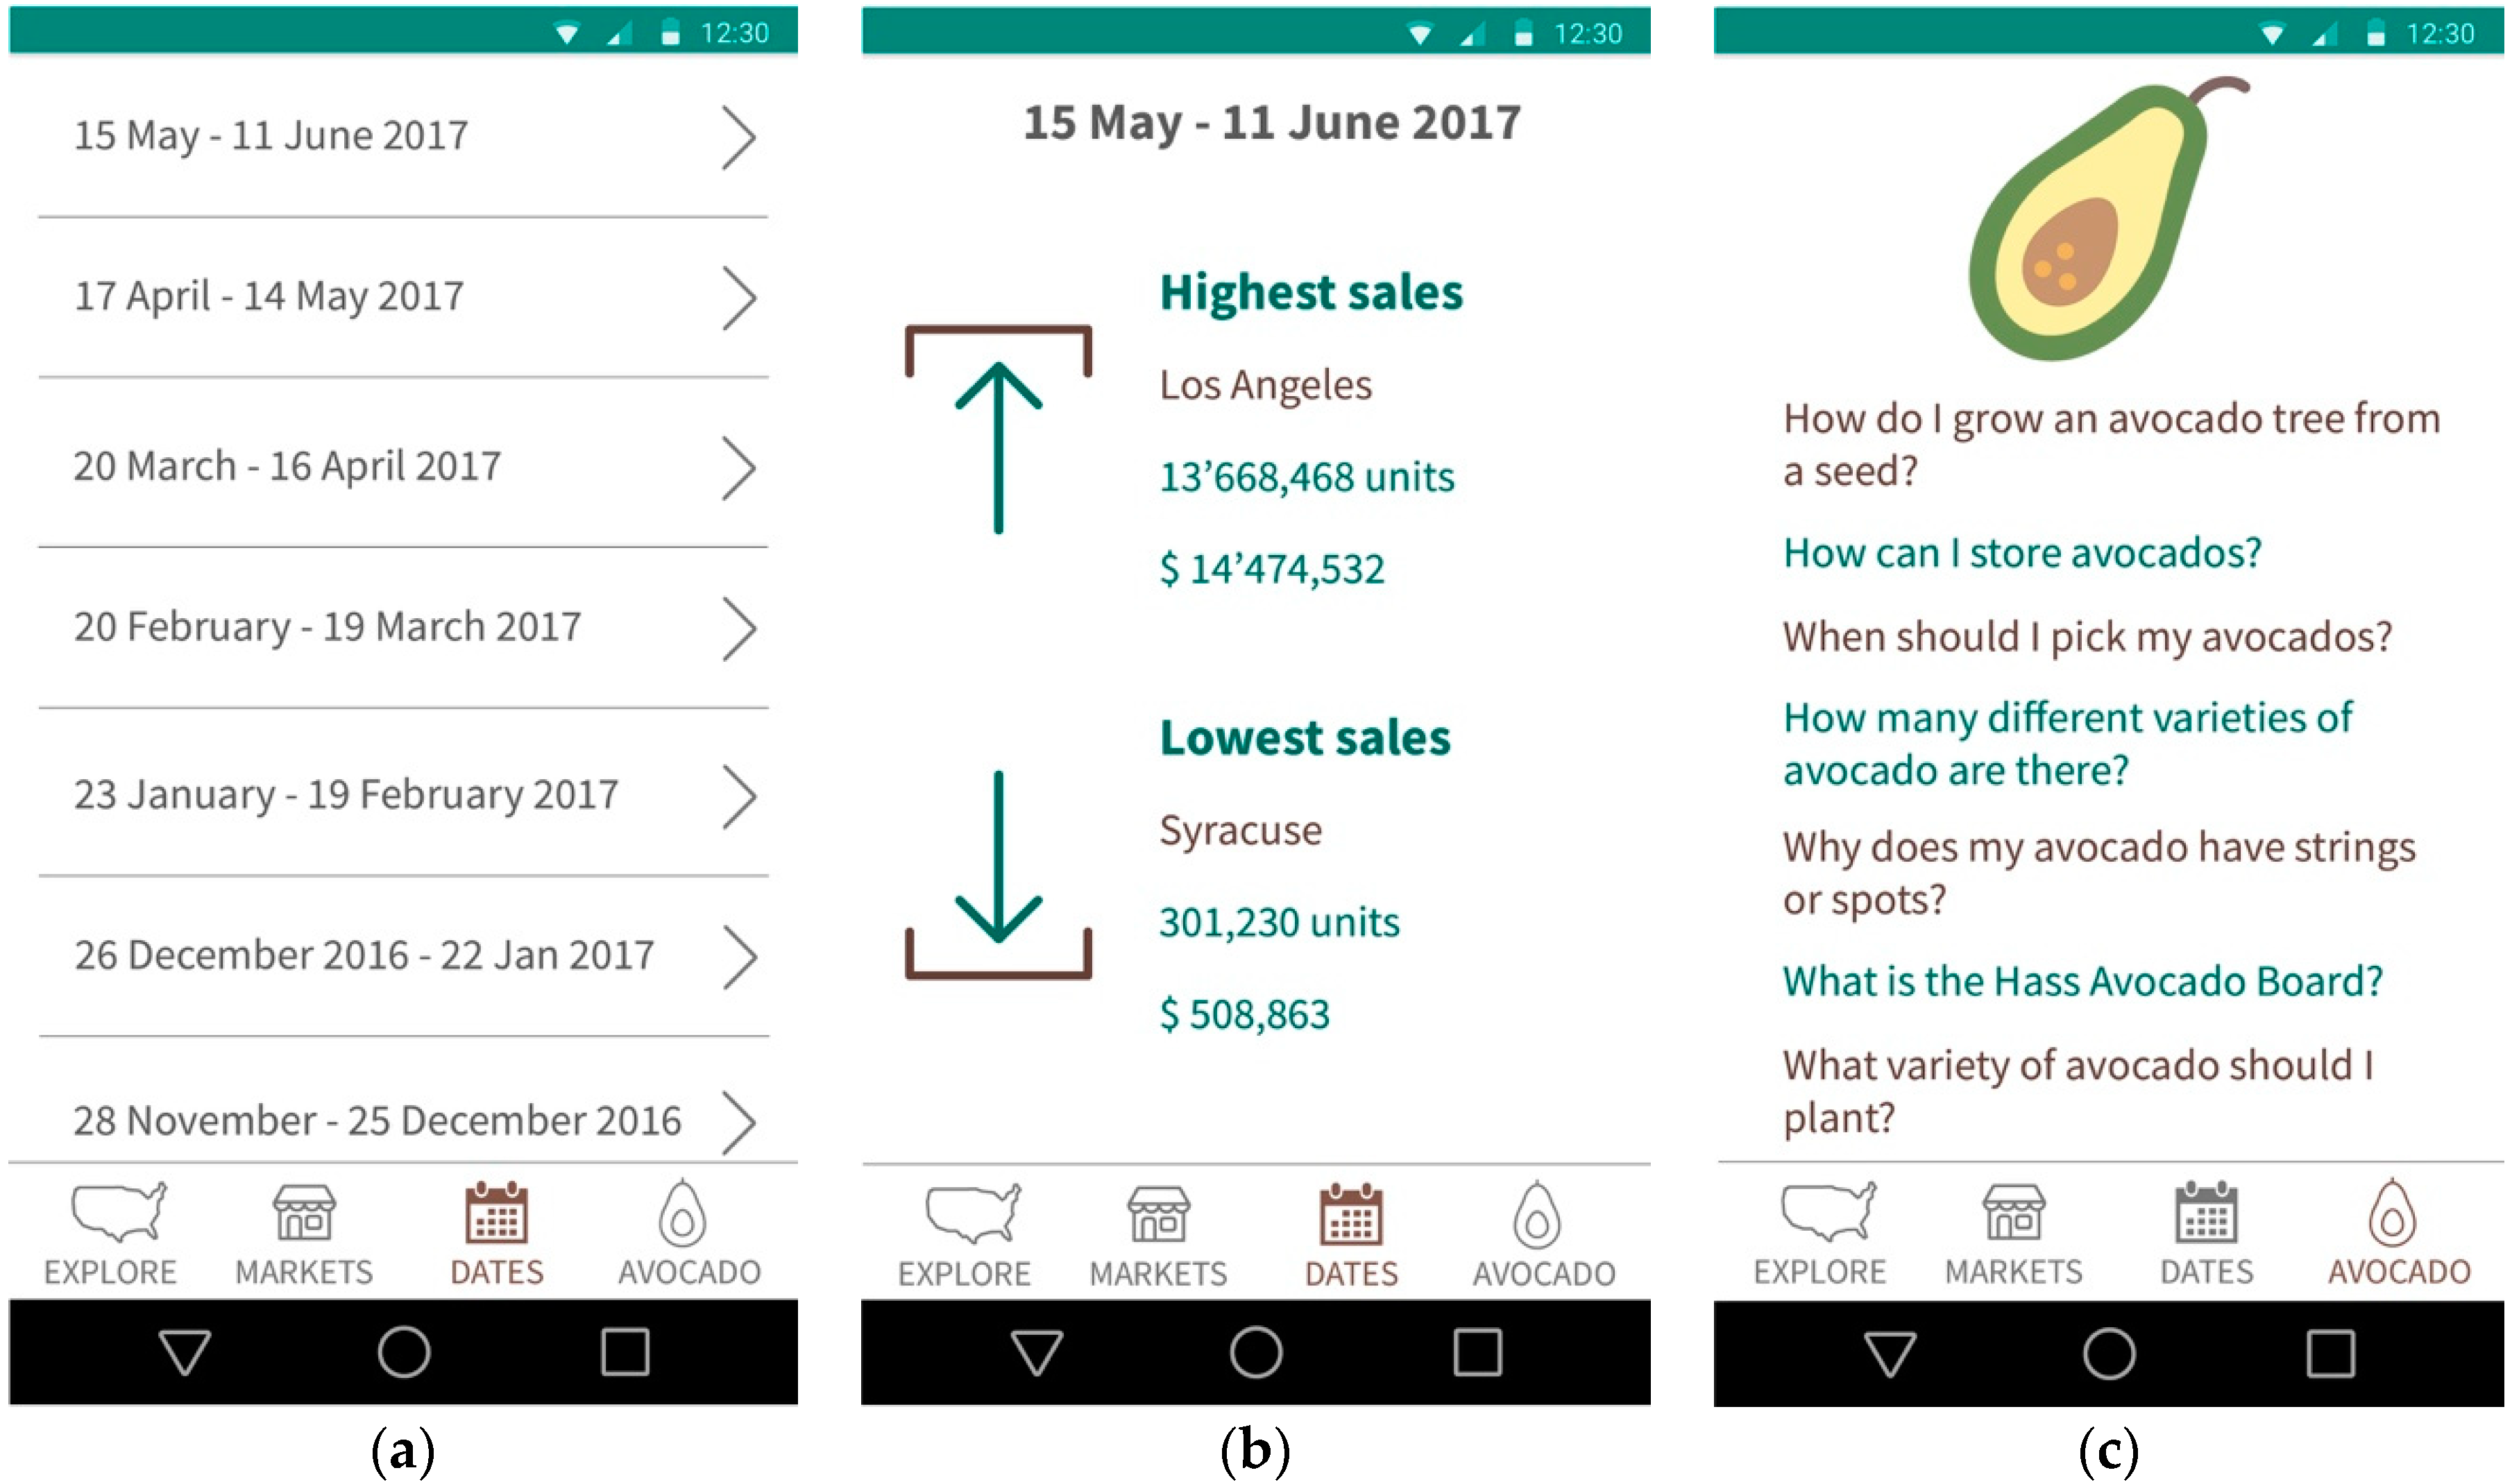
3.2. Mobile Application

Through a mobile application, users (associations, avocado producers, vendors and consumers) access the avocado market forecast to the United States. Figure 7 shows the system’s architecture. The app, through web services, consults the sales forecast that is calculated on the system server, hosted in the cloud. The calculation is made by the model trained using the Multivariate Regression Prediction algorithm which is presented in Section 3.1 and takes as the primary input the weather data and historical records on avocado sales. To represent these models, we used the Predictive Model Markup Language (PMML) proposed by the Data Mining Group [24], allowing its interoperability between different systems to be developed in one application and deployed on another. The data is retrieved from the official websites of the Hass Avocado Board program and the National Oceanic and Atmospheric Administration. This is stored in a database hosted on a server in the cloud, arranged for that purpose.
Next, we will present the main functionalities of the mobile application. On the first screen, presented in Figure 8a, the user can see the map of the United States with its states and, by clicking on one of them, the application automatically selects the city for which it has the data. Upon choosing the city, the number of units of avocado that are expected to be sold and the total income that could be generated in that city for a specific date appear at the top of the screen. Figure 8b shows the list of the cities for which the application allows for calculating the number of avocados that are expected to be sold and the income in dollars that such sales could generate. The user can access any of the cities that appear in the list and see more information about it. By accessing any of these, the user can see photos of such market, its name, location, general information, the possible number of units that can be sold and the amount in dollars for a specific date (see Figure 8c).
In addition, the application has a screen to access a list of the dates for which there are generated market forecasts, as it can be seen in Figure 9a. By selecting one of the future periods presented in the previous list, the application displays (see Figure 9b) a general summary of the avocado market in the United States, in which two markets are presented (along with the sales information on them); first, the one where the highest sales are expected for the chosen date; and, secondly, the one where the lowest sales are expected. In Figure 9c, the last screen of the application is shown, on which the user has the possibility of observing a list of frequently asked questions about avocados.

4. Discussion and Future Works

Several aspects of the results achieved can be discussed. On the one hand, in the United States, governmental entities or companies financed by the state have a considerable amount of data available, which can be the basis for different studies in various areas of knowledge. The data used in this paper presented a problem of heterogeneity which was addressed in the pre-processing phase and could be further analyzed in a future paper. Pre-processing is necessary to increase the quality of the data when collected from different sources because it may present problems which affect the accuracy of the models generated. On the other hand, the four algorithms used for the generated models showed a good behavior. The accuracy of the algorithms was evaluated and the Support Vector Machine for Regression and the Multivariate Regression Prediction Model had the best results, with a correlation coefficient of 0.995 and 0.996, respectively. These algorithms were chosen based on previous studies conducted by the researchers involved in this paper; however, this does not exclude the possibility that other algorithms or approaches could be further analyzed in future works. For example, if the sale and climate data of avocado are ordered chronologically, they can be considered as a time-series forecasting problem. Therefore, approaches such as linear and nonlinear machine learning algorithms, metaheuristic algorithms [25], genetic algorithms [26,27], and deep learning [28] could be used to estimate avocado sales and compare it with the approach presented in this paper.
Information about the world market and its trends is gaining importance to researchers because it can be used to reduce inventory cost, modify sales strategies, minimize expired products, among others. Due to the aforementioned benefits, there exist different approaches that allow people to estimate sales. Ref. [29] presents a time series forecast for fashion sales; Ref. [30] exposes a sales prediction model for retail stores; and Refs. [31,32] propose machine learning models to predict specific companies’ sales. In our case, the presented approach could help producers and vendors in several aspects. The models that were generated allow for estimating the profits in dollars and the number of avocados that will be sold in the markets of the United States, based on the climatic conditions that could occur. Evaluating the two variables mentioned above allows us to have a view on the future fluctuation of the avocado market in the United States. This information can be the basis for producers to decide which market they will sell their product on. Furthermore, supermarket chains or vendors could estimate future sales for administrative or accounting purposes. In addition, such information on market fluctuation can be used by associations and government entities to design and deploy policies or campaigns to promote the avocado production, sale, and healthy consumption. The policies may be aimed at issues such as having pest-free fields, compliance with phytosanitary standards and the development of competitiveness, production and commercialization factors, among others.
As a future work, we propose using additional weather information in order to complete a system that can forecast avocado sales with higher accuracy in the markets in the United States. We also propose to improve the system, using other important parameters, as the imported and produced avocados number, and to train it to estimate not only sales but also other variables, such as price and best variety for markets in the United States and in other countries.

Supplementary Materials

The dataset used is available at https://goo.gl/bRjvoz.

Author Contributions

J.R., E.L., and J.C. conceived the analysis and the experiments. J.R. developed the research and lead data collection. J.R., E.L., and J.C. performed the analysis. J.R. prepared the original draft. E.L. and J.C. reviewed the paper. All authors have read and approved the final manuscript.

Funding

The APC was funded by InnovAcción Cauca—Announcement 03-2018.

Acknowledgments

The authors are grateful to the Telematics Engineering Group (GIT) of the University of Cauca, to InnovAcción Cauca for the MSc scholarship granted to Juan Rincon-Patino and to the Project “Alternativas Innovadoras de Agricultura Inteligente para sistemas productivos agrícolas del departamento del Cauca soportado en entornos de IoT–ID 4633” financed by “Convocatoria 04C–2018 del Banco de Proyectos Conjuntos UEES-Sostenibilidad” of the Project InnovAcción Cauca.

Conflicts of Interest

The authors declare no conflict of interest.

References

  1. Dreher, M.L.; Davenport, A.J. Hass avocado composition and potential health effects. Crit. Rev. Food Sci. Nutr. 2013, 53, 738–750. [Google Scholar] [CrossRef] [PubMed]
  2. Ayala Silva, T.; Ledesma, N. Avocado History, Biodiversity and Production. In Sustainable Horticultural Systems: Issues, Technology and Innovation; Nandwani, D., Ed.; Springer International Publishing: Cham, Switzerland, 2014; pp. 157–205. ISBN 978-3-319-06904-3. [Google Scholar]
  3. Cavaletto, G. The avocado market in the United States. In Proceedings of the VIII Congreso Mundial de la Palta 2015, Lima, Peru, 13–18 September 2015; pp. 463–466. Available online: http://www.avocadosource.com/WAC8/Section_07/CavalettoGiovanni2015.pdf (accessed on 28 September 2018).
  4. Furuya, J.; Kobayashi, S.; Yamauchi, K. Impacts of climate change on rice market and production capacity in the Lower Mekong Basin. Paddy Water Environ. 2014, 12, 255–274. [Google Scholar] [CrossRef]
  5. Kang, S.H.; Jiang, Z.; Lee, Y.; Yoon, S.-M. Weather effects on the returns and volatility of the Shanghai stock market. Phys. A Stat. Mech. Appl. 2010, 389, 91–99. [Google Scholar] [CrossRef]
  6. Murray, K.B.; Di Muro, F.; Finn, A.; Leszczyc, P.P. The effect of weather on consumer spending. J. Retail. Consum. Serv. 2010, 17, 512–520. [Google Scholar] [CrossRef] [Green Version]
  7. Symeonidis, L.; Daskalakis, G.; Markellos, R.N. Does the weather affect stock market volatility? Financ. Res. Lett. 2010, 7, 214–223. [Google Scholar] [CrossRef] [Green Version]
  8. Corrales, D.C.; Corrales, J.C.; Figueroa-Casas, A. Towards Detecting Crop Diseases and Pest by Supervised Learning. Ing. Univ. 2015, 19, 207–228. [Google Scholar] [CrossRef]
  9. Plazas, J.E.; López, I.D.; Corrales, J.C. A Tool for Classification of Cacao Production in Colombia Based on Multiple Classifier Systems. In Computational Science and Its Applications—ICCSA 2017, Proceedings of International Conference on Computational Science and Its Applications, Trieste, Italy, 3–6 July 2017; Springer International Publishing: Cham, Switzerland, 2017; pp. 60–69. ISBN 978-3-319-62395-5. [Google Scholar]
  10. Corrales, D.C.; Casas, A.F.; Ledezma, A.; Corrales, J.C. Two-Level Classifier Ensembles for Coffee Rust Estimation in Colombian Crops. Int. J. Agric. Environ. Inf. Syst. 2016, 7, 41–59. [Google Scholar] [CrossRef]
  11. Lasso, E.; Valencia, Ó.; Corrales, J.C. Decision Support System for Coffee Rust Control Based on Expert Knowledge and Value-Added Services. In Computational Science and Its Applications—ICCSA 2017, Proceedings of International Conference on Computational Science and Its Applications, Trieste, Italy, 3–6 July 2017; Springer International Publishing: Cham, Switzerland, 2017; pp. 70–83. ISBN 978-3-319-62395-5. [Google Scholar]
  12. Carman, H.; Li, L.; Sexton, R. Can Improved Market Information Benefit Both Producers and Consumers? Evidence from the Hass Avocado Board’s Internet Information Program. Agric. Resour. Econ. Updat. 2010, 13, 5–8. [Google Scholar]
  13. Carman, H. California farmers adapt mandated marketing programs to the 21st century. Calif. Agric. 2007, 61, 177–183. [Google Scholar] [CrossRef] [Green Version]
  14. Chapman, P.; Clinton, J.; Kerber, R.; Khabaza, T.; Reinartz, T.; Shearer, C.; Wirth, R. CRISP-DM 1.0 Step-by-Step Data Mining Guide; SPSS: Armonk, NY, USA, 2000. [Google Scholar]
  15. Corrales, D.C.; Corrales, J.C.; Ledezma, A. How to Address the Data Quality Issues in Regression Models: A Guided Process for Data Cleaning. Symmetry 2018, 10, 99. [Google Scholar] [CrossRef]
  16. Rasouli, K.; Hsieh, W.W.; Cannon, A.J. Daily streamflow forecasting by machine learning methods with weather and climate inputs. J. Hydrol. 2012, 414–415, 284–293. [Google Scholar] [CrossRef]
  17. Skrepnek, G.H. Regression methods in the empiric analysis of health care data. J. Manag. Care Pharm. 2005, 11, 240–251. [Google Scholar] [CrossRef] [PubMed]
  18. Clark, J.E.; Osborne, J.W.; Gallagher, P.; Watson, S. A simple method for optimising transformation of non-parametric data: An illustration by reference to cortisol assays. Hum. Psychopharmacol. 2016, 31, 259–267. [Google Scholar] [CrossRef] [PubMed]
  19. Benjamini, Y.; Leshno, M. Statistical Methods for Data Mining. In Data Mining and Knowledge Discovery Handbook; Maimon, O., Rokach, L., Eds.; Springer: Boston, MA, USA, 2005; pp. 565–587. ISBN 978-0-387-25465-4. [Google Scholar]
  20. Zhang, G.P. Neural Networks for Data Mining. In Data Mining and Knowledge Discovery Handbook; Maimon, O., Rokach, L., Eds.; Springer: Boston, MA, USA, 2010; pp. 419–444. ISBN 978-0-387-09823-4. [Google Scholar]
  21. Shmilovici, A. Support Vector Machines. In Data Mining and Knowledge Discovery Handbook; Maimon, O., Rokach, L., Eds.; Springer: Boston, MA, USA, 2005; pp. 257–276. ISBN 978-0-387-25465-4. [Google Scholar]
  22. Rokach, L.; Maimon, O. Classification Trees. In Data Mining and Knowledge Discovery Handbook; Maimon, O., Rokach, L., Eds.; Springer: Boston, MA, USA, 2010; pp. 149–174. ISBN 978-0-387-09823-4. [Google Scholar]
  23. Kohavi, R. A Study of Cross-validation and Bootstrap for Accuracy Estimation and Model Selection. In Proceedings of the 14th International Joint Conference on Artificial Intelligence, Montreal, QC, Canada, 20–25 August 1995; Morgan Kaufmann Publishers Inc.: San Francisco, CA, USA, 1995; pp. 1137–1143. [Google Scholar]
  24. Guazzelli, A.; Zeller, M.; Lin, W.-C.; Williams, G. PMML: An Open Standard for Sharing Models. R. J. 2009, 1, 60–65. [Google Scholar]
  25. Behnamian, J.; Ghomi, S.M.T.F. Development of a PSO–SA hybrid metaheuristic for a new comprehensive regression model to time-series forecasting. Expert Syst. Appl. 2010, 37, 974–984. [Google Scholar] [CrossRef]
  26. Chen, R.; Liang, C.-Y.; Hong, W.-C.; Gu, D.-X. Forecasting holiday daily tourist flow based on seasonal support vector regression with adaptive genetic algorithm. Appl. Soft Comput. 2015, 26, 435–443. [Google Scholar] [CrossRef]
  27. Liu, D.; Niu, D.; Wang, H.; Fan, L. Short-term wind speed forecasting using wavelet transform and support vector machines optimized by genetic algorithm. Renew. Energy 2014, 62, 592–597. [Google Scholar] [CrossRef]
  28. Langkvist, M.; Karlsson, L.; Loutfi, A. A review of unsupervised feature learning and deep learning for time-series modeling. Pattern Recognit. Lett. 2014, 42, 11–24. [Google Scholar] [CrossRef] [Green Version]
  29. Choi, T.; Hui, C.; Yu, Y. Intelligent time series fast forecasting for fashion sales: A research agenda. In Proceedings of the 2011 International Conference on Machine Learning and Cybernetics, Guilin, China, 10–13 July 2011; pp. 1010–1014. [Google Scholar]
  30. Kaneko, Y.; Yada, K. A Deep Learning Approach for the Prediction of Retail Store Sales. In Proceedings of the 2016 IEEE 16th International Conference on Data Mining Workshops (ICDMW), Barcelona, Spain, 12–15 December 2016; pp. 531–537. [Google Scholar]
  31. Gao, M.; Xu, W.; Fu, H.; Wang, M.; Liang, X. A Novel Forecasting Method for Large-Scale Sales Prediction Using Extreme Learning Machine. In Proceedings of the 2014 Seventh International Joint Conference on Computational Sciences and Optimization, Beijing, China, 4–6 July 2014; pp. 602–606. [Google Scholar]
  32. Gurnani, M.; Korke, Y.; Shah, P.; Udmale, S.; Sambhe, V.; Bhirud, S. Forecasting of sales by using fusion of machine learning techniques. In Proceedings of the 2017 International Conference on Data Management, Analytics and Innovation (ICDMAI), Pune, India, 24–26 February 2017; pp. 93–101. [Google Scholar]
Figure 1. Data preparation process, adapted from [14].
Sustainability 10 03498 g001
Figure 2. Data cleaning process, adapted from [15].
Sustainability 10 03498 g002
Figure 3. Comparison between estimated value vs. real value of sales in dollars per inhabitant in Orlando.
Sustainability 10 03498 g003
Figure 4. Comparison between estimated value vs. real value of sales in dollars per inhabitant in Louisville.
Sustainability 10 03498 g004
Figure 5. Comparison between estimated value vs. real value of sales in dollars per inhabitant in Houston.
Sustainability 10 03498 g005
Figure 6. Comparison between estimated value vs. real value of sales in dollars per inhabitant in Los Angeles.
Sustainability 10 03498 g006
Figure 7. System’s architecture.
Sustainability 10 03498 g007
Figure 8. Left to right: (a) main screen of the mobile application; (b) screen with the list of available markets; (c) screen with information on the market of a selected city.
Sustainability 10 03498 g008
Figure 9. Left to right: (a) screen with the list of available dates; (b) screen with the summary of the avocado market in the United States; (c) screen with general information on avocados.
Sustainability 10 03498 g009
Table 1. Attributes of the final datasets.
DatasetAttributesClass
1Weather (maximum temperature, minimum temperature, average temperature, maximum humidity, minimum humidity, average humidity and precipitation) and Units-pyUnits-cy
2Weather and Sales-pySales-cy
3Weather and Ln(Units-py)Ln(Units-cy)
4Weather and Ln(Sales-py)Ln(Sales-cy)
5Weather and Units-py/populationUnits-cy/population
6Weather and Sales-py/populationSales-cy/population
Table 2. Experimental results of the Linear Regression and Multilayer Perceptron algorithms for the different datasets.
Dataset—ClassLinear RegressionMultilayer Perceptron
CCMAERAE (%)CCMAERAE (%)
DS1—Units0.981220,443.40716.6830.976278,670.94821.091
DS2—Sales0.992139,969.70510.6110.988188,091.63614.259
DS3—Ln(Units)0.9850.11816.0920.9800.13618.527
DS4—Ln(Sales)0.9930.07410.6450.9910.08612.226
DS5—Units/pop.0.9910.58912.3820.9920.70514.802
DS6—Sales/pop.0.9950.4358.0790.9950.57910.763
Table 3. Experimental results of the Support Vector Machine for Regression and Multivariate Regression Prediction Model algorithms for the different datasets.
Dataset—ClassSupport Vector Machine for RegressionMultivariate Regression Prediction Model
CCMAERAE (%)CCMAERAE (%)
DS1—Units0.981216,730.96916.4020.981220,443.40716.684
DS2—Sales0.992138,254.83810.4810.992139,966.26110.611
DS3—Ln(Units)0.9850.11816.0580.9850.11816.092
DS4—Ln(Sales)0.9930.07410.6290.9930.07410.645
DS5—Units/pop.0.9910.57512.080.9910.56411.832
DS6—Sales/pop.0.9950.4297.9710.9960.4207.812

