
The Influence of Nitrogen and Phosphorus Addition on Growth of the Invasive C4 Grass Saccharum spontaneum


1
Department of Ecology and Evolutionary Biology, University of California, Santa Cruz, CA 95060, USA
2
Department Environmental Studies, University of California, Santa Cruz, CA 95064, USA
*
Author to whom correspondence should be addressed.
Int. J. Plant Biol. 2023, 14(2), 474-482; https://doi.org/10.3390/ijpb14020036
Submission received: 29 April 2023
/
Revised: 19 May 2023
/
Accepted: 19 May 2023
/
Published: 20 May 2023
(This article belongs to the Topic Plant Invasion)
Abstract
:Invasive C4 grasses can inhibit the natural regeneration of secondary forest in tropical landscapes after the cessation of intensive use for grazing and agriculture. In Panama, invasive Saccharum spontaneum forms dense stands that require active management to re-establish forest successional processes. In this region, restoration strategies typically involve clearing grass cover manually and applying fertilizer prior to planting tree seedlings. However, if fertilizers alleviate nutrient limitation and enhance grass competition with tree seedlings, these practices may exacerbate the costs of Saccharum control and hamper restoration goals. Here, we evaluated how S. spontaneum responds to nitrogen and phosphorus addition in the field to determine whether S. spontaneum is nutrient limited in this system. S. spontaneum was limited by both nitrogen and phosphorus, as revealed through increased foliar nutrient concentrations. S. spontaneum biomass was significantly greater in both nitrogen and phosphorus addition plots after both the first growth period (early rainy season) and second growth period (late rainy season), with stronger effects of nutrient limitation during the second growth period for both N limitation and N and P co-limitation. Nutrient limitation in S. spontaneum highlights a potential risk of fertilizer applications during restoration, agriculture, and agroforestry activities in which invasion of this aggressive weed is a challenge to land management.
1. Introduction
Intensive agriculture and grazing in tropical systems can lead to soil degradation and reduced productivity. When such lands are abandoned, succession is expected to lead to habitat recovery. However, low propagule availability, seed and seedling predation, seasonal drought, fire, competition with non-native weeds, and reduced nutrient availability are barriers that can slow or deter the rate of succession [1,2,3,4,5]. Although tropical soils are diverse, they are generally less fertile than temperate soils and more likely to be limited by phosphorus than nitrogen [6,7,8]. Tropical nutrient availability is strongly regulated by nutrient cycling through decomposition [9]. Forest clearing and removal of above-ground biomass in agriculture reduce the amount of nutrients that cycle back into the system through decomposition [10], leading to a rapid loss of nutrients after as few as three cycles of shifting agriculture [11]. As productivity decreases, increasing amounts of exposed soils can cause further losses of nitrogen (N), phosphorus (P), potassium (K), and other nutrients through erosion and/or run-off, leading to nutrient limitation and delayed succession [6,9,12,13]. Reduced nutrient availability can impede the establishment of native species [9,14].
Numerous species of non-native C4 grasses were introduced to the American tropics as pasture grasses and many became weeds [1,3,5,15,16]. Invasive C4 grasses can inhibit forest succession through accelerated fire regimes [3,4,5,17,18,19]. Additionally, in comparison to most native C3 woody plants, C4 grasses have high photosynthetic nitrogen use efficiency, allowing them to maintain high photosynthetic rates under the hot, sunny, low-fertility conditions of abandoned agricultural lands. High nitrogen use efficiency gives these grasses an advantage in competition for nutrients and other resources, and it complicates the maintenance or establishment of preferred vegetation [20,21]. Soil degradation via intensive agriculture and grazing has the potential to favor colonization by weedy non-native C4 grasses [2,3,15,22].
Understanding how soil fertility influences the growth of invasive plants is critical to develop management strategies to restore invaded areas to agricultural use or forest cover. Because fertilizers that are commonly applied as part of reforestation activities to help reestablish trees could preferentially benefit undesired plants, it is important to understand how invasive species will respond to nutrient addition. The same is true for other tropical land use practices that involve grass control, including agriculture.
Saccharum spontaneum L. subsp. spontaneum is a large, exotic C4 grass species, native to Asia and Northern Africa, that invades abandoned agricultural fields in many tropical countries. It is adapted to drought, burns frequently, and is difficult to eradicate, which is why it is considered one of the most serious weeds where it occurs [18,23]. S. spontaneum was most likely introduced to the Republic of Panamá in 1939 with a United States Department of Agriculture (USDA) germplasm collection for sugarcane [24] and by the 1960s, had spread widely through disturbed areas [25]. Control of S. spontaneum is actively pursued throughout the country and is especially important in the watershed of the Panama Canal, where S. spontaneum is widespread and persistent [24,26]. Fires promoted by abundant S. spontaneum reduce the germination and species richness of native trees and encourage additional growth and reproduction of S. spontaneum [17,18,27]. In Panama, S. spontaneum inhibits agriculture, forest restoration, and succession, generating huge costs associated with weed management [23]. The use of fertilizers to support agricultural production or forest restoration may facilitate S. spontaneum growth and persistence, thereby reducing seedling establishment and increasing management costs.
The objective of this experiment was to test whether S. spontaneum in this system is nutrient-limited, and specifically evaluate the relative importance of nitrogen and phosphorus limitation. We expected that, as for many other tropical systems, S. spontaneum growth would be more P-limited than N-limited.
2. Materials and Methods
2.1. Site Description
This project was established in Parque Nacional Soberanía in the Panama Canal Watershed, Republic of Panamá (N 9°6′5.5434″; W 79°36′42.8934″), in abandoned agricultural lands now dominated by S. spontaneum. This site experiences a mean rainfall of 2226 mm and about 4 dry months annually from December to early April (defined as months with <100 mm rainfall), with the wettest part of the year occurring in October and November [28]. Soils at this site are characterized as ultisols, predominantly clay and silty clay loams [29]. Moist tropical forest was cleared from this site during the 1960s, and the area was then used for grazing and small-scale agriculture, until it was abandoned around 1993.
2.2. Experimental Design
A full factorial block design was used to test nutrient limitation of growth of S. spontaneum. In June of 2011, a homogeneous area of S. spontaneum was cleared of above-ground biomass by machete and gas-powered brush cutter from all blocks before applying fertilizers. This experiment consisted of twelve blocks, each with four nutrient treatments: no nutrient addition (control; C), nitrogen addition (N), phosphorus addition (P), and nitrogen + phosphorus combination (N + P). Plots were 5 × 5 m2, with a 2 m buffer between plots within a block and a 3 m buffer between blocks. Buffer zones were maintained free of S. spontaneum to inhibit rhizomatous spread between the plots by S. spontaneum and reduce the probability of horizontal movement of nutrients between plots.
Dry fertilizer was added by hand. Nitrogen was added as urea ((NH2)2CO2), and phosphorus was added as triple super phosphate (Ca(H2PO4)2•H2O). Nutrient application corresponded to 125 kg ha−1 N and 50 kg ha−1 P, as recommended for this region [30]. Based on these values, we calculated a nutrient application of 135.63 g triple super phosphate and 339.06 g urea per plot for each application. Nutrients were applied in July after clearing the site and again in October after the first biomass harvest. Soil cores were taken from each plot at the end of the study (December) to compare final soil nutrient availability across treatments.
2.3. Nutrient Concentration Analysis
We compared soil and leaf nutrient concentration data across treatments. In December, we randomly collected and homogenized 10 soil cores at 10 cm depth for each plot; a 20 g subsample was used to extract soil nitrogen and another for phosphorus. We followed the potassium chloride (KCl) [31] and Mehlich [32] standardized protocols to extract available nitrate (NO3−), ammonium (NH4+), and phosphate (PO4−2) [33]. Soil samples were placed directly into solution in the field and processed in the lab within 24 h of being collected. For plant tissue nutrient analysis, we collected the third mature leaf from the base of 15 randomly selected individuals in each plot. Leaves were dried for 3 days at 60 °C, and samples were processed at the University of California Santa Cruz. Five leaves were selected from each plot, and leaf N and P were extracted following the Kjeldahl acid digestion protocol [34] using a Lachat BD 46 block digester (Lachat Instruments, Milwaukee, WI, USA).
We assessed S. spontaneum performance, in terms of density and above-ground biomass, in September and December 2011. Measurements of both biomass and density are useful because they each affect the establishment and persistence of native species in this system; biomass is an indicator of the overall dominance of S. spontaneum in the field; beyond biomass, the density of individual stems influences physical availability of space for other plants to grow. The ability of S. spontaneum to spread through underground rhizomes makes it very difficult to differentiate between genetic individuals of S. spontaneum in the field. For this reason, we estimated density as the number of stalks; a tiller visibly emerging from a stalk was considered a part of that stalk. In September, we measured density by counting the number of stalks of S. spontaneum in 3 randomly placed 1 m2 quadrats in each plot. S. spontaneum height varied across treatments but reached as high as 2 m (personal observation). We randomly collected 10 stalks of S. spontaneum from half of the 1 m2 area used for quantifying S. spontaneum density to calculate above-ground biomass. S. spontaneum biomass was dried at 60 °C for 3 days and then weighed. We estimated S. spontaneum biomass as the product of the number of stalks and mean biomass per stalk. At the end of September, we cleared the plots of S. spontaneum to simulate common management practices in areas under restoration. In October, we re-applied nutrients and allowed S. spontaneum to grow back until the onset of the dry season in December. Individuals of S. spontaneum appeared much smaller during the December harvest, with few individuals reaching heights greater than 2 m and many individuals less than 1 m, suggesting a reduction in above-ground growth after clearing. Data collection in December followed the methods used in September.
2.4. Data Analysis
We used two-way factorial ANOVA to compare the response of soil nutrients, leaf nutrients, and S. spontaneum growth to application of nitrogen, phosphorus, or their combination. Blocks were included in the model as a random effect. Soil nutrient response variables included nitrate, ammonium, total N (nitrate + ammonium), phosphate, and N:P ratio (total inorganic nitrogen/phosphate). Plant nutrient variables were leaf N and P concentrations (mg/g), as well as leaf N:P ratios. Plant growth response variables included S. spontaneum density and biomass measured in both September (July–September growth) and December (October–December growth).
3. Results
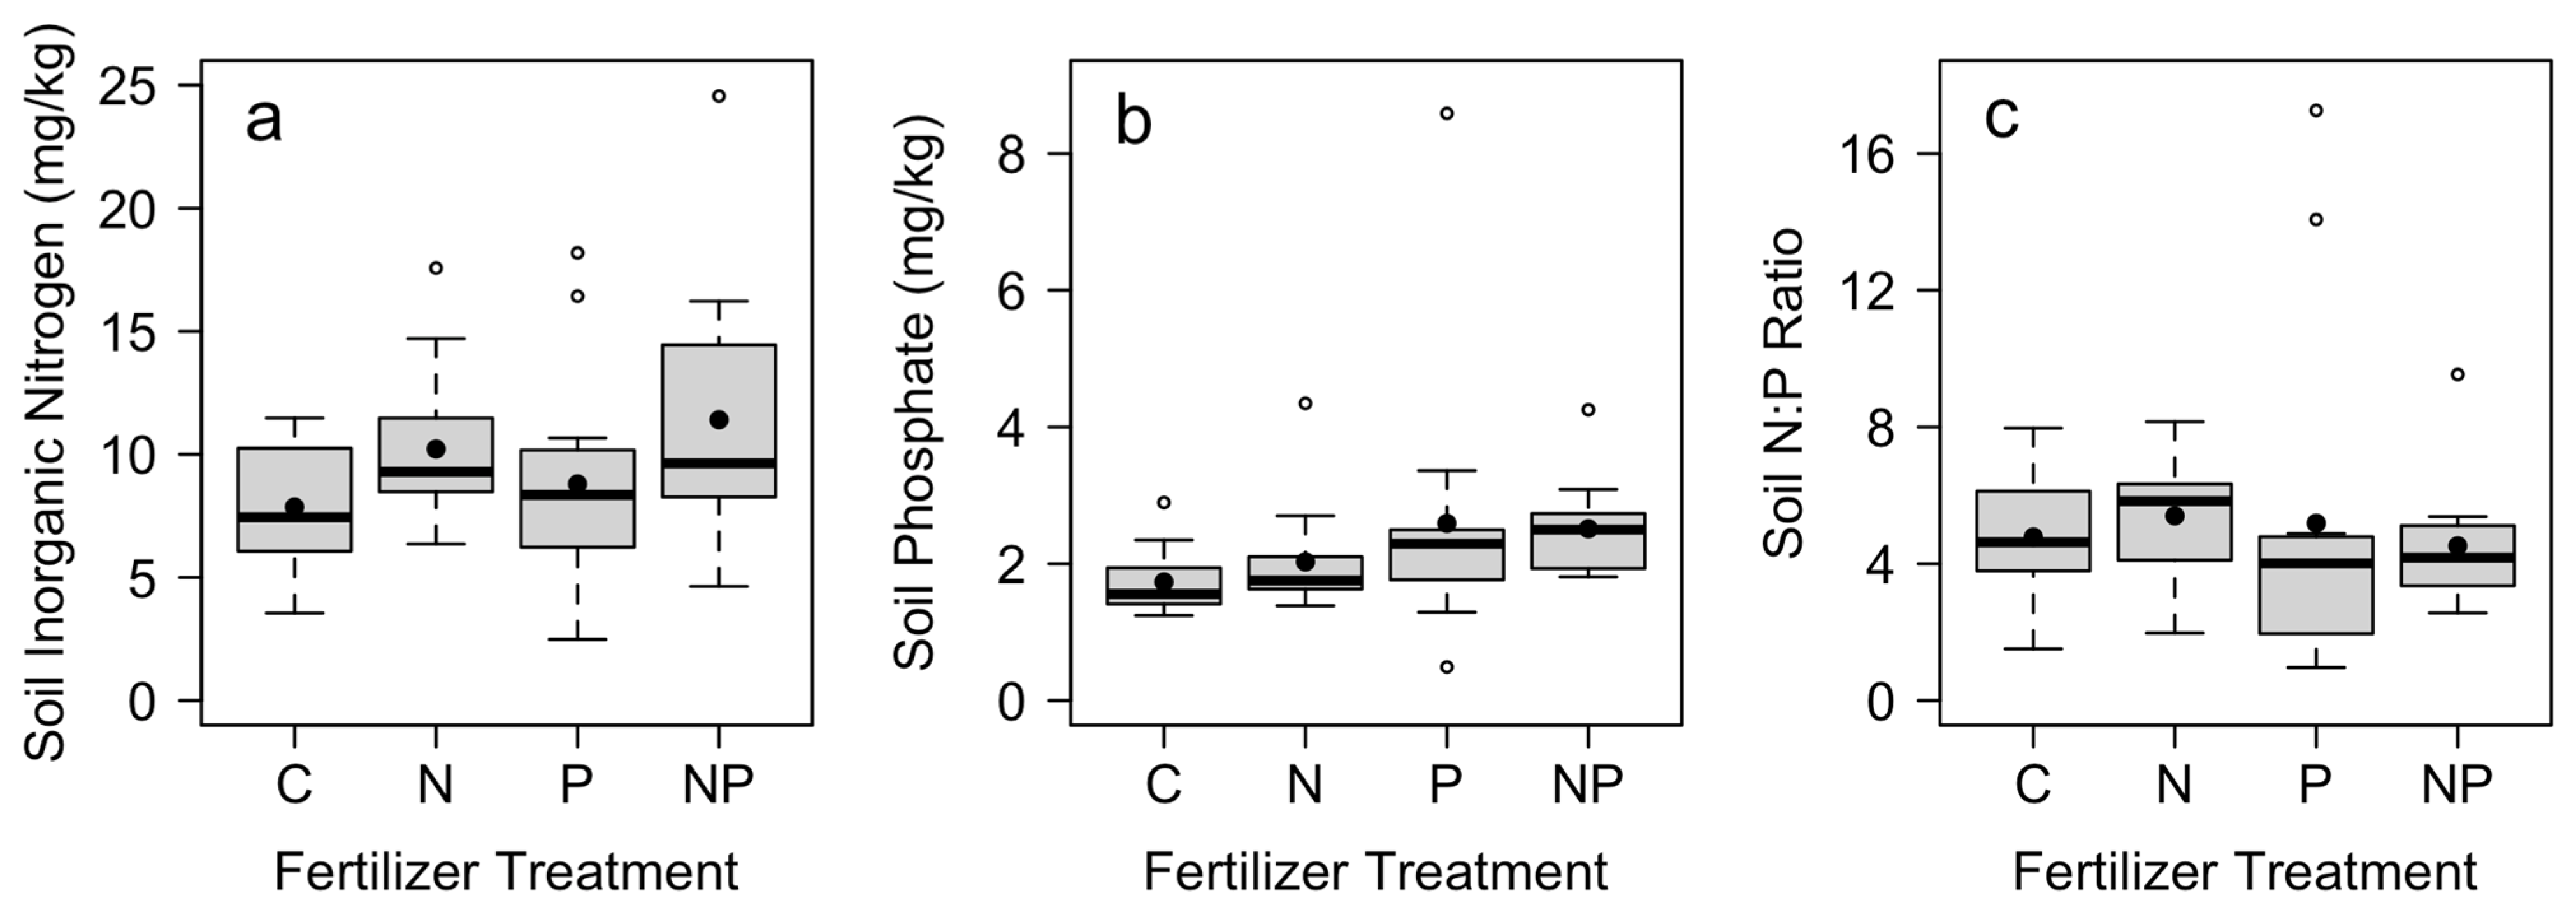
Soil nutrient concentrations responded significantly to nutrient additions. Although there was no difference in soil nitrate across treatments, soil ammonium and total N were significantly higher in plots where N was added (Table 1). Nutrient concentrations varied across blocks for all nitrogen measures (Table 1). Soil phosphate was greatest in plots where P was added (Table 1; Figure 1). There was no difference in soil N:P ratios across nutrient treatments (Table 1; Figure 1).
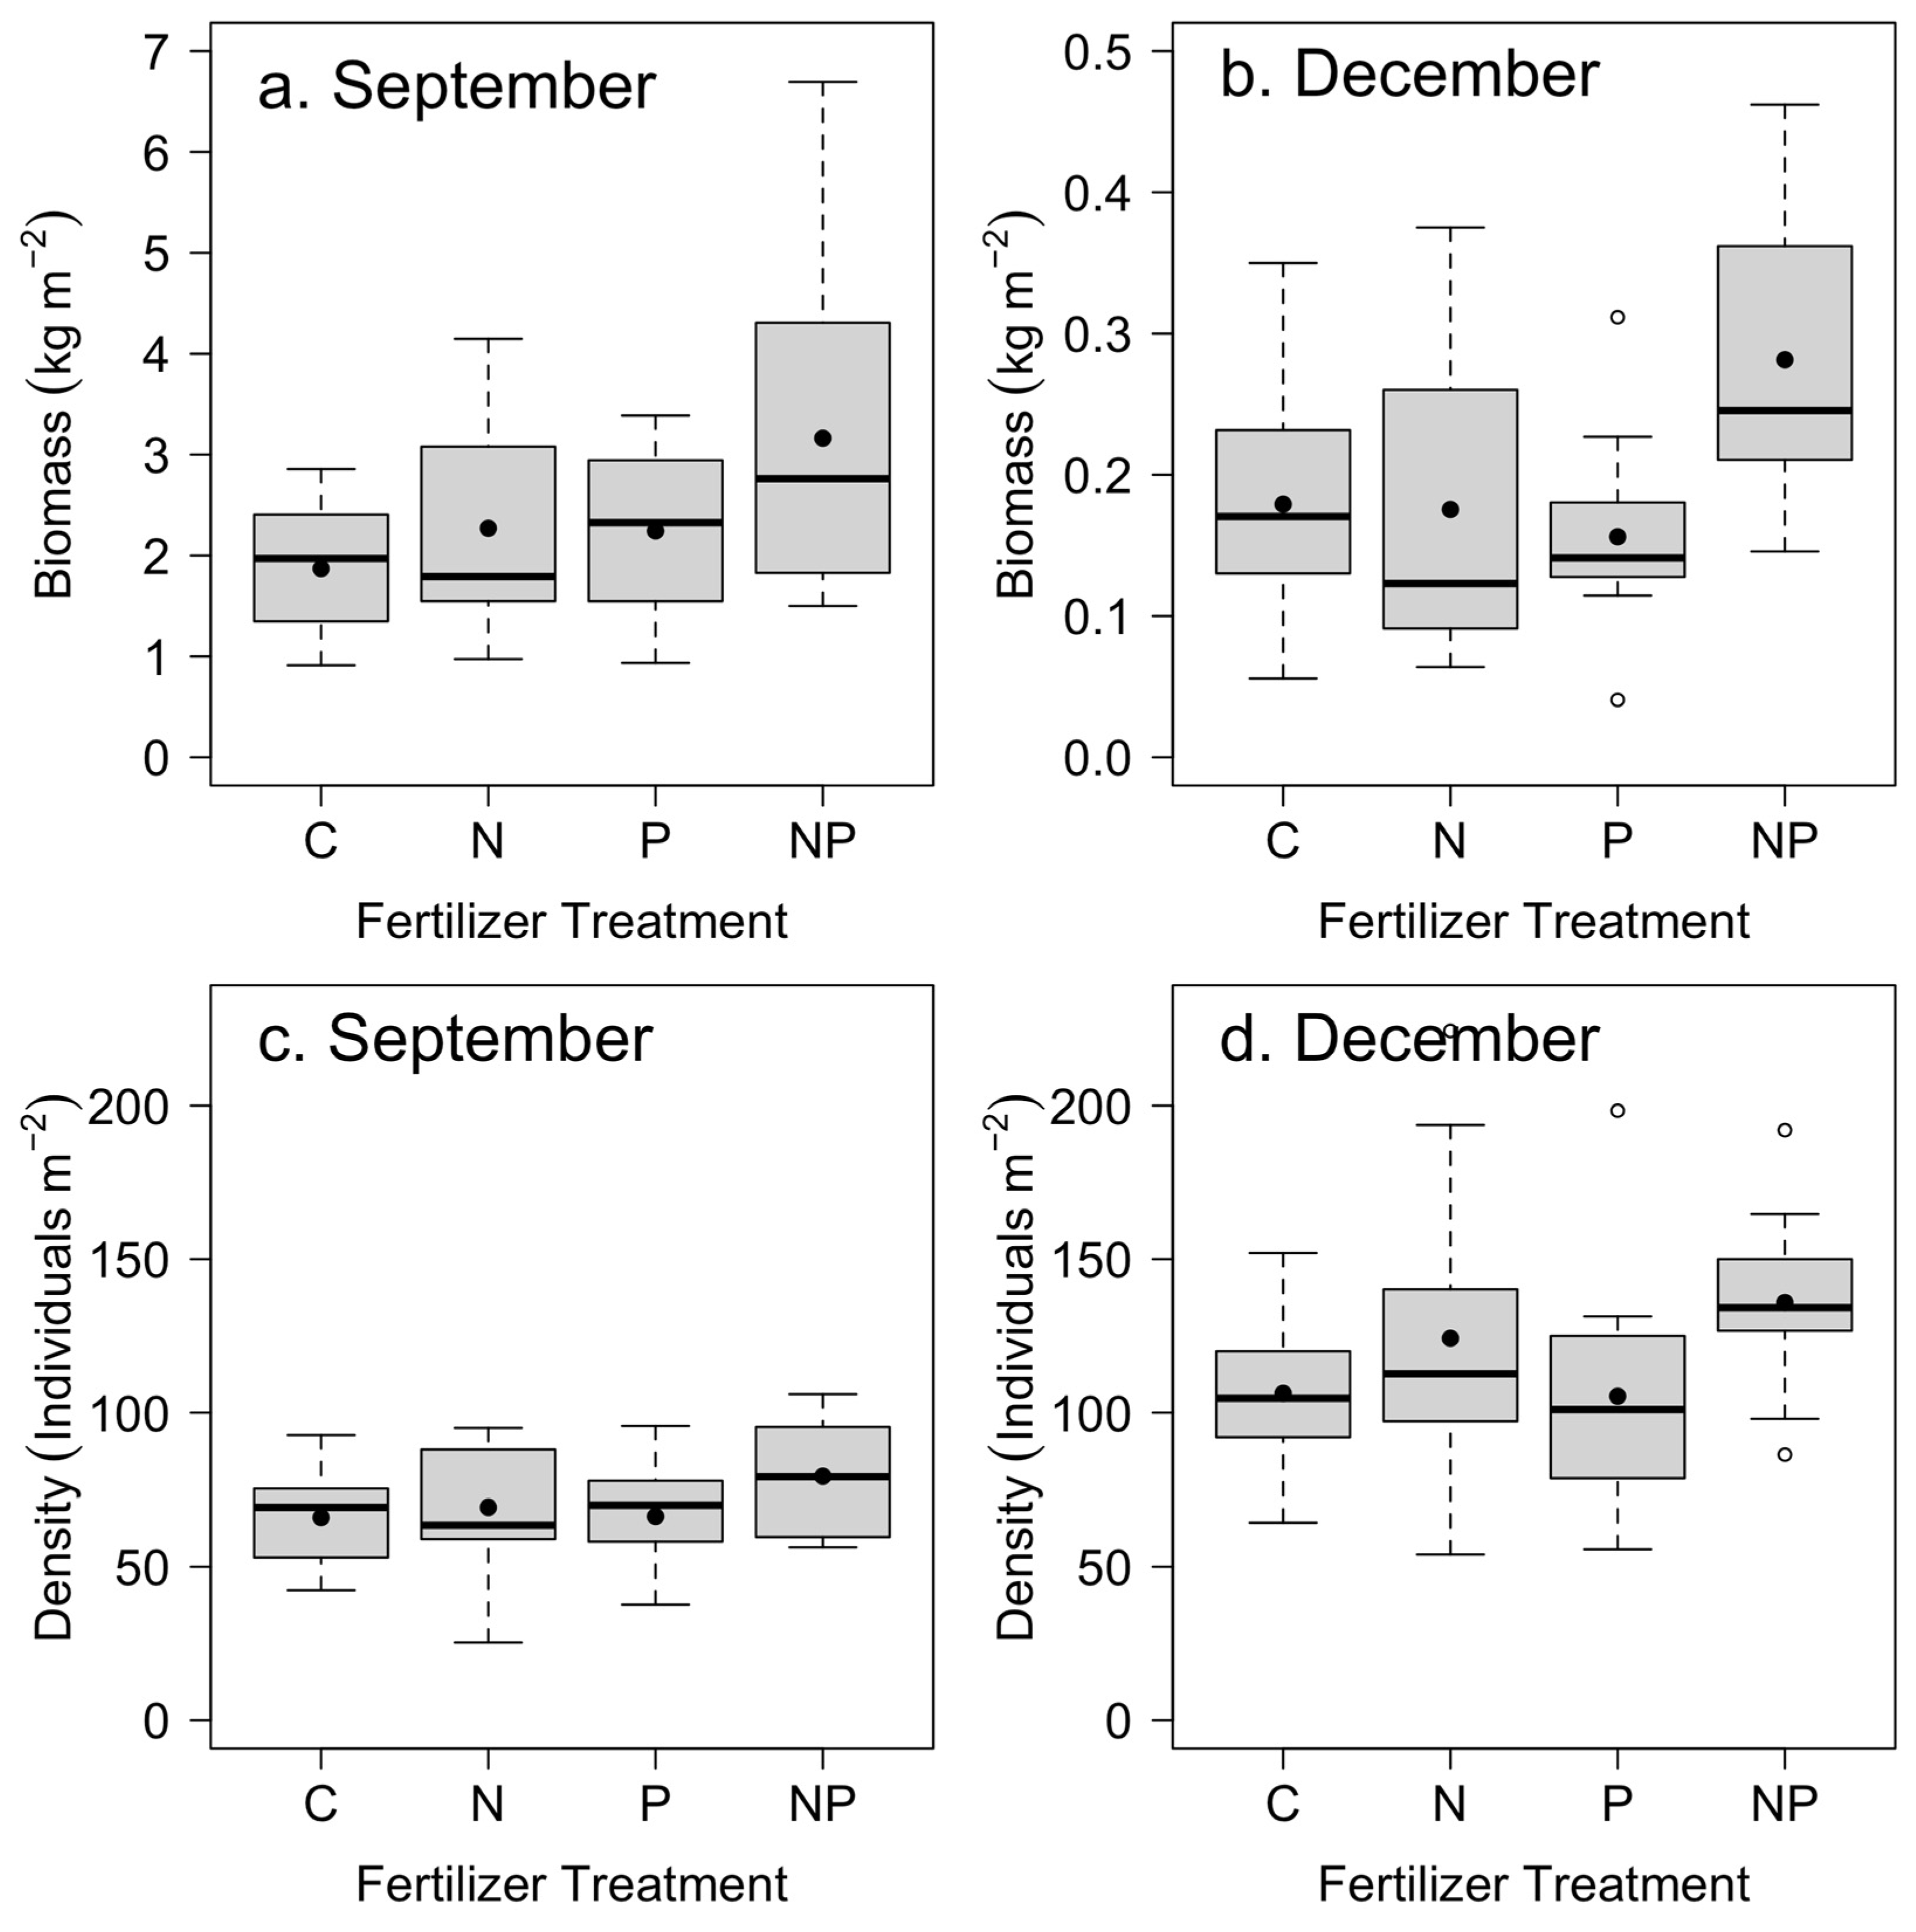
The above-ground biomass of Saccharum spontaneum showed rapid growth from July to September (Figure 2), averaging approximately 2–3 kg dry biomass per m2 across the four treatments. The growth from October through to December was nearly an order of magnitude slower than the growth from July to September. However, stem density was higher in the later period (Figure 2).
We found a significant positive effect of nitrogen and phosphorus addition on mean S. spontaneum biomass from July to September (Table 2; Figure 2a). From October to December, we found a significant positive effect of nitrogen addition and a significant positive interaction between nitrogen and phosphorus on S. spontaneum above-ground biomass (Table 2; Figure 2b). Stem density in September increased by an average of 14% with the addition of N (p = 0.10), whereas in December, it increased by 25% (p = 0.02) (Table 2; Figure 2c,d). We found no significant effect of P on density in September or December (Table 2; Figure 2c,d).
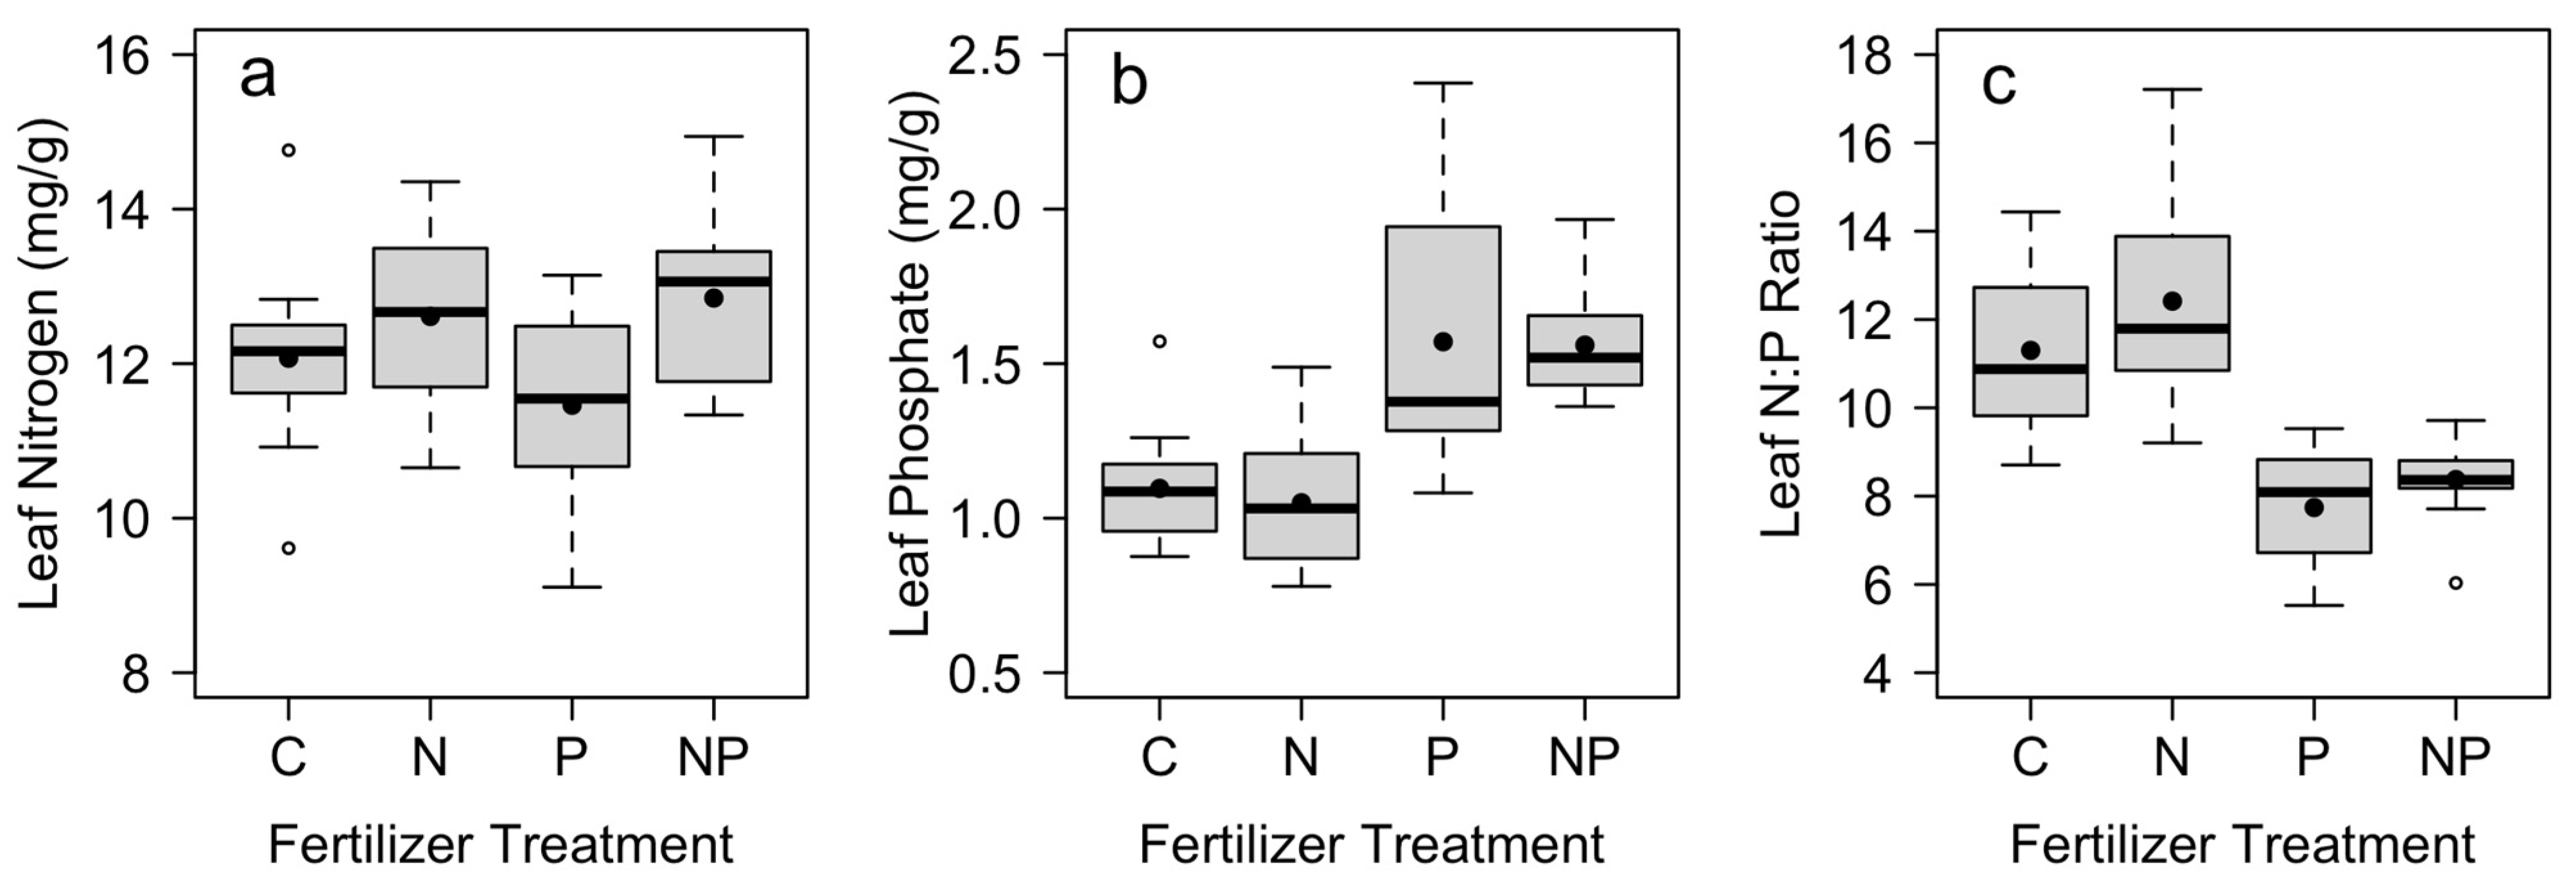
S. spontaneum responded to nutrient additions by increasing internal nutrient concentrations. In plots where N was added, we found significantly higher leaf N and no significant effect on leaf P (Table 3; Figure 3). In plots where P was added, we found significantly higher leaf P and no significant increase in leaf N (Table 3; Figure 3). Both leaf N and leaf P also varied by block (Table 3). In addition, there was a significant effect of both N and P fertilization on the leaf N:P ratio, where the leaf N:P was significantly lower in plots where P was added (Table 3; Figure 3). There was no significant interaction between N and P treatments for leaf nutrient concentrations (p > 0.15, Table 3).
4. Discussion
Biomass growth of S. spontaneum showed a positive response to both N and P addition, suggesting that S. spontaneum is both nitrogen and phosphorus was limited in this system. This positive effect is likely linked to increased photosynthetic capacity under increased nutrient availability. The net CO2 assimilation rate increases nonlinearly with increasing leaf N for eight species of Saccharum [35], likely reflecting an increase in the concentration of Rubisco. Similarly, leaf P and growth in C4 grasses increased with increasing soil P supply in other studies [36,37]. We also found evidence for N and P co-limitation of biomass in S. spontaneum, in particular in the later growing period.
Final soil N and P concentrations were significantly higher in plots where N and P were added. This indicates that treatments were effective in increasing nutrient availability throughout the study. Leaf N and P were greater in plots where we added N and P, respectively, indicating that S. spontaneum had increased nutrient uptake in fertilized plots.
In our system, nitrogen addition produced a slight increase in stem density. Tillering of both C3 and C4 grasses in temperate systems increased in response to increased nitrogen [38,39,40]. In addition, frequent cutting can increase tillering in Hyparrhenia rufa, another tropical invasive C4 grass [41]. Our results suggest that S. spontaneum responds similarly to other grasses by increasing tillering in response to both nitrogen addition and cutting.
Growth in above-ground biomass was an order of magnitude lower in December than September. After the first growing period, the energy reserves in the rhizomes may have been severely depleted, meaning there was little stored carbohydrate left to sustain growth during the second growth period. Alternatively, this growth pattern may suggest that resource allocation varies temporally in S. spontaneum. In our study, the period from July to September represents the middle of the wet season, with peak flowering in August–September. The October–December periods include the wettest and cloudiest parts of the rainy season, along with the transition into the dry season. Investment in above-ground growth in the early rainy season may allow the plant to shade competitors and attain heights that optimize pollination and seed dispersal, with a shift in allocation to below-ground growth before the onset of the dry season. Other studies of tropical C4 grasses have also found a high growth rate at the beginning of the rainy season (e.g., [42]).
In conjunction with resource reallocation, multiple rounds of removal of above-ground biomass may have reduced the growth ability of S. spontaneum. Repeated clearing can reduce below-ground carbon stores [43]. For a number of temperate grass species, increased annual above-ground biomass clearing reduced carbohydrate reserves [43]. Our results are consistent with studies that show that repeated clearing of S. spontaneum can reduce S. spontaneum growth [44]. Future studies should evaluate whether growth after clearing varies seasonally.
5. Conclusions
In summary, we found that nutrient addition increased the growth of Saccharum spontaneum, but these effects varied seasonally and differed between biomass and density responses. Given the substantial impacts of S. spontaneum within the Panama Canal Watershed [24] and in many other parts of the world where it is a weedy invader [45], there is a great need to understand the management activities that help suppress, or unintentionally promote, its growth. This study highlights a potential risk of fertilizer applications during restoration, agriculture, agroforestry, or other activities in which S. spontaneum invasion is a challenge to land management.
Author Contributions
Conceptualization, J.A.C., I.M.P. and G.S.G.; methodology, J.A.C.; formal analysis, J.A.C.; investigation, J.A.C.; data curation, J.A.C.; writing—original draft preparation, J.A.C.; writing—review and editing, J.A.C., I.M.P. and G.S.G.; visualization, J.A.C. All authors have read and agreed to the published version of the manuscript.
Funding
This research was funded by fellowships to J.C. from the NSF Pre-Doctoral Fellowship program, the STRI Short Term Fellowship program, the UCSC Center for Tropical Ecology, Agriculture, and Development, the Graduate Assistance in Areas of National Need (GAANN) program, and the Jean Langenheim Fellowship.
Institutional Review Board Statement
Not applicable.
Informed Consent Statement
Not applicable.
Data Availability Statement
Data are available in a publicly accessible repository at Gilbert, Gregory; Cummings, Justin; Parker, Ingrid (2023), Saccharum spontaneum biomass and associated soil and foliar nutrient data, Dryad, Dataset, https://doi.org/10.7291/D1KD69.
Acknowledgments
The authors thank the Smithsonian Tropical Research Institute (STRI) for logistical support and ANAM/MiAmbiente for granting permission to conduct research in the Republic of Panamá. We also thank J.S. Hall (PRORENA) and S.J. Wright (STRI) for serving as mentors to J.C. while conducting work in Panamá, and to Haley Stott and Emelie L. M. McKain for their field assistance.
Conflicts of Interest
The authors declare no conflict of interest.
References
- Moran, E.F.; Brondizio, E.S.; Tucker, J.M.; da Silva-Forsberg, M.C.; McCracken, S.; Falesi, I. Effects of soil fertility and land-use on forest succession in Amazonia. For. Ecol. Manag. 2000, 139, 93–108. [Google Scholar] [CrossRef]
- Nepstad, D.C.; Uhl, C.; Serrao, E.A. Recuperation of a degraded Amazonian landscape: Forest recovery and agricultural restoration. Ambio 1991, 20, 248–255. [Google Scholar]
- D’Antonio, C.M.; Vitousek, P.M. Biological invasions by exotic grasses, the grass/fire cycle, and global change. Annu. Rev. Ecol. Syst. 1992, 23, 63–87. [Google Scholar] [CrossRef]
- Holl, K.D. Factors limiting tropical rain forest regeneration in abandoned pasture: Seed rain, seed germination, microclimate, and soil. Biotropica 1999, 31, 229–242. [Google Scholar] [CrossRef]
- Aide, T.M.; Cavelier, J. Barriers to lowland tropical forest restoration in the Sierra Nevada de Santa Marta, Colombia. Restor. Ecol. 1994, 2, 219–229. [Google Scholar] [CrossRef]
- Vitousek, P.M. Litterfall, nutrient cycling, and nutrient limitation in tropical forests. Ecology 1984, 65, 285–298. [Google Scholar] [CrossRef]
- Sollins, P. Factors influencing species composition in tropical lowland rain forest: Does soil matter? Ecology 1998, 79, 23–30. [Google Scholar] [CrossRef]
- Townsend, A.R.; Cleveland, C.C.; Asner, G.P.; Bustamante, M.M. Controls over foliar N: P ratios in tropical rain forests. Ecology 2007, 88, 107–118. [Google Scholar] [CrossRef] [PubMed]
- Lu, D.; Moran, E.; Mausel, P. Linking Amazonian secondary succession forest growth to soil properties. Land Degrad. Devel. 2002, 13, 331–343. [Google Scholar] [CrossRef]
- Newman, E. Phosphorus balance of contrasting farming systems, past and present. Can food production be sustainable? J. Appl. Ecol. 1997, 34, 1334–1347. [Google Scholar] [CrossRef]
- Lawrence, D.; D’Odorico, P.; Diekmann, L.; DeLonge, M.; Das, R.; Eaton, J. Ecological feedbacks following deforestation create the potential for a catastrophic ecosystem shift in tropical dry forest. Proc. Natl. Acad. Sci. USA 2007, 104, 20696–20701. [Google Scholar] [CrossRef] [PubMed]
- Baribault, T.W.; Kobe, R.K.; Finley, A.O. Tropical tree growth is correlated with soil phosphorus, potassium, and calcium, though not for legumes. Ecol. Monogr. 2012, 82, 189–203. [Google Scholar] [CrossRef]
- Mercado, L.M.; Patino, S.; Domingues, T.F.; Fyllas, N.M.; Weedon, G.P.; Sitch, S.; Quesada, C.A.; Phillips, O.L.; Aragão, L.E.; Malhi, Y. Variations in Amazon forest productivity correlated with foliar nutrients and modelled rates of photosynthetic carbon supply. Philos. Trans. R. Soc. Lond. Ser. B 2011, 366, 3316–3329. [Google Scholar] [CrossRef] [PubMed]
- Chaer, G.M.; Resende, A.S.; Campello, E.F.C.; de Faria, S.M.; Boddey, R.M. Nitrogen-fixing legume tree species for the reclamation of severely degraded lands in Brazil. Tree Physiol. 2011, 31, 139–149. [Google Scholar] [CrossRef] [PubMed]
- Williams, D.G.; Baruch, Z. African grass invasion in the Americas: Ecosystem consequences and the role of ecophysiology. Biol. Invasions 2000, 2, 123–140. [Google Scholar] [CrossRef]
- Parsons, J.J. Spread of African pasture grasses to the American tropics. Rangel. Ecol. Manag. 1972, 25, 12–17. [Google Scholar] [CrossRef]
- Hooper, E.; Legendre, P.; Condit, R. Barriers to forest regeneration of deforested and abandoned land in Panama. J. Appl. Ecol. 2005, 42, 1165–1174. [Google Scholar] [CrossRef]
- Hooper, E.R.; Legendre, P.; Condit, R. Factors affecting community composition of forest regeneration in deforested, abandoned land in Panama. Ecology 2004, 85, 3313–3326. [Google Scholar] [CrossRef]
- D’Antonio, C.M.; Hughes, R.; Tunison, J. Long-term impacts of invasive grasses and subsequent fire in seasonally dry Hawaiian woodlands. Ecol. Appl. 2011, 21, 1617–1628. [Google Scholar] [CrossRef]
- Edwards, E.J.; Smith, S.A. Phylogenetic analyses reveal the shady history of C4 grasses. Proc. Natl. Acad. Sci. USA 2010, 107, 2532–2537. [Google Scholar] [CrossRef]
- Lambers, H.; Chapin, F.S.; Pons, T.L. Plant Physiological Ecology; Springer: Berlin, Germany, 2008; Volume 2. [Google Scholar]
- D’Antonio, C.M.; Hughes, R.F.; Vitousek, P.M. Factors influencing dynamics of two invasive C4 grasses in seasonally dry Hawaiian woodlands. Ecology 2001, 82, 89–104. [Google Scholar]
- Hammond, B.W. Saccharum spontaneum (Gramineae) in Panama: The physiology and ecology of invasion. J. Sustain. Forest. 1998, 8, 23–38. [Google Scholar] [CrossRef]
- Saltonstall, K.; Bonnett, G.D.; Aitken, K.S. A perfect storm: Ploidy and preadaptation facilitate Saccharum spontaneum escape and invasion in the Republic of Panama. Biol. Invasions 2021, 23, 1101–1115. [Google Scholar] [CrossRef]
- Craven, D.; Hall, J.; Verjans, J.M. Impacts of herbicide application and mechanical cleanings on growth and mortality of two timber species in Saccharum spontaneum grasslands of the Panama Canal Watershed. Restor. Ecol. 2009, 17, 751–761. [Google Scholar] [CrossRef]
- Boeschoten, L.E.; van Breugel, M.; Bailon, M.; Balbuena, J.; Nuñez, M.; Cerezo, A.; Hall, J.S. Framework species approach proves robust in restoring forest on fire prone invasive grass: A case study from Panama. J. Sustain. For. 2021, 40, 197–215. [Google Scholar] [CrossRef]
- Saltonstall, K.; Bonnett, G.D. Fire promotes growth and reproduction of Saccharum spontaneum (L.) in Panama. Biol. Invasions 2012, 14, 2479–2488. [Google Scholar] [CrossRef]
- Wishnie, M.; Dent, D.; Mariscal, E.; Deago, J.; Cedeno, N.; Ibarra, D.; Condit, R.; Ashton, P. Initial performance and reforestation potential of 24 tropical tree species planted across a precipitation gradient in the Republic of Panama. For. Ecol. Manag. 2007, 243, 39–49. [Google Scholar] [CrossRef]
- Park, A.; van Breugel, M.; Ashton, M.S.; Wishnie, M.; Mariscal, E.; Deago, J.; Ibarra, D.; Cedeño, N.; Hall, J.S. Local and regional environmental variation influences the growth of tropical trees in selection trials in the Republic of Panama. For. Ecol. Manag. 2010, 260, 12–21. [Google Scholar] [CrossRef]
- Wright, S.J.; Yavitt, J.B.; Wurzburger, N.; Turner, B.L.; Tanner, E.V.; Sayer, E.J.; Santiago, L.S.; Kaspari, M.; Hedin, L.O.; Harms, K.E. Potassium, phosphorus, or nitrogen limit root allocation, tree growth, or litter production in a lowland tropical forest. Ecology 2011, 92, 1616–1625. [Google Scholar] [CrossRef] [PubMed]
- Maynard, D.; Kalra, Y.; Crumbaugh, J. Nitrate and exchangeable ammonium nitrogen. Soil Sampl. Methods Anal. 1993, 1, 25–38. [Google Scholar]
- Mehlich, A. Mehlich 3 soil test extractant: A modification of Mehlich 2 extractant. Commun. Soil Sci. Plant Anal. 1984, 15, 1409–1416. [Google Scholar] [CrossRef]
- Baldeck, C.A.; Harms, K.E.; Yavitt, J.B.; John, R.; Turner, B.L.; Valencia, R.; Navarrete, H.; Davies, S.J.; Chuyong, G.B.; Kenfack, D. Soil resources and topography shape local tree community structure in tropical forests. Proc. R. Soc. B 2013, 280, 20122532. [Google Scholar] [CrossRef] [PubMed]
- Novozamsky, I.; Houba, V.; Van Eck, R.; Van Vark, W. A novel digestion technique for multi-element plant analysis. Commun. Soil Sci. Plant Anal. 1983, 14, 239–248. [Google Scholar] [CrossRef]
- Meinzer, F.C.; Zhu, J. Nitrogen stress reduces the efficiency of the C4CO2 concentrating system, and therefore quantum yield, in Saccharum (sugarcane) species. J. Exp. Bot. 1998, 49, 1227–1234. [Google Scholar] [CrossRef]
- Rubio, G.; Gutiérrez Boem, F.H.; Lavado, R.S. Responses of C3 and C4 grasses to application of nitrogen and phosphorus fertilizer at two dates in the spring. Grass Forage Sci. 2010, 65, 102–109. [Google Scholar] [CrossRef]
- Barger, N.N.; D’Antonio, C.M.; Ghneim, T.; Brink, K.; Cuevas, E. Nutrient limitation to productivity in a secondary savanna in Venezuela. Biotropica 2002, 34, 493–501. [Google Scholar] [CrossRef]
- Lafarge, M. Reproductive tillers in cut tall fescue swards: Differences according to sward age and fertilizer nitrogen application, and relationships with the local dynamics of the sward. Grass Forage Sci. 2006, 61, 182–191. [Google Scholar] [CrossRef]
- Jaramillo, V.J.; Detling, J.K. Small-scale heterogeneity in a semi-arid North American grassland. I. Tillering, N uptake and retranslocation in simulated urine patches. J. Appl. Ecol. 1992, 29, 1–8. [Google Scholar] [CrossRef]
- Moyer, J.; Sweeney, D. Long-term responses in the yield of Eastern Gamagrass [Tripsacum dactyloides (L.) L.] to nitrogen fertilizer under two harvest regimes in the United States. Grass Forage Sci. 2008, 63, 390–397. [Google Scholar] [CrossRef]
- Simoes, M.; Baruch, Z. Responses to simulated herbivory and water stress in two tropical C4 grasses. Oecologia 1991, 88, 173–180. [Google Scholar] [CrossRef]
- Baruch, Z.; Gómez, J.A. Dynamics of energy and nutrient concentration and construction cost in a native and two alien C4 grasses from two neotropical savannas. Plant Soil 1996, 181, 175–184. [Google Scholar] [CrossRef]
- Klimeš, L.; Klimešová, J. The effects of mowing and fertilization on carbohydrate reserves and regrowth of grasses: Do they promote plant coexistence in species-rich meadows? In Proceedings of the Ecology and Evolutionary Biology of Clonal Plants: Proceedings of Clone-2000, Obergurgl, Austria, 20–25 August 2000; pp. 141–160. [Google Scholar]
- Hooper, E.; Condit, R.; Legendre, P. Responses of 20 native tree species to reforestation strategies for abandoned farmland in Panama. Ecol. Appl. 2002, 12, 1626–1641. [Google Scholar] [CrossRef]
- Holm, L.G.; Plucknett, D.L.; Pancho, J.V.; Herberger, J.P. Saccharum spontaneum L. In World Weeds: Natural Histories and Distribution; University of Hawaii Press: Honolulu, HI, USA, 1977; pp. 693–698. [Google Scholar]
Figure 1.
Mean total soil (a) inorganic nitrogen and (b) phosphate nutrient concentrations, and (c) soil N:P across control (C), nitrogen (N), phosphorus (P), and nitrogen and phosphorus (NP) fertilizer treatments (n = 12). Mean soil nutrient concentrations were measured in December at the end of the study, with fertilizer applications in July and October. Box plots indicate median (thick line), 1st and 3rd quartiles (grey box), and range whiskers, with extreme values as open circles. Filled circles indicate the mean. See Table 1 for associated statistics.

Figure 2.
Mean Saccharum spontaneum above-ground biomass in (a) September and (b) December (note different scales) across control (C), nitrogen (N), phosphorus (P), and nitrogen and phosphorus (NP) nutrient treatments (n = 12). Mean stem density in (c) September and (d) December. Box plots indicate median (thick line), 1st and 3rd quartiles (grey box), and range whiskers, with extreme values as open circles. Filled circles indicate the mean. See Table 2 for associated statistics.

Figure 3.
Mean leaf concentrations of (a) nitrogen and (b) phosphorus, together with (c) leaf N:P ratio across control (C), nitrogen (N), phosphorus (P), and nitrogen and phosphorus (NP) fertilizer treatments (n = 12). Mean leaf nutrient concentrations were measured in December at the end of the study, with fertilizer applications in July and October. Box plots indicate median (thick line), 1st and 3rd quartiles (gray box) and range whiskers, with extreme values as open circles. Filled circles indicate the mean. See Table 2 for associated statistics.


Table 1.
Two-way factorial analysis of final soil nutrient availability across treatments, showing the degrees of freedom (df), F ratios (F), and probability (p). Nutrients were added at the beginning of the study in July and again after the first harvest in October, and nutrient availability was measured in December. Nutrient additions are treated as fixed effects with blocks as random effects. Bold values represent significant treatment effects.
| Ammonium (mg/kg) | Nitrate (mg/kg) | Total Inorganic N (mg/kg) | Phosphate (mg/kg) | N:P | |||||||
|---|---|---|---|---|---|---|---|---|---|---|---|
| Treatment | df | F | p | F | p | F | p | F | p | F | p |
| N addition | 1.33 | 9.20 | 0.005 | 0.10 | 0.10 | 9.73 | 0.004 | 0.11 | 0.75 | 0.001 | 0.98 |
| P addition | 1.33 | 1.77 | 0.19 | 0.59 | 0.59 | 1.78 | 0.19 | 4.14 | 0.05 | 0.08 | 0.78 |
| N × P interaction | 1.33 | 0.16 | 0.70 | 1.49 | 0.23 | 0.03 | 0.87 | 0.32 | 0.35 | 0.57 | 0.46 |
| Block | 11.33 | 5.91 | <0.001 | 2.51 | 0.02 | 5.95 | <0.001 | 1.17 | 0.58 | 1.12 | 0.38 |
Table 2.
Two-way factorial analysis of S. spontaneum density and biomass in response to nutrient additions, after growth from July to September (“September”) and from October to December (“December”). Nutrient additions are treated as fixed effects with blocks as random effects. Columns show the degrees of freedom (df), F ratios (F), and probability (p) for each treatment. Bold values represent significant treatment effects.
| Density | Biomass | ||||||||
|---|---|---|---|---|---|---|---|---|---|
| September | December | September | December | ||||||
| Treatment | df | F | p | F | p | F | p | F | p |
| N addition | 1.33 | 2.87 | 0.10 | 5.84 | 0.02 | 6.78 | 0.01 | 6.88 | 0.01 |
| P addition | 1.33 | 1.17 | 0.29 | 0.29 | 0.59 | 6.23 | 0.02 | 3.20 | 0.08 |
| N × P interaction | 1.33 | 1.02 | 0.17 | 0.39 | 0.31 | 0.81 | 0.31 | 7.74 | 0.008 |
| Block | 11.33 | 1.53 | 0.32 | 1.22 | 0.53 | 3.36 | 0.003 | 2.20 | 0.04 |
Table 3.
Two-way factorial analysis of S. spontaneum leaf nutrient concentrations across treatments, showing the degrees of freedom (df), F ratios (F), and probability (p). Leaves were collected during the December S. spontaneum harvest, following July and October fertilization treatments. Nutrient additions are treated as fixed effects with blocks as random effects. Bold values represent significant treatment effects.
| Leaf N (mg/g) | Leaf P (mg/g) | Leaf N:P | |||||
|---|---|---|---|---|---|---|---|
| Treatment | df | F | p | F | p | F | p |
| N addition | 1.33 | 10.82 | 0.002 | 0.22 | 0.64 | 6.71 | 0.01 |
| P addition | 1.33 | 0.40 | 0.53 | 65.20 | <0.001 | 126.63 | <0.001 |
| N × P interaction | 1.33 | 2.10 | 0.16 | 0.08 | 0.77 | 0.51 | 0.48 |
| Block | 11.33 | 2.19 | 0.04 | 3.94 | 0.001 | 5.14 | <0.001 |
Disclaimer/Publisher’s Note: The statements, opinions and data contained in all publications are solely those of the individual author(s) and contributor(s) and not of MDPI and/or the editor(s). MDPI and/or the editor(s) disclaim responsibility for any injury to people or property resulting from any ideas, methods, instructions or products referred to in the content. |
© 2023 by the authors. Licensee MDPI, Basel, Switzerland. This article is an open access article distributed under the terms and conditions of the Creative Commons Attribution (CC BY) license (https://creativecommons.org/licenses/by/4.0/).
Share and Cite
MDPI and ACS Style
Cummings, J.A.; Parker, I.M.; Gilbert, G.S. The Influence of Nitrogen and Phosphorus Addition on Growth of the Invasive C4 Grass Saccharum spontaneum. Int. J. Plant Biol. 2023, 14, 474-482. https://doi.org/10.3390/ijpb14020036
AMA Style
Cummings JA, Parker IM, Gilbert GS. The Influence of Nitrogen and Phosphorus Addition on Growth of the Invasive C4 Grass Saccharum spontaneum. International Journal of Plant Biology. 2023; 14(2):474-482. https://doi.org/10.3390/ijpb14020036
Chicago/Turabian StyleCummings, Justin A., Ingrid M. Parker, and Gregory S. Gilbert. 2023. "The Influence of Nitrogen and Phosphorus Addition on Growth of the Invasive C4 Grass Saccharum spontaneum" International Journal of Plant Biology 14, no. 2: 474-482. https://doi.org/10.3390/ijpb14020036