
Hypomyelinating Leukodystrophy 10 (HLD10)-Associated Mutations of PYCR2 Form Large Size Mitochondria, Inhibiting Oligodendroglial Cell Morphological Differentiation
 , and
, and 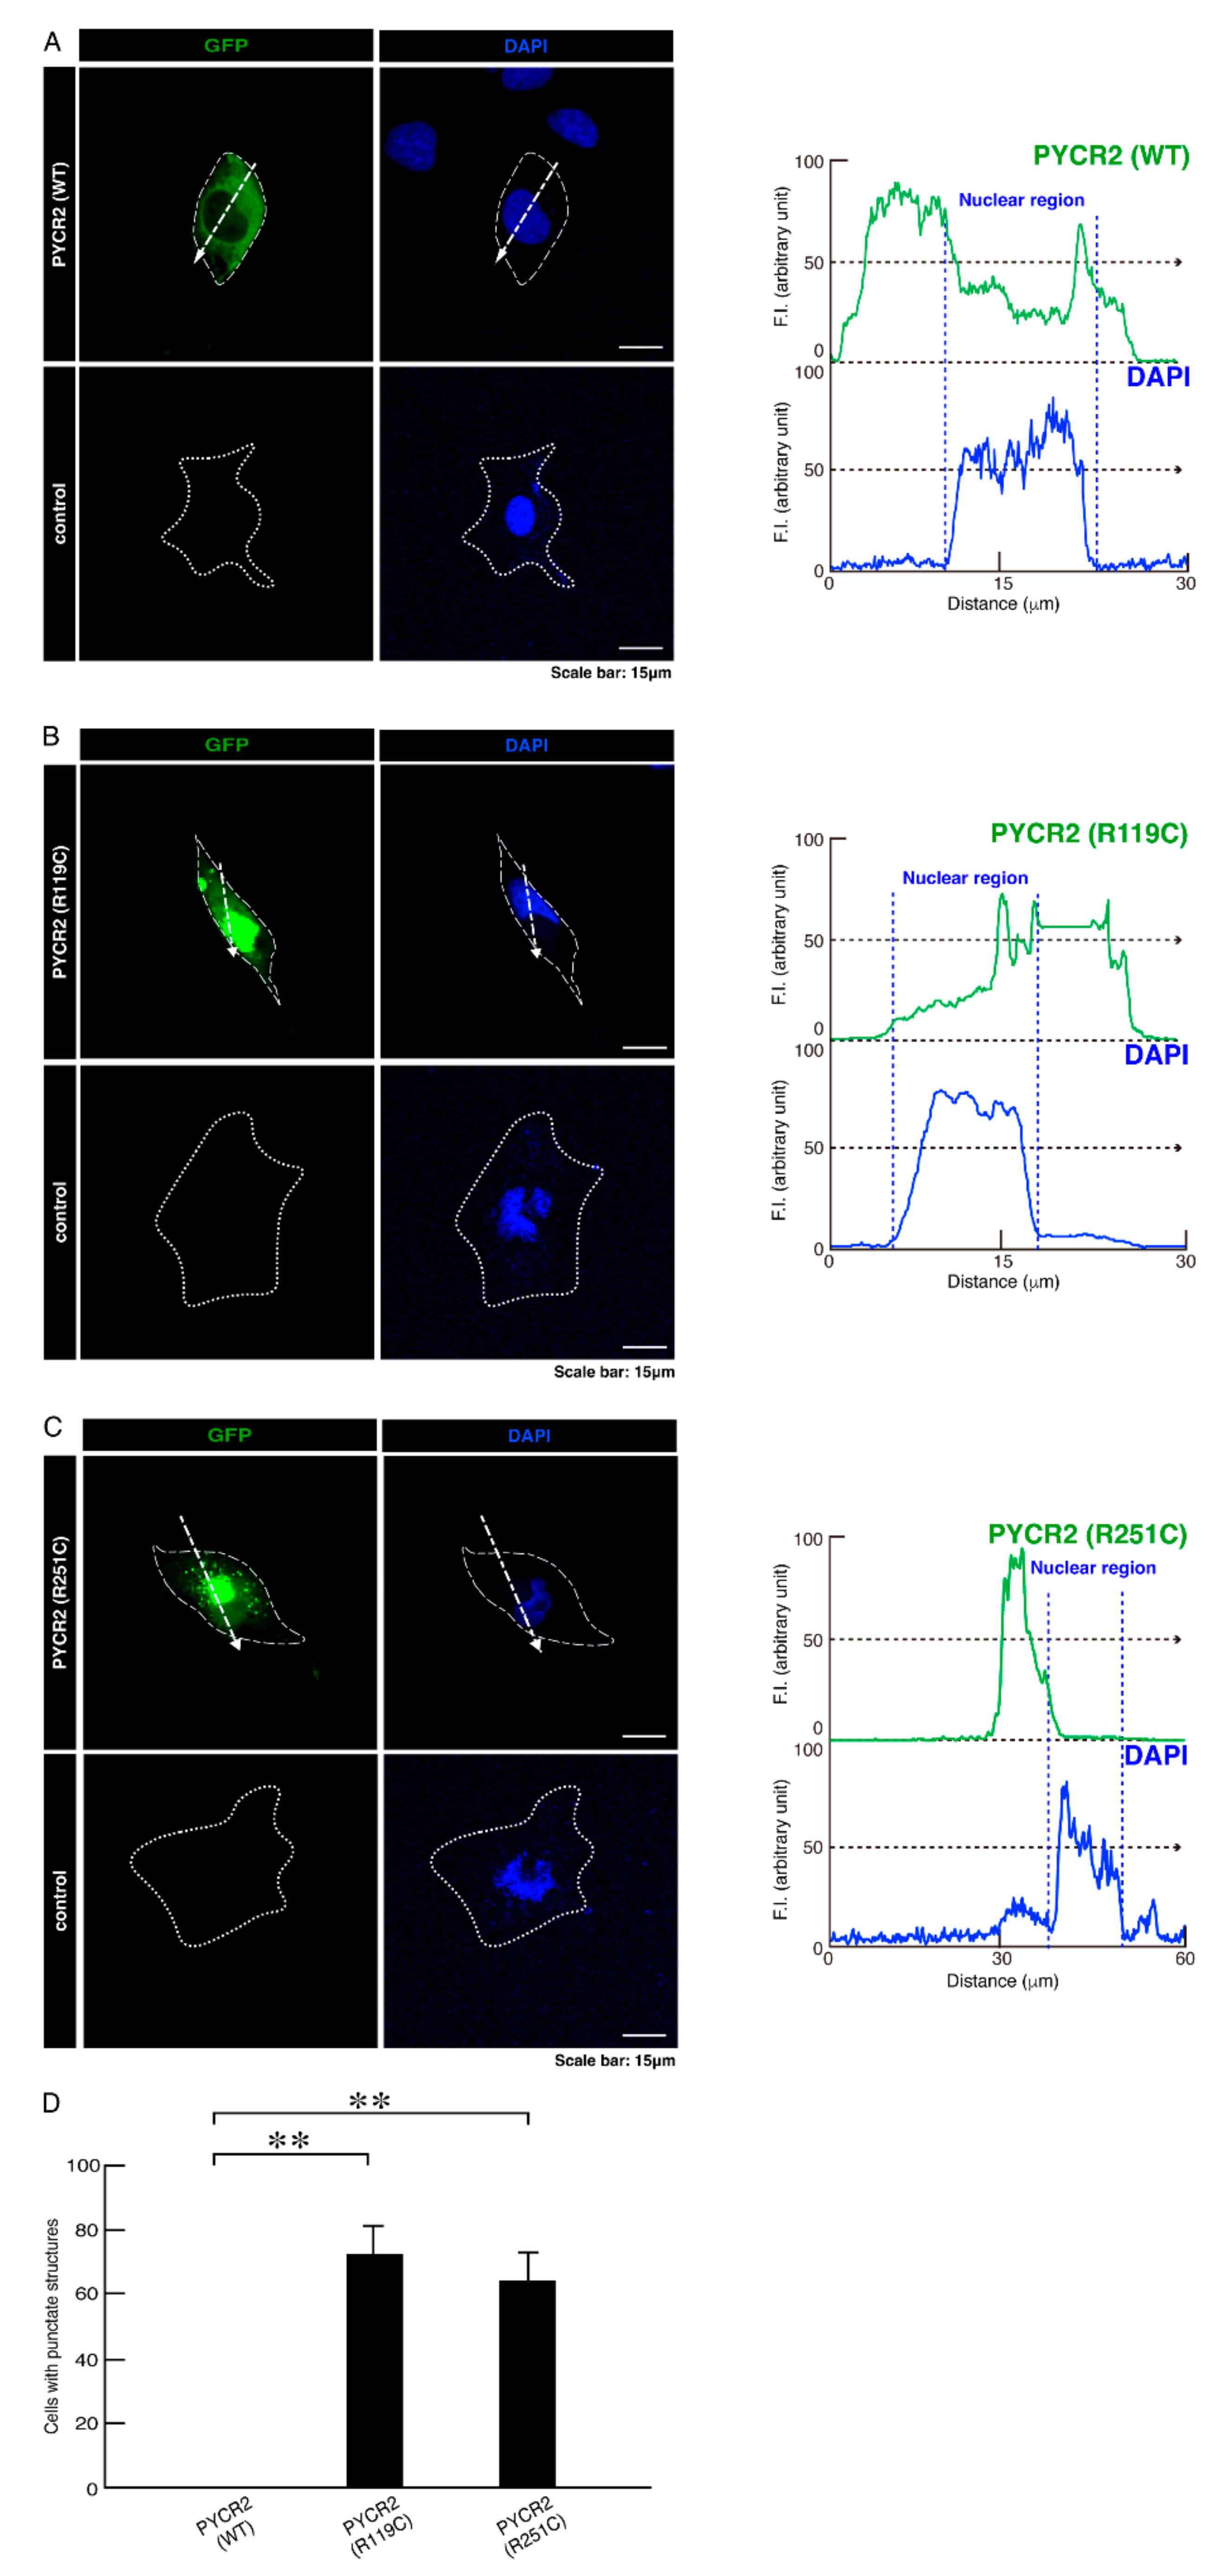
Abstract
:1. Introduction
2. Material and Methods
2.1. Primary and Secondary Antibodies and Chemicals
2.2. Construction of Plasmids
2.3. Cell Culture and Differentiation
2.4. Transfection
2.5. Capturing Confocal Images
2.6. Polyacrylamide Gel Electrophoresis and Immunoblotting
2.7. Statistical Analysis
2.8. Ethics Statement
3. Results
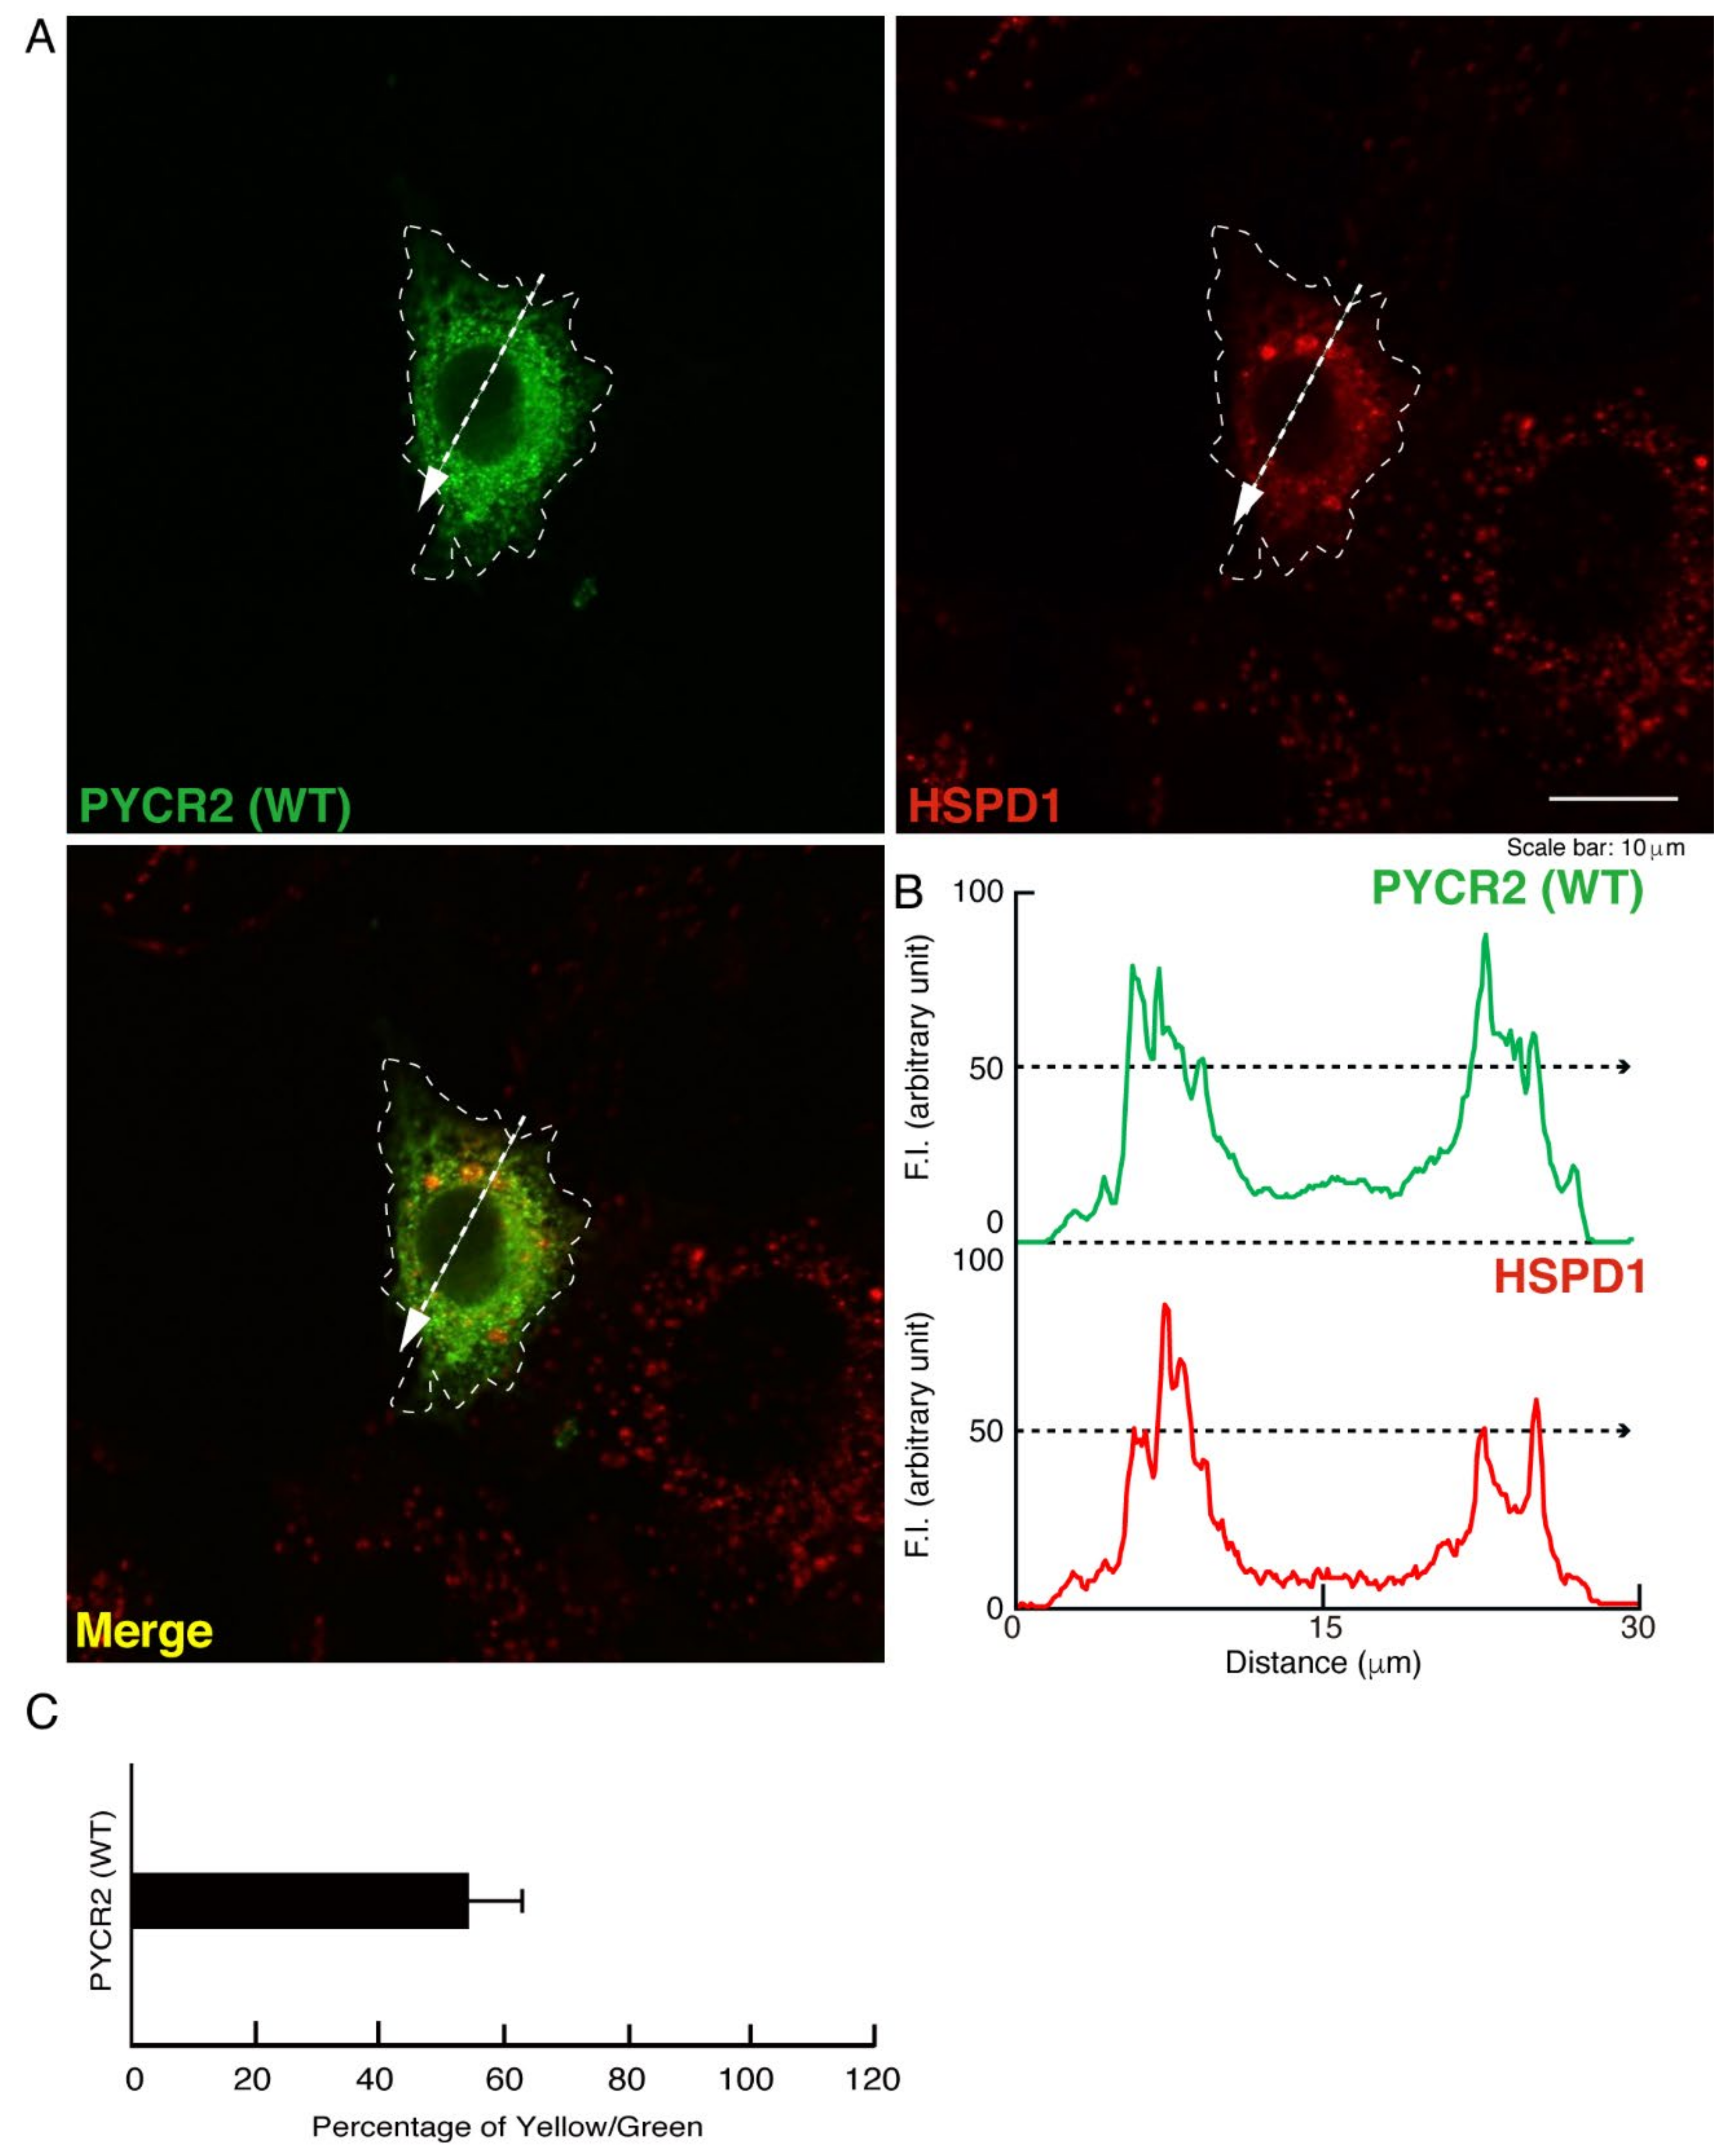
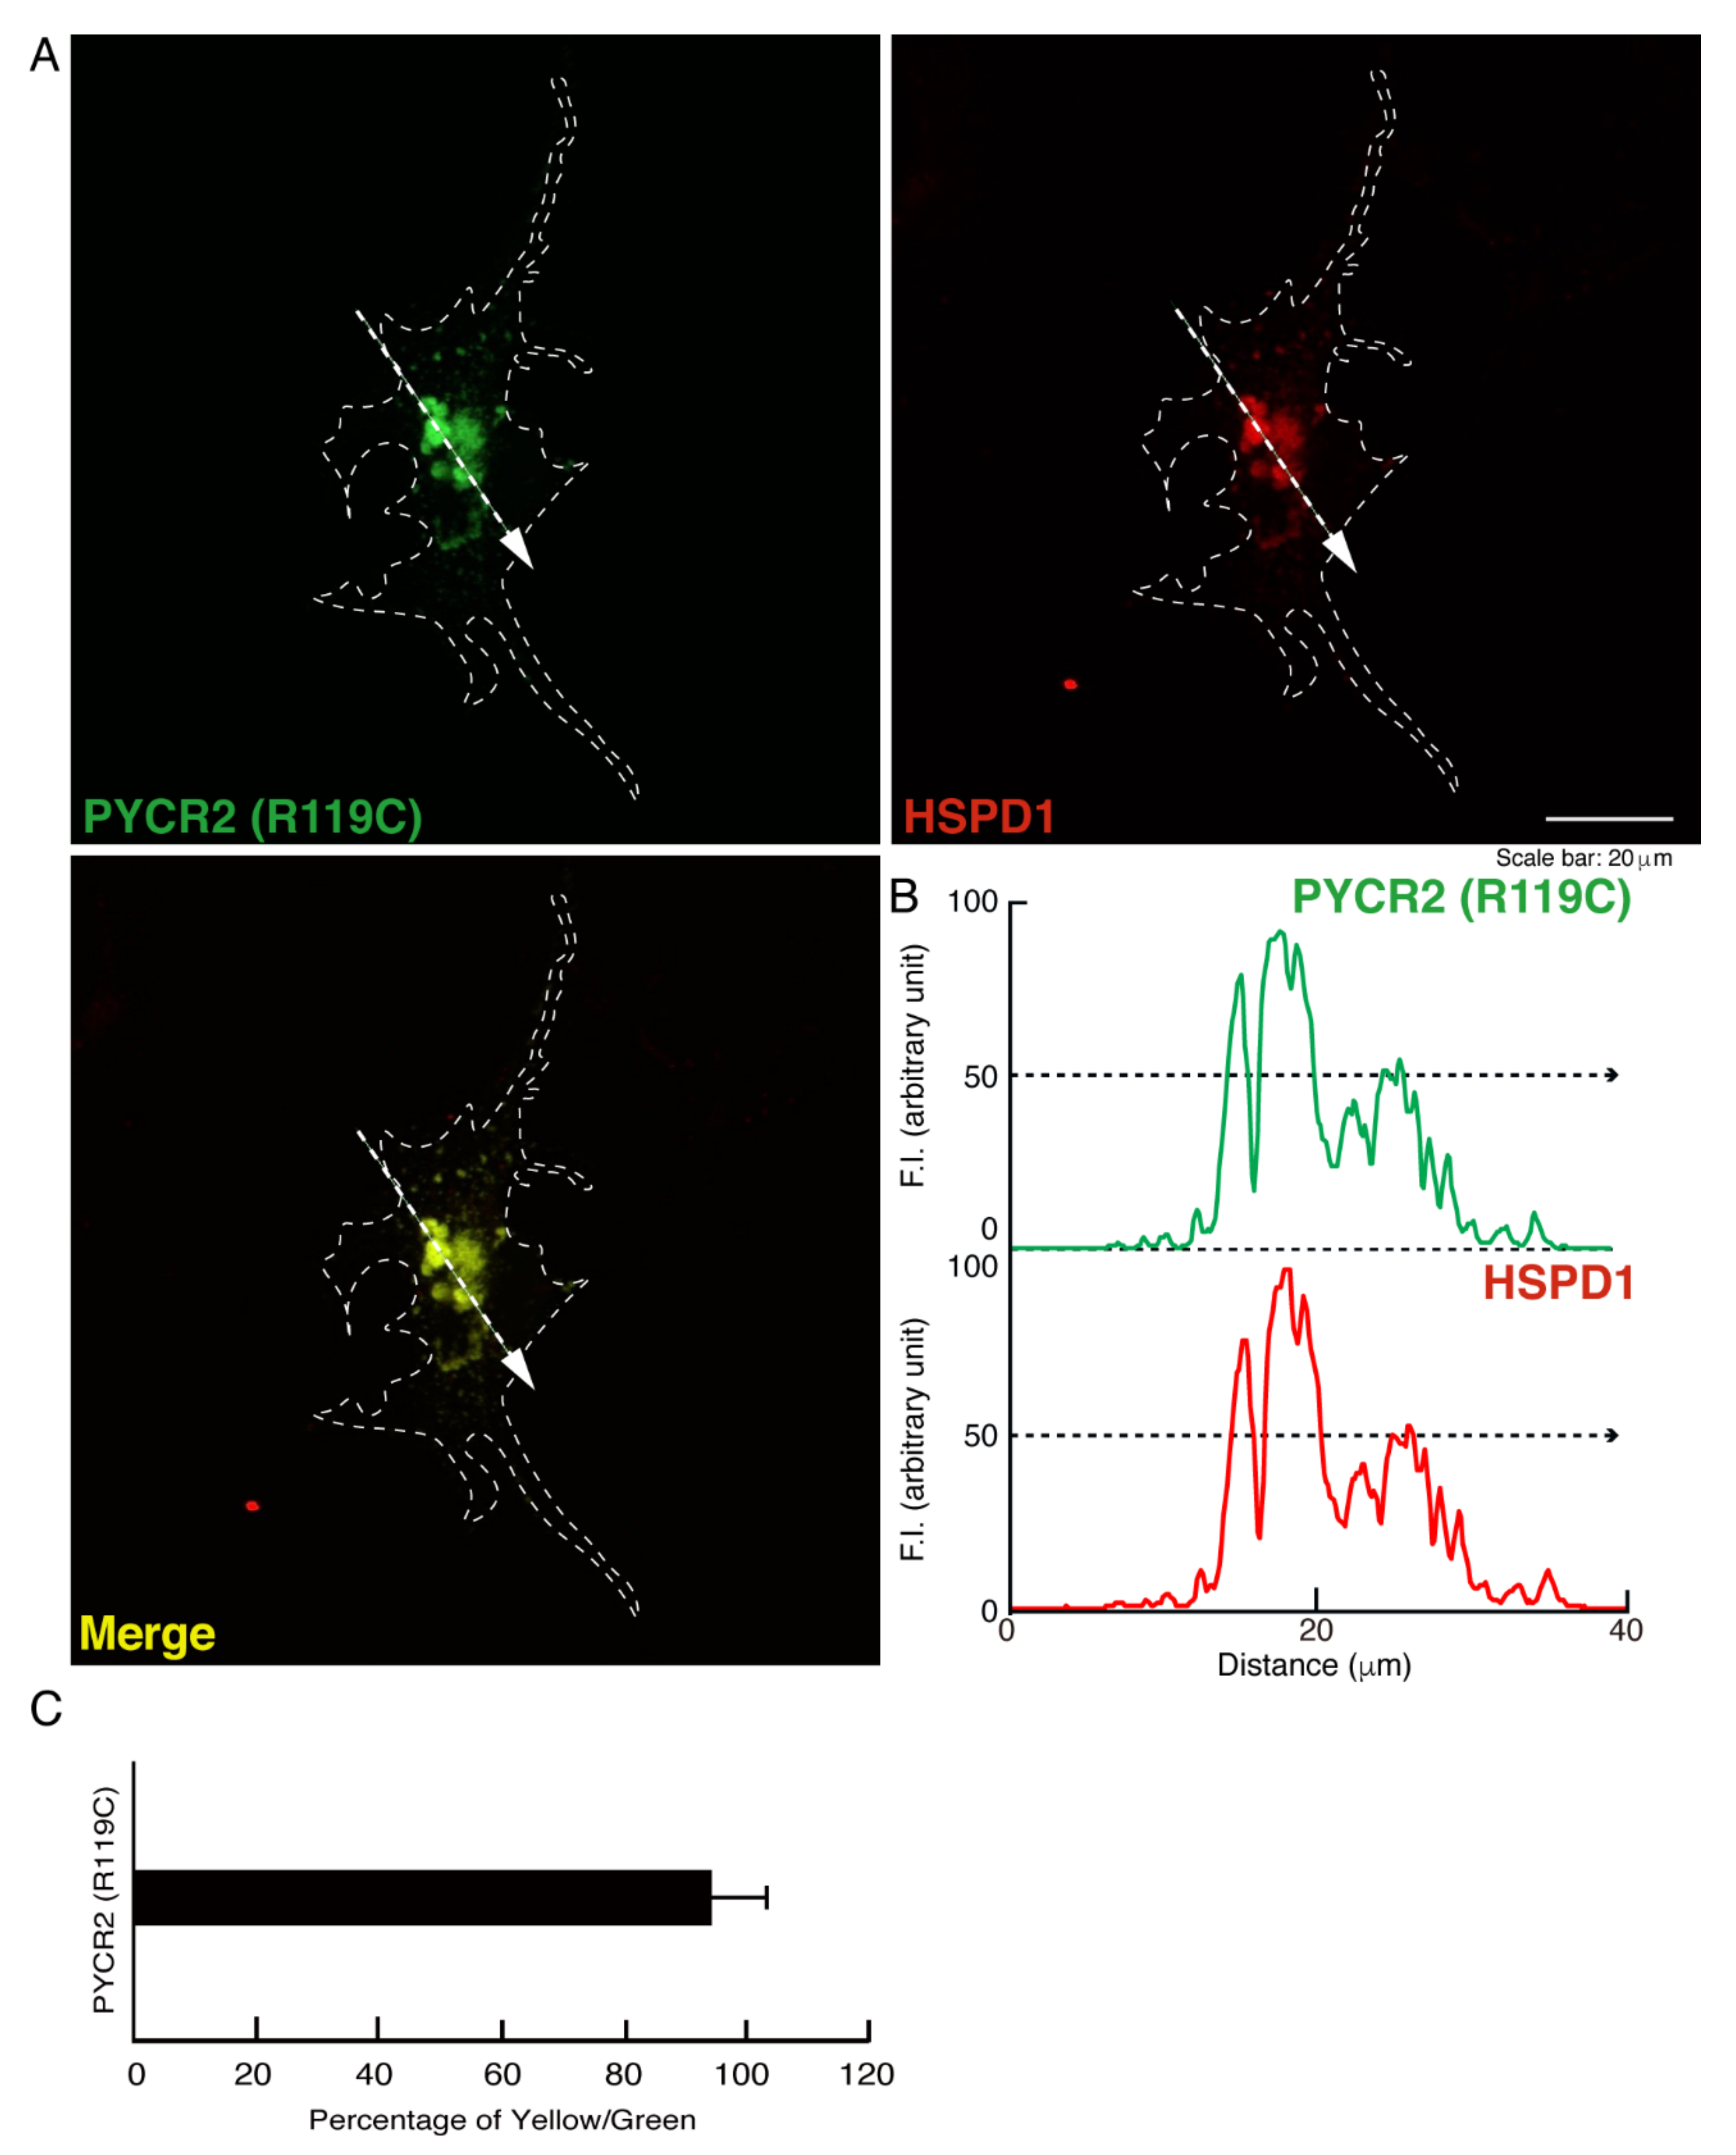
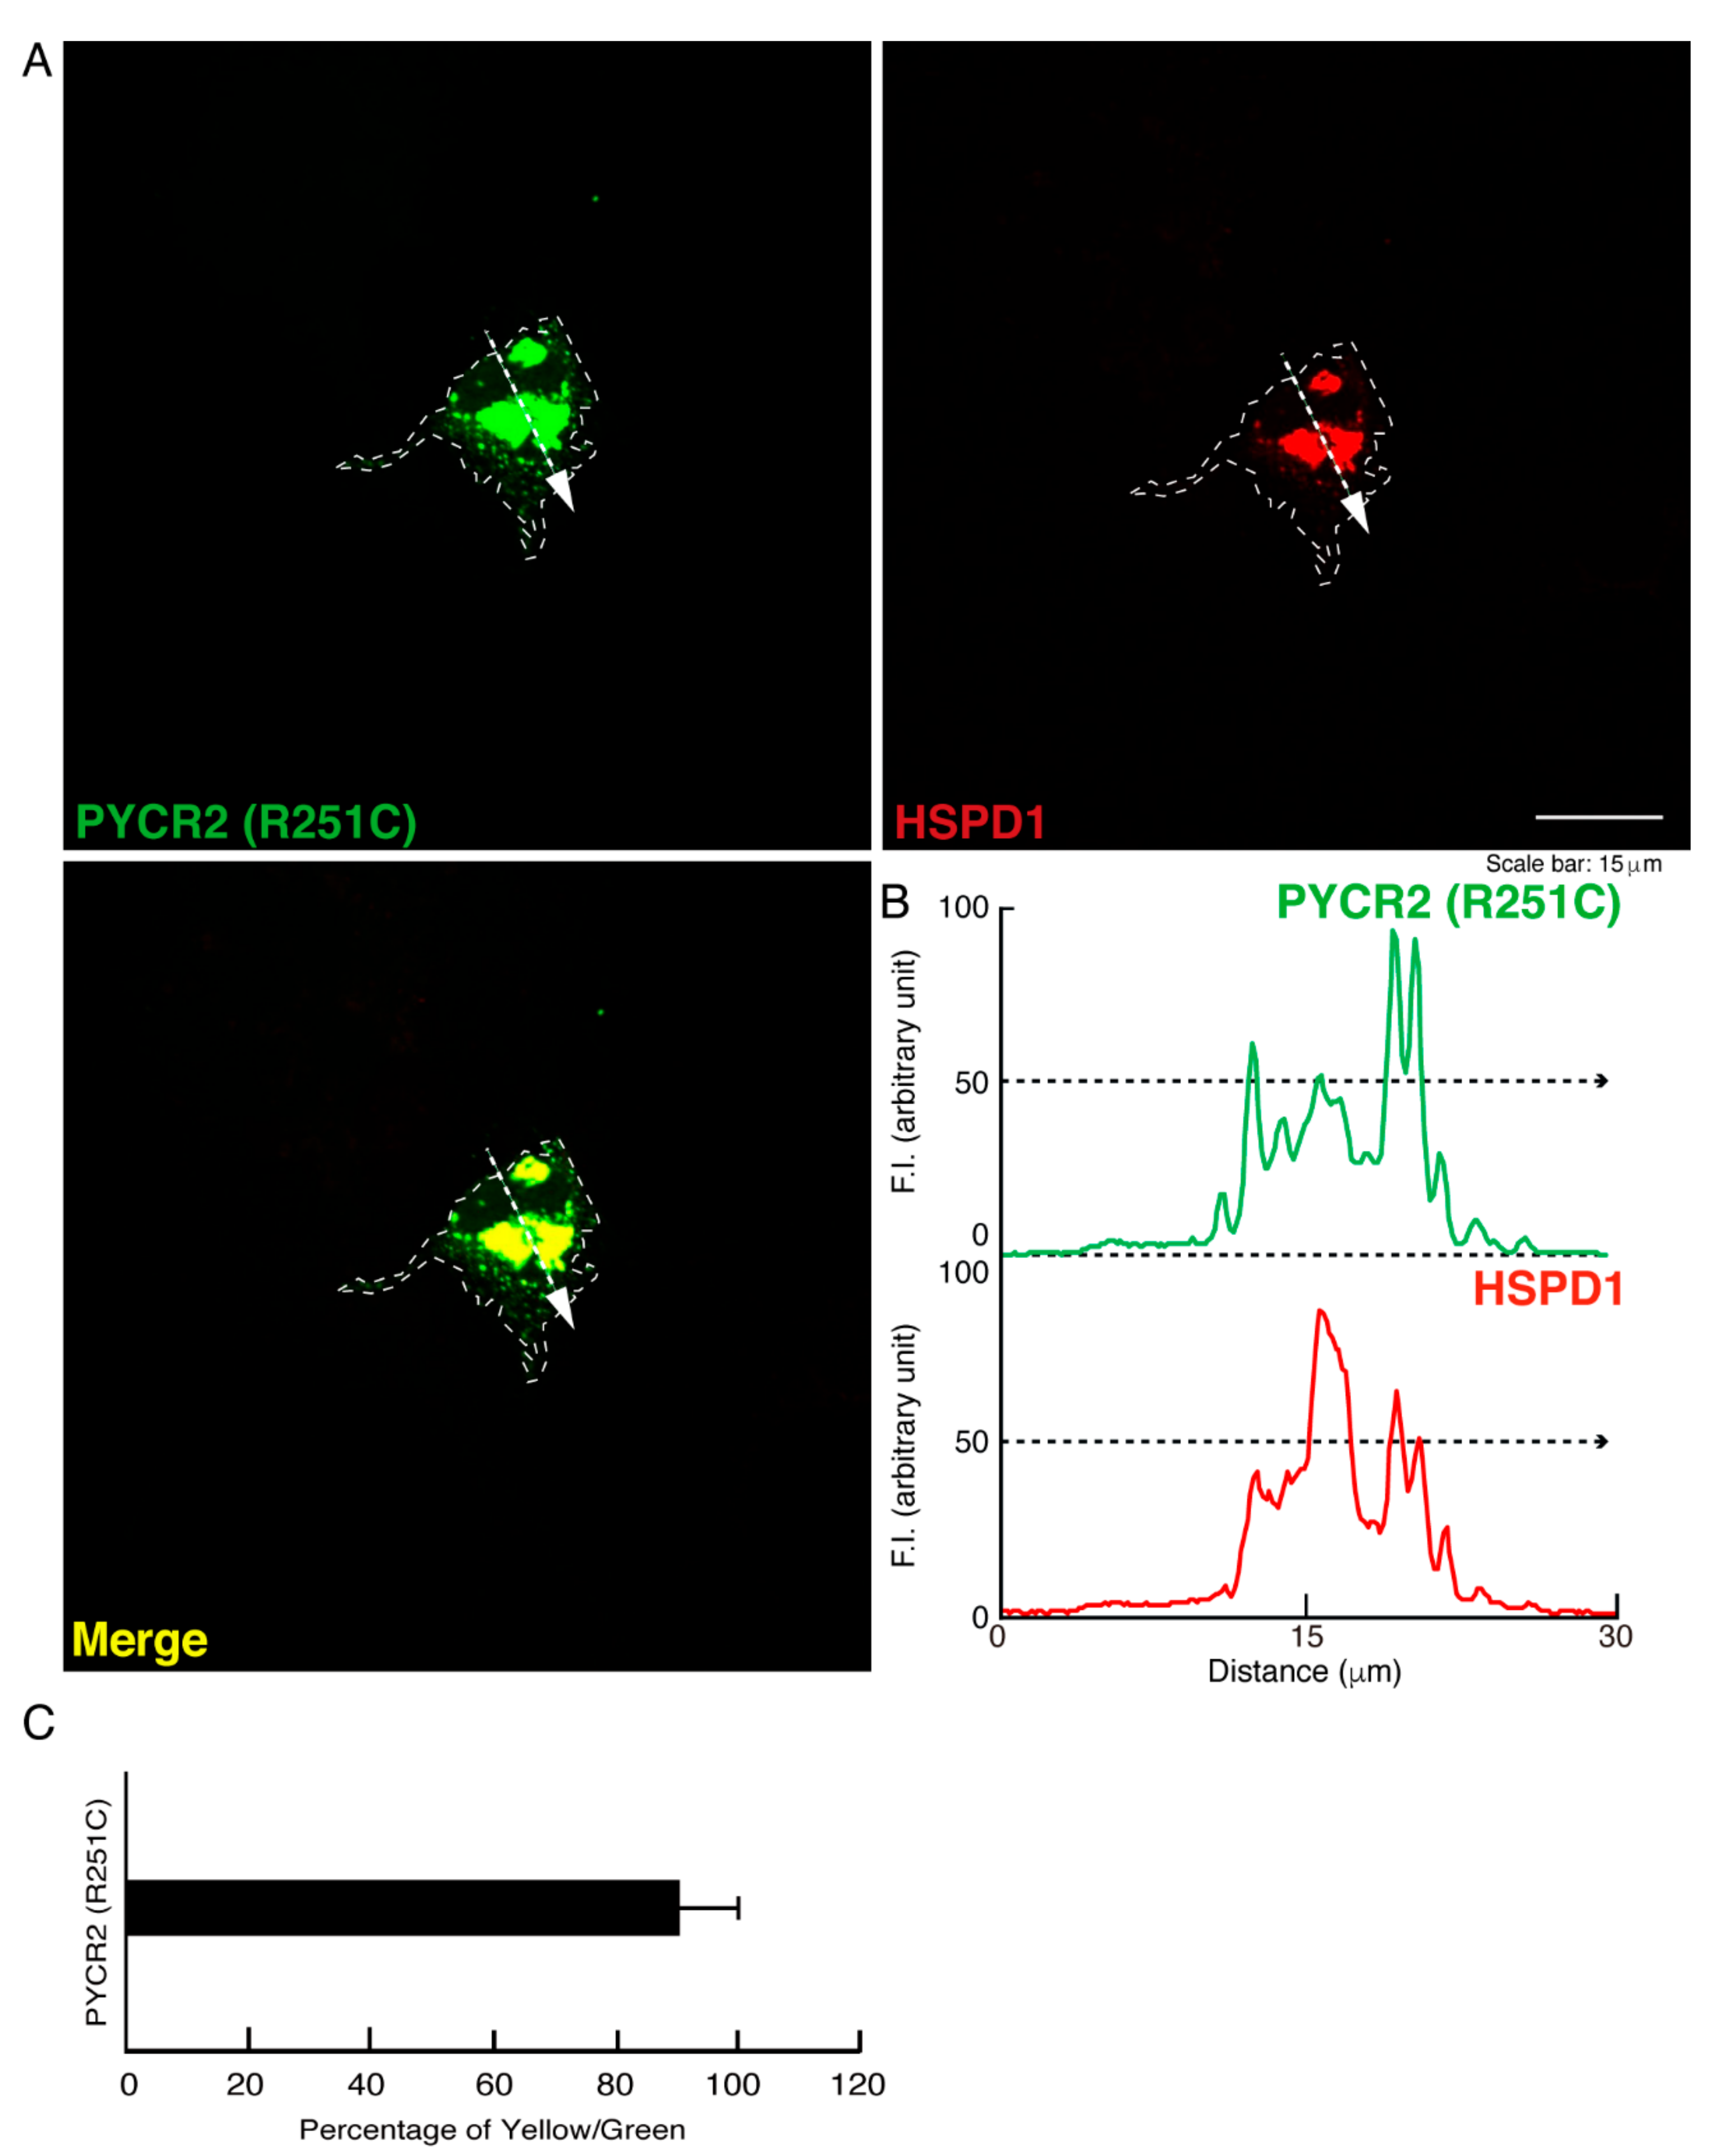
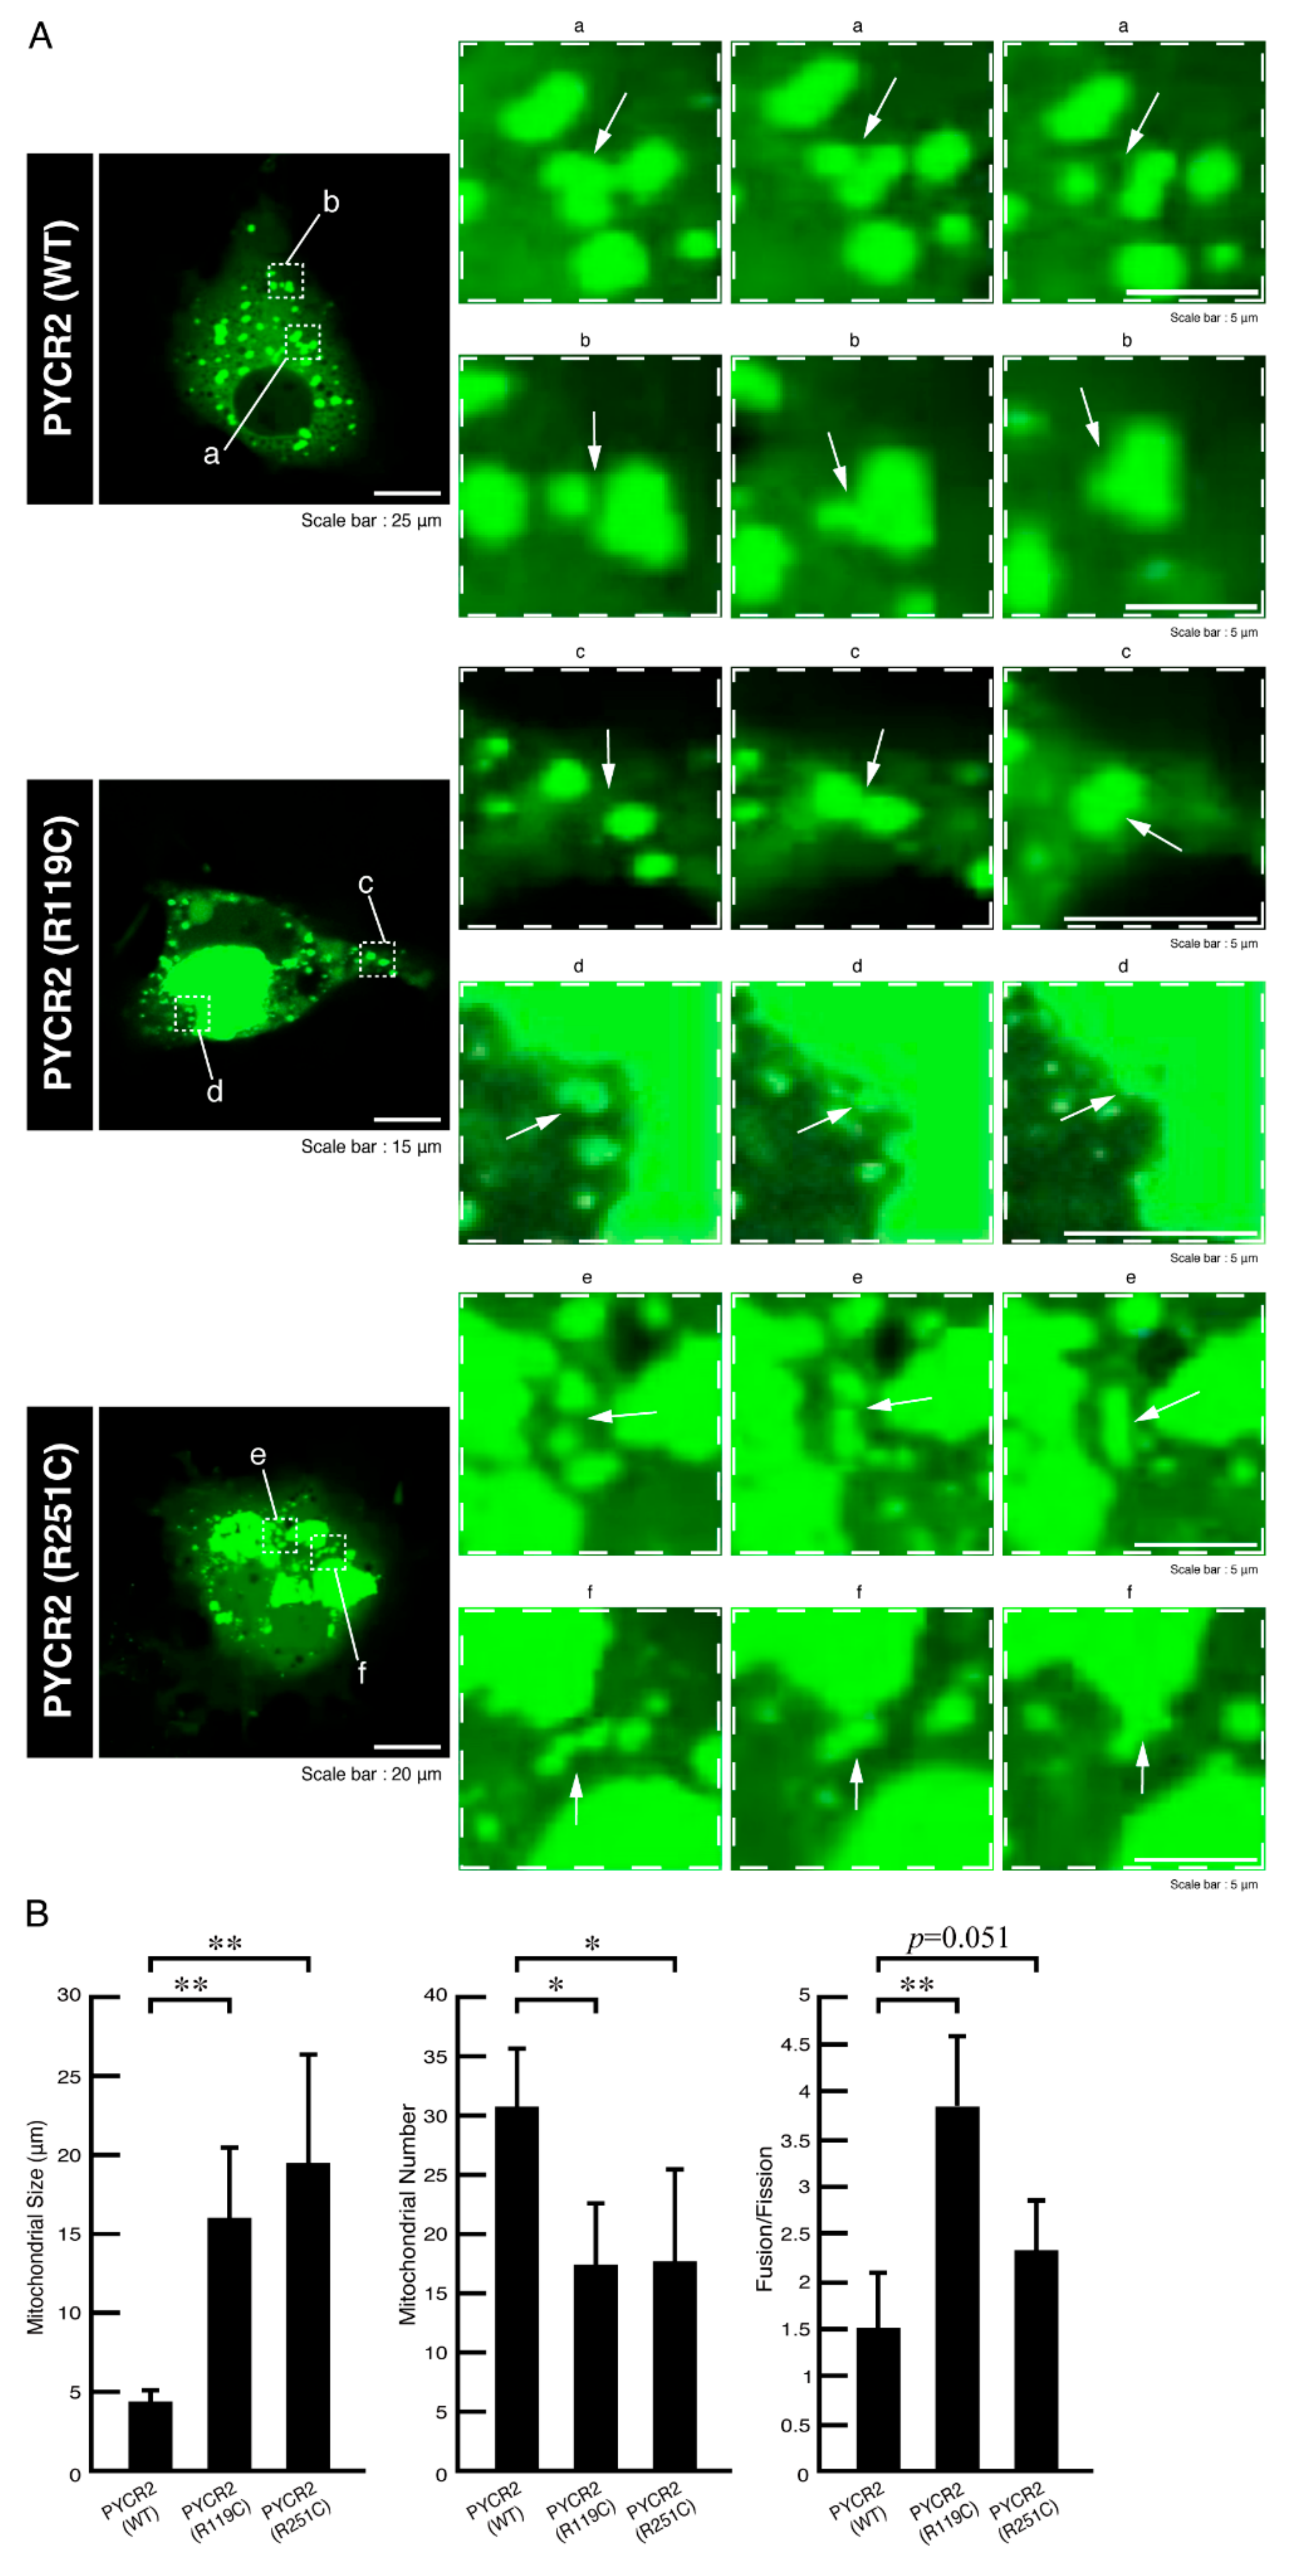
3.1. R119C or R251C Mutant Proteins Are Specifically Localized in Mitochondria and Involved in Forming Large Size Mitochondria
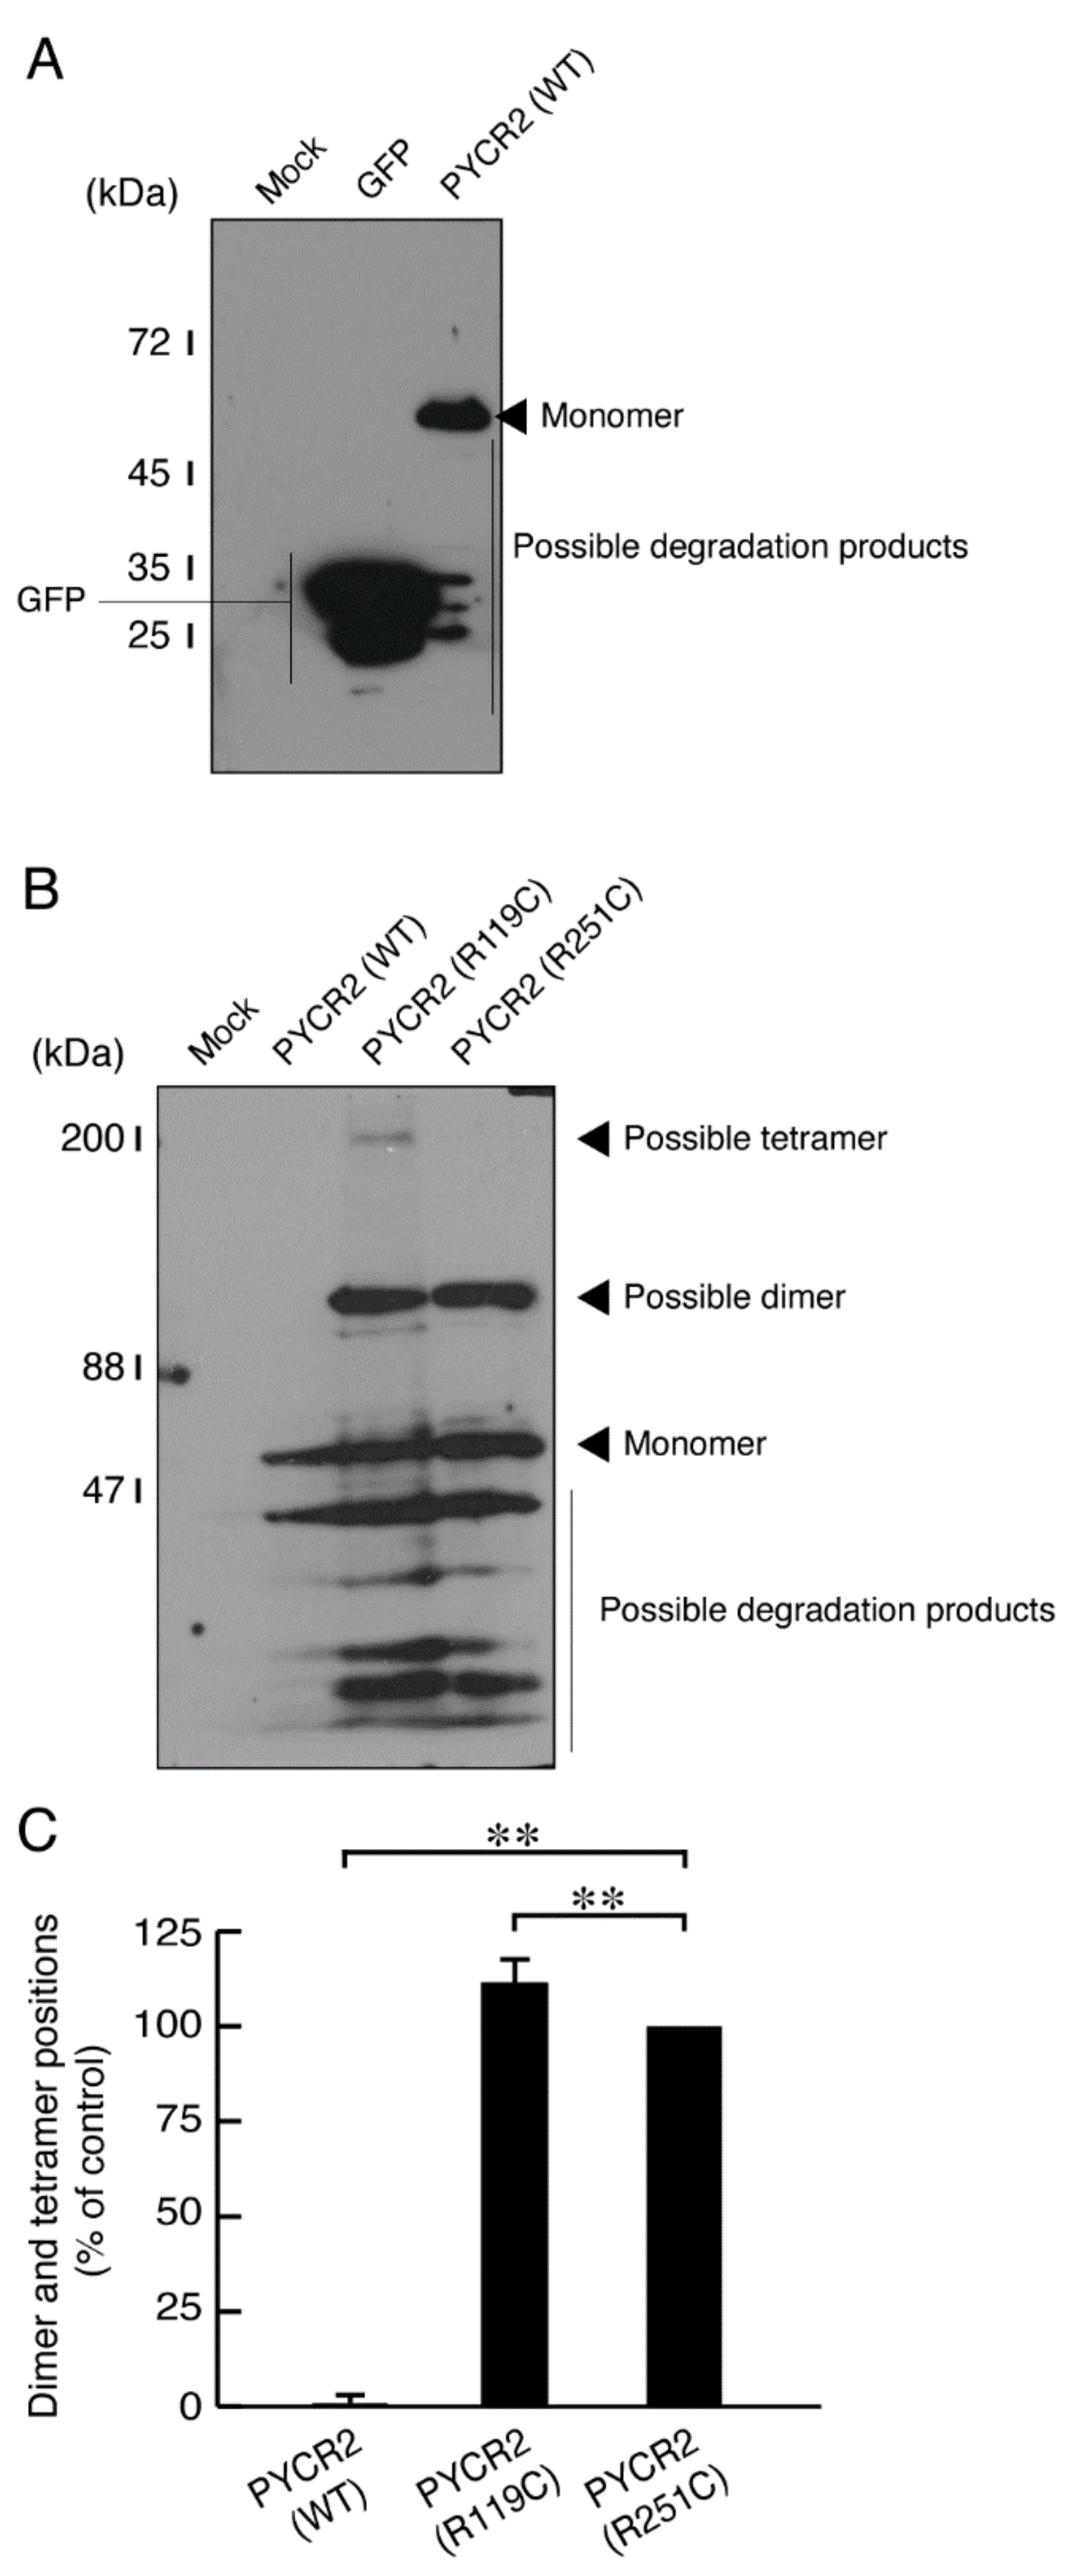
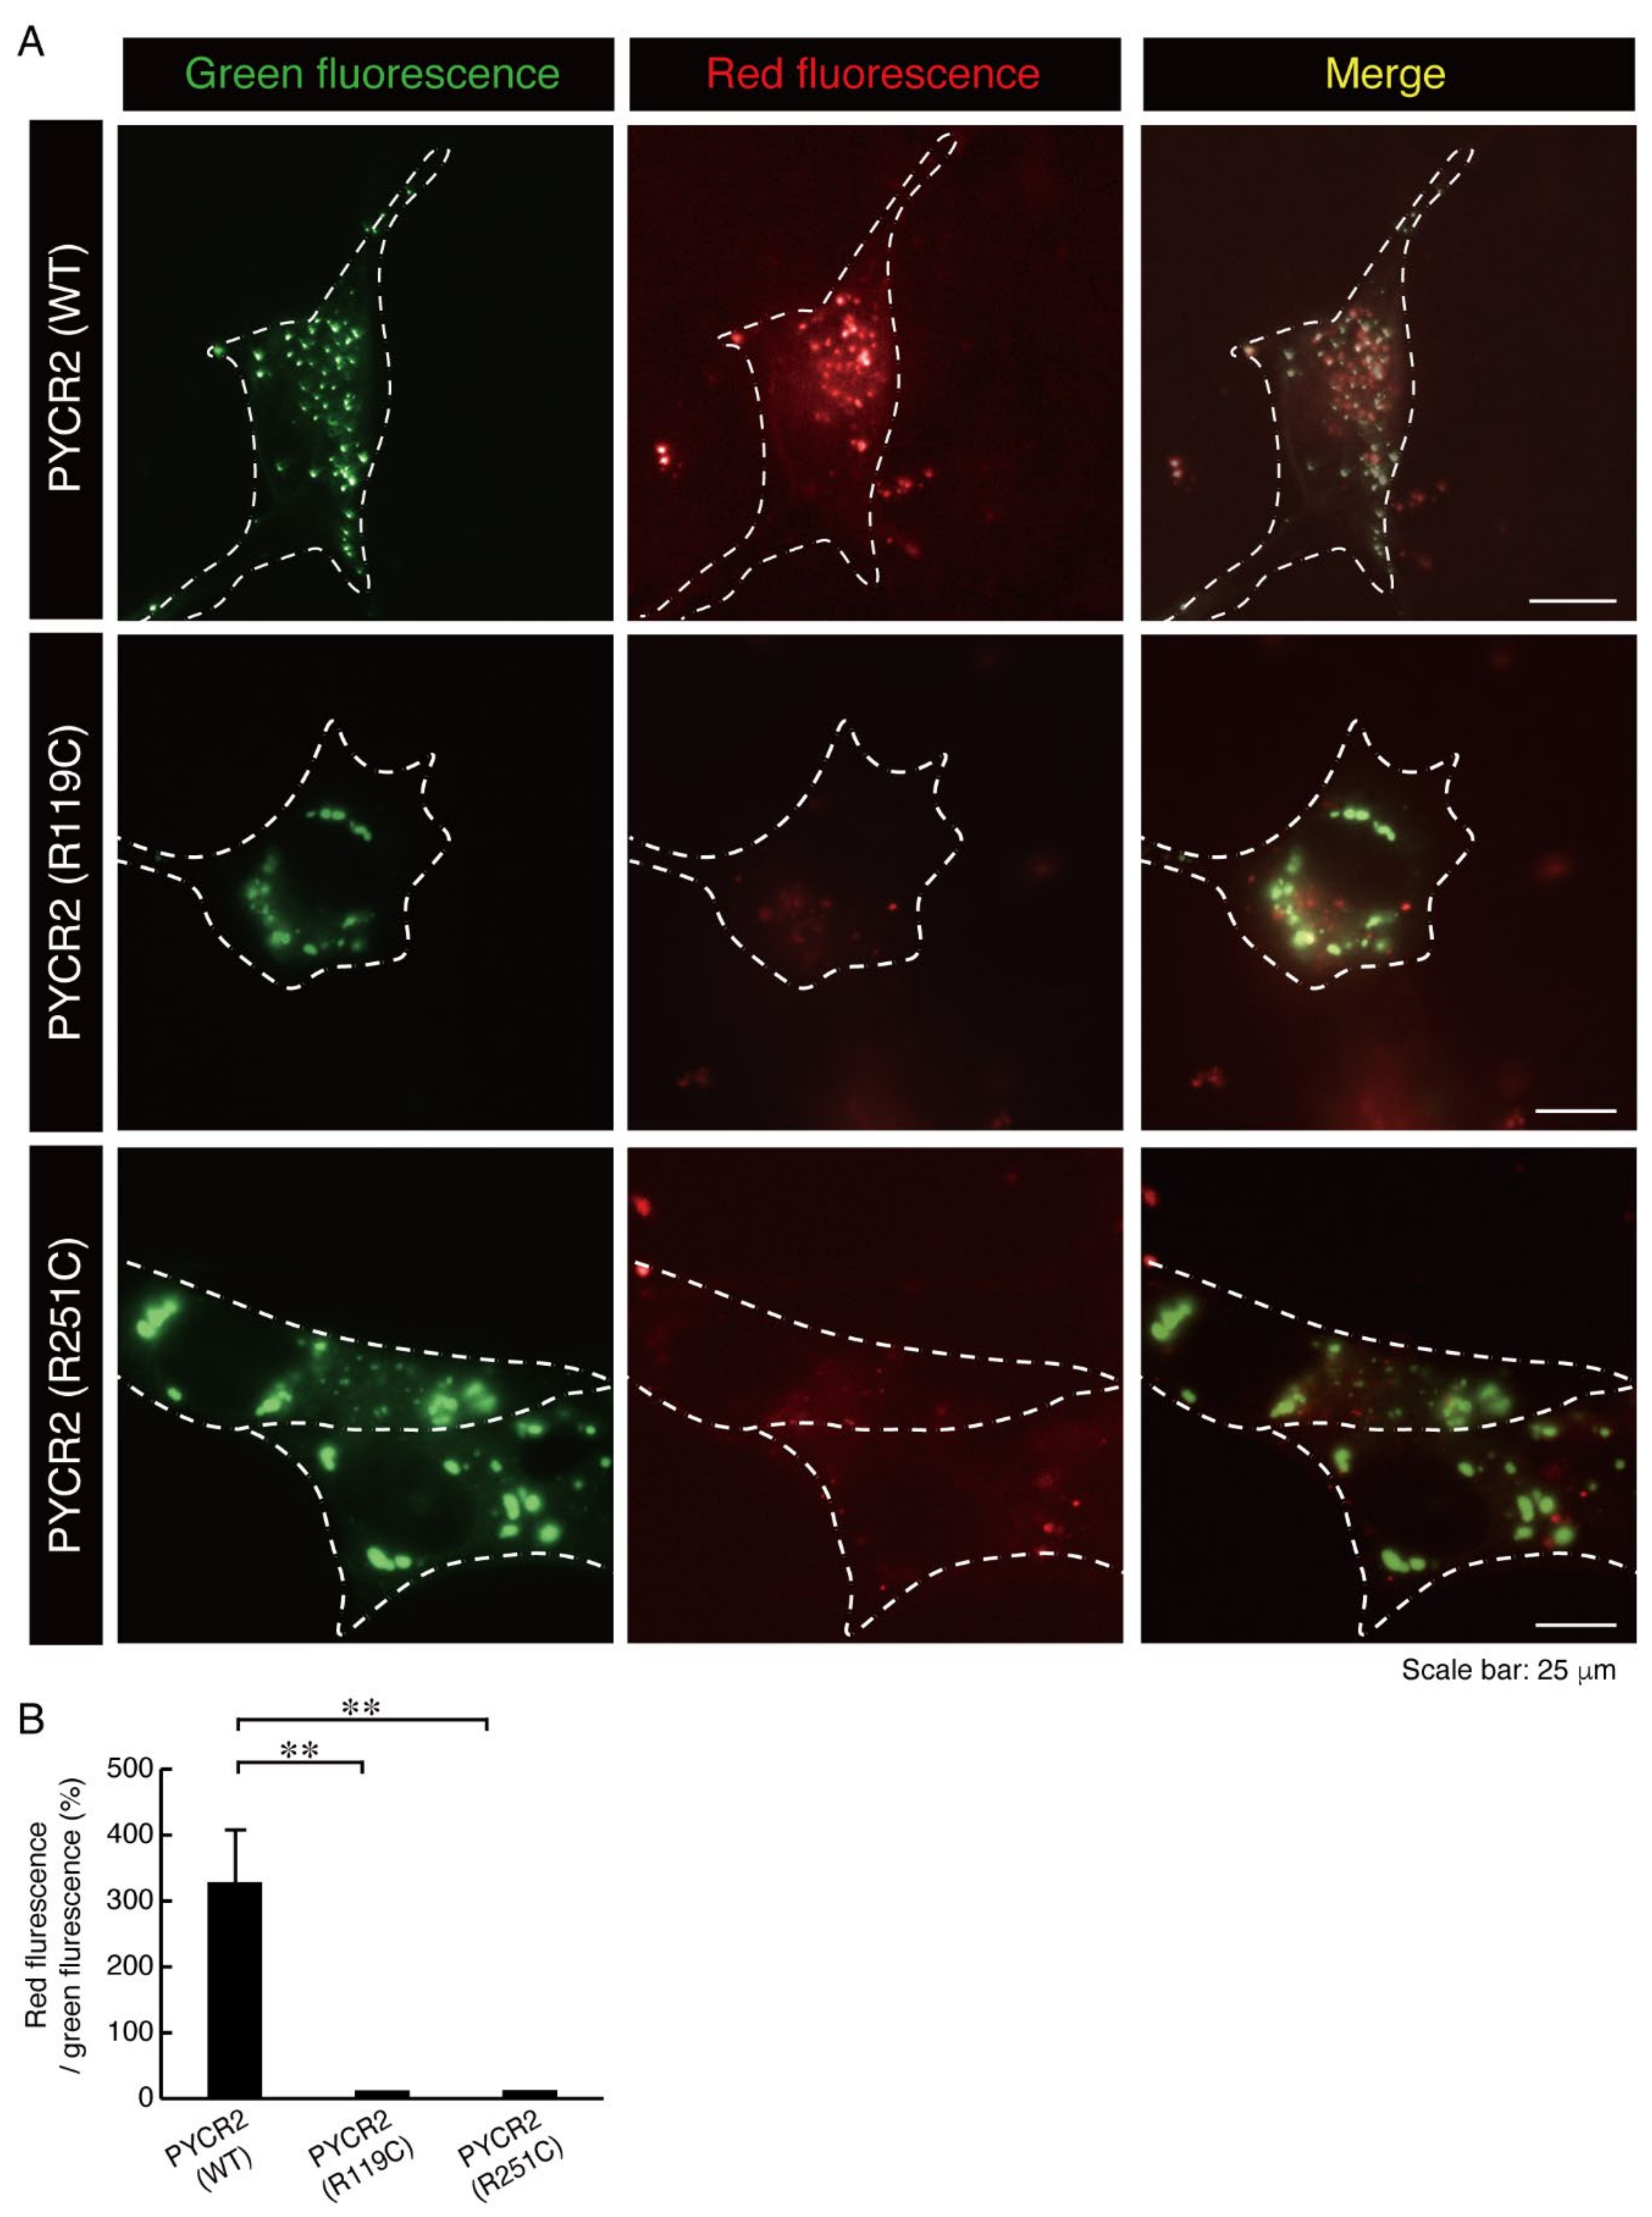
3.2. R119C or R251C Mutant Proteins Comparatively Increase Mitochondrial Fusion Activities and Decrease Membrane Potential Activities
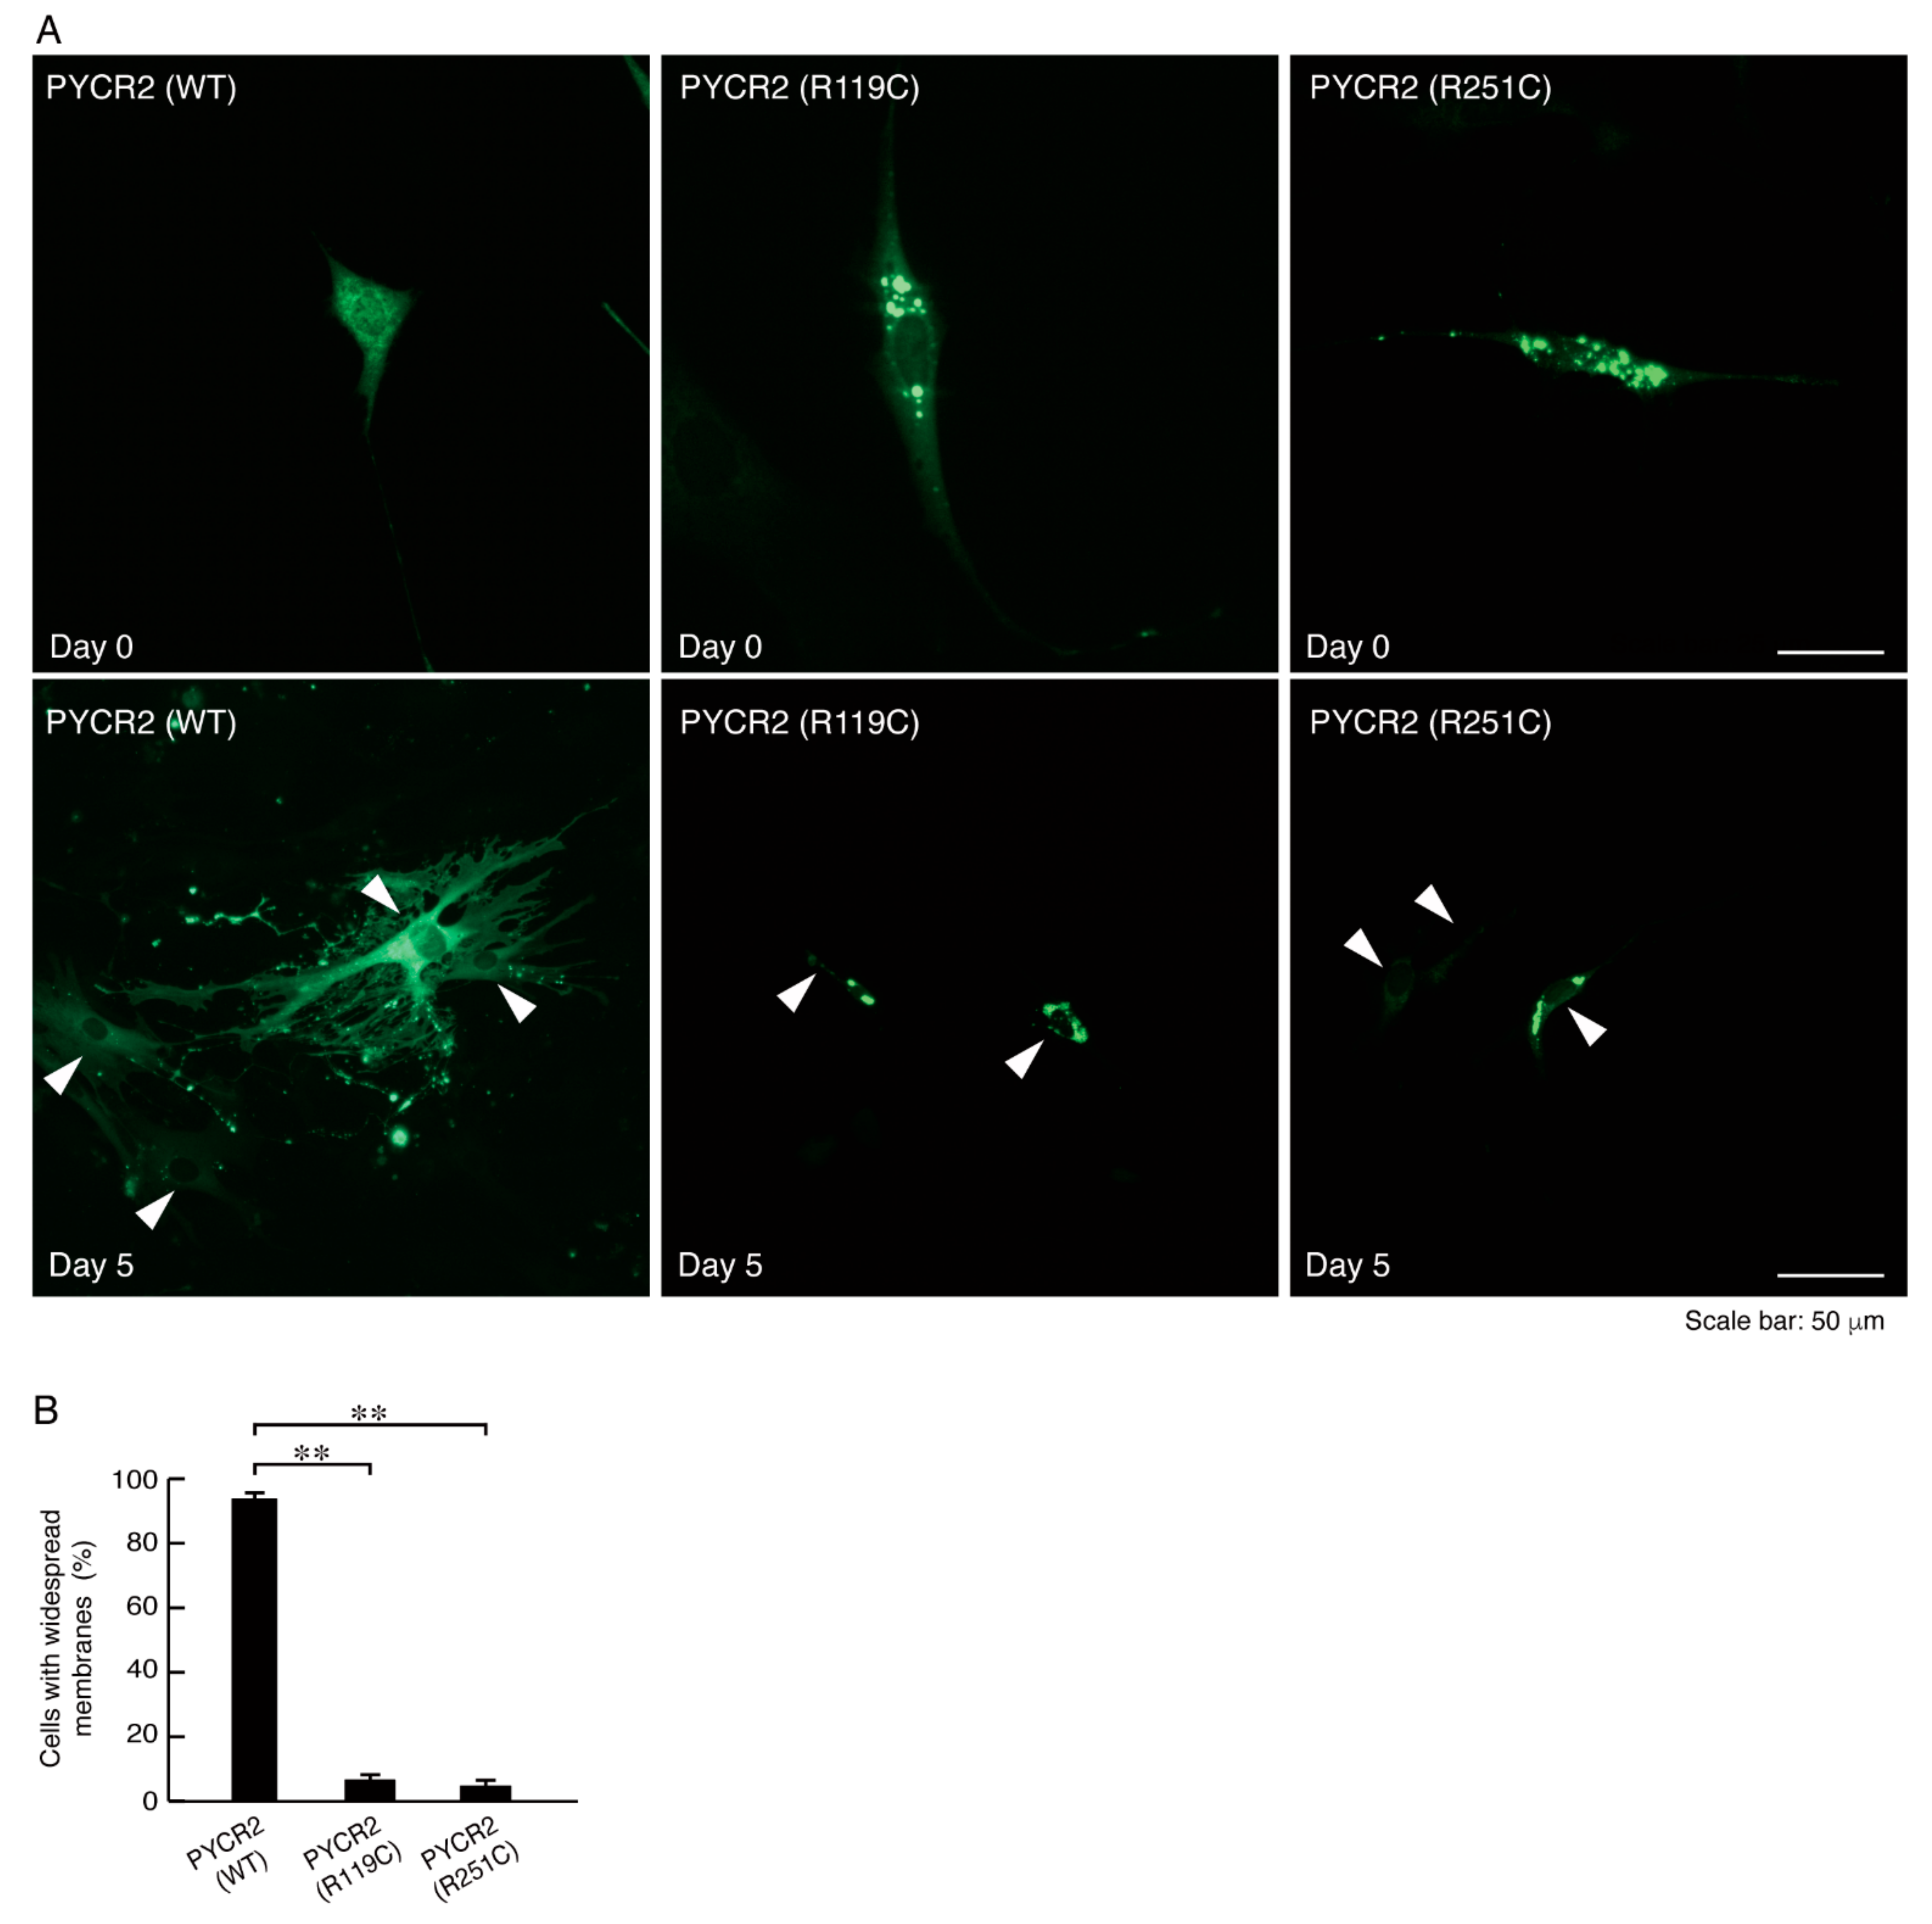
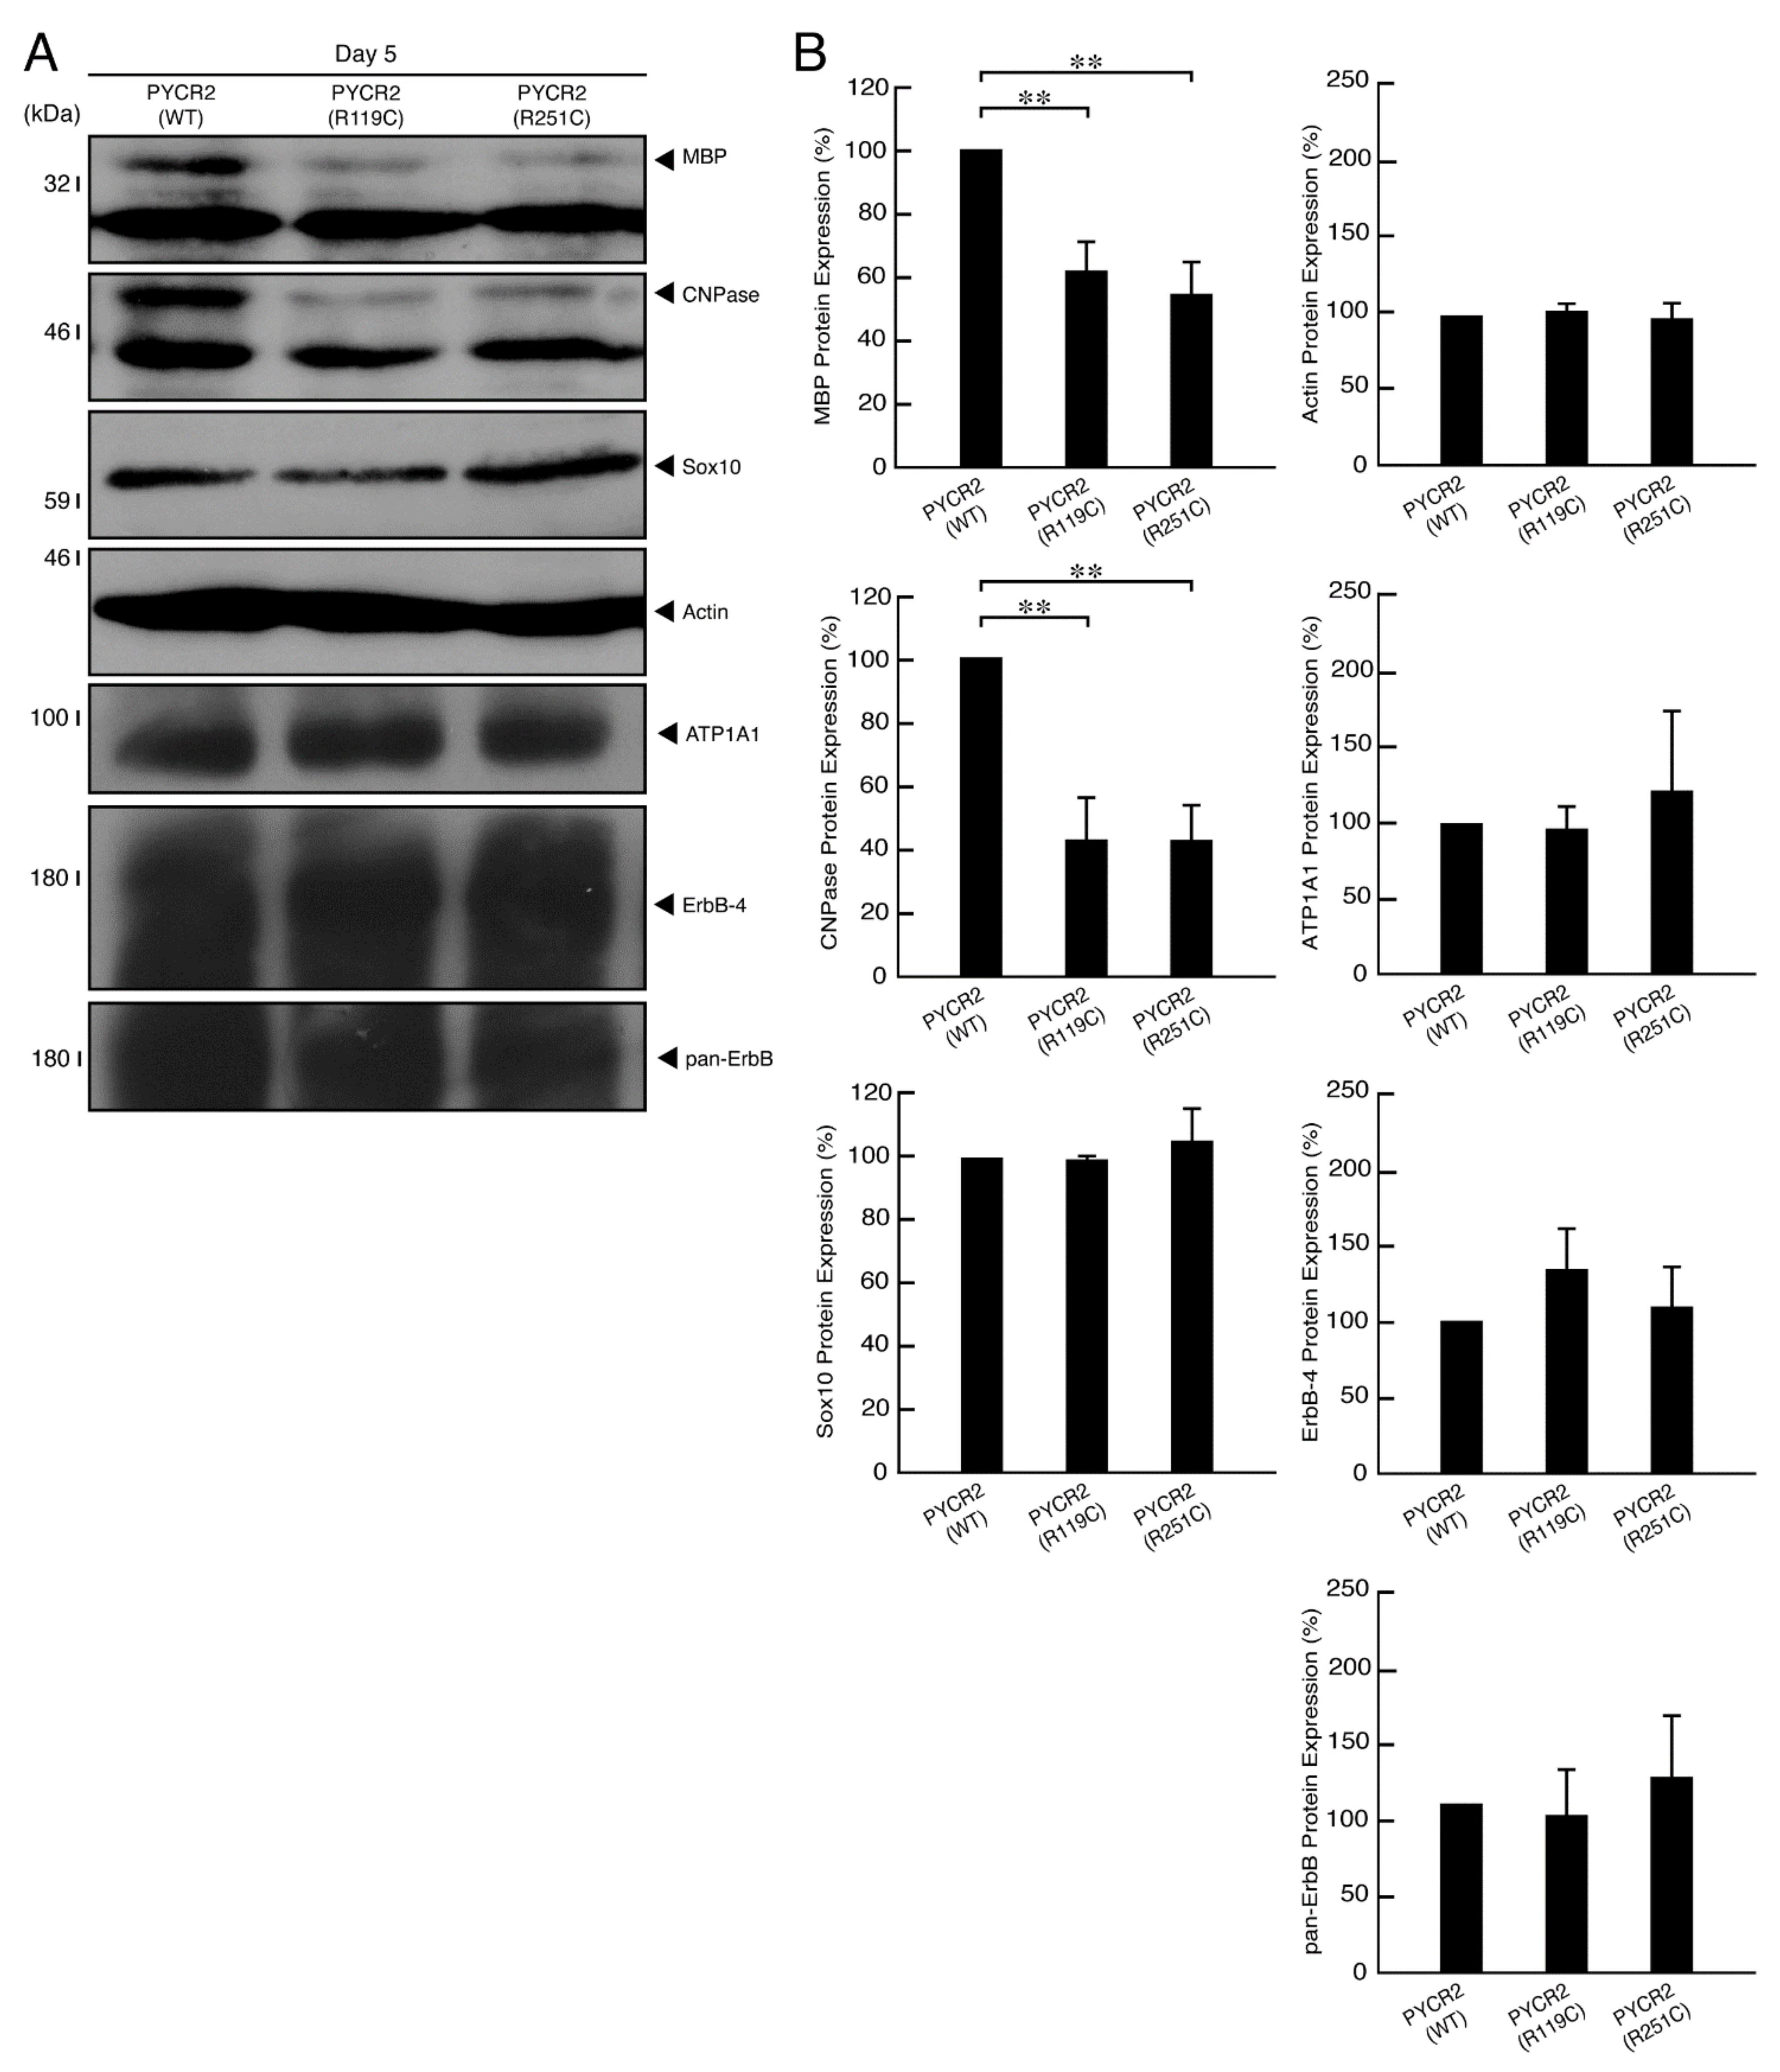
3.3. R119C or R251C Mutant Proteins Inhibit Morphological Differentiation with Widespread Membranes
4. Discussion
Supplementary Materials
Author Contributions
Funding
Institutional Review Board Statement
Informed Consent Statement
Data Availability Statement
Acknowledgments
Conflicts of Interest
References
- Garbern, J.; Cambi, F.; Shy, M.; Kamholz, J. The molecular pathogenesis of Pelizaeus-Merzbacher disease. Arch. Neurol. 1999, 56, 1210–1214. [Google Scholar] [CrossRef] [PubMed]
- Dhaunchak, A.S.; Colman, D.R.; Nave, K.A. Misalignment of PLP/DM20 transmembrane domains determines protein misfolding in Pelizaeus-Merzbacher disease. J. Neurosci. 2011, 31, 14961–14971. [Google Scholar] [CrossRef] [PubMed] [Green Version]
- Inoue, K. Pelizaeus-Merzbacher disease: Molecular and cellular pathologies and associated phenotypes. Adv. Exp. Med. Biol. 2019, 1190, 201–216. [Google Scholar] [PubMed]
- Wolf, N.I.; Ffrench-Constant, C.; van der Knaap, M.S. Hypomyelinating leukodystrophies-unravelling myelin biology. Nat. Rev. Neurol. 2021, 17, 88–103. [Google Scholar] [CrossRef]
- Simons, M.; Lyons, D.A. Axonal selection and myelin sheath generation in the central nervous system. Curr. Opin. Cell Biol. 2013, 25, 512–519. [Google Scholar] [CrossRef]
- Morton, D.P.; Ishibashi, N.; Jonas, A.R.; Gallo, V. Congenital cardiac anomalies and white matter injury. Trends Neurosci. 2015, 38, 353–563. [Google Scholar] [CrossRef] [Green Version]
- Saab, A.S.; Nave, K.A. Myelin dynamics: Protecting and shaping neuronal functions. Curr. Opin. Neurobiol. 2017, 47, 104–112. [Google Scholar] [CrossRef]
- Abu-Rub, M.; Miller, R.H. Emerging cellular and molecular strategies for enhancing central nervous system (CNS) remyelination. Brain Sci. 2018, 8, E111. [Google Scholar] [CrossRef] [Green Version]
- Nakayama, T.; Al-Maawali, A.; El-Quessny, M.; Rajab, A.; Khalil, S.; Stoler, J.M.; Tan, W.H.; Nasir, R.; Schmitz-Abe, K.; Hill, R.S.; et al. Mutations in PYCR2, encoding pyrroline-5-carboxylate reductase 2, cause microcephaly and hypomyelination. Am. J. Hum. Genet. 2015, 96, 709–719. [Google Scholar] [CrossRef] [Green Version]
- Zaki, M.S.; Bhat, G.; Sultan, T.; Issa, M.; Jung, H.J.; Dikoglu, E.; Selim, L.; GMahmoud, I.; Abdel-Hamid, M.S.; Abdel-Salam, G.; et al. PYCR2 mutations cause a lethal syndrome of microcephaly and failure to thrive. Ann. Neurol. 2016, 80, 59–70. [Google Scholar] [CrossRef]
- Meng, L.; Donti, T.; Xia, F.; Niu, Z.; Al Shamsi, A.; Hertecant, J.; Al-Jasmi, F.; Gibson, J.B.; Nagakura, H.; Zhang, J.; et al. Homozygous variants in pyrroline-5-carboxylate reductase 2 (PYCR2) in patients with progressive microcephaly and hypomyelinating leukodystrophy. Am. J. Med. Genet. A 2017, 173, 460–470. [Google Scholar] [CrossRef] [PubMed]
- Spagnoli, C.; Pavlidis, E.; Salerno, G.G.; Koskinen, L.; Kääriäinen, H.; Frattini, D.; Koskenvuo, J.W.; Fusco, C. Prolonged survival in a patient with a novel pyrroline-5-carboxylase reductase 2 genetic variant. Eur. J. Neurol. 2019, 26, e45–e46. [Google Scholar] [CrossRef] [PubMed]
- Xie, J.J.; Ni, W.; Wei, Q.; Wu, Z.Y. Spastic paraplegia as the only symptom in two adult-onset patients carrying a novel pathogenic variant in PYCR2. Eur. J. Neurol. 2021, 28, e17–e19. [Google Scholar] [CrossRef] [PubMed]
- Manaspon, C.; Boonsimma, P.; Phokaew, C.; Theerapanon, T.; Sriwattanapong, K.; Porntaveetus, T.; Shotelersuk, V. Expanding the genotypic spectrum of PYCR2 and a common ancestry in Thai patients with hypomyelinating leukodystrophy 10. Am. J. Med. Genet. A 2021, 185, 3068–3073. [Google Scholar] [CrossRef] [PubMed]
- Patel, S.M.; Seravalli, J.; Liang, X.; Tanner, J.J.; Becker, D.F. Disease variants of human d1-pyrroline-5-carboxylate reductase 2 (PYCR2). Arch. Biochem. Biophys. 2021, 703, 108852. [Google Scholar] [CrossRef] [PubMed]
- Srivastava, P.; Mishra, A.K.; Sarkar, N. PYCR2 mutation causing hypomyelination and microcephaly in an Indian child. Cureus 2021, 13, e14661. [Google Scholar] [CrossRef]
- Miyamoto, Y.; Yamauchi, J.; Chan, J.R.; Okada, A.; Tomooka, Y.; Hisanaga, S.; Tanoue, A. Cdk5 regulates differentiation of oligodendrocyte precursor cells through the direct phosphorylation of paxillin. J. Cell Sci. 2007, 120, 4355–4366. [Google Scholar] [CrossRef] [Green Version]
- Nishino, S.; Fujiki, Y.; Sato, T.; Kato, Y.; Shirai, R.; Oizumi, H.; Yamamoto, M.; Ohbuchi, K.; Miyamoto, Y.; Mizoguchi, K.; et al. Hesperetin, a citrus flavonoid, ameliorates inflammatory cytokine-mediated inhibition of oligodendroglial cell morphological differentiation. Neurol. Int. 2022, 14, 471–487. [Google Scholar] [CrossRef]
- Kato, Y.; Tago, K.; Fukatsu, S.; Okabe, M.; Shirai, R.; Oizumi, H.; Ohbuchi, K.; Yamamoto, M.; Mizoguchi, K.; Miyamoto, Y.; et al. CRISPR/CasRx-mediated RNA knockdown reveals that ACE2 is involved in the regulation of oligodendroglial cell morphological differentiation. Noncoding RNA 2022, 8, 42. [Google Scholar] [CrossRef]
- Sato, T.; Shirai, R.; Isogai, M.; Yamamoto, M.; Miyamoto, Y.; Yamauchi, J. Hyaluronic acid and its receptor CD44, acting through TMEM2, inhibit morphological differentiation in oligodendroglial cells. Biochem. Biophys. Res. Commun. 2022, 624, 102–111. [Google Scholar] [CrossRef]
- Yamauchi, J.; Chan, J.R.; Miyamoto, Y.; Tsujimoto, G.; Shooter, E.M. The neurotrophin-3 receptor TrkC directly phosphorylates and activates the nucleotide exchange factor Dbs to enhance Schwann cell migration. Proc. Natl. Acad. Sci. USA 2005, 102, 5198–5203. [Google Scholar] [CrossRef] [PubMed] [Green Version]
- Yamauchi, J.; Miyamoto, Y.; Tanoue, A.; Shooter, E.M.; Chan, J.R. Ras activation of a Rac1 exchange factor, Tiam1, mediates neurotrophin-3-induced Schwann cell migration. Proc. Natl. Acad. Sci. USA 2005, 102, 14889–14894. [Google Scholar] [CrossRef] [PubMed] [Green Version]
- Chan, D.C. Mitochondrial dynamics and its involvement in disease. Annu. Rev. Pathol. 2020, 15, 235–259. [Google Scholar] [CrossRef] [PubMed] [Green Version]
- Gao, S.; Hu, J. Mitochondrial fusion: The machineries in and out. Trends Cell Biol. 2021, 31, 62–74. [Google Scholar] [CrossRef] [PubMed]
- Kraus, F.; Roy, K.; Pucadyil, T.J.; Ryan, M.T. Function and regulation of the divisome for mitochondrial fission. Nature 2021, 590, 57–66. [Google Scholar] [CrossRef] [PubMed]
- Roma, A.; Ovadje, P.; Steckle, M.; Nicoletti, L.; Saleem, A.; Pandey, S. Selective induction of apoptosis by azadarichta indica leaf extract by targeting oxidative vulnerabilities in human cancer cells. J. Pharm. Pharm. Sci. 2015, 18, 729–746. [Google Scholar] [CrossRef] [Green Version]
- Stum, M.G.; Tadenev, A.L.D.; Seburn, K.L.; Miers, K.E.; Poon, P.P.; McMaster, C.R.; Robinson, C.; Kane, C.; Silva, K.A.; Cliften, P.F.; et al. Genetic analysis of Pycr1 and Pycr2 in mice. Genetics 2021, 218, iyab048. [Google Scholar] [CrossRef]
- Rakotomamonjy, J.; Rylaarsdam, L.; Guemez-Gamboa, A. PYRC2-related hypomyelinating leukodystrophy: More to this than meets the eye. Neuron 2020, 107, 3–5. [Google Scholar] [CrossRef]
- Escande-Beillard, N.; Loh, A.; Saleem, S.N.; Kanata, K.; Hashimoto, Y.; Altunoglu, U.; Metoska, A.; Grandjean, J.; Ng, F.M.; Pomp, O.; et al. Loss of PYCR2 causes neurodegeneration by increasing cerebral glycine levels via SHMT2. Neuron 2020, 107, 82–94. [Google Scholar] [CrossRef]
- Yin, F.; Huang, X.; Xuan, Y. Pyrroline-5-carboxylate reductase-2 promotes colorectal cancer progression via activating PI3K/AKT/mTOR pathway. Dis. Markers 2021, 2021, 9950663. [Google Scholar] [CrossRef]
- Rodriguez, A.; Von Salzen, D.; Holguin, B.A.; Bernal, R.A. Complex destabilization in the mitochondrial chaperonin Hsp60 leads to disease. Front. Mol. Biosci. 2020, 7, 159. [Google Scholar] [CrossRef] [PubMed]
- Miyamoto, Y.; Eguchi, T.; Kawahara, K.; Hasegawa, N.; Nakamura, K.; Funakoshi-Tago, M.; Tanoue, A.; Tamura, H.; Yamauchi, J. Hypomyelinating leukodystrophy-associated missense mutation in HSPD1 blunts mitochondrial dynamics. Biochem. Biophys. Res. Commun. 2015, 462, 275–2781. [Google Scholar] [CrossRef] [PubMed]
- Rankin, J.; Brown, R.; Dobyns, W.B.; Harington, J.; Patel, J.; Quinn, M.; Brown, G. Pontocerebellar hypoplasia type 6: A British case with PEHO-like features. Am. J. Med. Genet. A 2010, 152A, 2079–2084. [Google Scholar] [CrossRef] [PubMed]
- Nevanlinna, V.; Konovalova, S.; Ceulemans, B.; Muona, M.; Laari, A.; Hilander, T.; Gorski, K.; Valanne, L.; Anttonen, A.K.; Tyynismaa, H.; et al. A patient with pontocerebellar hypoplasia type 6: Novel RARS2 mutations, comparison to previously published patients and clinical distinction from PEHO syndrome. Eur. J. Med. Genet. 2020, 63, 103766. [Google Scholar] [CrossRef]
- Ciara, E.; Rokicki, D.; Lazniewski, M.; Mierzewska, H.; Jurkiewicz, E.; Bekiesińska-Figatowska, M.; Piekutowska-Abramczuk, D.; Iwanicka-Pronicka, K.; Szymańska, E.; Stawiński, P.; et al. Clinical and molecular characteristics of newly reported mitochondrial disease entity caused by biallelic PARS2 mutations. J. Hum. Genet. 2018, 63, 473–485. [Google Scholar] [CrossRef]
- Yin, X.; Tang, B.; Mao, X.; Peng, J.; Zeng, S.; Wang, Y.; Jiang, H.; Li, N. The genotypic and phenotypic spectrum of PARS2-related infantile-onset encephalopathy. J. Hum. Genet. 2018, 63, 971–980. [Google Scholar] [CrossRef]


Publisher’s Note: MDPI stays neutral with regard to jurisdictional claims in published maps and institutional affiliations. |
© 2022 by the authors. Licensee MDPI, Basel, Switzerland. This article is an open access article distributed under the terms and conditions of the Creative Commons Attribution (CC BY) license (https://creativecommons.org/licenses/by/4.0/).
Share and Cite
Torii, T.; Shirai, R.; Kiminami, R.; Nishino, S.; Sato, T.; Sawaguchi, S.; Fukushima, N.; Seki, Y.; Miyamoto, Y.; Yamauchi, J. Hypomyelinating Leukodystrophy 10 (HLD10)-Associated Mutations of PYCR2 Form Large Size Mitochondria, Inhibiting Oligodendroglial Cell Morphological Differentiation. Neurol. Int. 2022, 14, 1062-1080. https://doi.org/10.3390/neurolint14040085
Torii T, Shirai R, Kiminami R, Nishino S, Sato T, Sawaguchi S, Fukushima N, Seki Y, Miyamoto Y, Yamauchi J. Hypomyelinating Leukodystrophy 10 (HLD10)-Associated Mutations of PYCR2 Form Large Size Mitochondria, Inhibiting Oligodendroglial Cell Morphological Differentiation. Neurology International. 2022; 14(4):1062-1080. https://doi.org/10.3390/neurolint14040085
Chicago/Turabian StyleTorii, Tomohiro, Remina Shirai, Risa Kiminami, Satoshi Nishino, Takanari Sato, Sui Sawaguchi, Nana Fukushima, Yoichi Seki, Yuki Miyamoto, and Junji Yamauchi. 2022. "Hypomyelinating Leukodystrophy 10 (HLD10)-Associated Mutations of PYCR2 Form Large Size Mitochondria, Inhibiting Oligodendroglial Cell Morphological Differentiation" Neurology International 14, no. 4: 1062-1080. https://doi.org/10.3390/neurolint14040085