
Distortions in Spatial Mental Representation Affect Sketch Maps in Young Adults

Abstract
:1. Introduction
1.1. Representation of Spatial Information in Humans
1.2. Distortions in Cognitive Maps
1.3. The Present Study
2. Materials and Methods
2.1. Experiment 1
2.1.1. Participants
2.1.2. Materials and Procedure
2.1.3. Statistical Analysis
2.2. Experiment 2
2.2.1. Participants
2.2.2. Materials and Procedure
2.2.3. Statistical Analysis
3. Results
3.1. Experiment 1
3.2. Experiment 2
4. Discussion
5. Conclusions
Author Contributions
Funding
Institutional Review Board Statement
Informed Consent Statement
Data Availability Statement
Acknowledgments
Conflicts of Interest
References
- Palmer, S.E. Common region: A new principle of perceptual grouping. Cogn. Psychol. 1992, 24, 436–447. [Google Scholar] [CrossRef]
- Chang, D.; Nesbitt, K.V. Developing Gestalt-Based Design Guidelines for Multi-Sensory Displays. In Proceedings of the ACM International Conference Proceeding Series, Sydney, Australia, 13 September 2006; Volume 163, pp. 9–16. [Google Scholar]
- McDonald, T.P.; Pellegrino, J.W. Psychological Perspectives on Spatial Cognition Thomas. In Advances in Psychology; North-Holland: Amsterdam, The Netherlands, 1993; Volume 9, pp. 47–82. [Google Scholar]
- Tversky, B. Distortions in cognitive maps. Geoforum 1992, 23, 131–138. [Google Scholar] [CrossRef]
- Tversky, B. Cognitive Maps, Cognitive Collages, and spatial mental models. In Proceedings of the European Conference on Spatial Information Theory, Elba, Italy, 19–22 September 1993; Springer: Berlin/Heidelberg, Germany, 1993; pp. 14–24. [Google Scholar]
- Tversky, B. Distortions in memory for maps. Cogn. Psychol. 1981, 13, 407–433. [Google Scholar] [CrossRef]
- Lopez, A.; Caffò, A.O.; Bosco, A. The impact of age and familiarity with the environment on categorical and coordinate spatial relation representations. Scand. J. Psychol. 2021, 62, 125–133. [Google Scholar] [CrossRef]
- Stevens, A.; Coupe, P. Distortions in judged spatial relations. Cogn. Psychol. 1978, 10, 422–437. [Google Scholar] [CrossRef]
- Lopez, A.; Germani, A.; Tinella, L.; Caffò, A.O.; Postma, A.; Bosco, A. The road more travelled: The differential effects of spatial experience in young and elderly participants. Int. J. Environ. Res. 2021, 18, 709. [Google Scholar] [CrossRef]
- Maki, R.H. Categorization and distance effects with spatial linear orders. J. Exp. Psychol. Learn. Mem. Cogn. 1981, 7, 15–32. [Google Scholar] [CrossRef]
- McNamara, T.P.; Hardy, J.K.; Hirtle, S.C. Subjective hierarchies in spatial memory. J. Exp. Psychol. Learn. Mem. Cogn. 1989, 15, 211. [Google Scholar] [CrossRef]
- Holyoak, K.J.; Mah, W.A. Cognitive reference points in judgments of symbolic magnitude. Cogn. Psychol. 1982, 14, 328–352. [Google Scholar] [CrossRef]
- Lloyd, R.; Heivly, C. Systematic distortions in urban cognitive maps. Ann. Assoc. Am. Geogr. 1987, 77, 191–207. [Google Scholar] [CrossRef]
- Kosslyn, S.M.; Pick, H.L., Jr.; Fariello, G.R. Cognitive maps in children and men. Child. Dev. 1974, 45, 707–716. [Google Scholar] [CrossRef]
- Newcombe, N.; Liben, L.S. Barrier effects in the cognitive maps of children and adults. J. Exp. Child. Psychol. 1982, 34, 46–58. [Google Scholar] [CrossRef]
- Hirtle, S.C.; Jonides, J. Evidence of hierarchies in cognitive maps. Mem. Cogn. 1985, 13, 208–217. [Google Scholar] [CrossRef] [PubMed]
- Canter, D.; Tagg, S.K. Distance estimation in cities. Environ. Behav. 1975, 7, 59–80. [Google Scholar] [CrossRef]
- Carbon, C.C.; Leder, H. The Wall inside the brain: Overestimation of distances crossing the former Iron Curtain. Psychon. Bull. Rev. 2005, 12, 746–750. [Google Scholar] [CrossRef]
- Briggs, R. Urban cognitive distance. In Image and Environment: Cognitive Mapping and Spatial Behavior; Taylor & Francis: Oxfordshire, UK, 1973; pp. 361–388. [Google Scholar]
- Allen, G.L. A developmental perspective on the effects of “subdividing” macrospatial experience. J. Exp. Psychol. Hum. Learn. 1981, 7, 120. [Google Scholar] [CrossRef]
- Byrne, R.W. Memory for urban geography. Q. J. Exp. Psychol. 1979, 31, 147–154. [Google Scholar] [CrossRef]
- Sadalla, E.K.; Staplin, L.J. The perception of traversed distance, interactions. Environ. Behav. 1989, 12, 167–182. [Google Scholar] [CrossRef]
- Allen, G.L.; Kirasic, K.C. Effects of the cognitive organization of route knowledge on judgments of macrospatial distance. Mem. Cogn. 1985, 13, 218–227. [Google Scholar] [CrossRef] [PubMed]
- Thorndyke, P.W. Distance estimation from cognitive maps. Cogn. Psychol. 1981, 13, 526–550. [Google Scholar] [CrossRef]
- Muller, J.C. Mental maps at a global scale. Cartogr. J. 1985, 22, 51–59. [Google Scholar] [CrossRef]
- Novick, L.R.; Tversky, B. Cognitive constraints on ordering operations: The case of geometric analogies. J. Exp. Psychol. Gen. 1987, 116, 50. [Google Scholar] [CrossRef] [PubMed]
- Howard, J.H., Jr.; Kerst, S.M. Memory and perception of cartographic information for familiar and unfamiliar environments. Hum. Factors 1981, 23, 495–503. [Google Scholar] [CrossRef]
- Lloyd, R. Cognitive maps: Encoding and decoding information. Ann. Assoc. Am. Geogr. 1989, 79, 101–124. [Google Scholar] [CrossRef]
- Moar, I.; Bower, G.H. Inconsistency in spatial knowledge. Mem. Cogn. 1983, 11, 107–113. [Google Scholar] [CrossRef] [PubMed]
- Friedman, A.; Brown, N.R. Reasoning about geography. J. Exp. Psychol. Gen. 2000, 129, 193. [Google Scholar] [CrossRef]
- Huttenlocher, J.; Hedges, L.V.; Vevea, J.L. Why do categories affect stimulus judgment? J. Exp. Psychol. Gen. 2000, 129, 220. [Google Scholar] [CrossRef]
- Brown, C.; Brandimonte, M.A.; Wickham, L.H.; Bosco, A.; Schooler, J.W. When do words hurt? A multiprocess view of the effects of verbalization on visual memory. J. Exp. Psychol. Learn. Mem. Cogn. 2014, 40, 1244. [Google Scholar] [CrossRef]
- Fiore, S.M.; Schooler, J.W. How did you get here from there? Verbal overshadowing of spatial mental models. Appl. Cogn. Psychol. 2002, 16, 897–910. [Google Scholar] [CrossRef]
- Schooler, J.W.; Engstler-Schooler, T.Y. Verbal overshadowing of visual memories: Some things are better left unsaid. Cogn. Psychol. 1990, 22, 36–71. [Google Scholar] [CrossRef]
- Brandimonte, M.A.; Hitch, G.J.; Bishop, D.V. Verbal recoding of visual stimuli impairs mental image transformations. Mem. Cogn. 1992, 20, 449–455. [Google Scholar] [CrossRef] [PubMed]
- Brandimonte, M.A.; Schooler, J.W.; Gabbino, P. Attenuating verbal overshadowing through color retrieval cues. J. Exp. Psychol. Learn. Mem. Cogn. 1997, 23, 915. [Google Scholar] [CrossRef] [PubMed]
- Meilinger, T.; Bülthoff, H.H. Verbal shadowing and visual interference in spatial memory. PLoS ONE 2013, 8, e74177. [Google Scholar] [CrossRef] [PubMed]
- Hart, R.A.; Moore, G.T. The Development of Spatial Cognition: A Review; AldineTransaction: Piscataway, NJ, USA, 1973. [Google Scholar]
- Wang, J.; Schwering, A. Invariant spatial information in sketch maps—A study of survey sketch maps of urban areas. J. Spat. Inf. Sci. 2015, 2015, 31–52. [Google Scholar] [CrossRef]
- Blades, M. The reliability of data collected from sketch maps. J. Environ. Psychol. 1990, 10, 327–339. [Google Scholar] [CrossRef]
- Lopez, A.; Caffò, A.O.; Postma, A.; Bosco, A. How to separate coordinate and categorical spatial relation components in integrated spatial representations: A new methodology for analysing sketch maps. Scand. J. Psychol. 2020, 61, 607–615. [Google Scholar] [CrossRef]
- Lopez, A.; Caffò, A.O.; Tinella, L.; Postma, A.; Bosco, A. Studying individual differences in spatial cognition through differential item functioning analysis. Brain Sci. 2020, 10, 774. [Google Scholar] [CrossRef]
- Fenollar, P.; Román, S.; Cuestas, P.J. University students’ academic performance: An integrative conceptual framework and empirical analysis. Br. J. Educ. Psychol. 2007, 77, 873–891. [Google Scholar] [CrossRef]
- Mangels, J.A.; Butterfield, B.; Lamb, J.; Good, C.; Dweck, C.S. Why do beliefs about intelligence influence learning success? A social cognitive neuroscience model. Soc. Cogn. Affect. Neurosci. 2006, 1, 75–86. [Google Scholar] [CrossRef]
- Richardson, K.; Norgate, S.H. Does IQ really predict job performance? Appl. Dev. Sci. 2015, 19, 153–169. [Google Scholar] [CrossRef]
- Bosco, A.; Caffò, A.O.; Spano, G.; Lopez, A. Beyond the cutoffs: A Bayesian approach to the use of the Montreal cognitive assessment as a screening tool for mild cognitive impairment and dementia. In Diagnosis and Management in Dementia; Academic Press: Cambridge, MA, USA, 2020; pp. 395–410. [Google Scholar]
- De Goede, M.; Postma, A. Learning your way in a city: Experience and gender differences in configurational knowledge of one’s environment. Front. Psychol. 2015, 6, 402. [Google Scholar] [CrossRef] [PubMed]
- Rice, M.E.; Harris, G.T. Comparing effect sizes in follow-up studies: ROC Area, Cohen’s d, and r. Law Hum. Behav. 2005, 29, 615–620. [Google Scholar] [CrossRef] [PubMed]
- Ekman, G.; Bratfisch, O. Subjective distance and emotional involvement. A psychological mechanism. Acta Psychol. 1965, 24, 430–437. [Google Scholar] [CrossRef]
- Kuipers, B. The “map in the head2010064 metaphor. Environ. Behav. 1982, 14, 202–220. [Google Scholar] [CrossRef]
- Machielsen, W.C.; Rombouts, S.A.; Barkhof, F.; Scheltens, P.; Witter, M.P. FMRI of visual encoding: Reproducibility of activation. Hum. Brain Mapp. 2000, 9, 156–164. [Google Scholar] [CrossRef]
- Snyder, J.P.; Maling, D.H. Flattening the Earth; NATURE: London, UK, 1993; Volume 366, p. 522. [Google Scholar]
- Wen, W.; Kawabata, H. Impact of Navon-Induced Global and Local Processing Biases on the Acquisition of Spatial Knowledge. SAGE Open 2018, 8, 2158244018769131. [Google Scholar] [CrossRef] [Green Version]
- Khosla, G.; Rajpal, N.; Singh, J. Evaluation of Euclidean and Manhanttan metrics in content based image retrieval system. In Proceedings of the 2015 2nd International Conference on Computing for Sustainable Global Development, INDIACom, New Delhi, India, 11–13 March 2015; pp. 12–18. [Google Scholar]


| Variables | Experiment 1 (n = 260) |
|---|---|
| Gender, F/M | 131/129 |
| Age, years | 23.38 ± 2.72 |
| Education, years | 15.17 ± 0.94 |
| Academic performance | 5.75 ± 0.8 |
| Familiarity with Northern Europe | |
| Study of Geography at school | 4.66 ± 2.08 |
| Google Maps | 6.11 ± 0.83 |
| Paper Maps | 2.84 ± 1.70 |
| Weather Forecast | 5.29 ± 1.60 |
| Northern Europe | n | Distance Errors | Positional Errors | ||||
| Friedman χ2 | df | p | Friedman χ2 | df | p | ||
| 260 | 54,127 | 2 | <0.001 | 513.39 | 2 | <0.001 | |
| Northern Europe | Sum of Ranks | Distance Errors | Sum of Ranks | Positional Errors | ||||
|---|---|---|---|---|---|---|---|---|
| z | p | r | z | p | r | |||
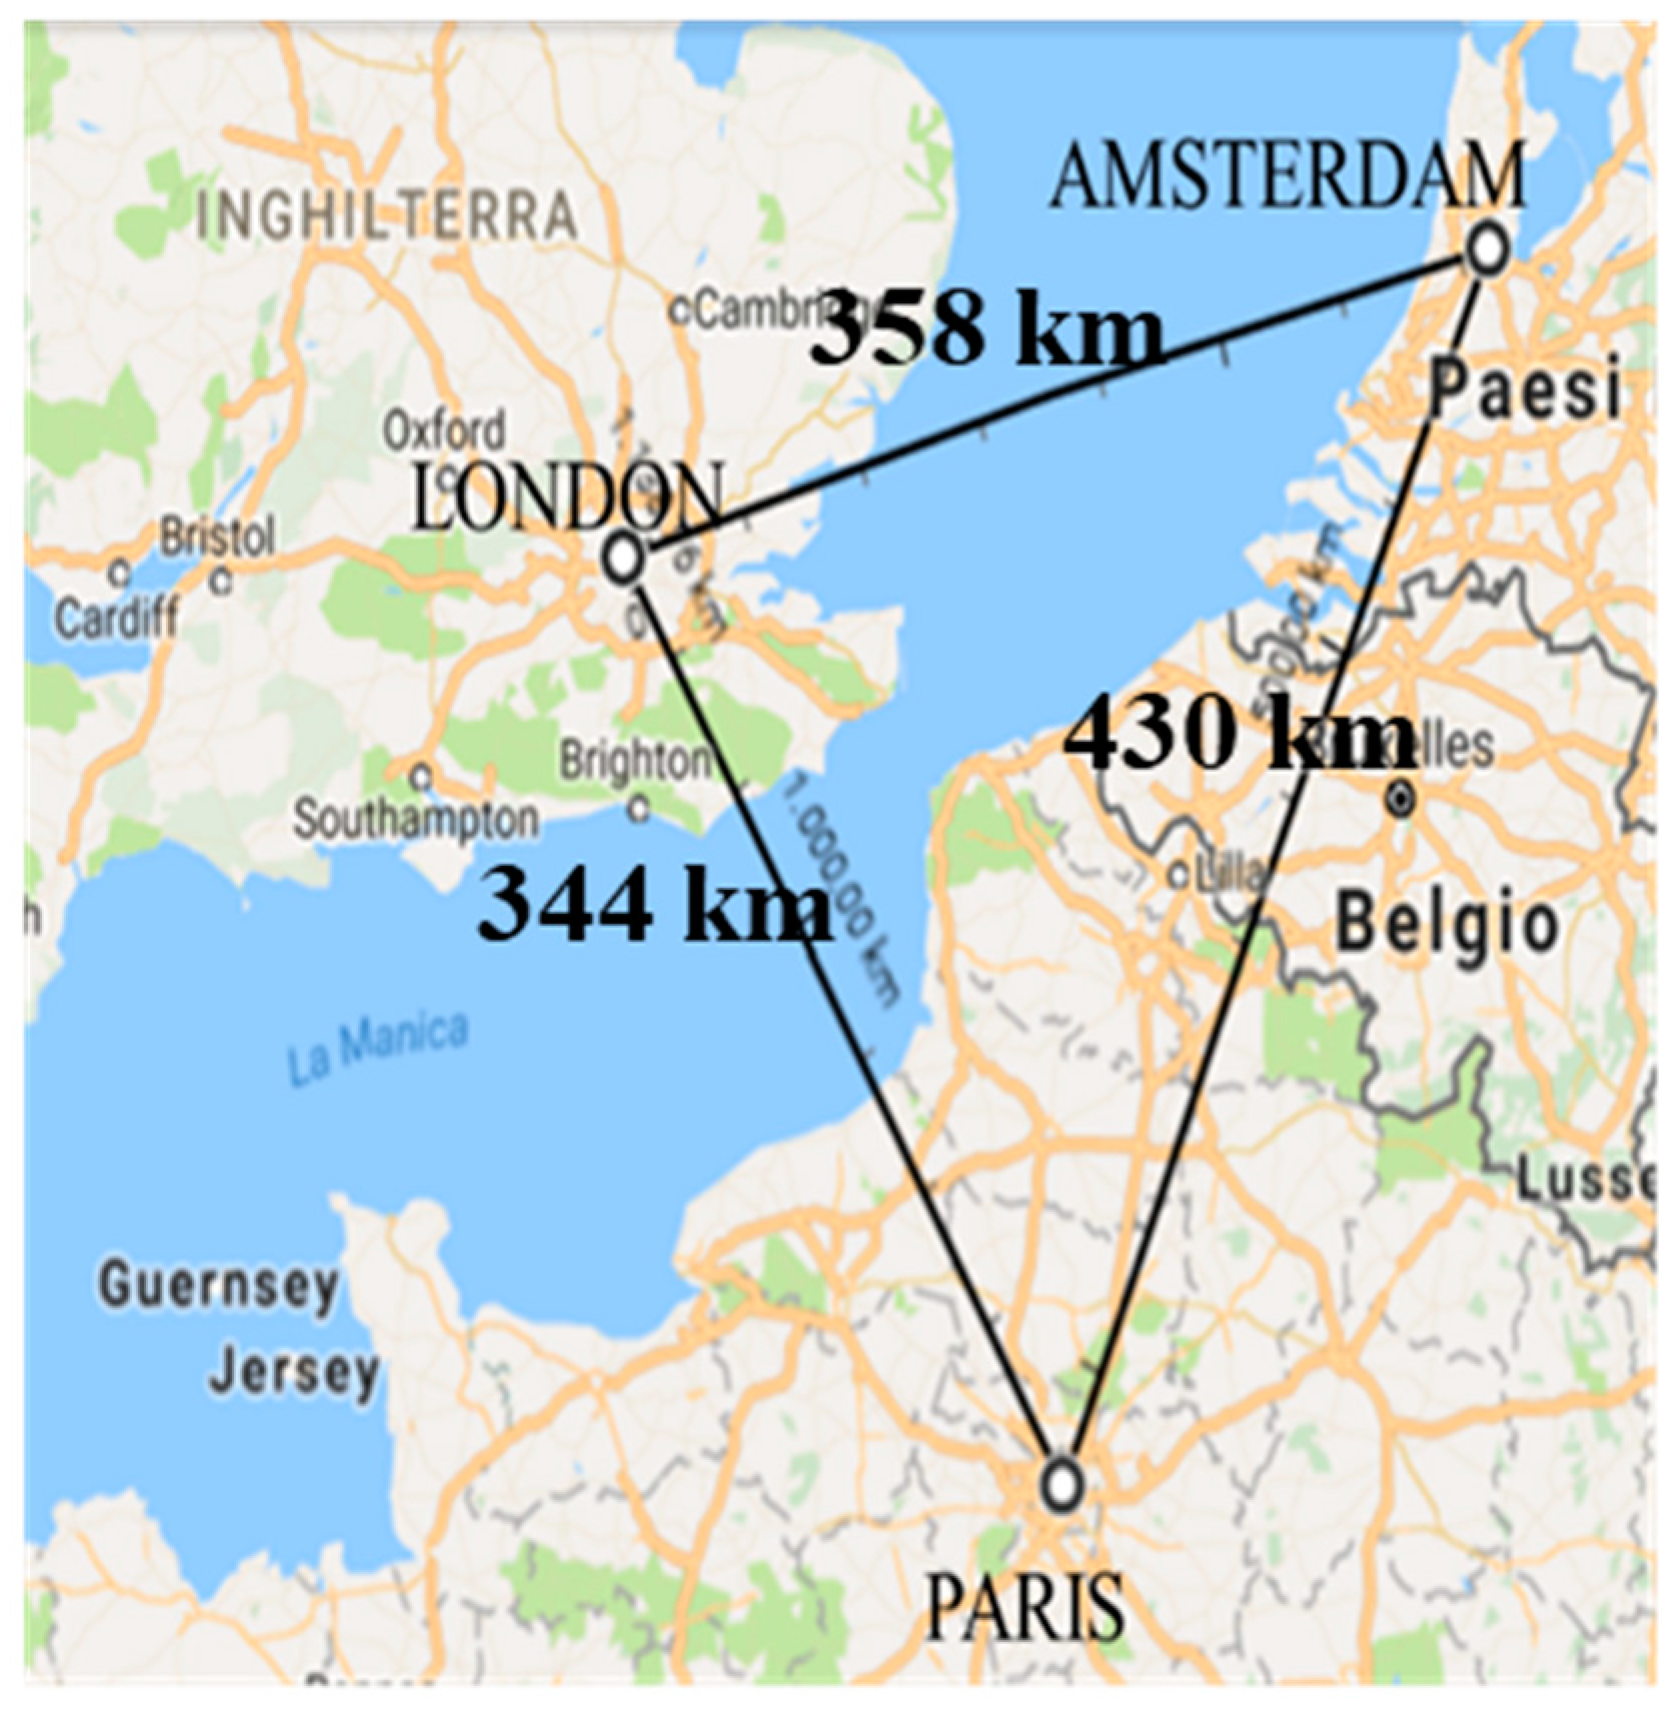
| London–Paris/London–Amsterdam | 568 | 0.092 | 0.93 | - | 522 | 1.73 | 0.25 | - |
| London–Paris/Paris–Amsterdam | 568 | 6.98 | <0.001 | 0.31 | 520 | −16 | <0.001 | 0.70 |
| London–Amsterdam/Paris–Amsterdam | 424 | 6.39 | <0.001 | 0.30 | 778 | −16.1 | <0.001 | 0.70 |
| Variables | Experiment 2 (n = 200) |
|---|---|
| Gender, F/M | 102/98 |
| Age, years | 22.87 ± 2.77 |
| Education, years | 15.64 ± 1.31 |
| Academic performance | 5.99 ± 0.53 |
| Familiarity with Campus | |
| Study of Geography at school | 4.58 ± 1.79 |
| Google Maps | 5.68 ± 1.67 |
| Paper Maps | 3.55 ± 1.87 |
| Weather Forecast | 5.09 ± 1.86 |
| Campus | n | Distance Errors | Positional Errors | ||||
| Friedman χ2 | df | p | Friedman χ2 | df | p | ||
| 200 | 9.07 | 2 | 0.001 | 186.4 | 2 | <0.001 | |
| Campus | Sum of Ranks | Distance Errors | Sum of Ranks | Positional Errors | ||||
|---|---|---|---|---|---|---|---|---|
| z | p | r | z | p | r | |||
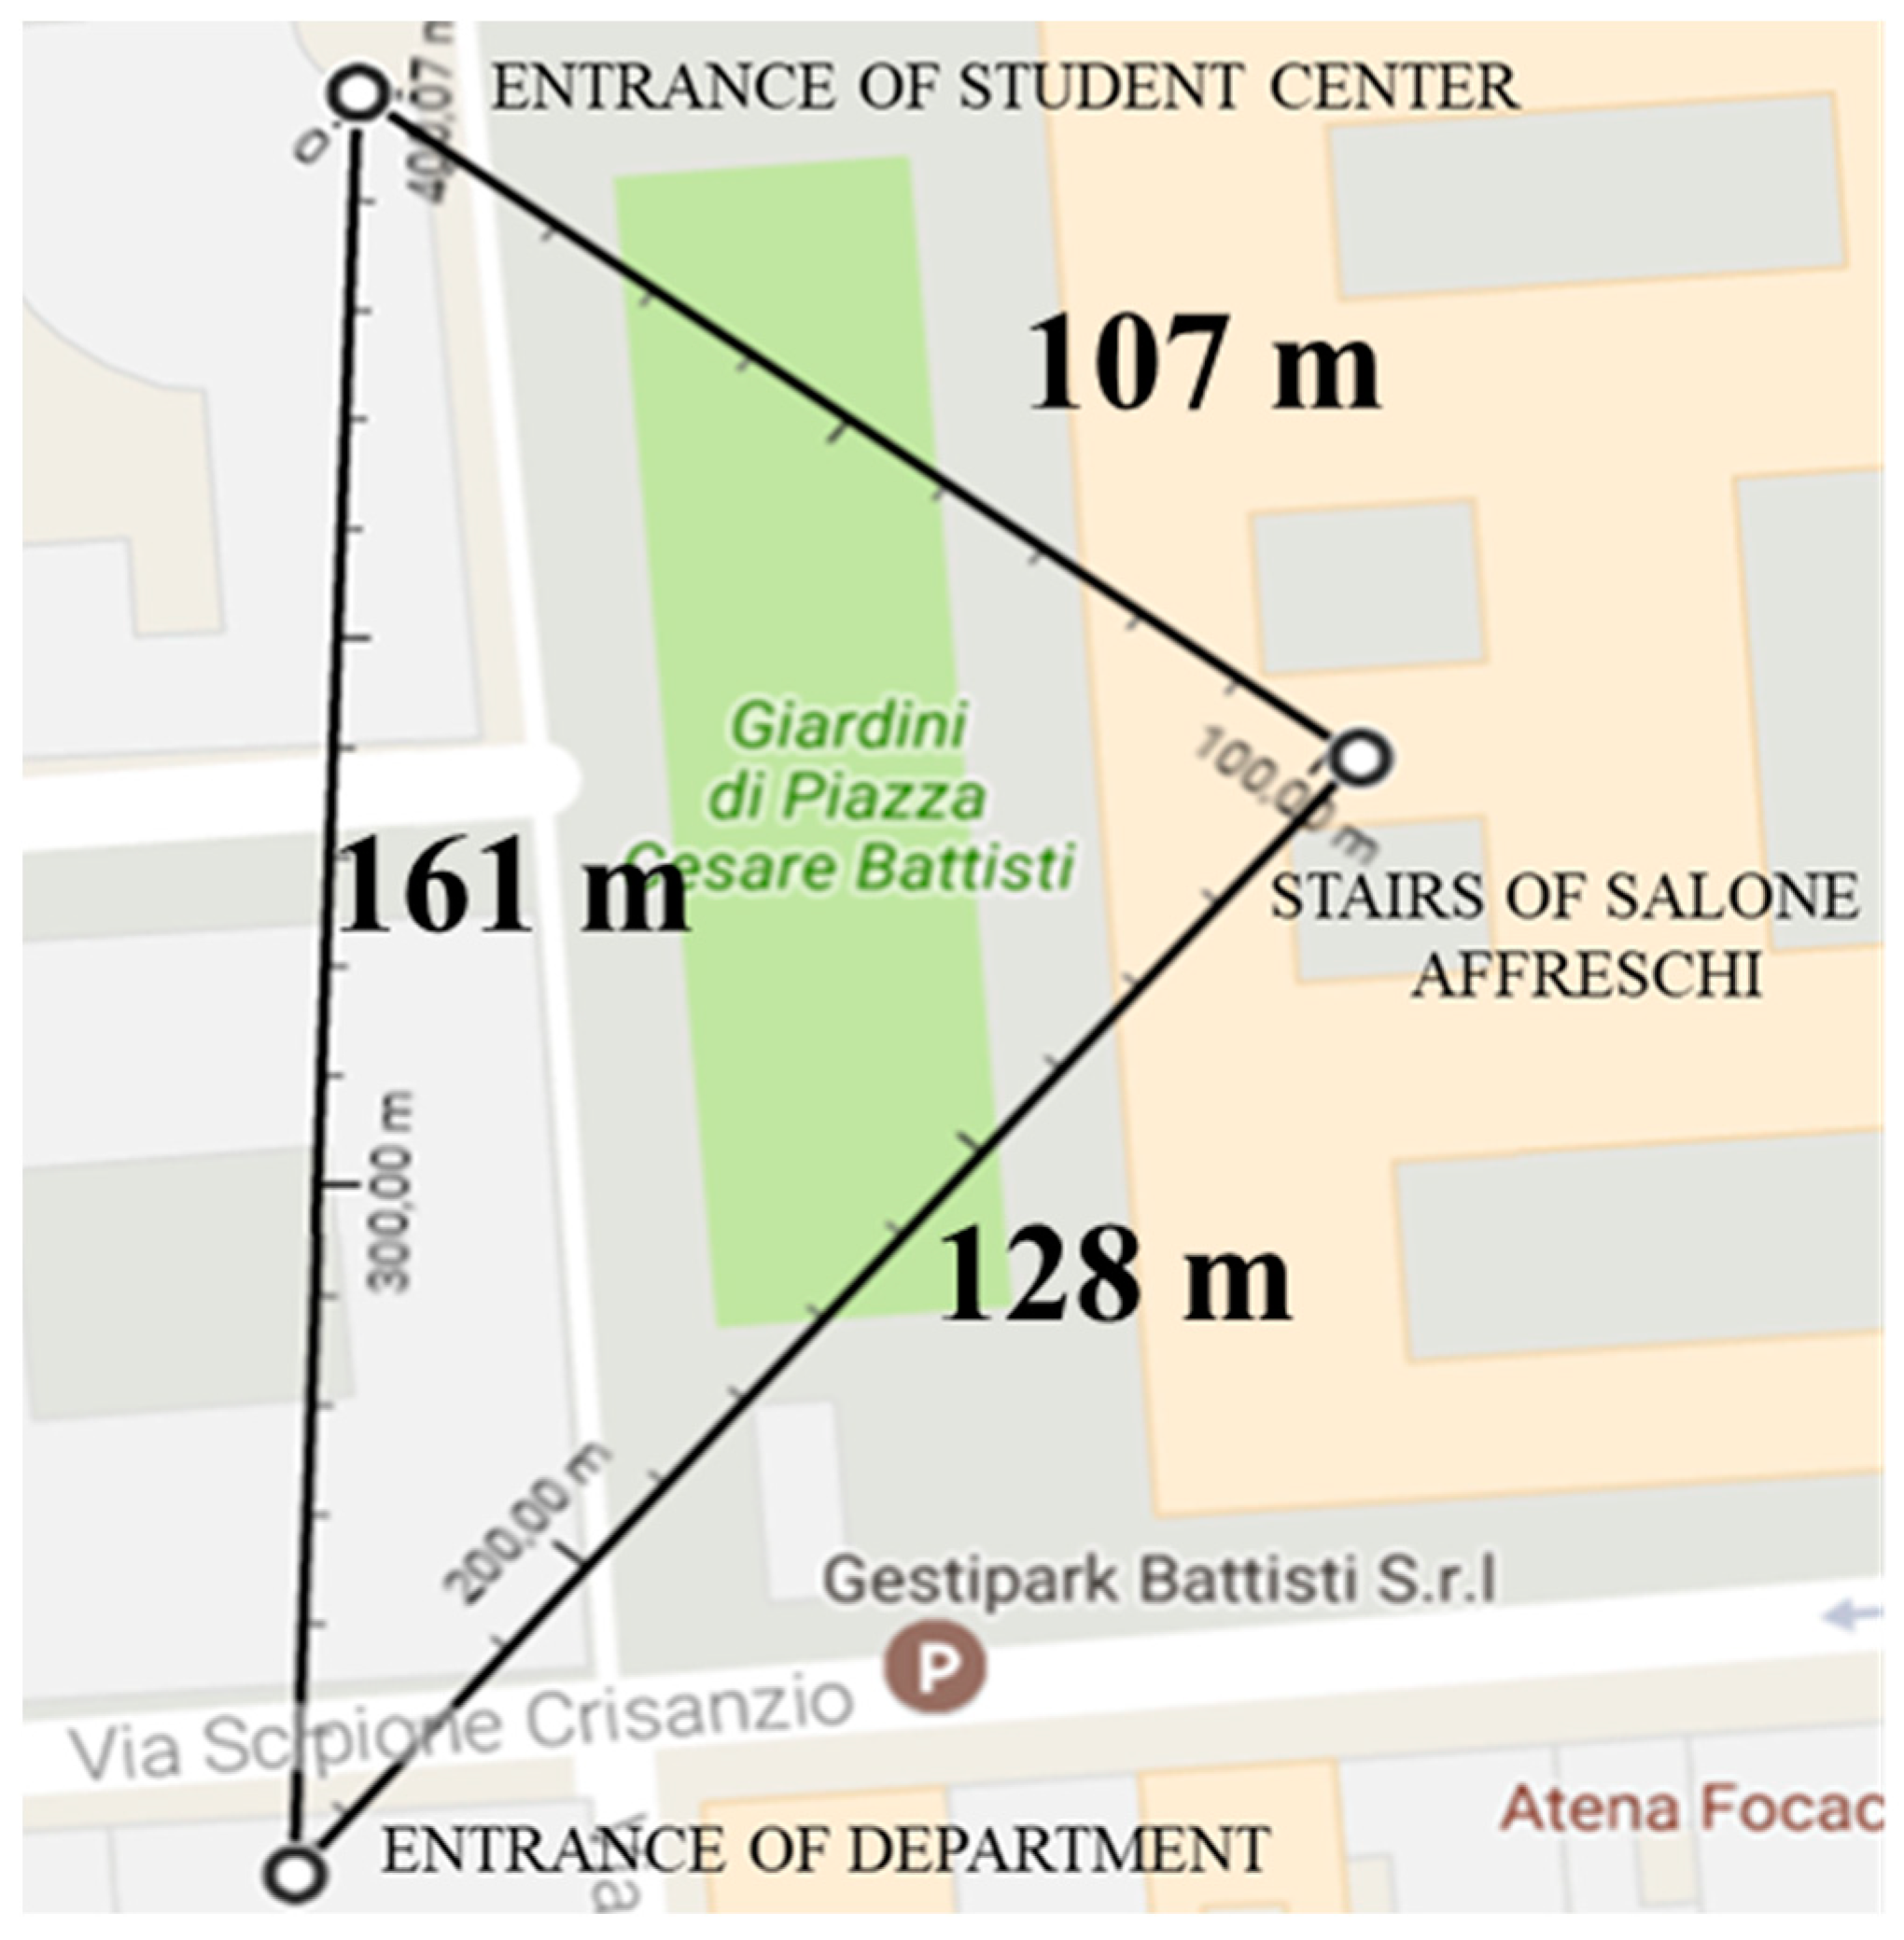
| Stairs–Student Centre/Stairs–Department | 396 | −2.06 | 0.05 | 0.10 | 468 | −9.33 | <0.001 | 0.45 |
| Stairs–Student Centre/Department–Student Centre | 431 | 1.61 | 0.11 | - | 572 | −10.51 | <0.001 | 0.52 |
| Stairs–Department/Department–Student Centre | 373 | 2.41 | 0.04 | 0.12 | 591 | −3.54 | <0.001 | 0.15 |
Publisher’s Note: MDPI stays neutral with regard to jurisdictional claims in published maps and institutional affiliations. |
© 2022 by the authors. Licensee MDPI, Basel, Switzerland. This article is an open access article distributed under the terms and conditions of the Creative Commons Attribution (CC BY) license (https://creativecommons.org/licenses/by/4.0/).
Share and Cite
Lopez, A.; Bosco, A. Distortions in Spatial Mental Representation Affect Sketch Maps in Young Adults. Neurol. Int. 2022, 14, 771-783. https://doi.org/10.3390/neurolint14040064
Lopez A, Bosco A. Distortions in Spatial Mental Representation Affect Sketch Maps in Young Adults. Neurology International. 2022; 14(4):771-783. https://doi.org/10.3390/neurolint14040064
Chicago/Turabian StyleLopez, Antonella, and Andrea Bosco. 2022. "Distortions in Spatial Mental Representation Affect Sketch Maps in Young Adults" Neurology International 14, no. 4: 771-783. https://doi.org/10.3390/neurolint14040064