
Electric Trolley Prototype for Goods and People Transport on Ziplines

 ,
,
Abstract
:1. Introduction
2. Materials and Methods
2.1. Zipline Transports Current Solutions
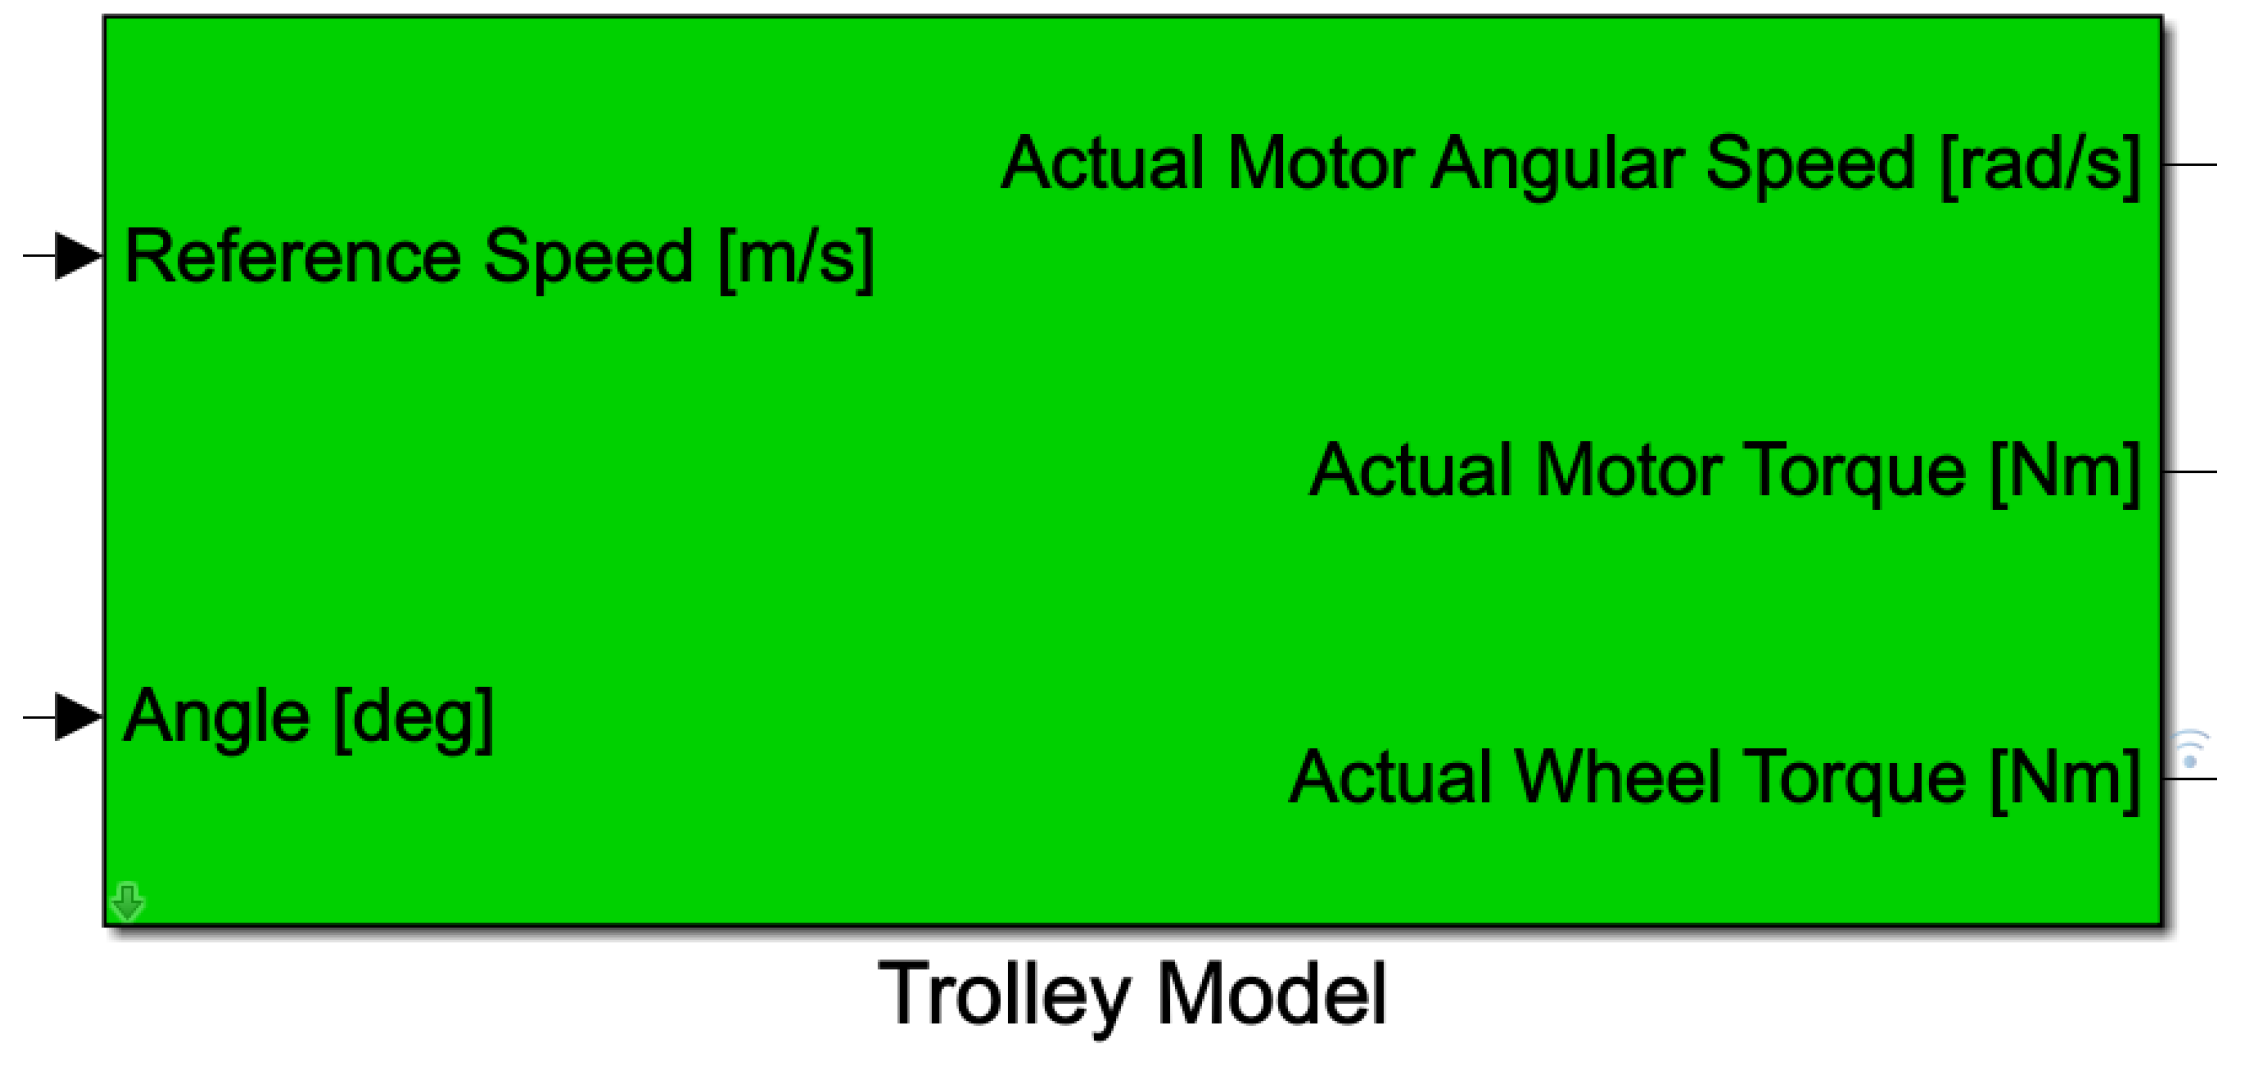
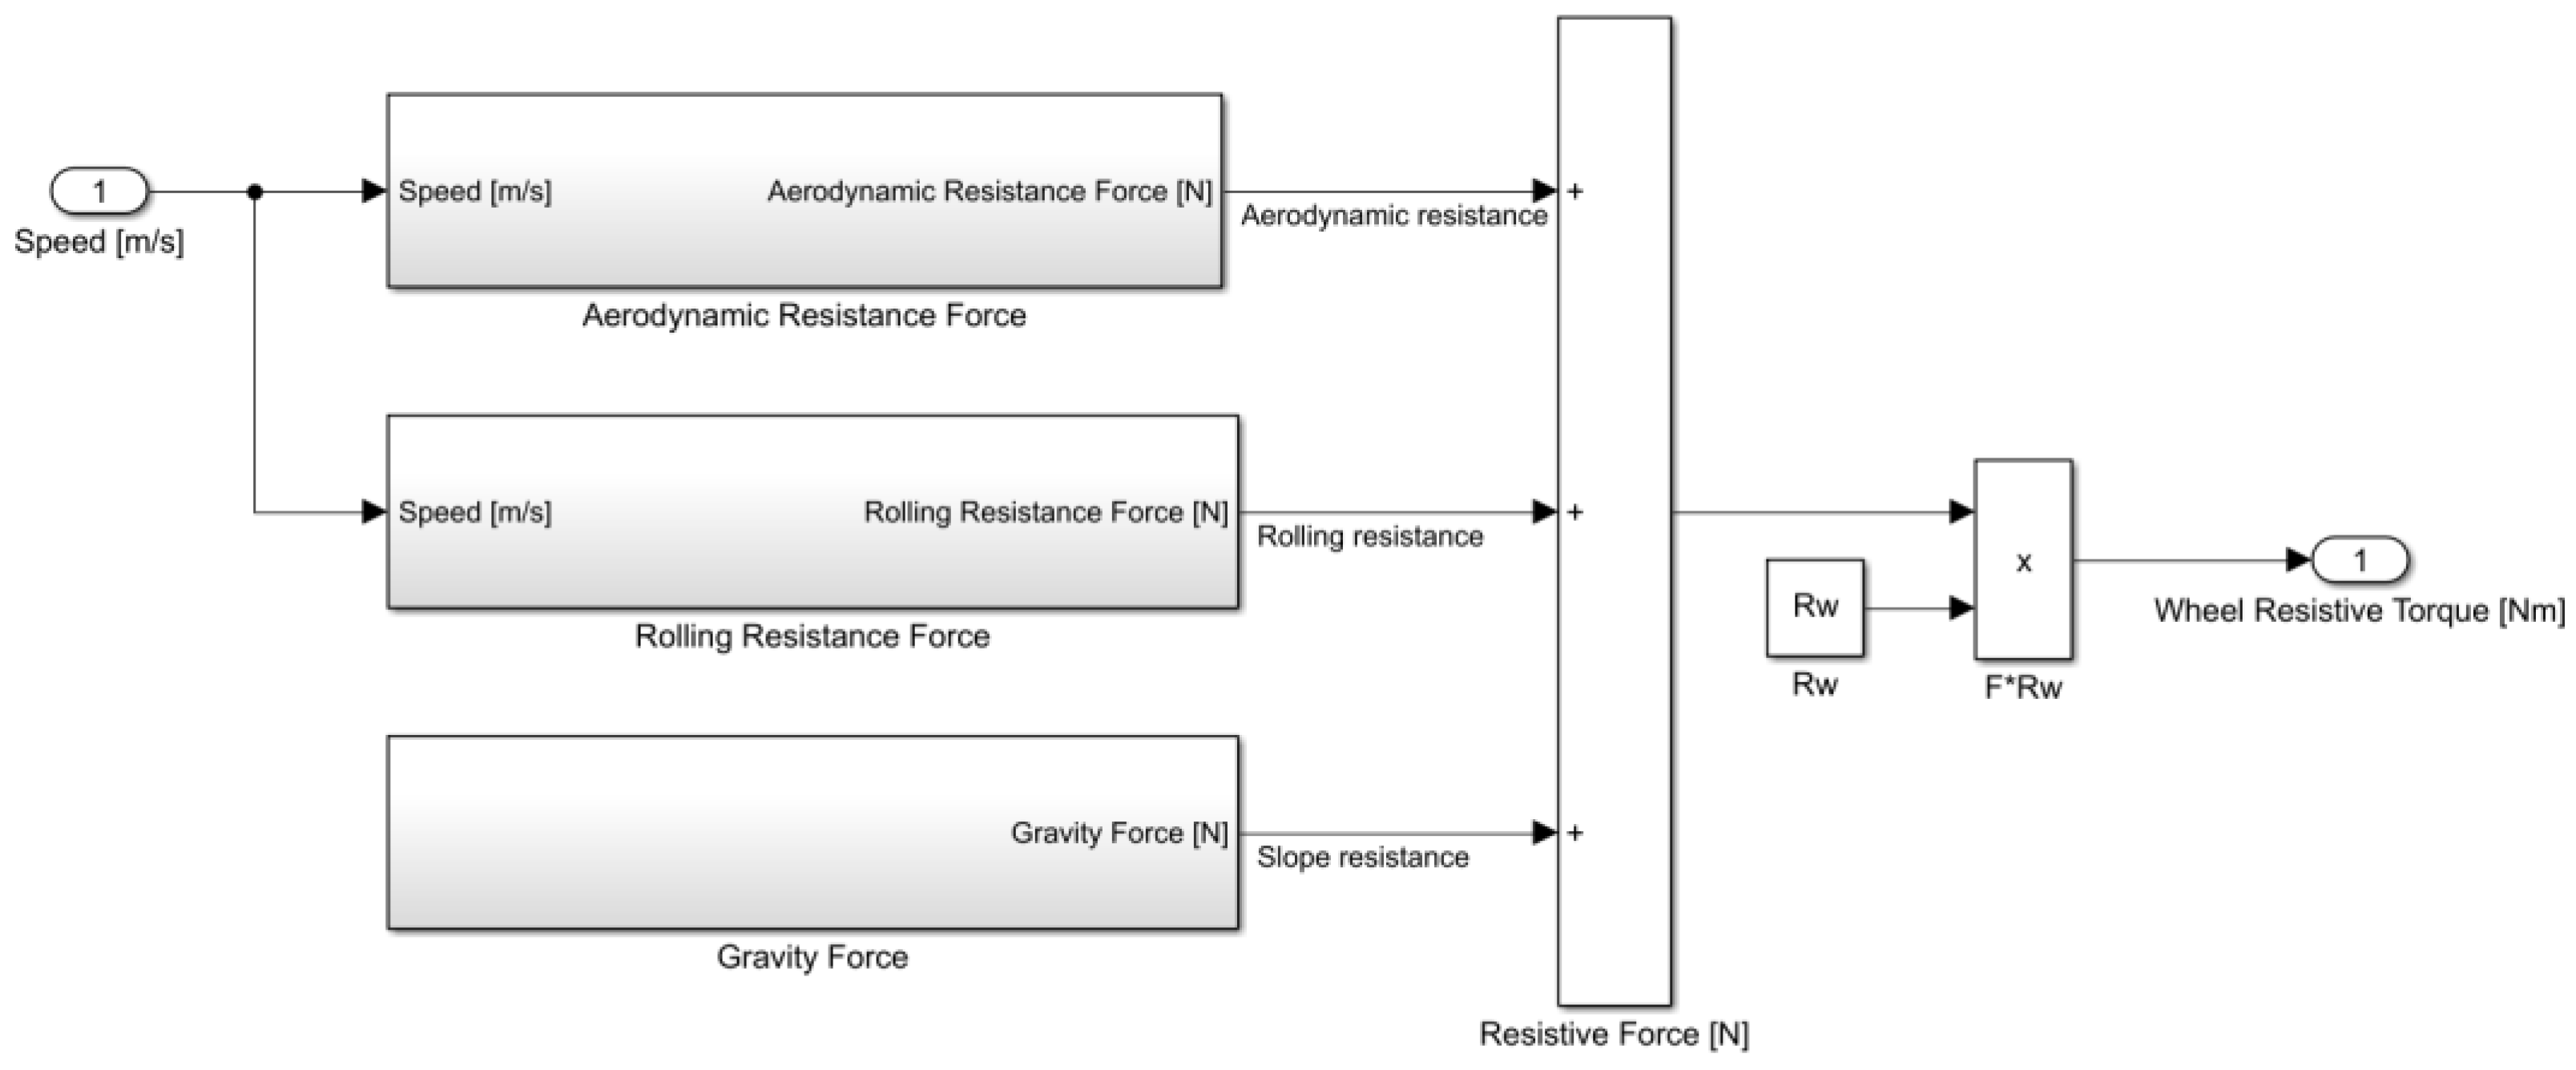
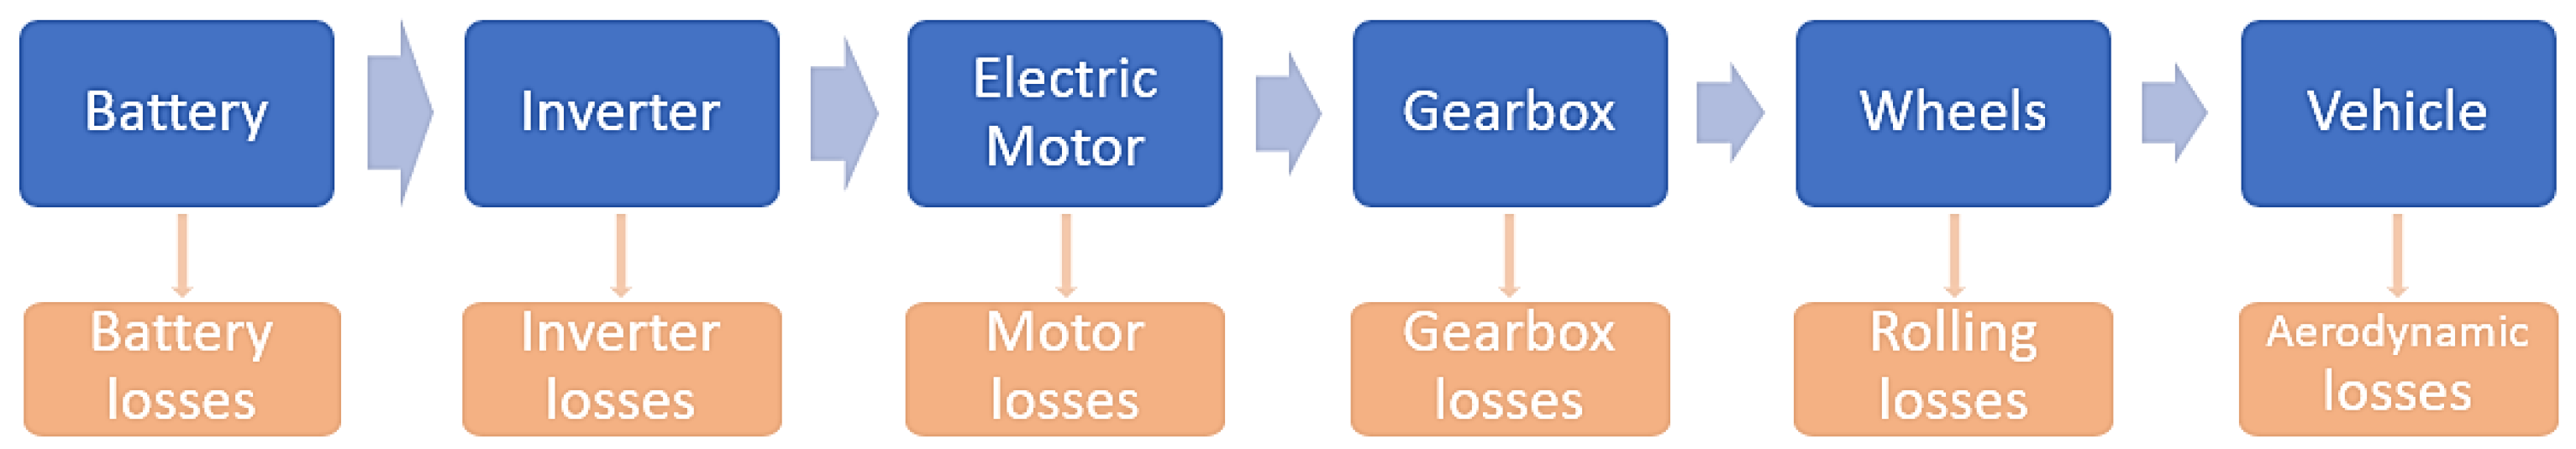
2.2. Prototype Modeling for Optimal Design
- is the aerodynamic force and it is dependent on the air density , the vehicle frontal section , the aerodynamic coefficient and the speed squared (1);
- is the rolling resistance force, proportional to the vehicle mass , the gravitational acceleration , the sum of with the product between and the speed squared , and the cosine of the slope angle . The constants and , depending on and , are obtained from experimental tests, by fitting the experimental curves, performed by the company on the particular wheel geometry on the metallic rope.
- is the gravity force component acting on the trolley in the direction parallel to the ground, and it depends on , and the sine of the slope angle .
Powertrain Sizing
2.3. Electric Trolley Fast Prototyping
2.3.1. Battery Pack Prototyping
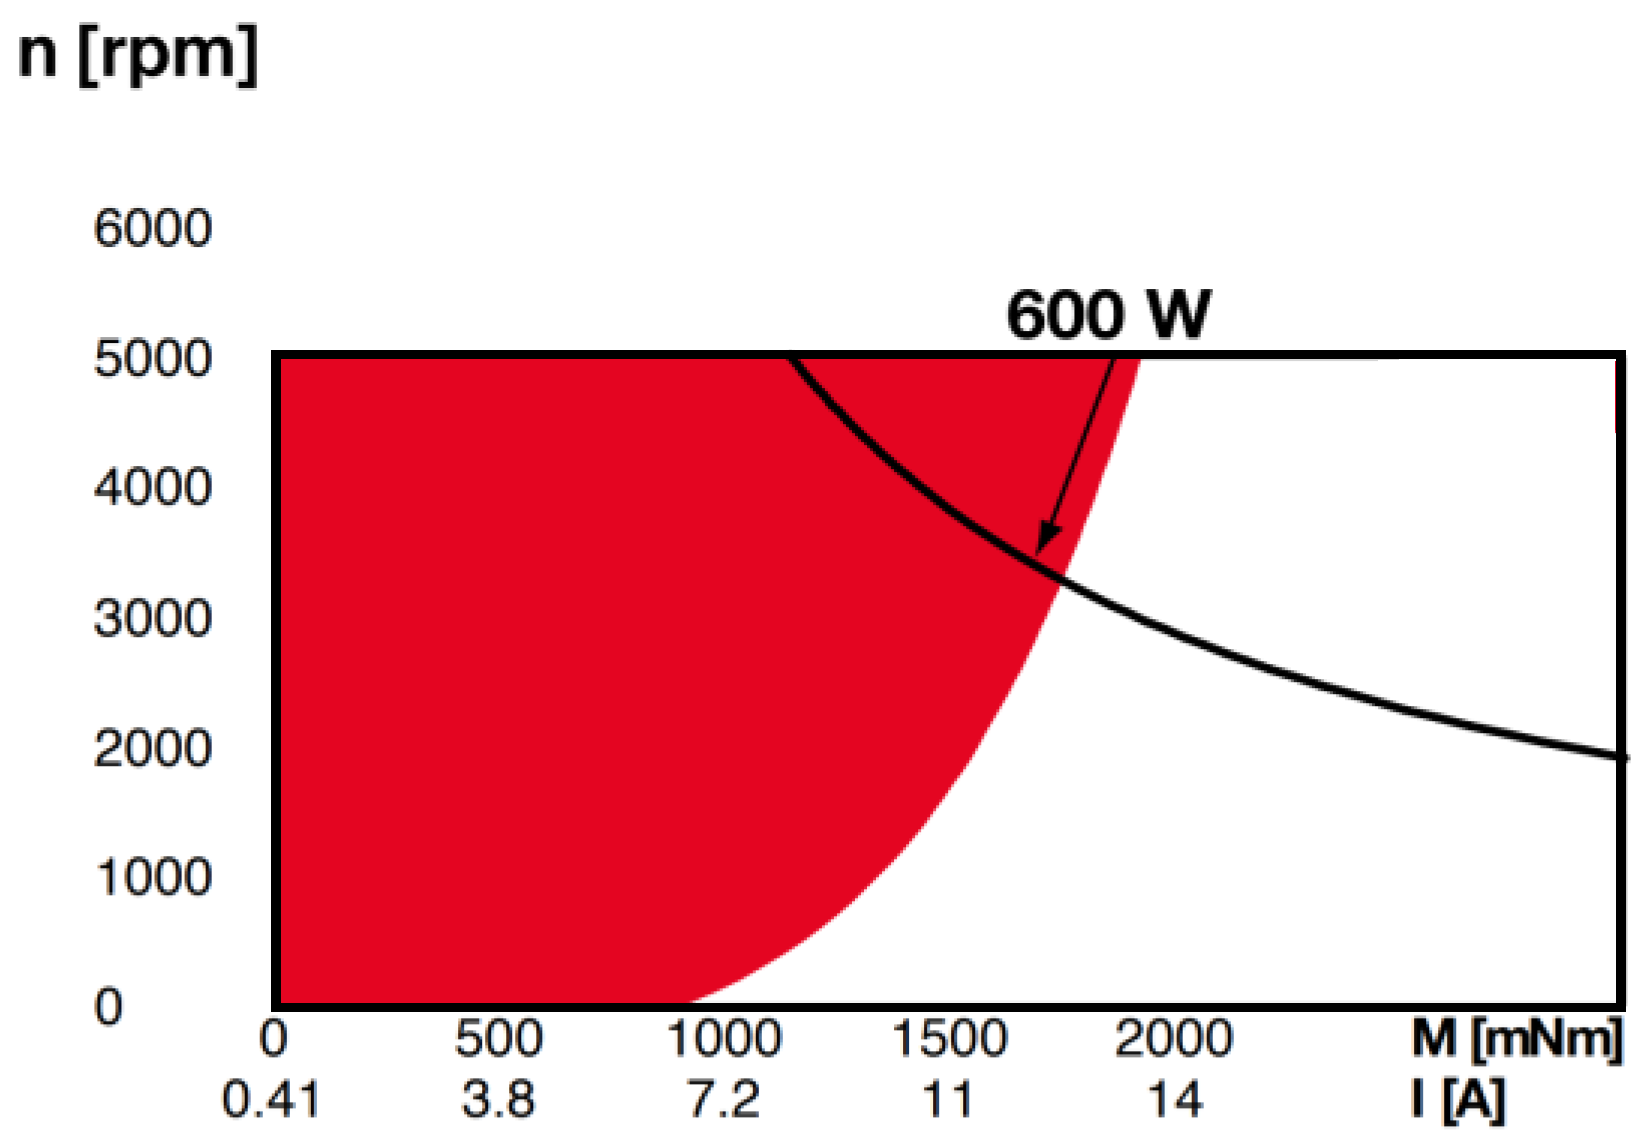
2.3.2. Drive Components Choice
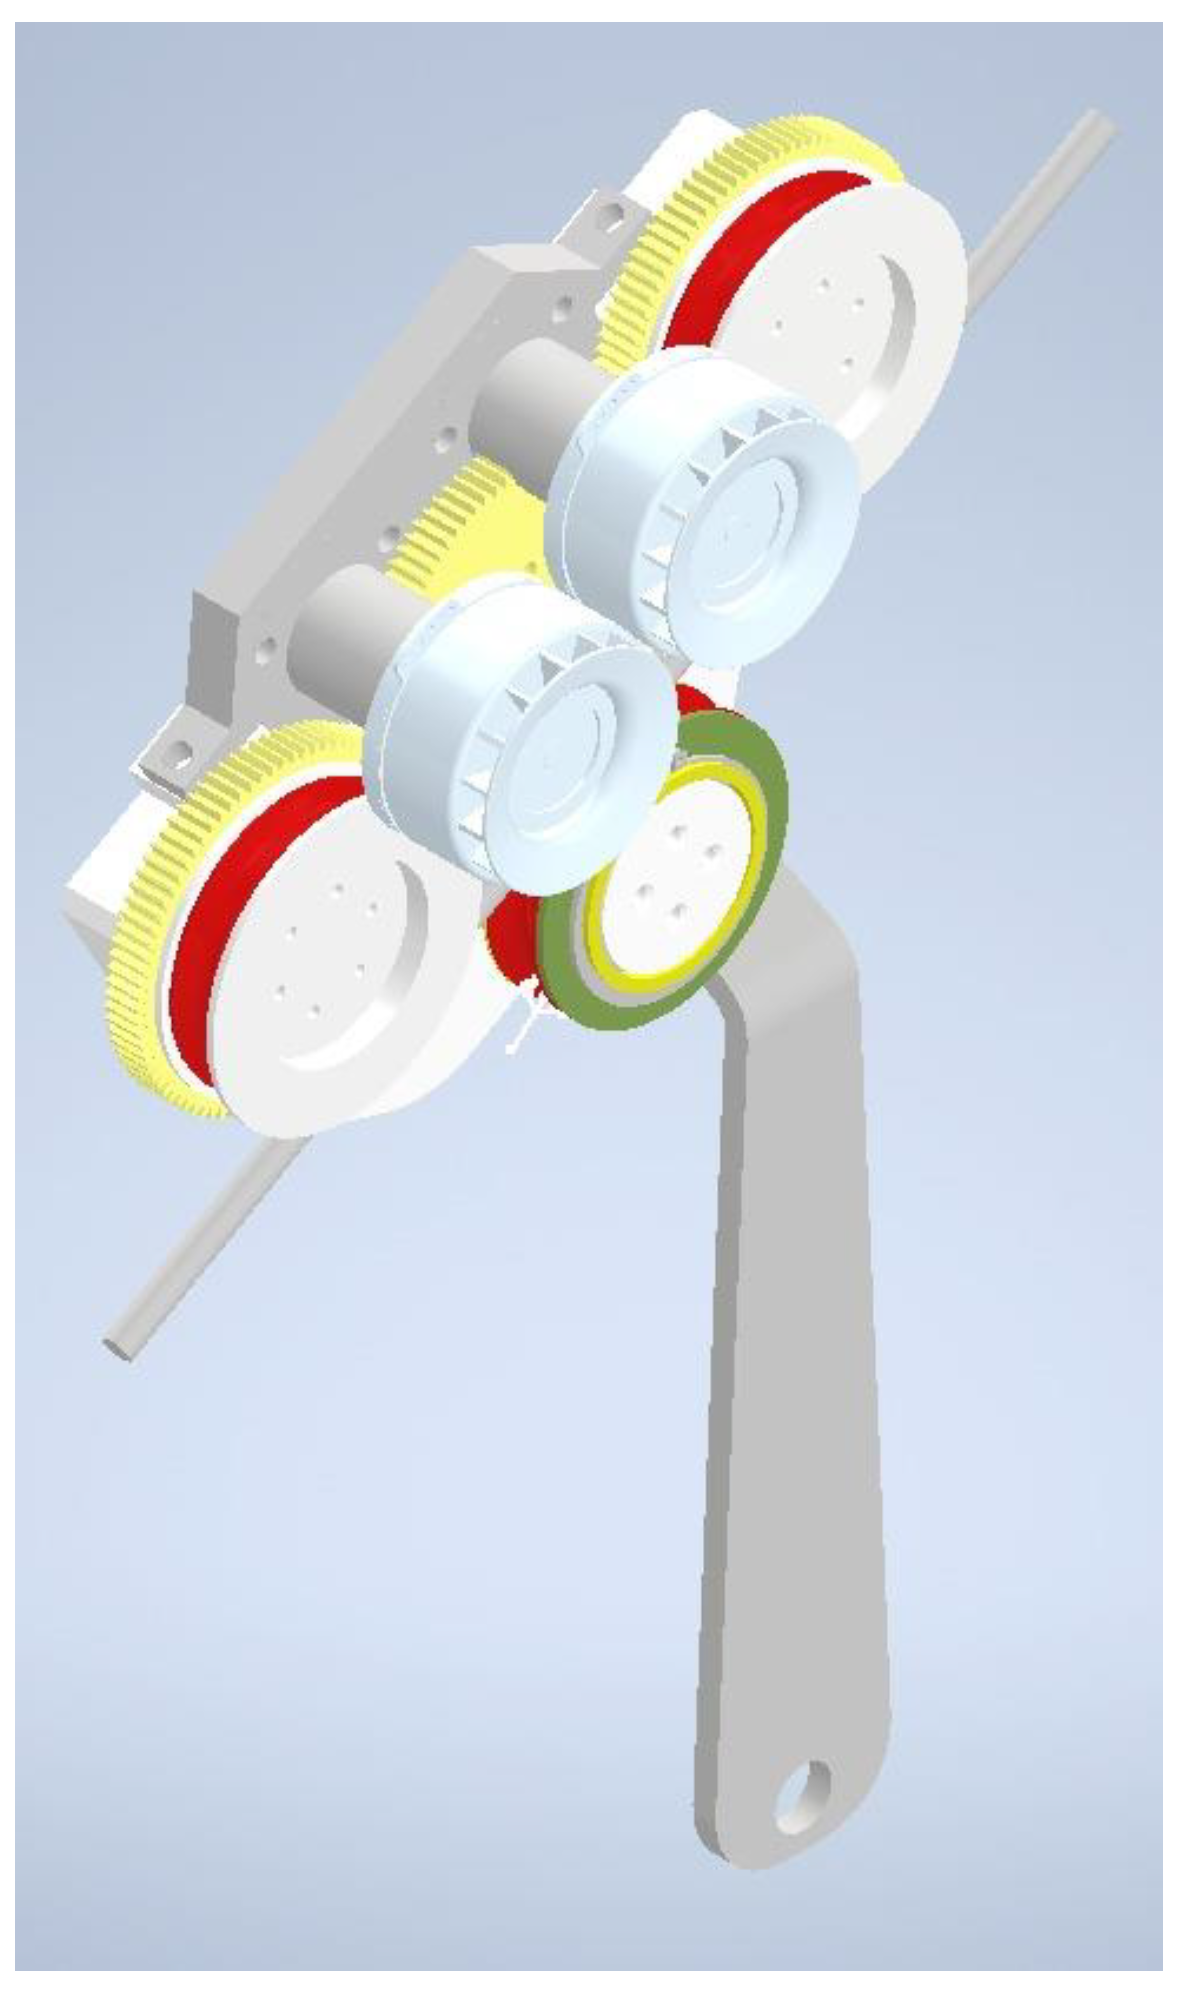
2.3.3. Mechanical Structure Production
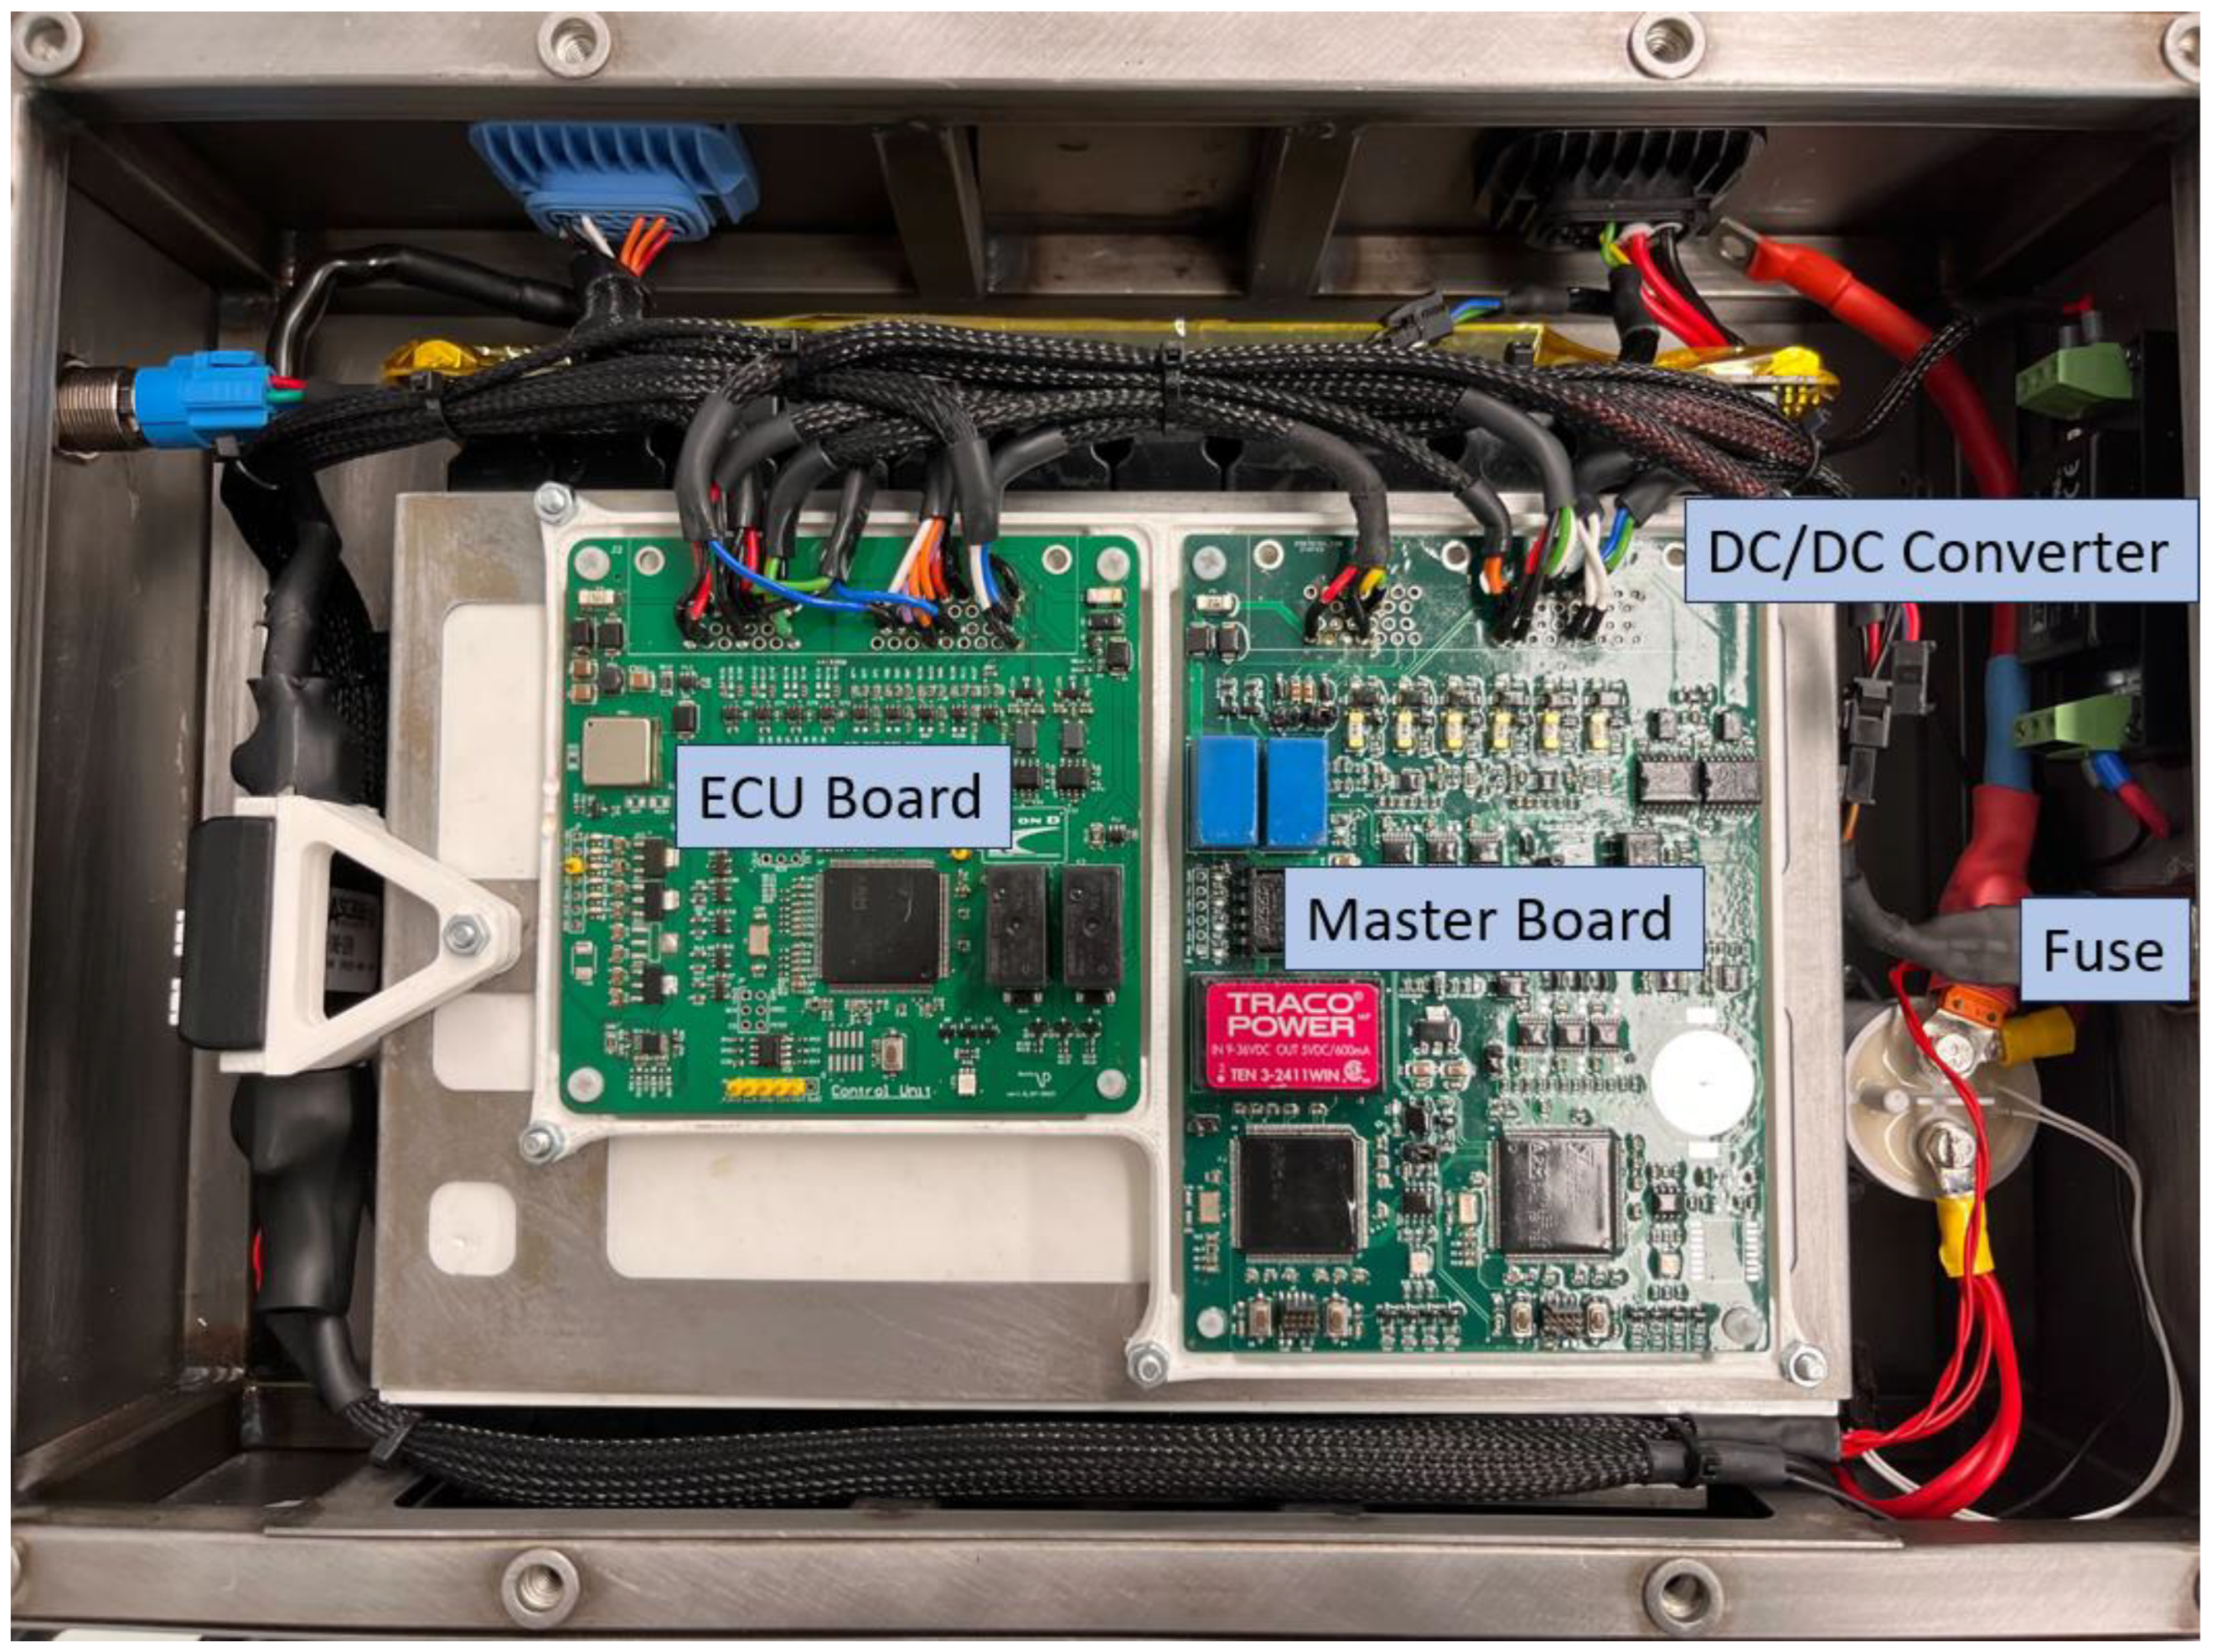
2.3.4. Powertrain Control Integration
3. Results
3.1. Bench Tests
3.2. Horizontal Metallic Rope Tests for Control Logic Validation
- Maximum speed test
- Maximum torque test
- Payload test
- Range test
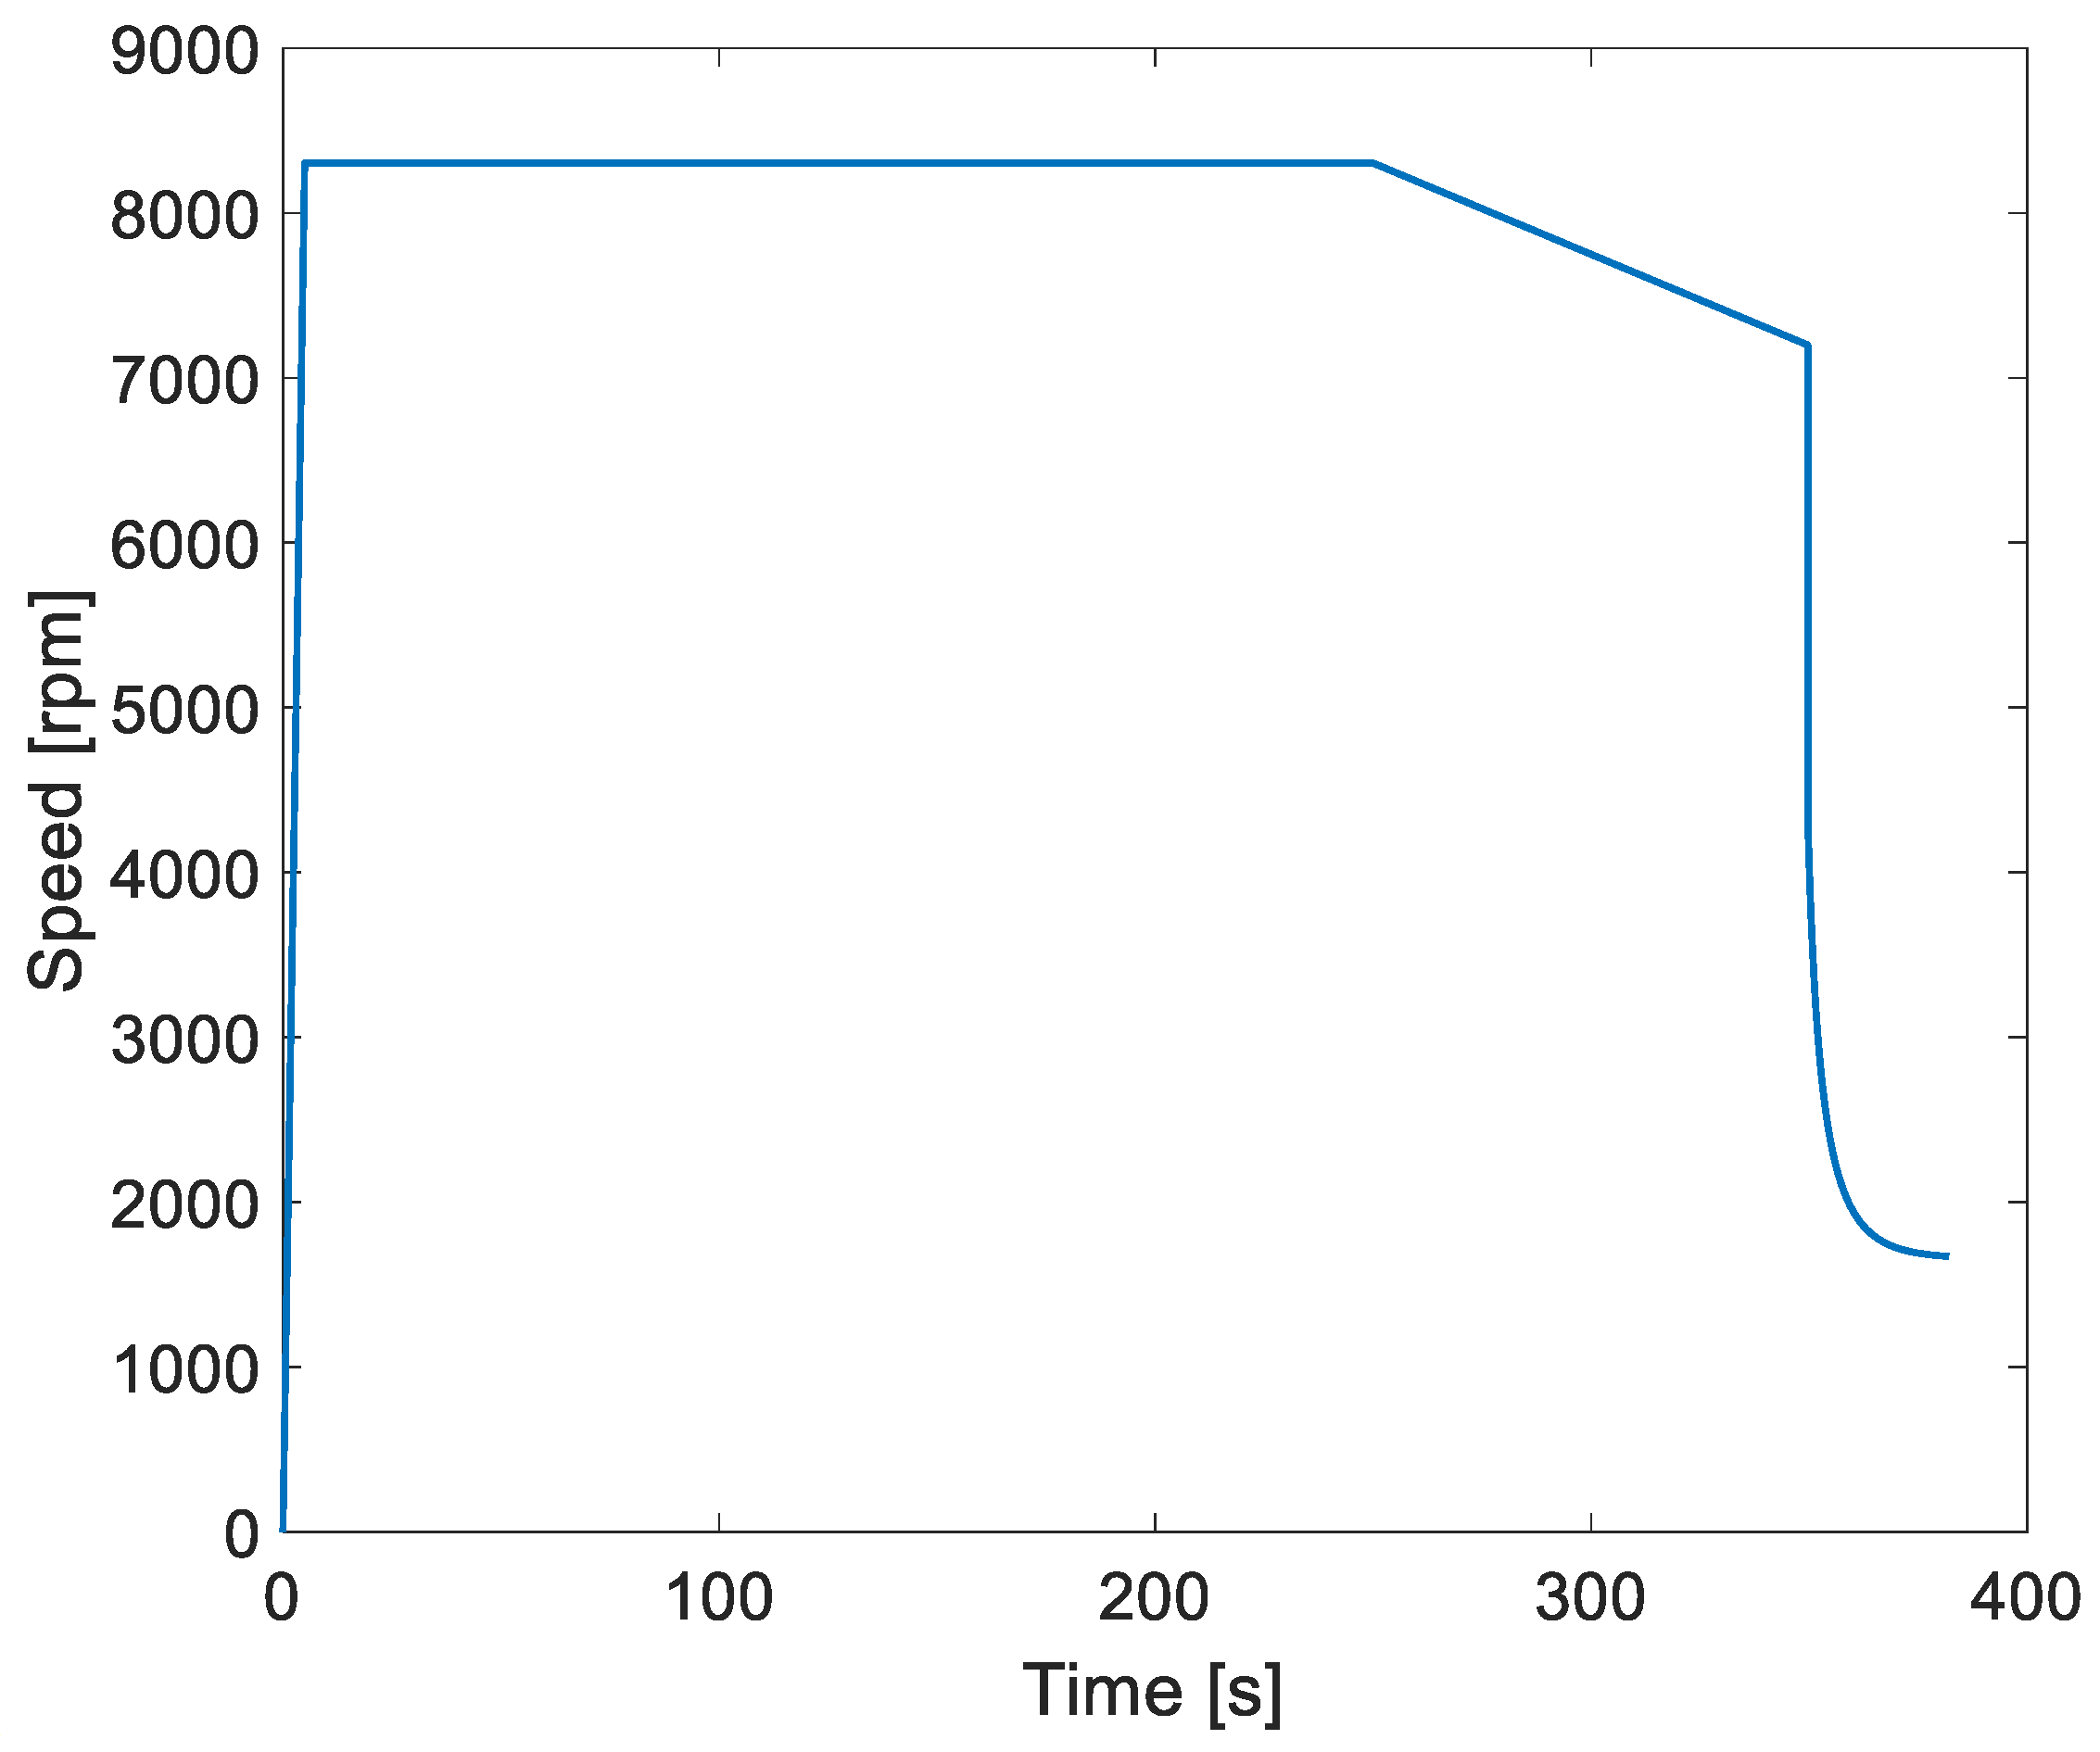
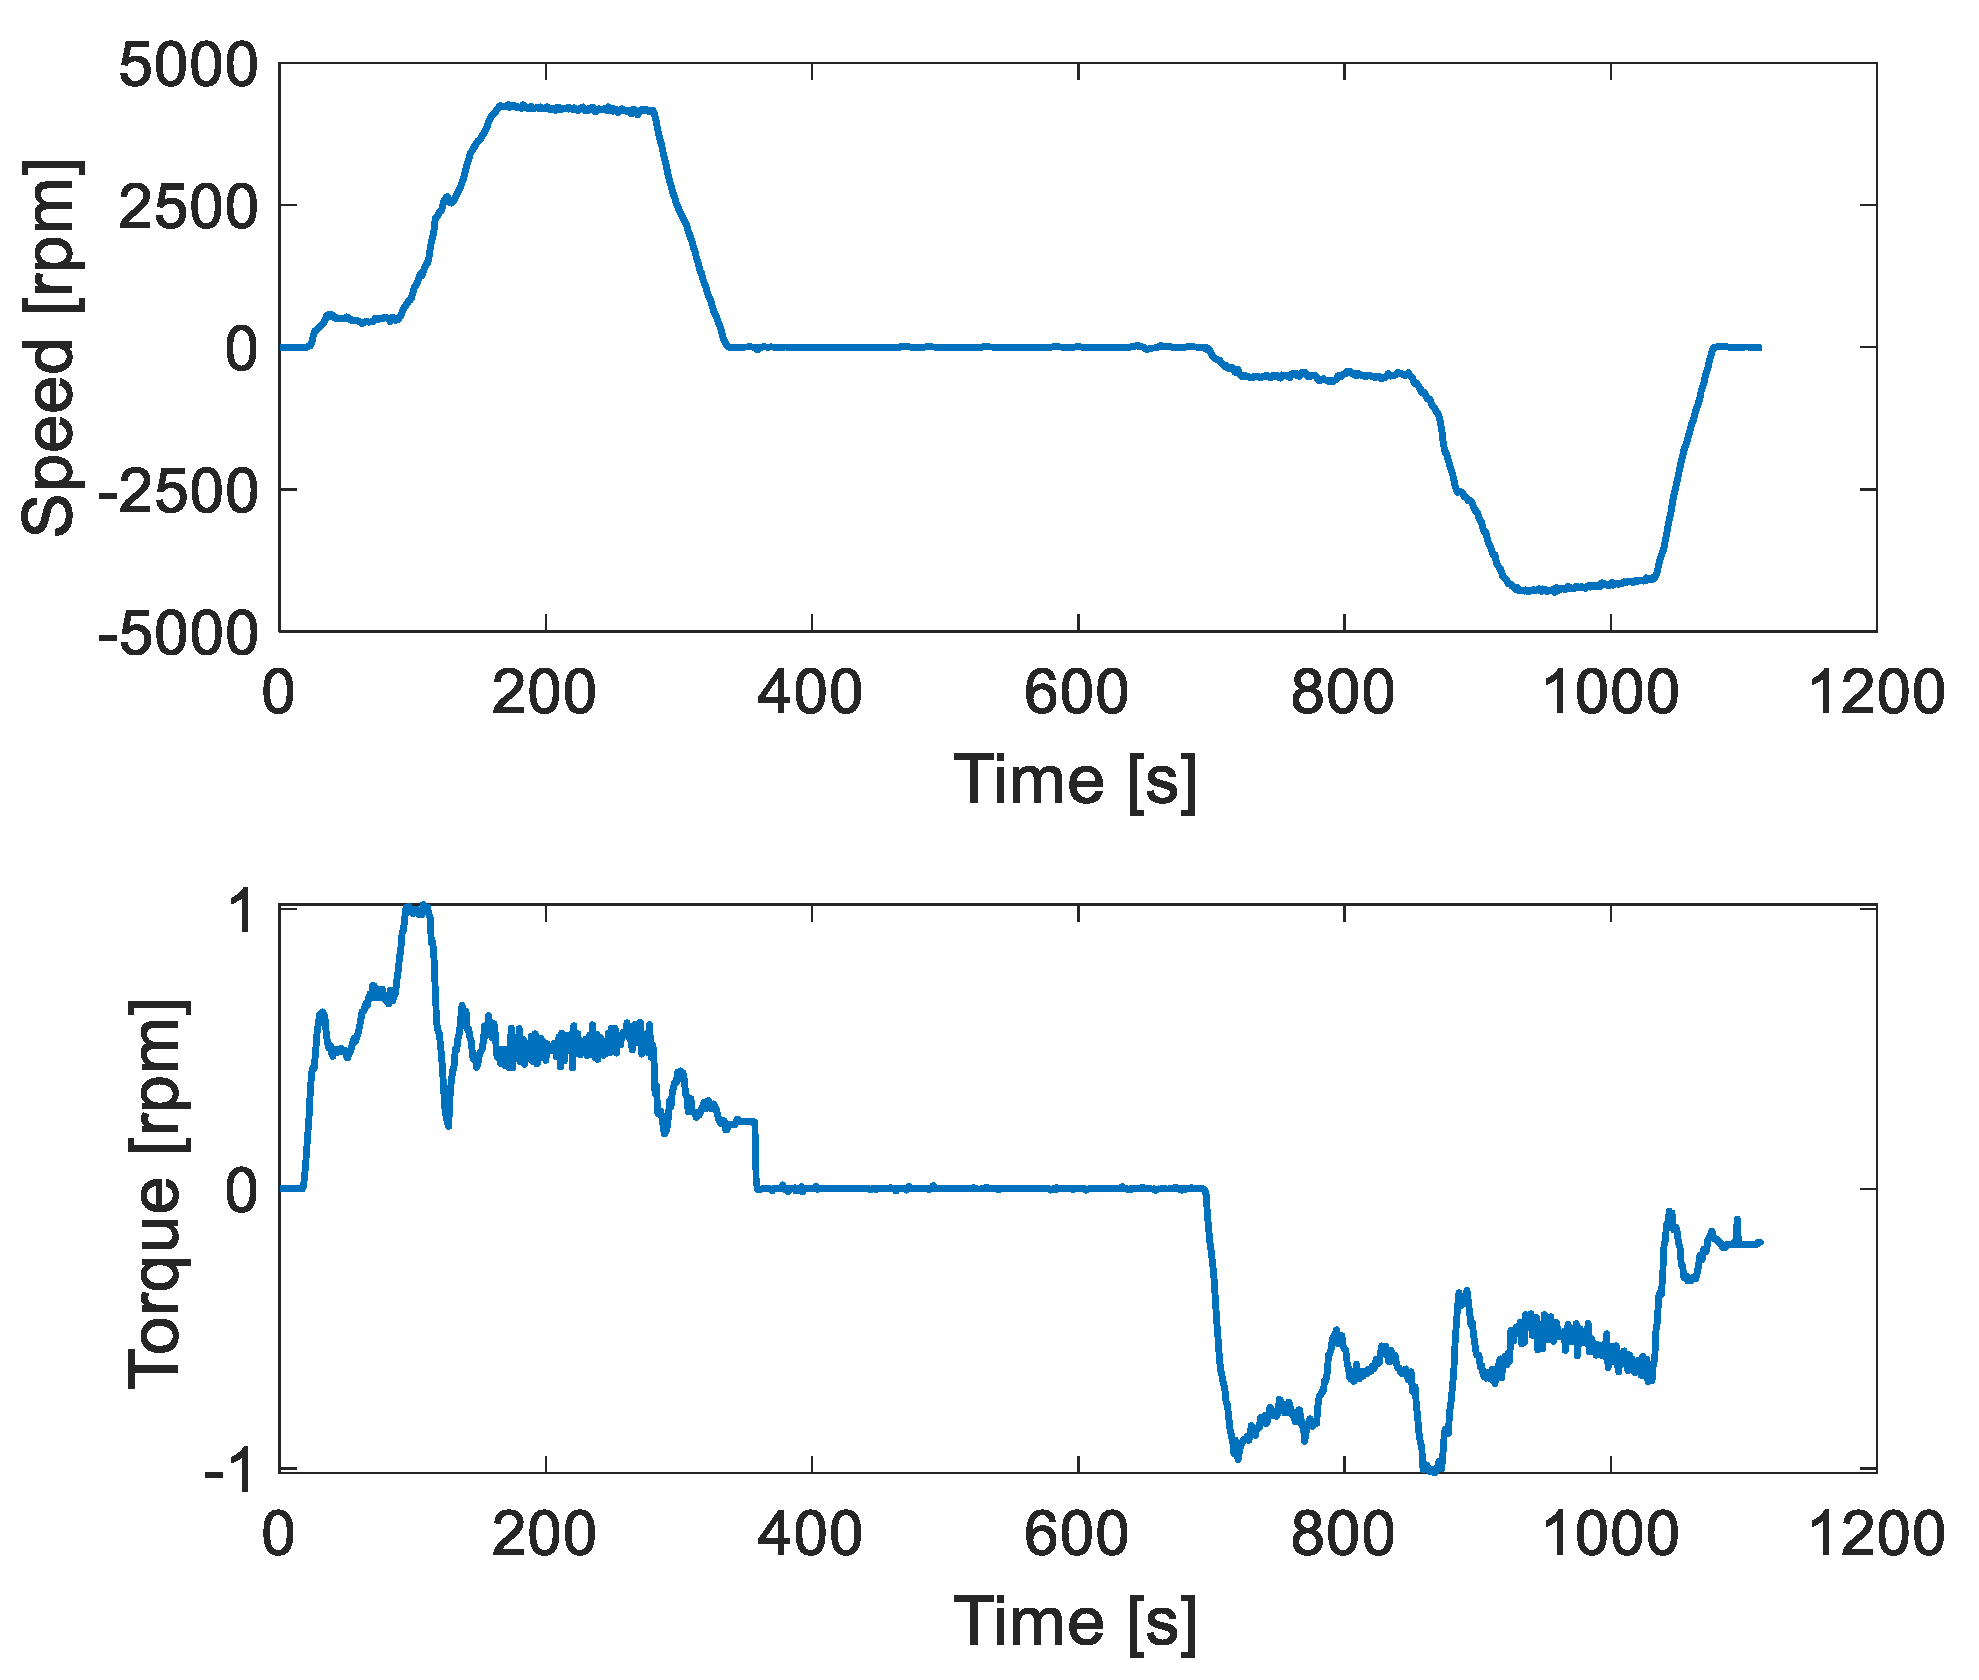
3.2.1. Maximum Speed Test
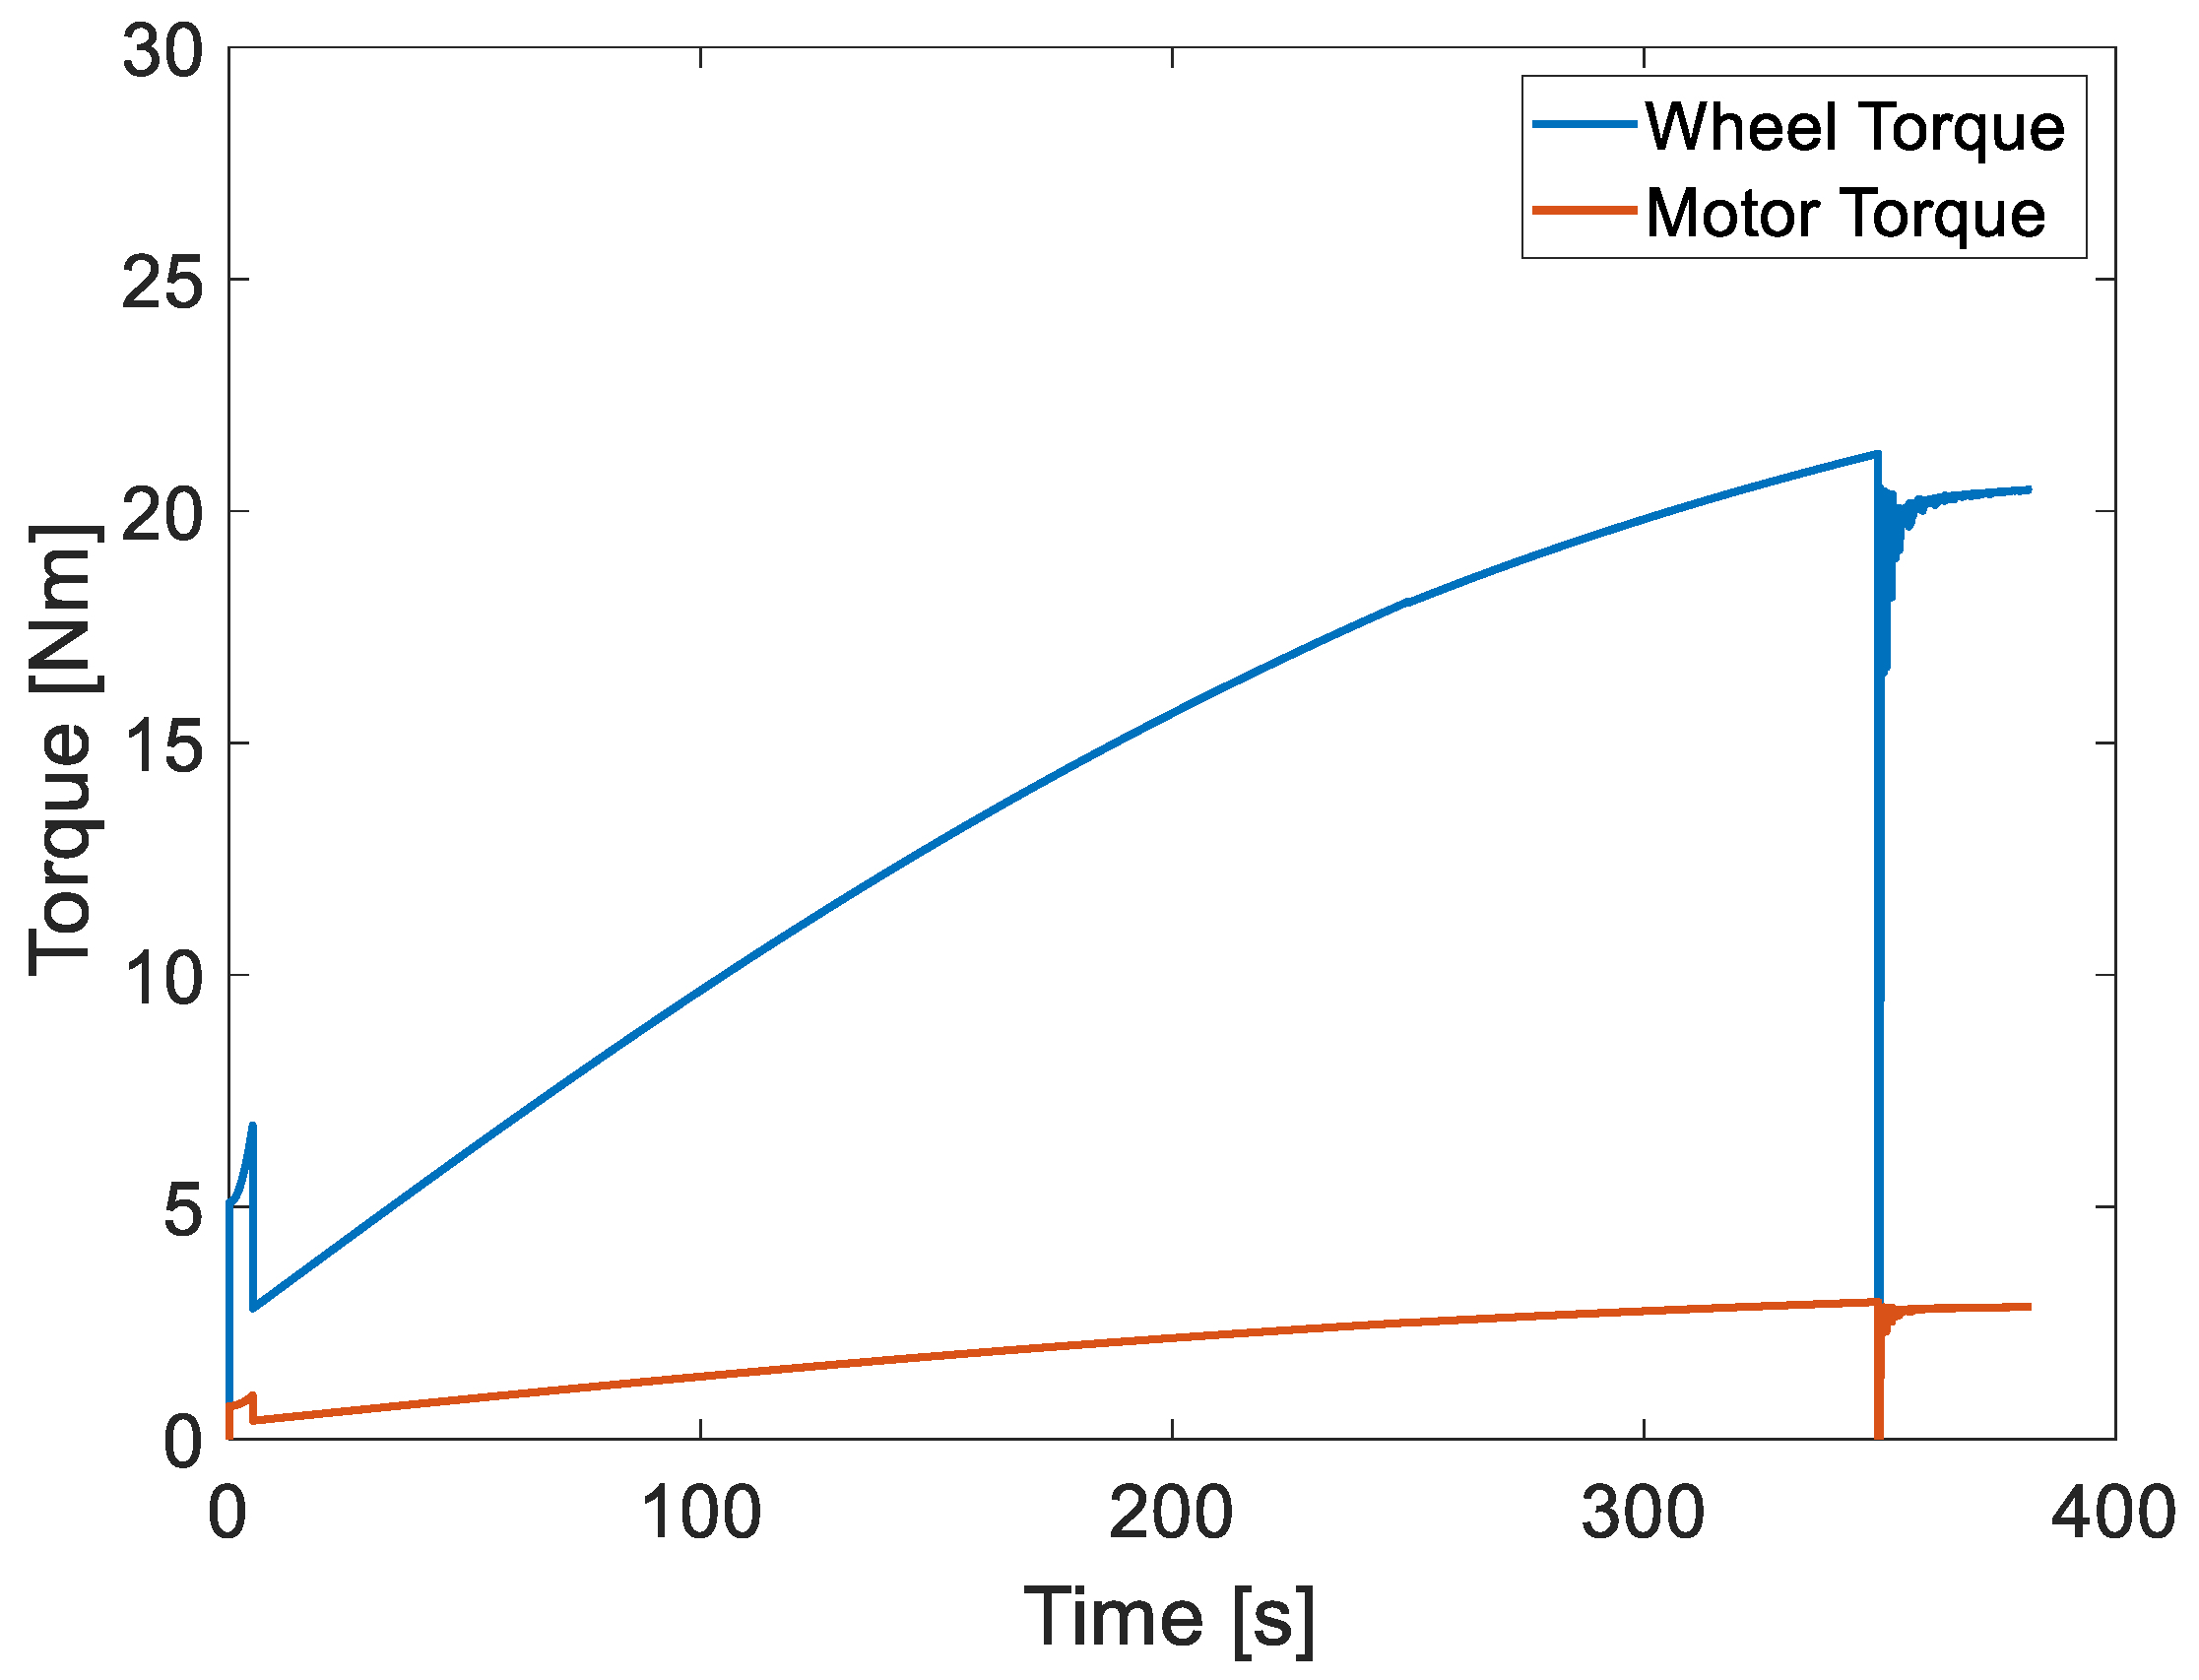
3.2.2. Maximum Torque Test
3.2.3. Payload Test
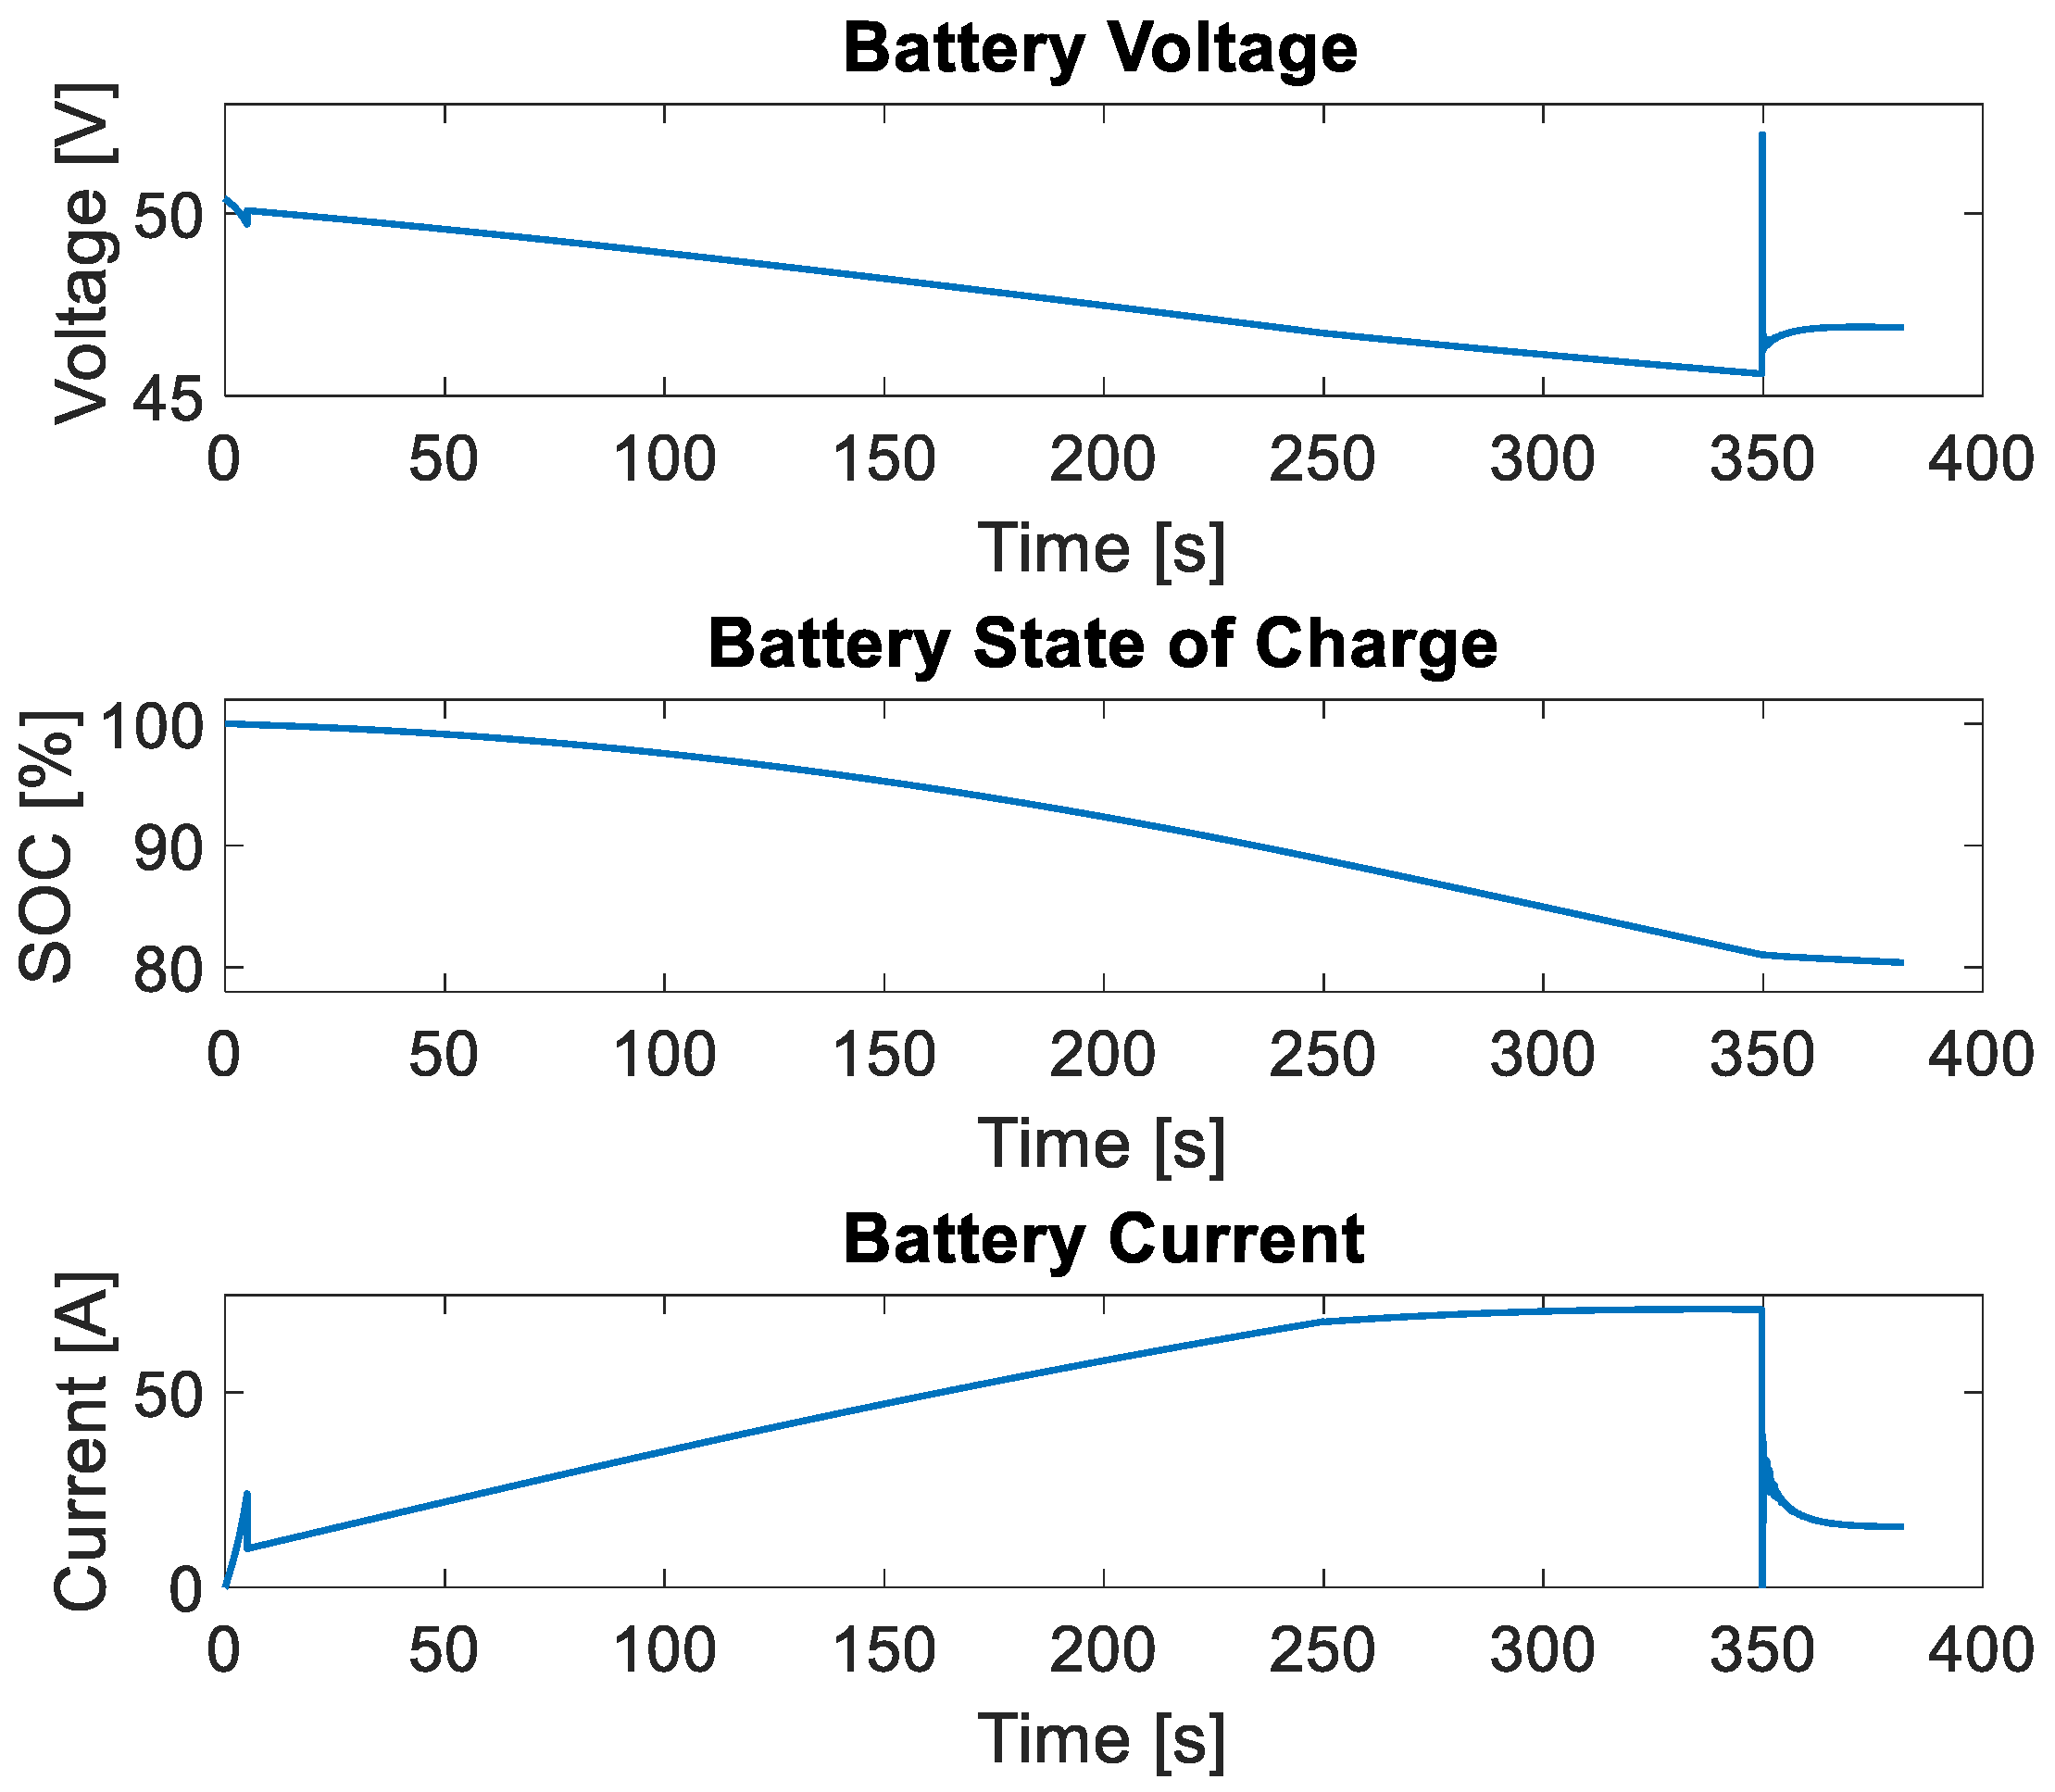
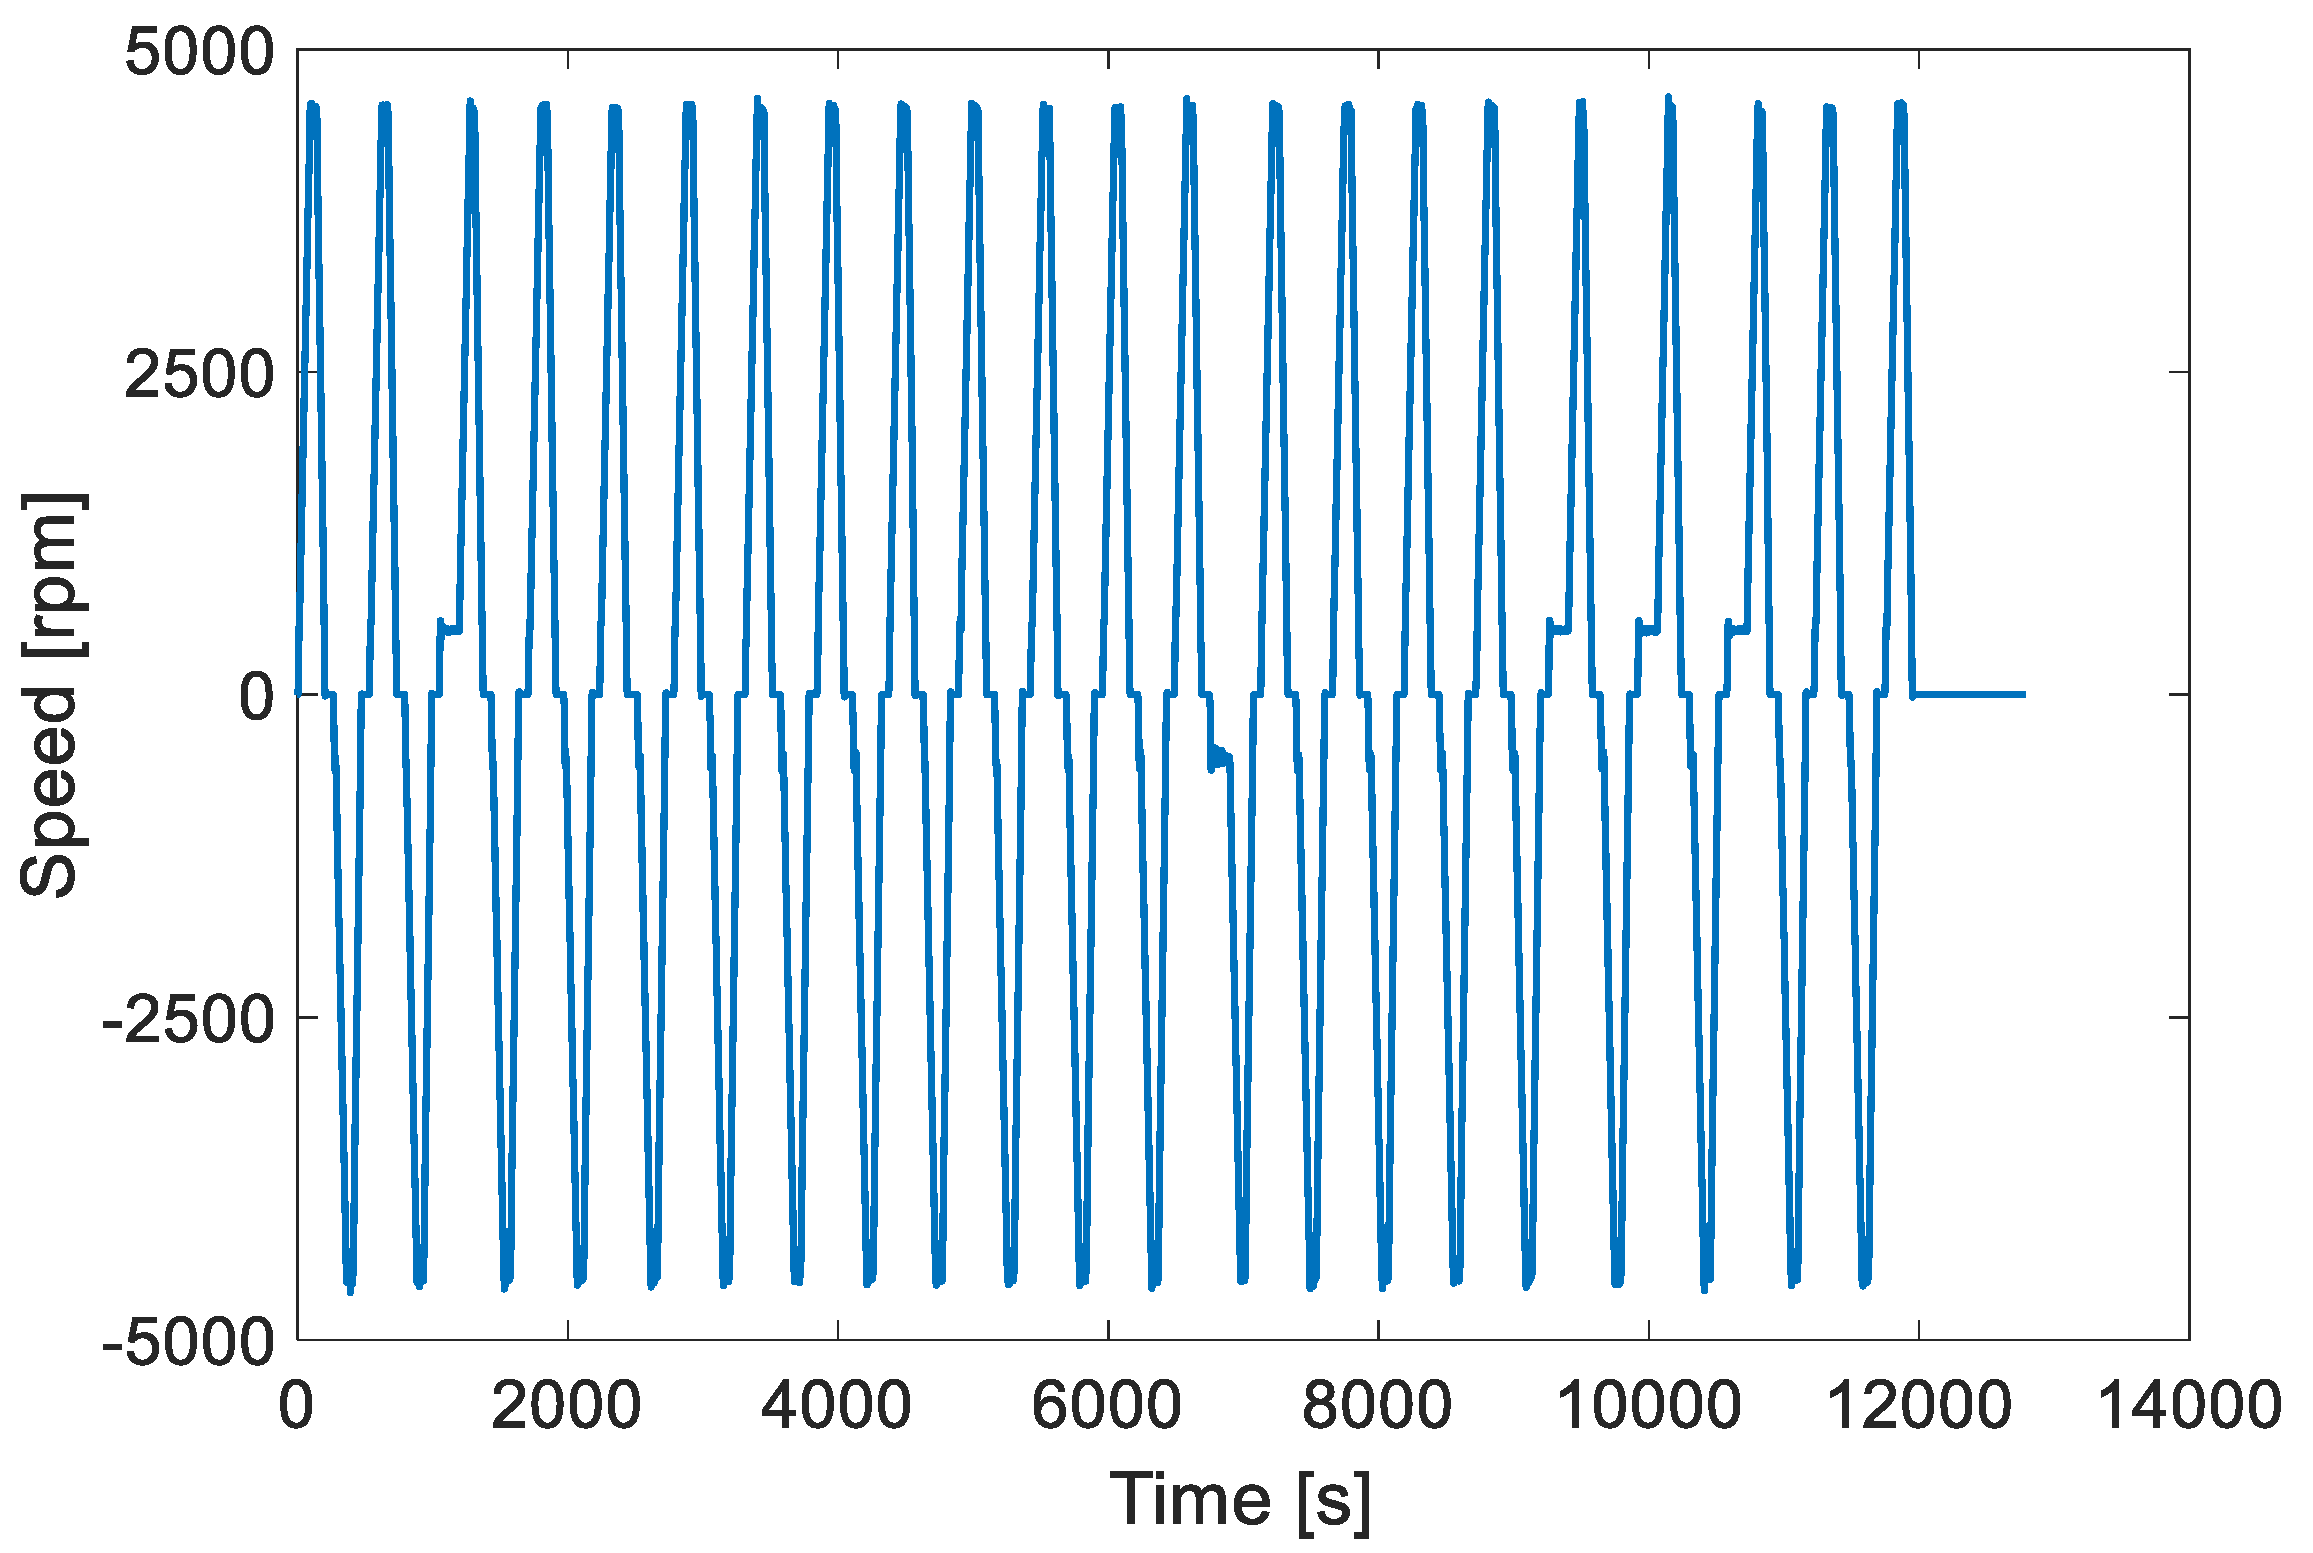
3.2.4. Range Test
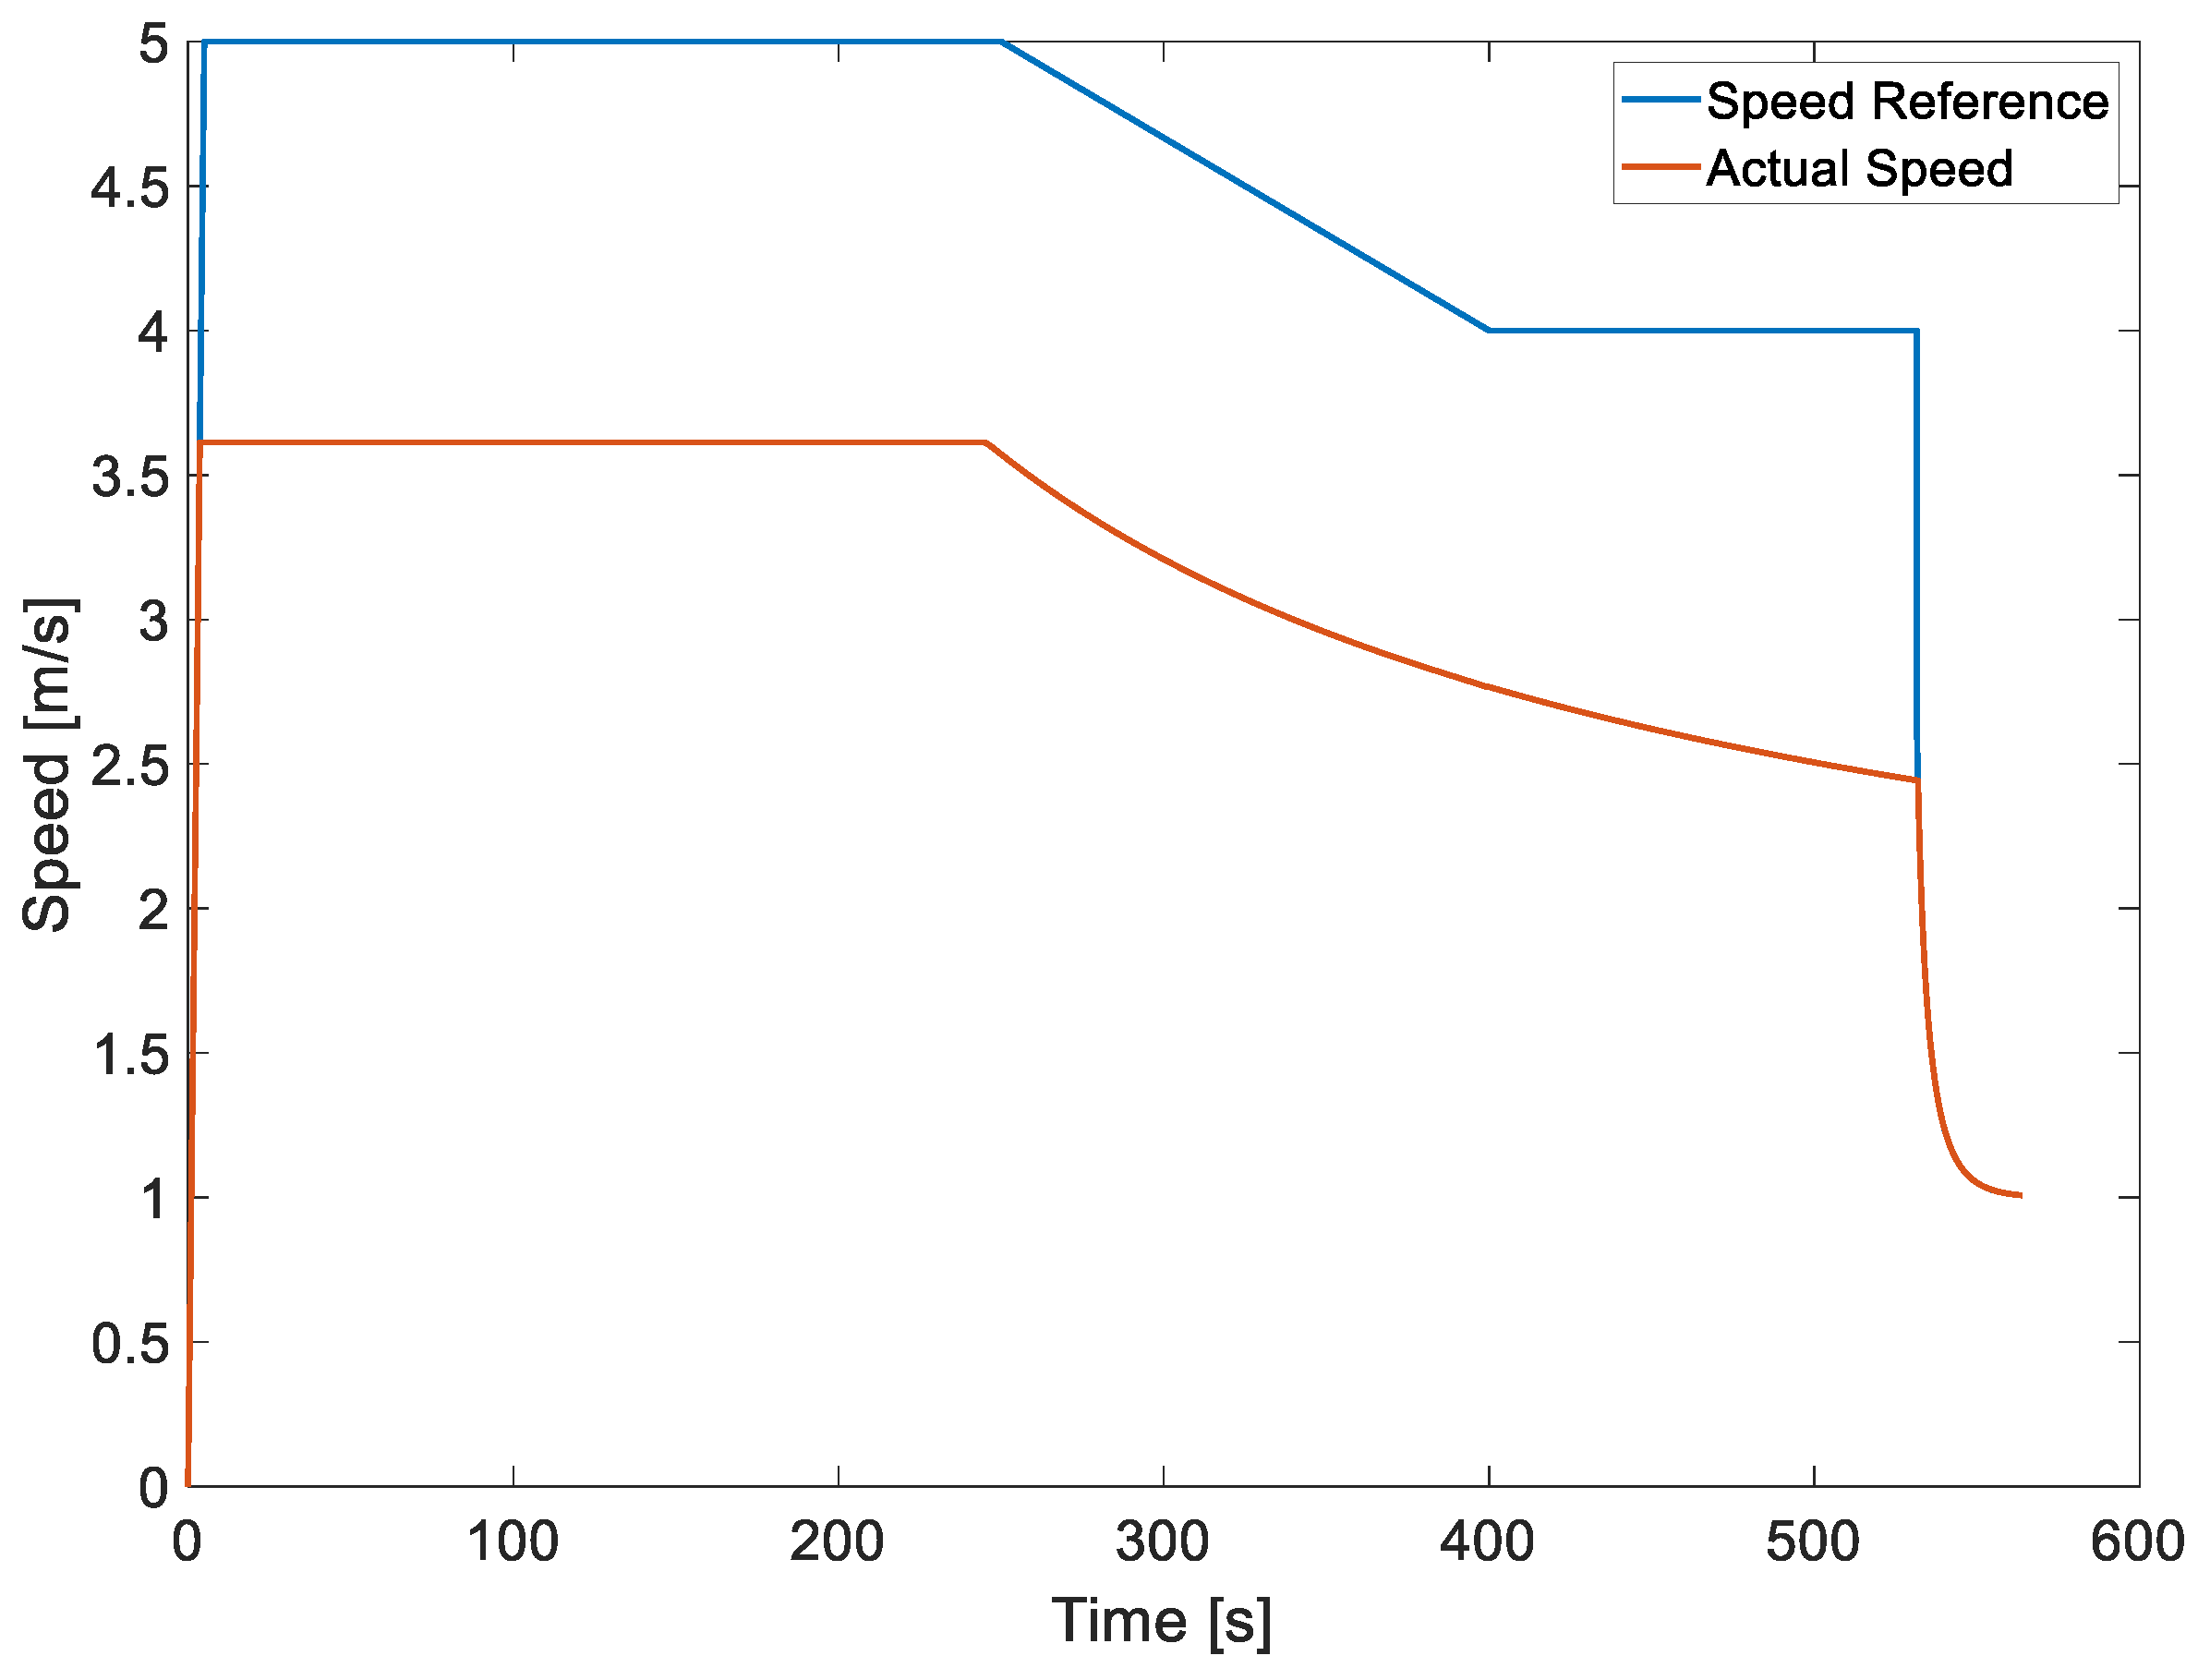
3.3. Experimental Tests on Final Application for Model Validation
4. Conclusions
Author Contributions
Funding
Data Availability Statement
Acknowledgments
Conflicts of Interest
References
- Jojić, T.; Vladić, J.; Đokić, R. Specific machines and devices with horizontal rope as carrying element-zipline. Proc. Fac. Tech. Sci. 2018, 33, 13–16. [Google Scholar]
- Jojić, T.; Vladić, J.; Đokić, R. Anchorage type and tension rope force impact on zipline’s kinematic characteristics. Mach. Des. 2019, 11, 149–154. [Google Scholar] [CrossRef]
- Steele, C.Z.; Udow, D.E.; Steele, R.L. Continuous Assist Zipline Braking and Control System. US Patent Application No. 2011/0162917 A1, 22 December 2011. [Google Scholar]
- Đokić, R.; Vladić, J.; Jojić, T. Zipline computational model forming and impact of influential sizes. In Proceedings of the 7th International Conference “Transport and Logistics-TIL 2019”, Niš, Serbia, 6 December 2019; pp. 71–74. [Google Scholar]
- Vladić, J.; Živanić, D.; Džinčić, I.; Đokić, R.; Gajić, A. Application of the numerical methods for dynamic analysis of transport systems with rope. In Proceedings of the VIII Triennial International Conference HEAVY MACHINERY-HM 2014, Zlatibor, Serbia, 25–28 June 2014; pp. 37–42, ISBN 978-86-82631-74-3. [Google Scholar]
- Vladić, J. The Parametric of Equation of a Catenary Line and Theoretical Foundations for Static Analysis a Ropeway. In Proceedings of the XV European Conference of Material Handling Teaching Professors, Novi Sad, Serbia, 22–26 September 2004; pp. 170–178. [Google Scholar]
- Jojić, T.; Vladić, J.; Đokić, R. Zipline Design Issues and Analysis of the Influencing Parameters on Passenger’s Velocity. In Proceedings of the 5th International Conference “Mechanical Engineering in XXI Century-MASING 2020”, Niš, Serbia, 9–10 December 2020; pp. 129–132. [Google Scholar]
- Vladić, J.; Jojić, T.; Đokić, R.; Gajić, A. Theoretical backgrounds for zipline analysis. In Proceedings of the XXIII International Conference on “Material Handling, Construction and Logistics-MHCL, Vienna, Austria, 18–20 September 2019. [Google Scholar] [CrossRef]
- Kc, D.; Maraseni, T.; Jamir, C.; Magar, R.T.; Tuladhar, F. Effectiveness of Gravity Goods Ropeways in market. Transportation 2020, 47, 1393–1414. [Google Scholar] [CrossRef]
- Magar, T.R. Gravity Goods Ropeways: A Sustainable Solution for Rural Transportation in Hilly and Mountainous Regions of Nepal. 27 October 2016. Available online: https://scholarsbank.uoregon.edu/xmlui/bitstream/handle/1794/20424/ThapaMagar_oregon_0171N_11478.pdf?sequence=1 (accessed on 30 January 2024).
- Laxman, K.C. Gravity goods ropeway an alternative sustainable solution for rural transportation without hampering to the natural environment and climate: A case study from Janagaun village. IOP Conf. Ser. Earth Environ. Sci. 2009, 6, 202019. [Google Scholar] [CrossRef]
- Adhikari, D. Potential Development of Gravity Goods Ropeway Andits Impact on Rural Livelihood (A Case Study of Gholechappra Settlement at Bukhel VDC in Lalitpur District); Department of Rural Development: New Delhi, India, 2011.
- Baral, L.B.; Nakarmi, J.J.; Poudyal, K.N.; Karki, N.R.; Nalmpantis, D. Gravity and muscle force operated surface ropeway: An efficient, cheap, and eco-friendly transport mode for mountainous countries. Eur. Phys. J. Plus 2019, 134, 55. [Google Scholar] [CrossRef]
- Quizona, K.D.; Shelly, S.; Holman, N.; Glozer, M.; Black, A. Physical and digital architecture for collection and analysis of imparted accelerations on Zip Line attractions. JTEAS J. Themed Exp. Attract. Stud. 2018, 1, 61–65. [Google Scholar]
- Jovan, V.; Tanasije, J.; Radomir, Đ. Condition analysis and basis for selection of zipline arresting devices. IMK-14-Istraz. Razvoj 2020, 26, 89–94. [Google Scholar] [CrossRef]
- ISO 11228-1:2021; Ergonomics—Manual Handling—Part 1: Lifting, Lowering and Carrying. ISO: Geneva, Switzerland, 2021.
- Such, M.; Jimenez-Octavio, J.R.; Carnicero, A.; Lopez-Garcia, O. An approach based on the catenary equation to deal with static analysis of three dimensional cable structures. Eng. Struct. 2009, 31, 2162–2170. [Google Scholar] [CrossRef]
- de Carvalho Pinheiro, H. PerfECT Design Tool: Electric Vehicle Modelling and Experimental Validation. World Electr. Veh. J. 2023, 14, 337. [Google Scholar] [CrossRef]
- Hu, Z.J.; Su, R.; Zhang, K.; Xu, Z.Y.; Ma, R.J. Resilient event-triggered model predictive control for adaptive cruise control under sensor attacks. IEEE/CAA J. Autom. Sin. 2023, 10, 807–809. [Google Scholar] [CrossRef]
- Salem, F.M.; Mossad, M.I.; Awadallah, M.A. A comparative study of MPC and optimised PID control. Int. J. Ind. Electron. Drives 2015, 2, 242. [Google Scholar] [CrossRef]
- Rizzello, A.; Scavuzzo, S.; Ferraris, A.; Airale, A.G.; Bianco, E.; Carello, M. Non-linear Kalman Filters for Battery State of Charge Estimation and Control. In Proceedings of the 2021 International Conference on Electrical, Computer, Communications and Mechatronics Engineering (ICECCME), Mauritius, Mauritius, 7–8 October 2021; pp. 1–7. [Google Scholar] [CrossRef]
- Sensinger, J.W.; Clark, S.D.; Schorsch, J.F. Exterior vs. interior rotors in robotic brushless motors. In Proceedings of the 2011 IEEE International Conference on Robotics and Automation, Shanghai, China, 9–13 May 2011; pp. 2764–2770. [Google Scholar] [CrossRef]
- Bianco, E.; Carello, M. A first e-scooter powertrain analysis for Fuel Cell integration. In Proceedings of the 2022 International Conference on Electrical, Computer, Communications and Mechatronics Engineering (ICECCME), Male, Maldives, 16–18 November 2022; pp. 1–6. [Google Scholar] [CrossRef]
- Daoudi, K.; Boudi, E.M. Structural Investigation of the Gearbox with Epicyclical Gear System by FEM. In Proceedings of the 2018 International Conference on Electronics, Control, Optimization and Computer Science (ICECOCS), Kenitra, Morocco, 5–6 December 2018; pp. 1–5. [Google Scholar] [CrossRef]
- Grano, E.; Lazek, T.; Carello, M. A numerical methodology for induction motor control: Lookup tables generation and steady-state performance analysis. In Proceedings of the WCX SAE World Congress Experience (WCX24) 2024, Detroit, MI, USA, 16–18 April 2024. [Google Scholar]
- Liu, Y.; Zhao, J.; Xia, M.; Luo, H. Model Reference Adaptive Control-Based Speed Control of Brushless DC Motors with Low-Resolution Hall-Effect Sensors. IEEE Trans. Power Electron. 2014, 29, 1514–1522. [Google Scholar] [CrossRef]
- Lataire, L. Optical Sensors for Factory Automation. In Proceedings of the Proceedings SPIE 0672, In Situ Industrial Applications of Optics, Brusssels, Belgium, 22 July 1986. [Google Scholar] [CrossRef]


| Target | Value | Unit of Measure |
|---|---|---|
| Slope profile | Catenary | - |
| Rated slope | 23 | [%] |
| Maximum slope | 60 | [%] |
| Maximum speed | 7 | [m/s] |
| Minimum average speed | 3 | [m/s] |
| Min distance | 1500 | [m] |
| Max distance | 6000 | [m] |
| Number of spans | 6 (1500 m each) | - |
| Maximum trolley weight (without battery pack) | 25 | [kg] |
| Maximum battery pack Weight | 10 | [kg] |
| Payload | 50 | [kg] |
| Maximum mission time | 10 | [min] |
| Temperature working conditions | −20 ÷ 50 | [°C] |
| Parameter | Value | Unit of Measure |
|---|---|---|
| Proportional gain | 0.0747 | [Nm/(rad/s)] |
| Integral gain | 0.0023 | [Nm] |
| Tested Parameters | Value | Unit of Measure |
|---|---|---|
| Motor max torque | 1 (software limit) | [Nm] |
| Motor max speed | 4500 (voltage limit) | [rpm] |
| Communication delay | 10 | [ms] |
| BMS limits | OK | - |
| Inverter limits | OK | - |
| Control logic | OK | - |
| Measurements | OK | - |
| Parameter | Original Value | Fitted Value | Unit of Measure |
|---|---|---|---|
| Rolling resistance | 0.018 | 0.054 | [Adim] |
| Gearbox efficiency | 0.9 | 0.8 | [Adim] |
Disclaimer/Publisher’s Note: The statements, opinions and data contained in all publications are solely those of the individual author(s) and contributor(s) and not of MDPI and/or the editor(s). MDPI and/or the editor(s) disclaim responsibility for any injury to people or property resulting from any ideas, methods, instructions or products referred to in the content. |
© 2024 by the authors. Licensee MDPI, Basel, Switzerland. This article is an open access article distributed under the terms and conditions of the Creative Commons Attribution (CC BY) license (https://creativecommons.org/licenses/by/4.0/).
Share and Cite
Bianco, E.; Giannuzzi, C.; Corredor Pablos, A.F.; Peña Reyes, V.A.; Berti Polato, D. Electric Trolley Prototype for Goods and People Transport on Ziplines. World Electr. Veh. J. 2024, 15, 100. https://doi.org/10.3390/wevj15030100
Bianco E, Giannuzzi C, Corredor Pablos AF, Peña Reyes VA, Berti Polato D. Electric Trolley Prototype for Goods and People Transport on Ziplines. World Electric Vehicle Journal. 2024; 15(3):100. https://doi.org/10.3390/wevj15030100
Chicago/Turabian StyleBianco, Ettore, Claudio Giannuzzi, Andrés Felipe Corredor Pablos, Vicente Alfredo Peña Reyes, and Davide Berti Polato. 2024. "Electric Trolley Prototype for Goods and People Transport on Ziplines" World Electric Vehicle Journal 15, no. 3: 100. https://doi.org/10.3390/wevj15030100