1. Introduction
Compared with traditional fuel vehicles (FVs), which have low power, high emissions, susceptibility to malfunctions, and high fuel consumption, new energy vehicles (NEVs) have more potential benefits and are considered as the future alternative to alleviate global greenhouse gas emissions [
1,
2,
3]. However, there exist a couple of critical obstacles to overcome before NEVs will be used on a mass scale. Perhaps the most significant challenge stems from the nature of recharging. Whereas fuel vehicles (FVs) can be easily refueled at accessible gas stations in a matter of minutes, NEVs require specific equipment and a significant amount of time (hours) to be recharged [
4]. The shorter cruise range of NEVs than that of fuel vehicles (FVs), which necessitates more frequent recharges than gasoline refuels, only makes this problem worse. Whereas it is normal to park the NEVs at a workplace or home for a few hours or overnight, it is impractical to station the car for a recharge in the middle of a long trip [
5,
6].
Battery swapping mode (SM) can effectively solve the aforementioned problem [
7,
8]. In this mode, NEV makers (or battery-swapping service providers) deploy the network of swapping stations where NEV users may exchange their depleted batteries for full ones in the middle of long trips. The depleted batteries are then recharged at the stations and later swapped for depleted batteries on other arriving NEVs. This solution allows NEVs to be effectively “refueled” in only one to two minutes instead of hours [
7]. Different from the conventional charging mode (CM), SM is somewhat analogous to cell phone service providers. It builds and operates the infrastructure system (i.e., battery-swapping stations) and provides a service (“refueling” NEVs). Because batteries can be swapped, they are not owned by the NEV users themselves but rather leased to them based on service contracts. Users will be charged based on usage (i.e., miles driven), much like cell phone users being billed based on talk time.
This arrangement poses several potential benefits. It decouples ownership of the battery and the NEV, two items with different life cycles, and makes it very easy to take advantage of future improvements in battery technology through regular battery replacements, compared with other solutions that bundle the NEV and battery as one single unit [
9]. Most importantly, the significantly lower upfront cost for the user to purchase a new NEV (the battery typically costs around
$10,000) can help boost adoption rates. Second, swapping mode can effectively lower the risk of battery damage in the fast-direct charging mode. It is estimated that the frequently adopted fast direct charging for NEVs shortens the life of the battery by approximately 20% due to the strong electric flows. Third, swapping mode can be utilized to recharge at night rather than during the day, which dramatically reduces electricity fees, balances the power load, and decreases the difference between the peak and valley loads on the power grid side. In addition, swapping mode could be helpful in implementing the life-cycle management of the battery. The average battery life span is approximately 8 years due to degradation in capacity. Unlike fuel vehicles, NEVs cannot use their power batteries until they reach the end of their life cycle. Instead, the power batteries must be removed when their capacities fall to around 70–80% due to performance and safety concerns, and yet they can be reused in other fields including energy storage for wind and solar power, thus in turn cutting down on operational costs.
Although SM displays remarkable merits, some problems, particularly the insufficient number of swapping stations, hamper the shape of an efficient supply network to service consumers. Meanwhile, CM still dominates in the NEV market and NEV-CM makers (i.e., new energy vehicle manufacturers using the charging mode) usually implement various strategies including extended warranty services to counteract NEV-SM manufacturers (i.e., new energy vehicle manufacturers using the swapping mode). Spurred by these practices, we address three questions in this paper: (1) What is the condition in which both NEV-SM makers and NEV-CM makers can be in equilibrium? (2) In a duopolistic market, is the competitive advantage a NEV-SM manufacturer possesses over its rivals influenced by an extended battery warranty service? (3) Which demand differences occur between the NEV-SM maker and the NEV-CM maker under the government subsidy? How does the government subsidy affect consumer surplus and social welfare at different development stages of the swapping network?
To handle the aforementioned problems, we present our theoretical models under a base model with and without an extended warranty service, and then we extend the model to incorporate government subsidies. The main academic contributions of this paper are threefold: (1) Different from prior work, we examine the impact of battery swapping mode (SM) in a competitive environment, where two NEV makers adopt different types of recharge (i.e., swapping mode and charging mode), rather than studying it on its own; (2) we employ the critical factor of an extended battery warranty service to investigate the optimal pricing for both NEV makers, which has seldom been addressed before; (3) piecewise government subsidies are taken into account to analyze the difference in optimal outcomes.
The remainder of this paper proceeds as follows.
Section 2 reviews the most relevant literature. In
Section 3, we present our theoretical models and the corresponding results. Subsequently, a numerical study and sensitivity analysis are conducted in
Section 4.
Section 5 provides concluding remarks and the direction of future research. All proofs are offered in
Appendix A.
3. Theoretical Models
We study a duopolistic market where two NEV manufacturers exist, namely a NEV-SM manufacturer and a NEV-CM manufacturers. The NEV-SM manufacturer produces and sells NEVs with the adoption of the battery swapping mode, whereas the NEV-CM counterpart makes NEVs with the charging mode. Two NEV products are sold to consumers, priced and , respectively. Considering that the NEV-CM manufacturer will bundle the NEV and the battery into a package to sell to consumers, and that a consumer who prefers NEV-SM products will buy only the NEV and rent the power battery, it is reasonable to let < .
With two different ways of trans-shipping power to NEVs (i.e., SM and CM), heterogeneous consumers’ purchase behaviors are independent and separated. We assume that consumers are heterogeneous in product valuation. Similar to the previous study, the product valuation is represented by
v, which is uniformly distributed over
. It means that when consumers buy vehicles, they consider various factors such as price, appearance, convenience, and warranty period, among others. Compared to CM, SM can bring convenience to consumers in terms of initial cost and recharging time. In parallel, consumers will also consider whether the number of battery-swapping stations
m is sufficient to meet their travel requirements after buying NEVs with the swapping mode. In reality, it is true that the current swapping network is at the infant stage, which hinders the wide use of NEV-SM products to a degree. The main notations used in this paper are summarized in the
Appendix A (
Table A1).
Therefore, one prospective consumer may have three options to choose from: (1) purchase a NEV with SM, (2) purchase a NEV with CM, and (3) buy nothing. Referencing the literature [
5], the three utilities of consumers are formulated as follows:
Equation (1) indicates that consumers’ utility function of the NEV-SM is related to the valuation
of the number of battery swapping station
and price
.
is denoted by the battery swapping stations’ convenience coefficient. Equation (2) shows that the utility function of the NEV-CM depends on
,
, and
, which is the valuation incremental rate of CM relative to SM. It is easy to know that consumers’ utility
and
and when
, consumers are willing to purchase a NEV-SM rather than a NEV-CM; otherwise, when
, consumers prefer a NEV-CM instead of a NEV-SM, hence we have
Due to the fact that consumers are heterogeneous in product valuation,
is uniformly distributed over
. Equation (4) yields the decoupling point between purchasing a NEV-SM and purchasing a NEV-CM. We can denote this point by
, which is represented by
. Therefore, it is easy to derive the demand function regarding NEV-SM and NEV-CM, respectively.
3.1. Base Model
In this subsection, we take into account the scenario where the NEV-CM maker does not leverage an extended warranty service to compete with the NEV-SM maker in the NEV market.
Building the swapping infrastructure requires the NEV-SM manufacturer to invest in fix costs. The fixed cost is closely related with the number of battery-swapping stations
m. Based on the literature [
22], the costs of the battery-swapping station can be presented in a quadratic form,
, where
is the cost coefficient of the battery-swapping station. Additionally, supposing that the two firms produce NEVs with the same production cost structure,
.
The profits of the NEV-SM manufacturer and the NEV-CM manufacturer are expressed as follows:
Note that, the first term of Formula (6) represents the sales revenue from NEV-SM, and the second term denotes the fixed cost of building battery-swapping stations. Formula (7) represents the profit from NEV-CM. Putting together Equations (4)–(7), we obtain
The NEV-SM manufacturer and the NEV-CM manufacturer determine their own optimal selling prices with the aim of maximizing his own profit, using the backward induction to solve Formulas (9) and (10).
Proposition 1. Under the swapping mode vs. the charging mode, if holds on, the equilibrium outcomes are , , , Lemma 1. Only when the inequality holds are the optimal solutions in the base model achieved; whereas if is satisfied, the optimal solutions do not exist even though the equilibrium outcomes can be obtained.
Lemma 1 shows the current situation where the CM mode dominates in the NEV market and yet the SM mode is still in its infancy. Only when exceeds a certain threshold value () will consumers perceive the price of SM-NEVs to be less than that of CM-NEVs (i.e., < ), attracting consumers to purchase a NEV-SM. This is consistent with reality. In this regard, both the NEV-CM manufacturer and the NEV-SM manufacturer obtain optimal profits under the swapping mode vs. the charging mode.
Theorem 1. Only when is satisfied can the NEV-SM manufacturer keep their price lower than that of their rival NEV-CM maker; however, the NEV-CM manufacturer always outperforms the NEV-SM manufacturer in term of market demand and profit, i.e., .
Theorem 1 indicates that, at the initial development stage of NEV-SM, the NEV-SM manufacturer adopts the low-price strategy with aims to tap into the market and attract potential consumers. However, this move is not a long-term solution due to the fact that the NEV-CM maker invariably occupies more market share and obtains greater profits in the NEV market. With the decrease in , i.e., the valuation change rate of the CM relative to the SM, the NEV-SM maker will improve their position as consumers gradually realize the NEV-SM’s advantages over that of the NEV-CM. This is why NIO Motors, one of the leading NEV-SM manufacturers, is convincing more and more customers to choose the SM mode in China.
Corollary 1. Under the swapping mode vs. the charging mode, when , .
Corollary 1 shows that, when , decreases in , but increases with . The result is intuitive because the parameter of represents the construction cost per swapping station, therefore the increase in will inevitably lead to a reduction in profit for the NEV-SM manufacturer. Likewise, the increase in means consumers’ perception of usage of NEV-SM products has improved, thus driving people to purchase it and increasing the NEV-SM manufacturer’s profitability. It reminds managers of the important role of the convenience of the swapping network in practice. In other words, the NEV-SM manufacturer should not only endeavor to expand the network infrastructure, but emphasize the location of swapping stations as well.
3.2. Model with Extended Warranty Service
Under this model, as the NEV-SM manufacturer leases batteries to consumers rather than selling them bundled with vehicles, consumers’ purchase costs are significantly lowered along with the subsequent battery maintenance fees. To counteract their rival’s merit, the NEV-CM manufacturers are consolidating their dominant market position by providing consumers with an after-sales service for batteries, namely an extended warranty service, in an attempt to overcome their short broad. For instance,
WeltMeister, as another leading Chinese NEV-CM manufacturer, launched the nationwide battery extended warranty service in 2018, thus leading to peers’ follow-up, including
BYD and
Xpeng Motors. With the extended warranty service, we define
T as the duration of the extended warranty service, and
k represents the extended warranty service coefficient. Similar to the base model, the consumer utility regarding NEV-CM in the setting of an extended warranty service policy is formulated as:
While the consumer utility regarding NEV-SM remains unchanged, following the same reasoning as before, we derive the demand functions of NEV-SM and NEV-CM, respectively.
Thus, the profit functions of NEV-SM and NEV-CM under the extended warranty service are expressed as below,
Obviously, the first term of Formula (12) entails the sales revenue from NEV-CM, and the second term denotes the NEV-CM manufacturer incurring the cost of the extended warranty service , where is the cost coefficient of the extended warranty service. We can obtain the optimal decisions and the two firms’ profit by finding the first order derivative of Formulas (14) and (15).
Proposition 2. Under the extended warranty service, if or hold on, the equilibrium outcomes are Theorem 2. In the setting of the extended warranty service,
- (i)
When
hold on, the NEV-SM maker’s profit is more advantageous that the NEV-CM maker’s, whereas the NEV-SM maker possesses less market share than its rival. (i.e.,
);
- (ii)
When
hold on, the NEV-CM maker is more competitive than the NEV-SM maker (i.e.,
).
Theorem 2 displays that the consumers’ choice of two modes relies on two critical factors, namely , where denotes the ratio of the swapping station’s convenience coefficient to the extended warranty service coefficient. When the coefficient ratio does not surpass a specific threshold value , and the valuation incremental rate of CM relative to SM is at a high level, although the NEV-SM maker’s demand is less than that of its competitor, its profit still surpasses the NEV-CM maker’s. On the other hand, when the valuation incremental rate of CM relative to SM remain at a relatively high level but the coefficient ratio is above a specific threshold value , the NEV-CM maker dominates the market in terms of demand and profit. The results imply that regardless of or , the NEV-CM is more appealing to consumers from the demand perspective. Additionally, when , the inequality ensures that the price of the NEV-SM product is less than that of the NEV-CM one, yet the NEV-SM maker’s payoff is larger than its rival due to the cost of the extended warranty service. In contrast, given the inequality guarantees that the price of the NEV-SM product is less than that of the NEV-CM one. Therefore, the NEV-CM maker’s profit is larger than that of its rival due to the higher value of . It implies that even if the extended warranty service temporarily has a negative impact on the NEV-CM maker’s performance due to initial investment, its market dominance is indeed enhanced further.
Corollary 2. In the setting of the extended warranty service,
- (i)
When
, both
and
increase with
;
- (ii)
When , increases with ; while decreases with .
Corollary 2 exhibits the monotonicity of in the setting of the extended warranty service. The outcomes indicate that, regardless of what conditions are, the increase in the number of swapping station () will enhance the perceived convenience of the swapping mode (), which is consistent with reality. However, for the duration of the extended warranty service (), the impact of shows differences. When , has a positive influence on , meaning that the NEV-SM maker improves the convenience of the swapping mode (), triggering its rival to expand the extended warranty service duration () for batteries with an aim of avoiding the loss of customers. However, when , the increase in will make the NEV-CM maker shorten the extended warranty service duration (). The rationale of this result is that, from Theorem 2, when , the NEV-CM maker’s profit is lower than that of its competitors, thus leading to his aggressive response to the NEV-SM manufacturer’s move, whereas when , the NEV-CM maker dominates the NEV market in terms of demand and profit, and the shortening of the extended warranty service duration () may suitable for more perspective consumers’ needs.
4. The Impact of the Subsidy Policy
From the above analysis, to effectively compete with the NEV-CM maker, the NEV-SM maker should improve their swapping network to enhance the convenience of replacing batteries, hence requiring an increase in the number of swapping stations, which in turn relies on investment from two sources, one of which is government subsidies. In this section, we further analyze the impact of the government subsidy policy on the selection of two different modes. Although the government has gradually cut down the amounts of NEV subsidies until monetary aid will be completely abolished, the subsidies for the construction of swapping stations still remain unchanged as the NEV-SM makers are unable to afford to invest in swapping infrastructure deployment alone at the initial stage of promoting the SM. To speed up the sitting-and-sizing process of swapping stations, governments usually provide financial subsidies to encourage NEV-SM makers to perfect their swapping network. In this regard, we assume subsidies are allocated to the NEV-SM maker, rather than to the NEV-CM maker.
The common practice is that the subsidy size relies on the number of power-swapping stations built. In addition, when the swapping network starts to take shape, the subsidy amount will somewhat reduce accordingly. Thus, the government’s subsidy represents a piecewise function as below,
where
represents the minimal number of swapping stations below which point, i.e.,
, the NEV-SM maker can obtain
subsidies per station, while
stands for the maximum number of swapping stations above which point the subsidy size per station will decrease to
b from
a (
), i.e.,
. To this end,
,
, it means that the swapping network construction is at the preliminary stage (I), while when
,
, it signals that swapping deployment has nearly completed, referring to the mature stage (II).
Therefore, in two different stages (I and II), the profit functions of the NEV-SM maker under the base model (without the extended warranty service) are formulated, respectively,
and the profit functions of the NEV-SM maker under the extended warranty service model in two different stages (I and II) are shown,
For the NEV-CM maker, its profit functions remain unchanged. Using a similar method as before, the optimal solutions with/without the extended warranty service are obtained, and the results are shown in the
Appendix A (
Table A2).
Lemma 2. Without the extended warranty service,
When a holds on, the optimal price and demand of the NEV-SM maker at stage II are lower than at stage I (i.e., ). When b holds on, we find the optimal price and demand of the NEV-SM maker’s rival at stage II are larger than at stage I (i.e., ).
Lemma 2 exhibits that, in the absence of an extended warranty service, when the subsidy standards a and b are below a specific threshold value (i.e., ), both the demand and price for the NEV-SM maker at stage I are larger than those at stage II, whereas for the NEV-CM maker, the outcome is the opposite, which shows that government subsidies have little effect on the NEV-SM maker at stage II if the government’s subsidy size reduces slightly. With this in mind, the government should still offer subsidies of sufficient size to support the NEV-SM makers at stage II, avoiding investment inefficiency.
Lemma 3. With the extended warranty service,
- (i)
When
or
is satisfied, for the NEV-SM maker, the optimal price and demand at the preliminary stage I is higher than at the mature stage II (i.e.,,
);
- (ii)
When
or
hold on, for the NEV-SM maker, the optimal price and demand at the mature stage II is larger than at the preliminary stage I (i.e.,
).
Lemma 3 reveals that even if extended warranty services are introduced by the NEV-CM maker, at stage II, government subsidies can help the NEV-CM manufacturer improve its position compared to at stage I. However, for the NEV-SM maker, at the initial stage of the subsidy, the optimal price is maintained at a lower level, and its market share is larger than its rival, which verifies that government subsidies to the NEV-SM maker play a significant role at stage I when the NEV-CM maker provides the extended warranty services.
Corollary 3. At stage I (or II),
- (i)
When (for stage II, ) is satisfied, the NEV-SM maker’s optimal price and demand in the presence of a subsidy at stage I (II) are higher than those in the absence of a subsidy, i.e., (); while for the NEV-CM maker, the optimal price and demand in the presence of a subsidy at stage I (II) are lower than those in the absence of a subsidy, i.e., ().
- (ii)
When or (for stage II, or ) holds on, the NEV-SM maker’s optimal price and demand in the presence of a subsidy at stage I (II) are lower than those in the absence of a subsidy, i.e., (); while for the NEV-CM maker, the optimal price, the duration of the extended warranty service, and demand in the presence of a subsidy at stage I (II) are higher than those in the absence of a subsidy, i.e., ().
Corollary 3 (i) illustrates that when surpasses a specific value, the government subsidy can help the NEV-SM maker to promote the swapping mode but thwart the wide adoption of the charging mode at both stages. Interestingly, even if the NEV-SM maker’s optimal price in the presence of the subsidy is higher than that in the absence of the subsidy, the demand still expands in the presence of the subsidy. Corollary 3 (ii) shows the opposite, that is when or , the government subsidy policy is beneficial to the NEV-CM maker rather than the NEV-SM maker, which reveals that such a policy is a two-edged sword, and reminds policymakers to trade-off between the swapping mode and the charging mode in the development of NEV.
5. Numerical Study
In this section, we further investigate the effect of battery swapping and charging modes on consumer surplus and social welfare in the setting of subsidies. We also examine the impact of key variables, including the swapping station′s convenience coefficient and the coefficient of the duration of the extended warranty service, on the production decision of the two NEV makers and consumers’ choice between the battery swapping and charging modes under different conditions (with/without the extended warranty service, with/without subsidies).
Based on the literature [
23] and actual data from
Nio Auto and
BAIC, we could set
λ as 0.7, the unit cost of the NEV-SM and NEV-CM as 1, the actual value of the products as 0.5, the service coefficient of the extended warranty service as 0.2 to 0.6, and then we assume the government subsidy under stage I and II as
a = 0.4 and
b = 0.1. As
Nio Auto officially announced that power-swapping technology can realize the rapid replacement of power batteries within 3 min, the battery-swapping station convenience coefficient ranges from 0.5 to 0.9. The other specific parameter values are shown in the
Appendix A (
Table A3).
5.1. The Impact on Consumer Surplus and Social Welfare
In this sub-section, we examine the effect of two key exogenous variables (i.e.,
δ, k) on consumer surplus and social welfare under different conditions (with/without the extended warranty service, with/without subsidies). For a consumer with a NEV-SM or a NEV-CM, the surplus for stage I is as follows:
For social welfare, it consists of three facets: the profit from the NEV-SM maker and the NEV-CM maker, the government subsidy, and the consumers’ surplus, thus social welfare for stage I can be described as follows:
Similar to Formulas (21) and (22), we can obtain the corresponding consumer surplus and social welfare under other different conditions. For brevity, we have skipped it.
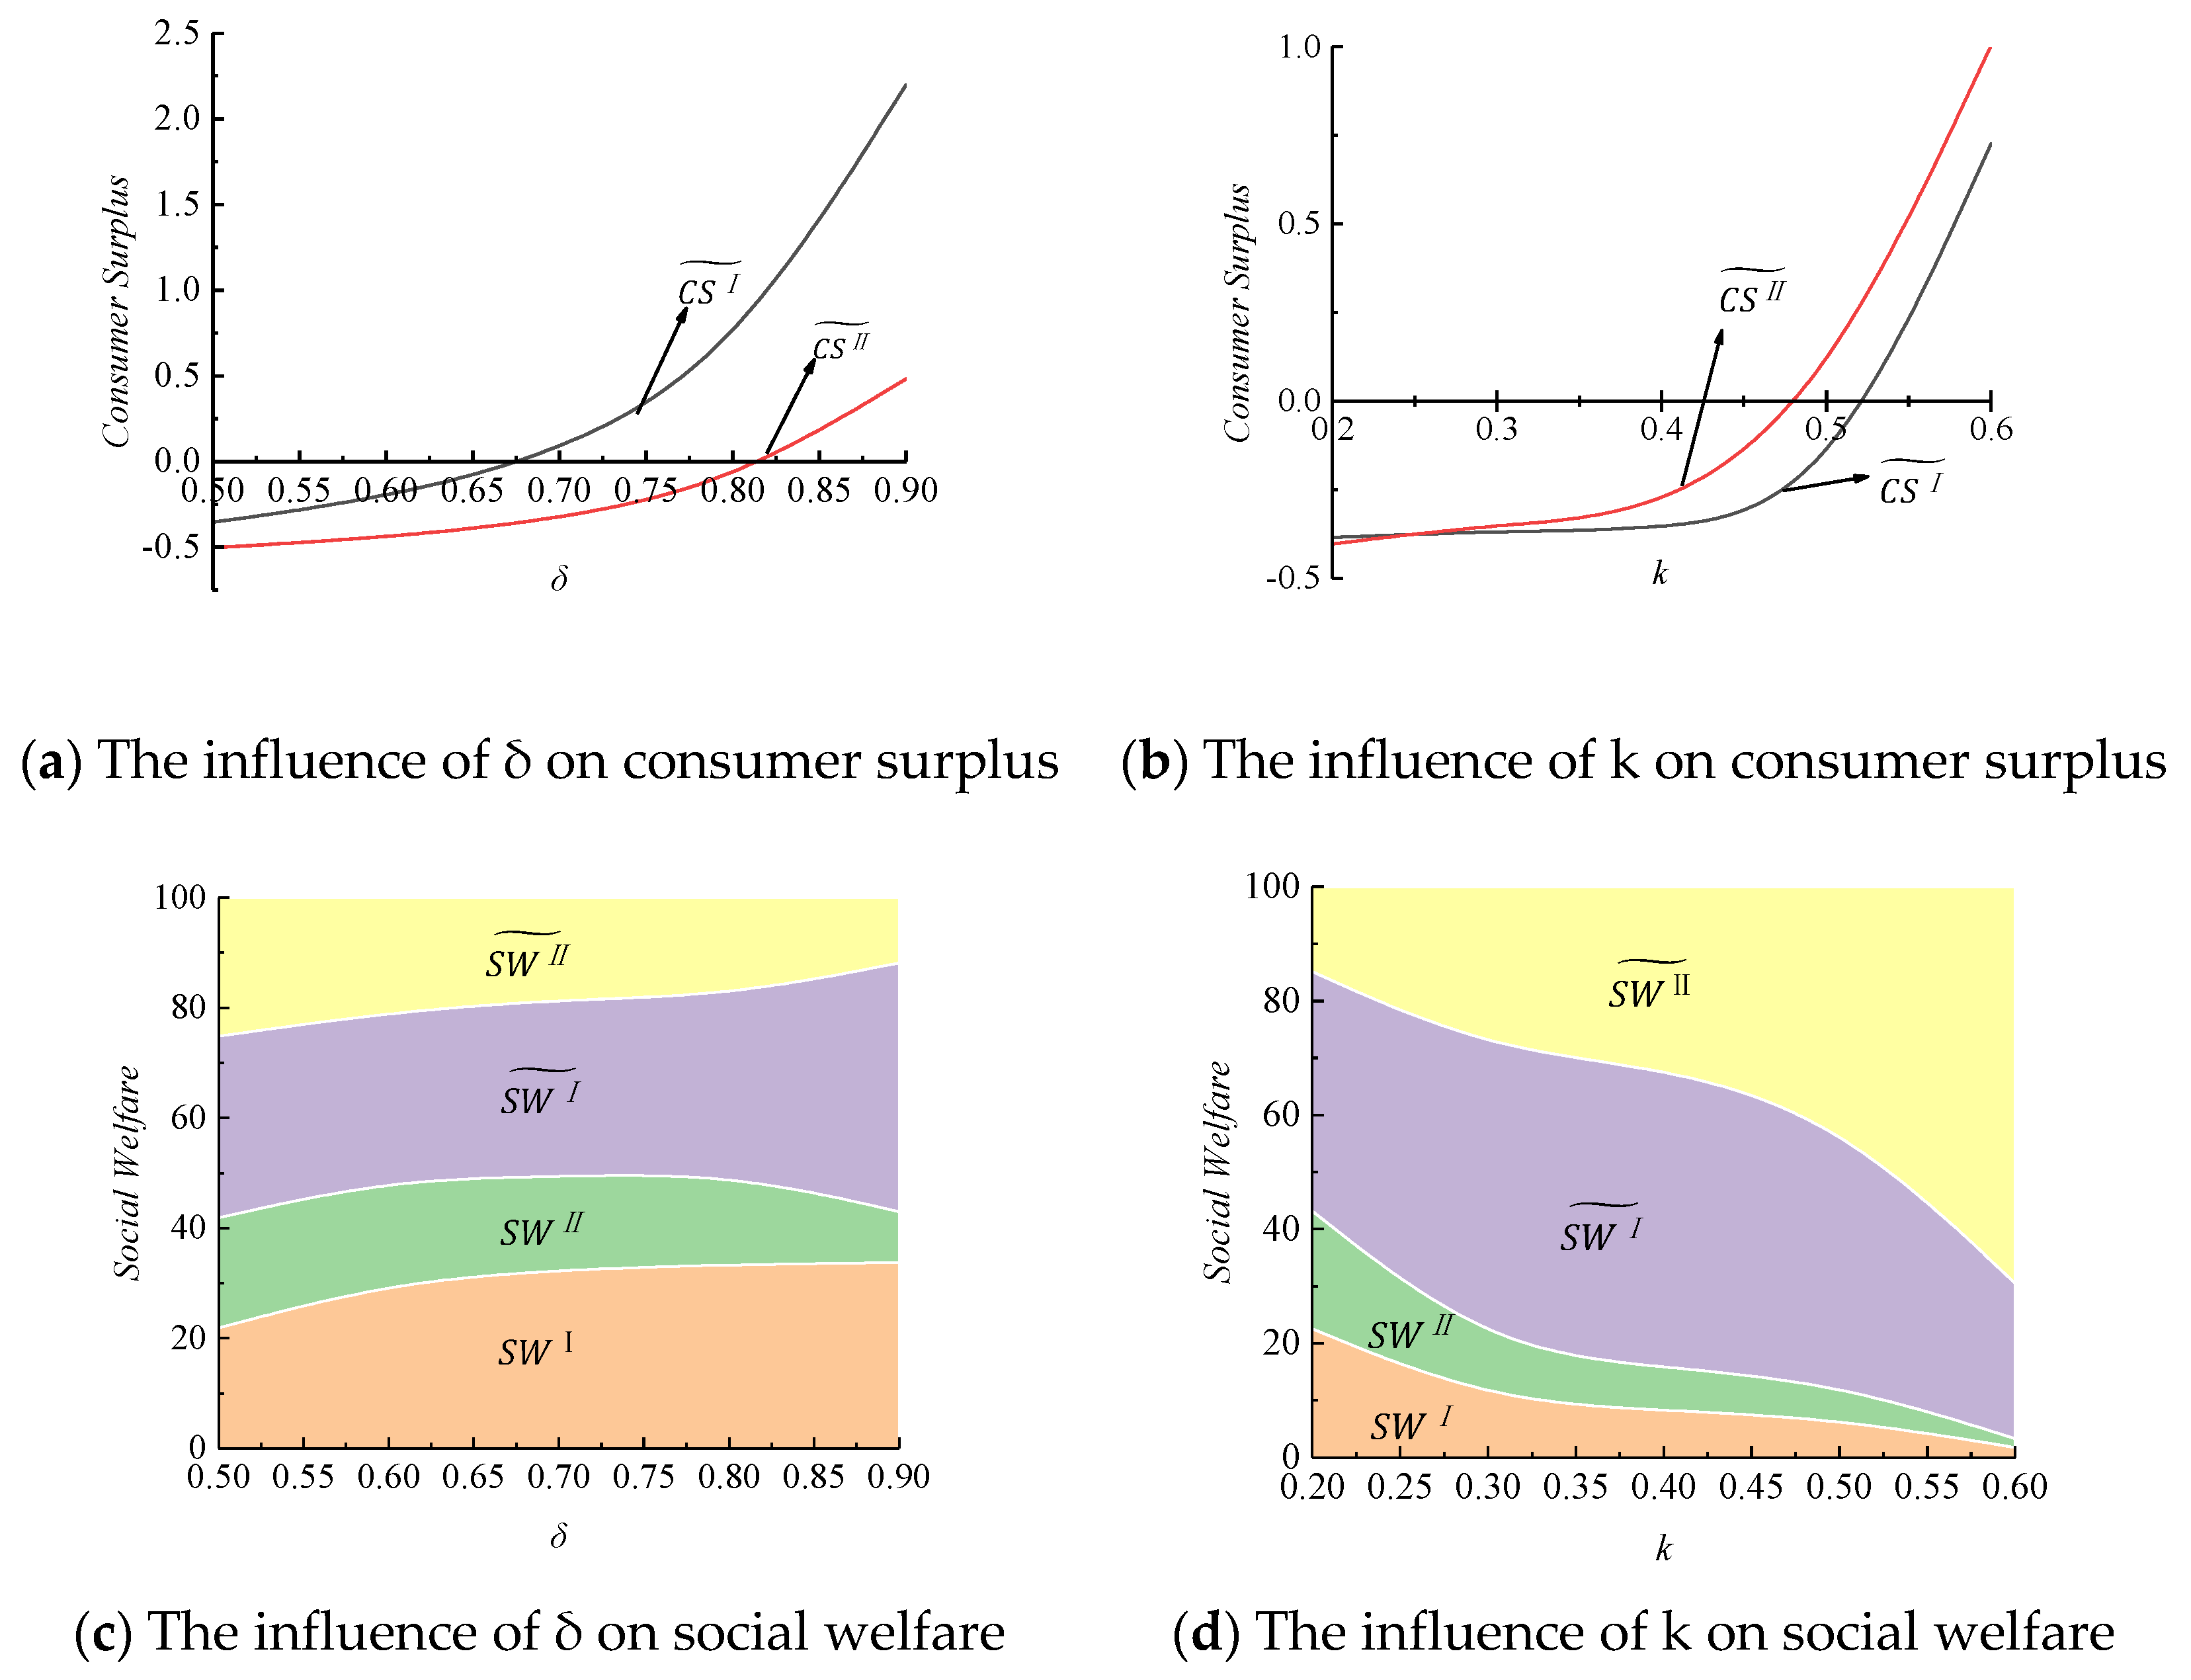
Figure 1a compares the effect of the convenience coefficient of swapping stations on consumer surplus at stages I and II under the extended warranty service. It reveals that there exists a threshold value (
), above which the consumer surplus at stage II is larger than zero, hence consumers intend to purchase. Otherwise, the consumer will give up. Meanwhile, it is obvious that the consumer surplus at stage I is greater than at stage II. This means that the higher the convenience of a power-swapping station, the higher the consumer surplus, and the less effective government subsidies are.
Figure 1b shows the effect of the extended warranty service coefficient on consumer surplus. With the increase in
k, the consumer surplus at stages I and II increase, this means that the higher the service level, the higher the consumer surplus at both stages. However, the consumer surplus at stage II is more than at stage I, which is the opposite of
Figure 1a.
Figure 1c,d demonstrates that the difference in social welfare at stages I and II with/without the extended warranty service under the influence of
δ and
k. We find that regardless of the change in
δ or
k, the social welfare at stage II with the extended warranty service is the largest, followed by that at stage I with the extended warranty service. The smallest social welfare is the case with neither the subsidy nor the extended warranty service.
5.2. The Impact on Performance
The numerical examples examine the single and joint effects of critical parameters on profits, respectively, in different conditions (with/without the extended warranty service, at stage I/II). To exclude the influence of external factors, other variables are taken to have a moderate value.
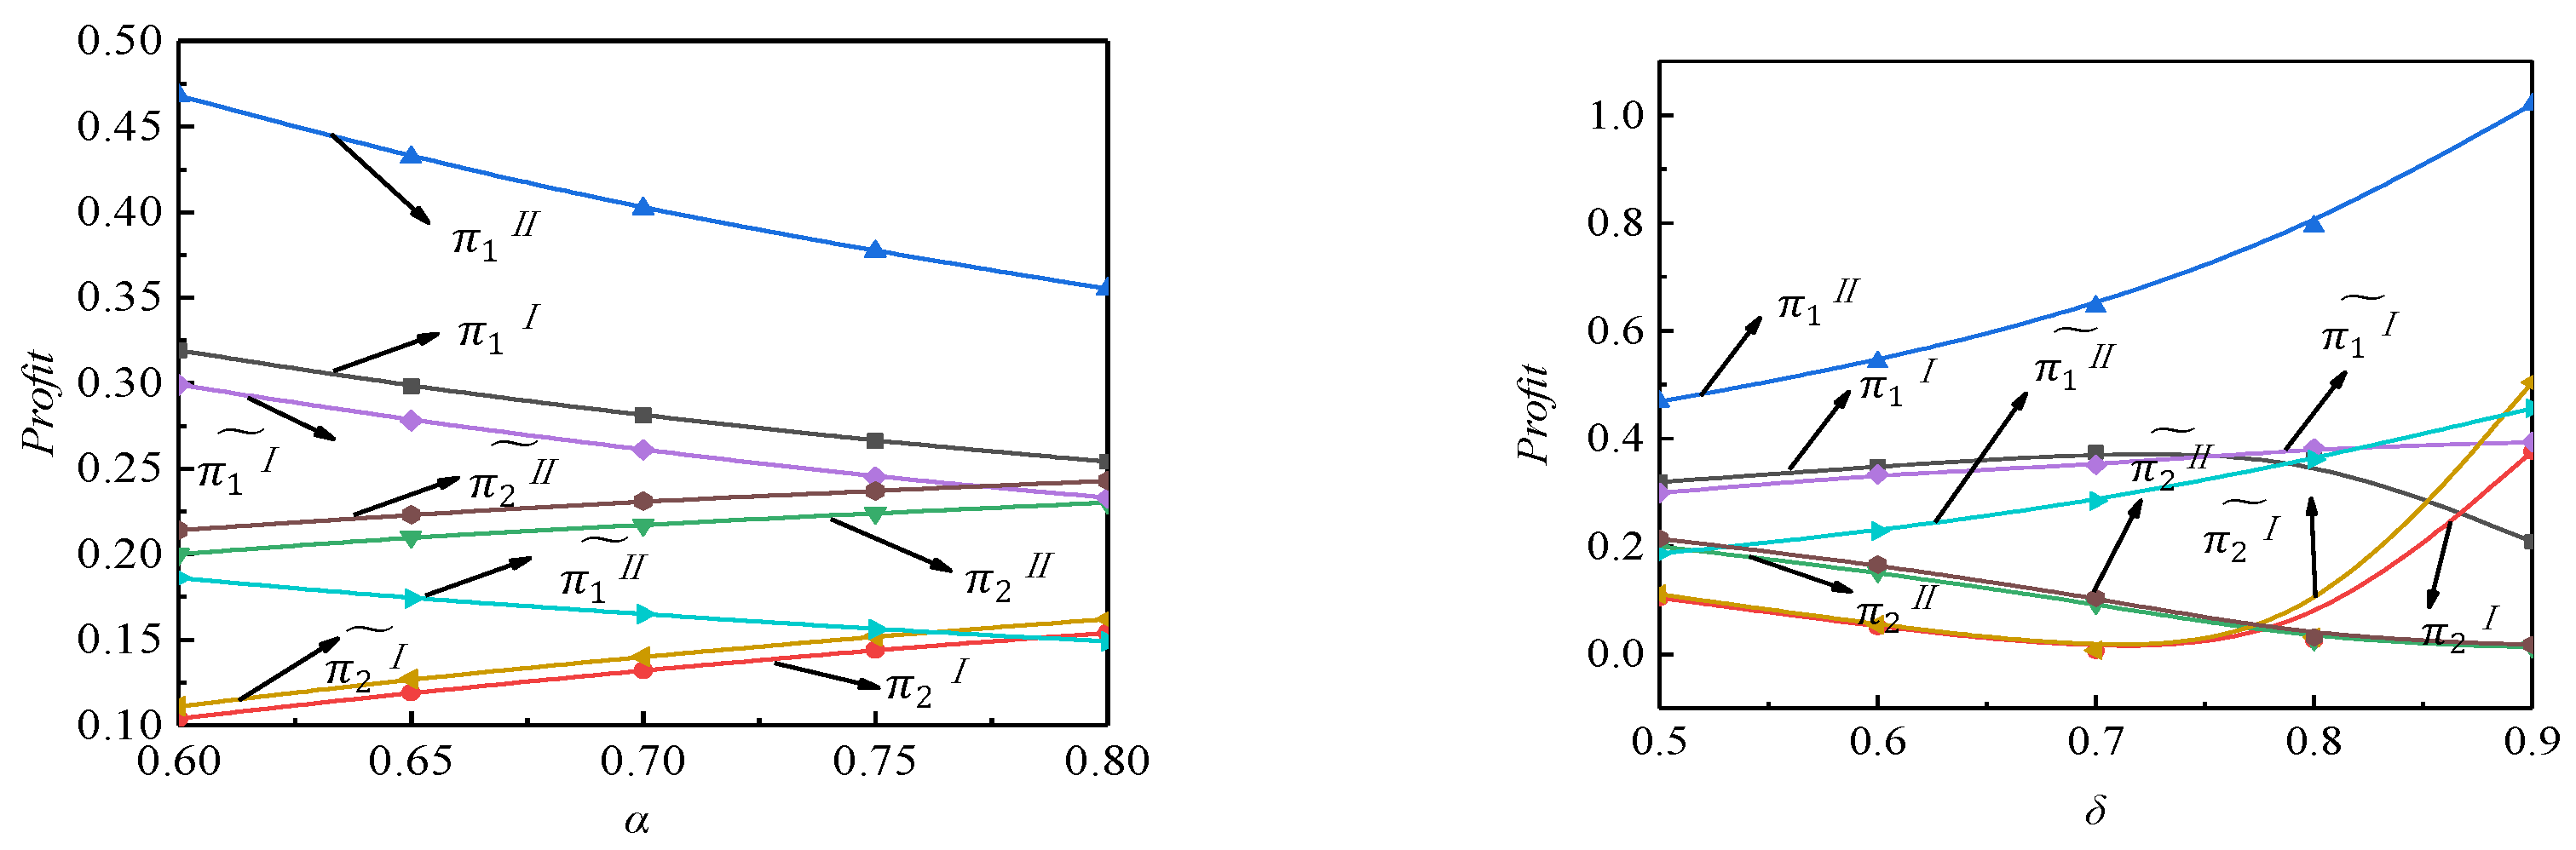
- (1)
The single effect of α andon profits
Figure 2a exhibits that no matter the condition, when the cost coefficient of the swapping station increases, the NEV-SM maker’s profit decreases, while the NEV-CM maker’s profit increases. Meanwhile, comparing the profits of the two makers, we find the profit of the NEV-SM maker is the largest when the NEV-CM maker does not provide the extended warranty service and the swapping network has taken shape, whereas the profit of the NEV-CM maker is the lowest when the NEV-CM maker does not provide the extended warranty service and the swapping network is at the initial stage.
Figure 2b shows that no matter the condition, the NEV-SM maker’s profit increases with
δ, while the NEV-CM maker’s profit drops with
δ. This means that the convenience of power swapping has brought considerable profit to the NEV-SM maker, and yet has the opposite effect on its competitor. From
Figure 2b, we also observe that the NEV-SM maker is most profitable when the NEV-CM maker does not provide the extended warranty service and the swapping network is at the maturity stage.
- (2)
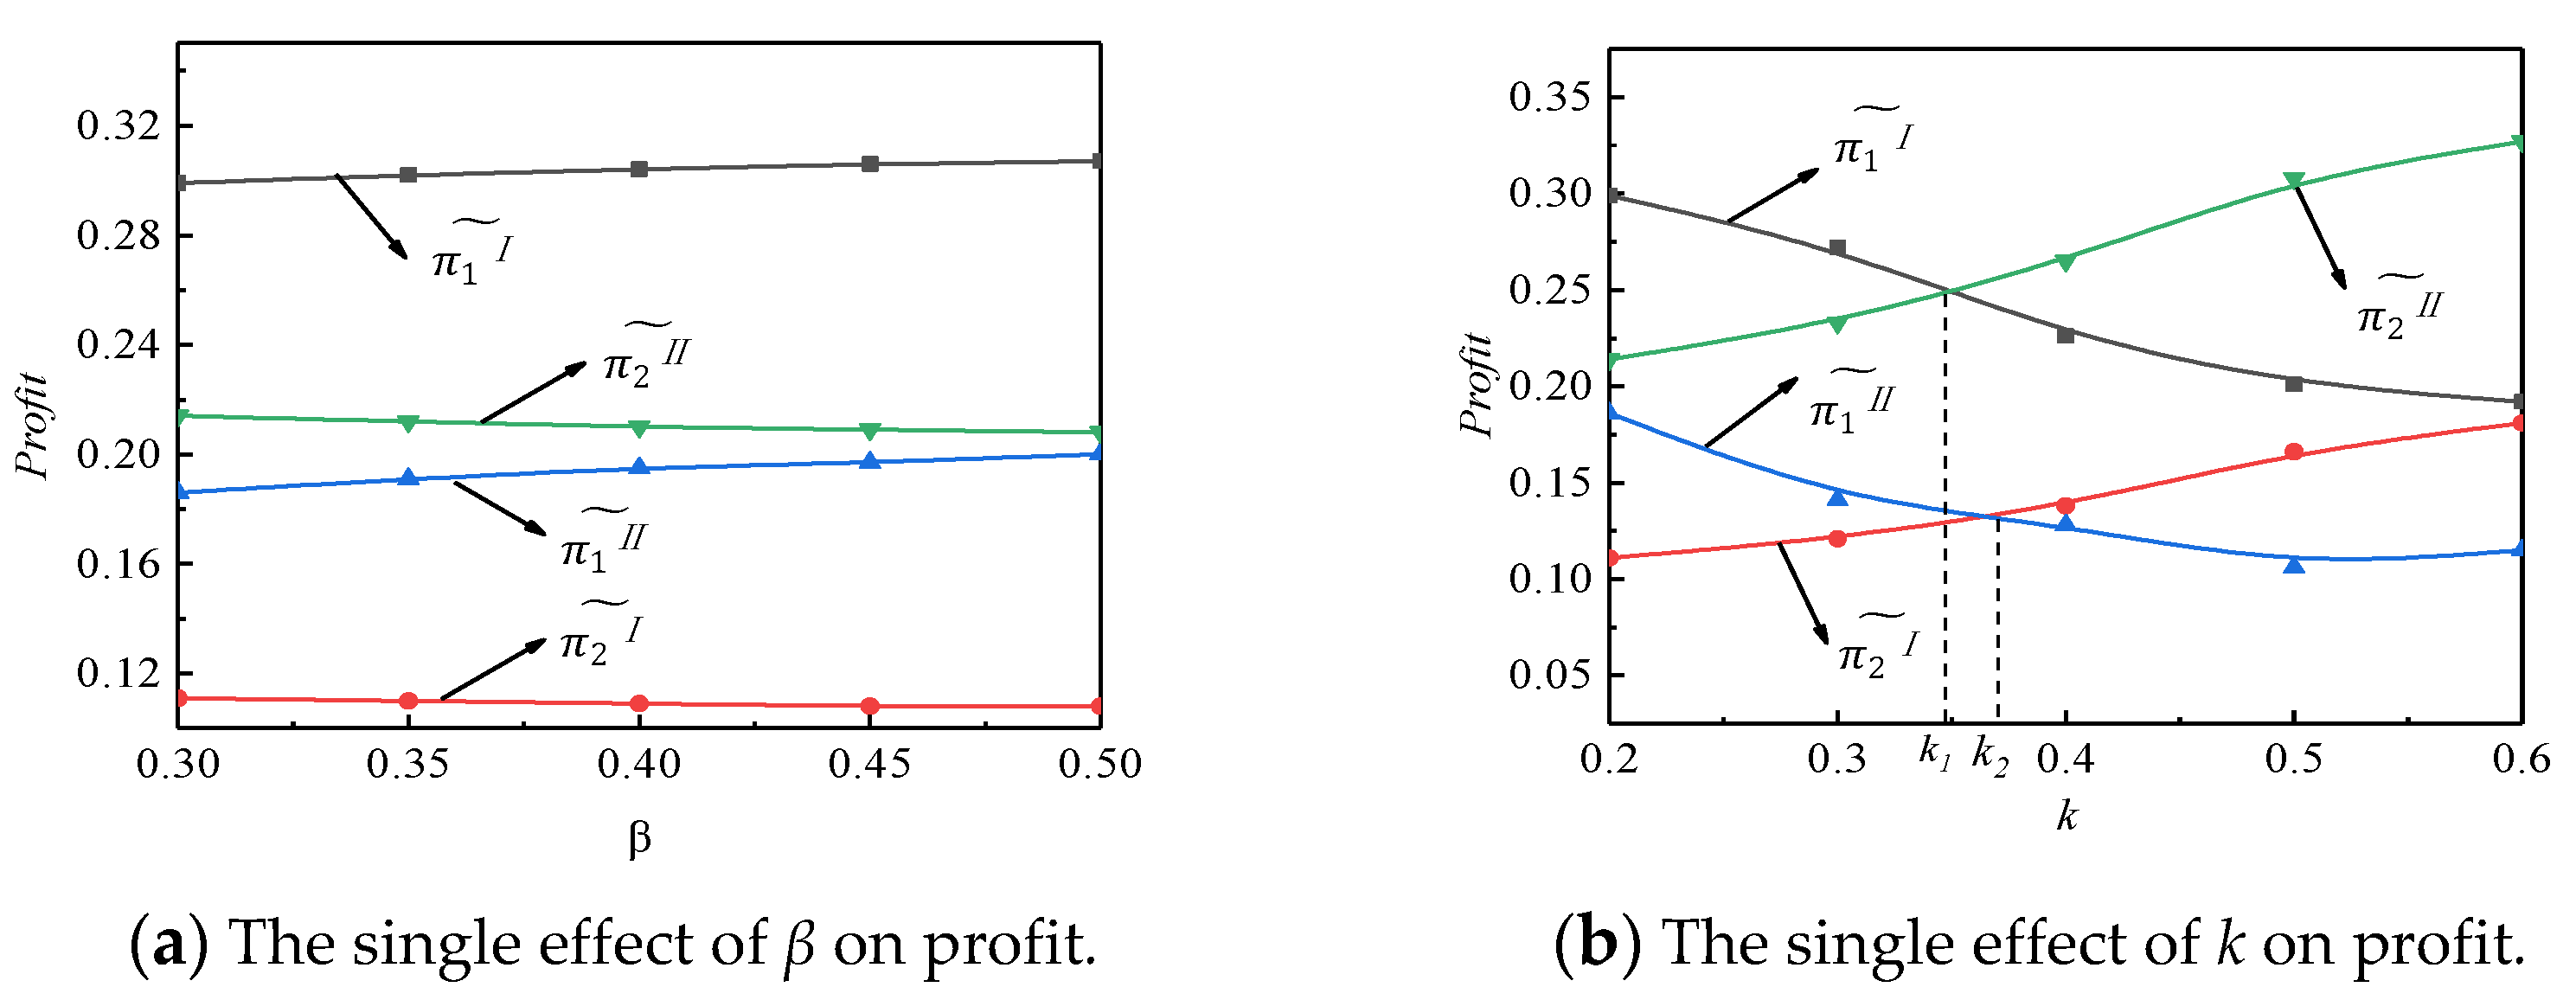
The single effect of β and k on profits
Figure 3a shows that in the setting of the warranty service and subsidy, the NEV-SM maker’s profit increases slightly, and yet the NEV-CM manufacturer’s profit decreases slightly with
β. Although the increase of the cost coefficient of the extended warranty service brings about the related change in the two manufacturers’ profits, such are not obvious, which means that the cost coefficient of the extended warranty service is not a sensitive factor for NEV makers.
Figure 3b displays that, in the setting of the warranty service and subsidy, the profit of the NEV-SM maker decreases with
k, whereas the profit of the NEV-CM maker increases with
k. It implies that the increase of the extended warranty service coefficient can enhance the NEV-CM maker′s profitability, which in turn impairs the NEV-SM maker’s performance. From
Figure 3b, there exists a specific value
k1, below which the lowest profit occurs to the NEV-CM maker in the case where the swapping network has taken shape; otherwise, it happens when the swapping network is at an infant stage. In contrast, there is another certain value
k2, above which the highest profit occurs to the NEV-SM maker in the case where the swapping network has taken shape; otherwise, it happens when the swapping network is at an initial stage.
- (3)
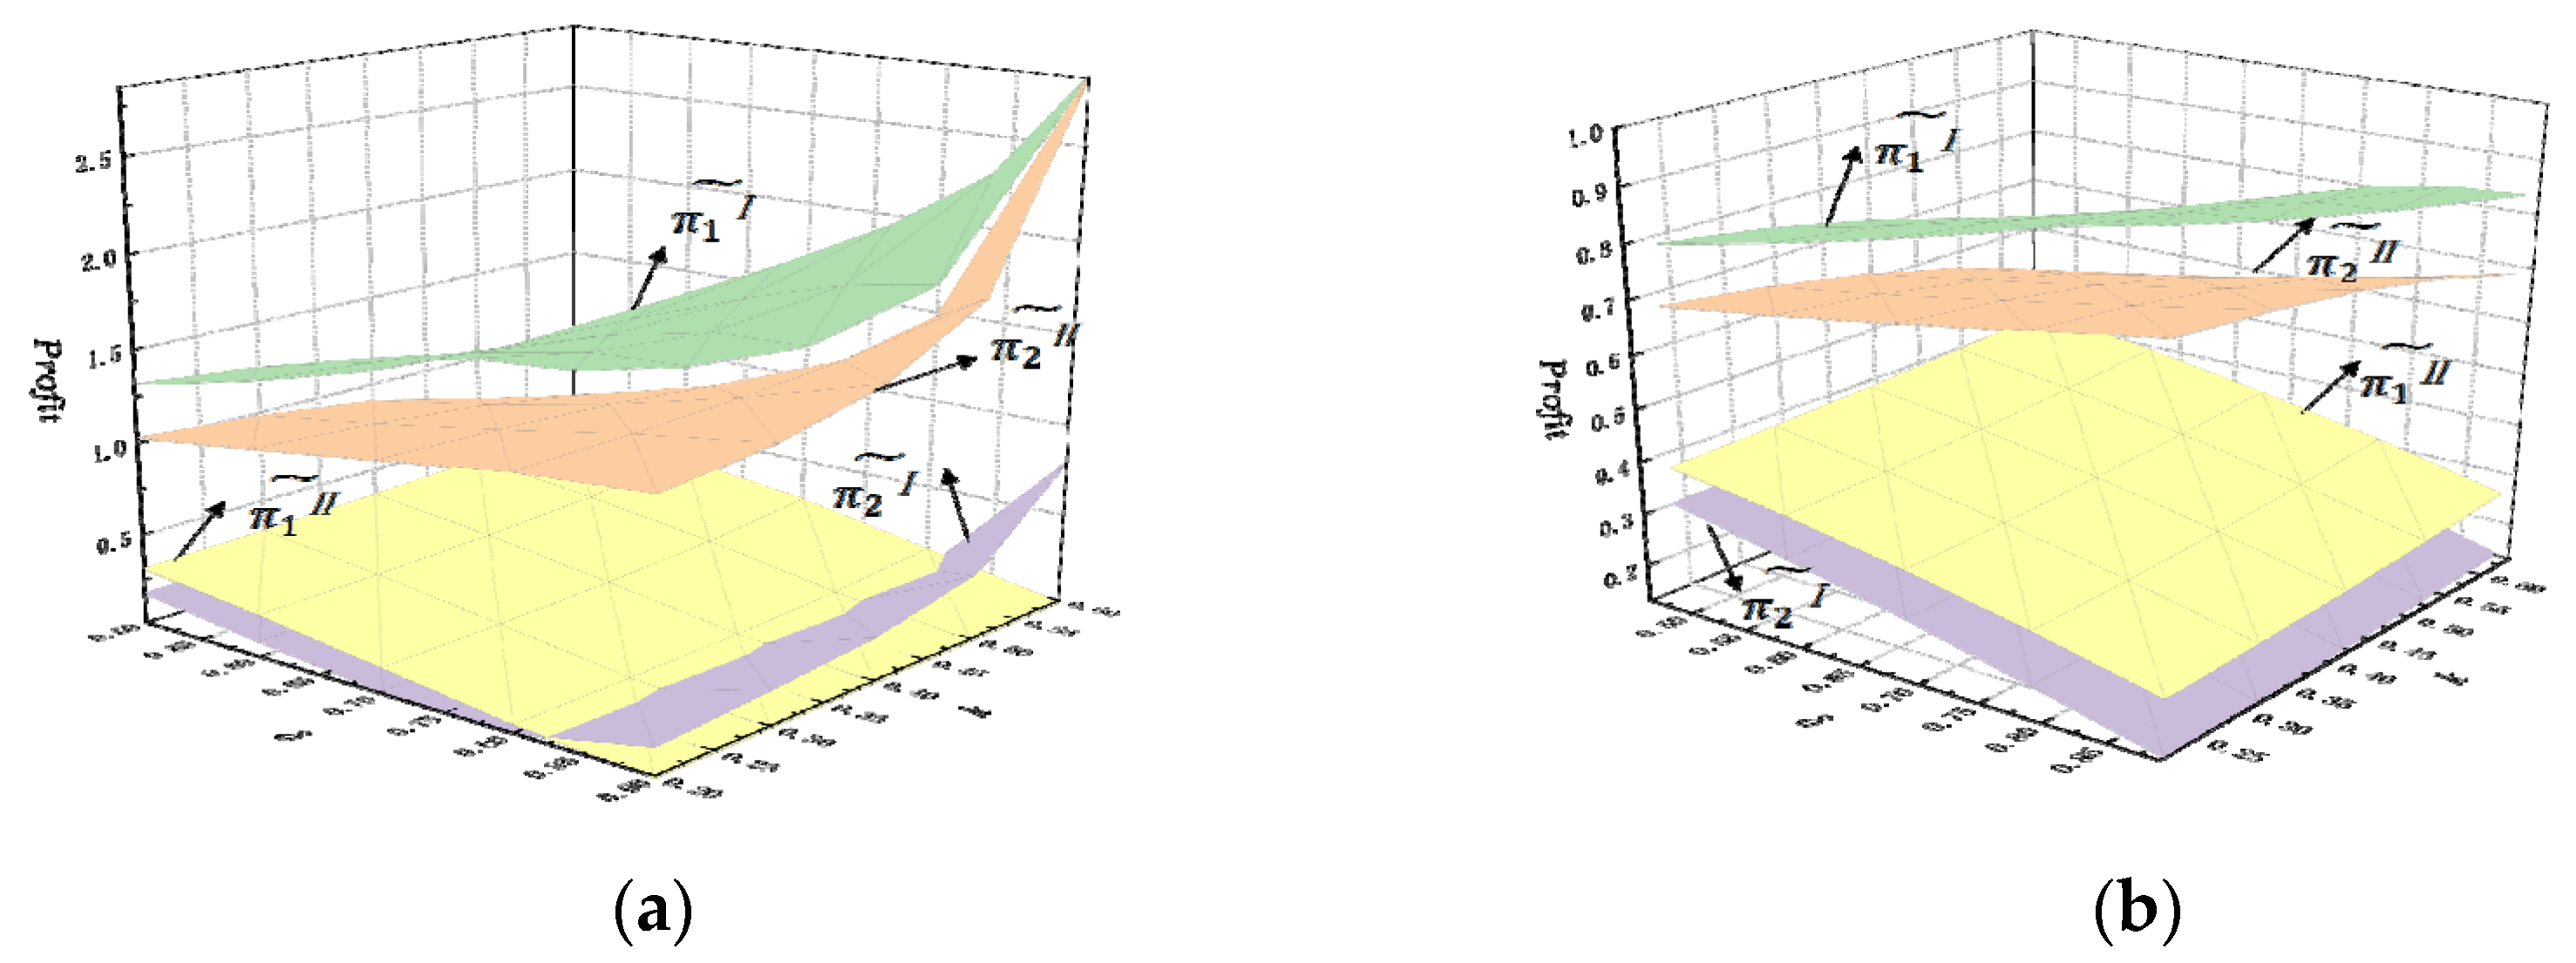
The joint effect on profits
In the previous analysis, we further explored the joint effects of and k on the profits of the two makers, with an extended warranty service in two stages, namely the preliminary stage (stage I) and the mature stage (stage II). Then, we set up two cases to examine the low (α/β = 3) and high (α/β = 1) marginal cost ratios.
Figure 4a shows the NEV-SM maker’s profit increases at stage I and yet decreases with
δ and
k at stage II, while the NEV-CM maker’s profit first decreases and then increases with
δ and
k at stage I, but continues to increase with
δ and
k at stage II. Overall, the NEV-SM maker’s profit at stage I is always higher than the NEV-CM maker’s profit at stage I or II.
Figure 4b demonstrates a similar pattern, the only difference being that when the marginal cost ratio is higher (α/β = 3), its impact on the NEV-SM maker and the NEV-CM maker is relatively larger. When the marginal cost ratio is relatively smaller (α/β = 1), the profit of both car manufacturers does not change much.
6. Conclusions
Due to the limited capacity of batteries, a battery swapping mode (SM) and a charging mode (CM) can be offered by NEV makers to recharge batteries, thus inevitably influencing potential consumers’ purchase behaviors accordingly. To examine the impact of SM and CM on consumers’ purchase intentions, this paper examines a duopolistic market consisting of two new energy vehicle makers (i.e., a NEV-SM maker and a NEV-CM maker), who adopt SM and CM to service consumers, respectively. Considering that the SM is characterized by a low initial investment cost and ease of use for consumers, NEV-CM makers capitalize on extended battery warranty services in response to rivals’ utilization of SM. Therefore, non-cooperative game models are formulated, in which government subsidies are taken into account. Optimal decisions for both the NEV-SM maker and the NEV-CM maker are analyzed under three scenarios: without an extended warranty service, with an extended warranty service, and with both an extended warranty service and a subsidy. Our results offer some insights as follows:
- (1)
In the absence of an extended warranty service, there exists an optimal equilibrium condition for both carmakers, in which the NEV-SM maker adopts the low-price strategy at the initial development stage of NEV-SM, with aims to tap into the market and attract potential consumers, yet this move is not a long-term solution due to the fact that the NEV-CM maker invariably occupies more market share and profit in the NEV market.
- (2)
In the presence of an extended warranty service, the NEV-CM maker does not necessarily dominate the market. Consumers’ choice of two kinds of products relies on two critical factors, namely . When , the NEV-SM maker’s profit does surpass the NEV-CM maker’s. Nevertheless, the extended warranty service ultimately enhances the NEV-CM maker’s dominance.
- (3)
In the absence of an extended warranty service, when the subsidy standards a and b are below a specific threshold value (i.e., ), both the demand and price for the NEV-SM maker at stage I are larger than those at stage II, whereas for the NEV-CM maker, the outcome is the opposite, which shows that government subsidies have little effect on NEV-SM manufacturers at stage II if the government subsidy’s size reduces to a degree.
- (4)
In the presence of an extended warranty service, the government subsidy can dramatically increase the NEV-SM maker’s market share at stage I. Meanwhile, the numerical studies show that the NEV-SM maker’s profit, consumer surplus, and social welfare have been improved by implementing the subsidy policy, which implies that the subsidy is a critical factor in propelling the diffusion of the swapping mode at the initial stage.
There is still much space for future research. Our paper only examines NEV manufacturers and did not extend to a supply chain system composed of manufacturers and suppliers, thus one of the possible directions is to investigate optimal power-swapping stations and extended warranty services when taking investment sharing into account. Moreover, replacement and trade-in activity of products is a normal phenomenon in the NEV market, and thus it would be interesting to examine optimal decisions in the context of replacement and trade-in strategy.


