Article

State of Health Assessment for Lithium-Ion Batteries Using Incremental Energy Analysis and Bidirectional Long Short-Term Memory

1
School of Electronic Engineering and Intelligent Manufacturing, Anqing Normal University, Anqing 246011, China
2
College of Intelligent Science and Control Engineering, Jinling Institute of Technology, Nanjing 211169, China
*
Author to whom correspondence should be addressed.
World Electr. Veh. J. 2023, 14(7), 188; https://doi.org/10.3390/wevj14070188
Submission received: 9 June 2023 / Revised: 9 July 2023 / Accepted: 13 July 2023 / Published: 14 July 2023
(This article belongs to the Special Issue Lithium-Ion Batteries for Electric Vehicle)

Abstract

:
The state of health (SOH) of a lithium ion battery is critical to the safe operation of such batteries in electric vehicles (EVs). However, the regeneration phenomenon of battery capacity has a significant impact on the accuracy of SOH estimation. To overcome this difficulty, in this paper we propose a method for estimating battery SOH based on incremental energy analysis (IEA) and bidirectional long short-term memory (BiLSTM). First, the IE curve that effectively describes the complex chemical characteristics of the battery is obtained according to the energy data calculated from the constant current (CC) charging phase. Then, the relationship between the IE curve and battery SOH degradation characteristics is analyzed and the peak height of the IE curve is extracted as the aging characteristic of the battery. Further, Pearson correlation analysis is utilized to determine the linear correlation between the proposed aging characteristics and the battery SOH. Finally, BiLSTM is employed to capture the underlying mapping relationship between peak characteristics and SOH, and a battery SOH estimation model is developed. The results demonstrate that the proposed method is able to estimate battery SOH under two different charging conditions with a root mean square error less than 0.5% and coefficient of determination above 98%. Additionally, the method is combined with Pearson correlation analysis to select an aging characteristic with high correlation, reducing the required data input and computational burden.

1. Introduction

Under the pressure of increasing serious energy crisis and environmental damage, the world is rapidly moving towards the development of new energy technologies [1,2,3]. Lithium ion batteries, as one of the mainstream energy storage technologies, are serve widely in personal electronic products, large-scale power grids, and electric vehicles (EVs) due to their outstanding advantages of long cycle life, high power density, and low cost. However, the continuous working of lithium-ion batteries in complex and changeable environments causes a variety of performance degradations, such as capacity loss, reduced endurance mileage, and power fade [4,5,6,7]. In general, battery SOH is a critical indicator for evaluating the degree of aging that can be defined as the ratio of the current available capacity to the initial capacity; as a battery’s capacity degrades over time to 70–80% of the rated capacity, it will eventually need to be retired, as its performance will no longer satisfy energy and power requirements [8,9,10,11]. Therefore, it is vital to develop a method that can accurately estimate battery SOH in order to guarantee safe and efficient battery operation.
A number of studies have been devoted to researching and improving battery SOH estimation approaches. Generally, SOH estimation methodologies can be broadly divided into three categories: direct measurement [12], model-based methods [13], and data-driven methods [14]. The former mainly consists of Coulomb counting, open circuit voltage (OCV), and electrochemical impedance spectroscopy (EIS) measurements [15,16,17]. Coulomb counting obtains the battery’s static SOH after a complete charging and discharging cycle. The OCV requires massive experimental effort to establish the connection between voltage and SOH [18]. EIS requires a broad frequency spectrum to measure battery SOH; while simple, this is time-consuming, and is only suitable for testing in a laboratory environment [19]. Therefore, the propagation and applications of direct measurement methods are greatly limited.
The model-based methods mainly consist of the electrochemical model (EM) [20], equivalent circuit model (ECM) [21], and empirical model [22]. The EM is usually based on a series of complex partial differential equations for battery degradation analysis and SOH estimation, the ECM is generally composed of one or more RC circuits in parallel for estimating the battery’s state of charge (SOC), and the empirical model is usually expressed with many mathematical forms to characterize the relationship between health features and SOH, including polynomial, exponential, logarithm, and power function variants. Li et al. [23] developed several reduced-order electrochemical models, with which they efficiently and accurately estimated the battery’s SOC, electrolyte concentration, side reaction overpotential, and solid-phase surface concentration of two electrodes by monitoring the internal battery state information of the electrochemical reaction. An adaptive unscented Kalman filter was proposed based on above models; its estimation results indicate that this algorithm has strong robustness in both measurable and immeasurable conditions. Zheng et al. [24] proposed a battery capacity prediction approach based on the integration of a feedforward empirical model and feedback neural network. The parameters of the feedforward empirical model were optimized to improve the precision of capacity prediction according to the difference in estimation between the feedforward empirical model and the feedback neural network. However, the principle and calculation process of this degradation model are complicated, which is not conducive to real-time monitoring in a battery management system. Meng et al. [25] proposed a hybrid methodology which combined the empirical modal decomposition (EMD) and particle filtering (PF) approaches for forecasting early battery end-of-life (EOL) and evaluating its uncertainty.
Unlike model-based methods, data-driven approaches have been greatly developed with the promotion of new artificial intelligence and communication technologies. Generally, these methods have the advantage of realizing SOH estimation based on historical experimental data without requiring very much prior knowledge about battery aging [26,27]. In recent years, deep learning technologies, particularly deep neural networks, have become efficient battery state estimation methods. As typical networks, extreme learning machine (ELM) [28], support vector machine (SVM) [29], and long short-term memory (LSTM) [30] all have certain defects. For instance, the weights in the ELM algorithm are randomly generated, and the least squares solution can be directly solved by setting the number of neurons in the hidden layer without any feedback to update the weight of the hidden layer. Therefore, the ELM algorithm is unable to make even slight adjustments according to changes in the input data and has poor controllability, which leads to unstable output by the estimation model. In the SVM algorithm, nonlinear and indivisible lower-dimensional data are mapped to linear and divisible higher-dimensional data using a kernel function, then the data are partitioned through the hyperplane; in essence, this is a quadratic programming solution, which can effectively handle regression issues with small samples. However, this makes it difficult to divide large-scale data samples, and the computational burden can be seriously increased. In addition, the selecting the parameters used for regularization and the kernel function can represent an enormous challenge. In LSTM, three different logic gates are utilized to determine whether data should be retained or discarded, and then the hidden information of the input data is remembered and updated; therefore, LSTM has excellent performance in capturing the dependence between observation variables when processing various time series issues. If the time series data are too long, LSTM models may have a slow convergence rate and high computational complexity, reducing their ability to precisely estimate battery SOH. The capacity regeneration phenomenon associated with the process of battery cycle aging greatly hinders the accurate estimation of battery SOH [31,32].
In order to overcome the above problems, a method for estimating battery SOH is proposed in this paper based on bidirectional long short-term memory (BiLSTM) and incremental energy analysis. Additionally, feature selection and analysis are vital for model-based battery SOH estimation methods [33]. Common features acquired from charging and discharging cycles include, but are not limited to, voltage, current, capacity, internal resistance, etc., which need to be further explored to effectively characterize the battery aging mechanism. In general, these features are widely used in the SOH assessment of lithium ion batteries and have been used to excellent effectiveness in many studies. Among them, the voltage characteristic is one of the most widely used characteristics, as it can reveal the voltage variation of the battery directly and is closely related to the SOH. With regard to the current features, they are utilized to determine the current variation during charging and discharging of the battery, which is significant for detecting degradation in battery performance. On the other hand, the capacity characteristic is employed to evaluate the battery available capacity, and is one of the most vital indicators of battery SOH. Lastly, internal resistance features are applied to characterize the internal resistance of the battery, and are related to the battery’s internal losses and performance degradation.
After calculating the energy value of the equal voltage difference during CC discharge, the IE curve can be plotted; this can clearly identify the energy peak of the IE curve, which can be used extract the battery’s aging characteristics [34]. Cai et al. [35] utilized Gaussian process regression (GPR) to predict the SOH by incorporating the energy of the CV charging phase and the energy of the voltage difference during the CC discharge mode. Liu et al. [36] combined the energy value of the voltage difference extracted from CC discharge curves with an extreme learning machine model to forecast battery SOH. Chen et al. [37] forecasted the entire temperature variation of the CC charging process based on random short-term charging data, hen calculated the differential change of the predicted temperature curve, and finally extracted the aging characteristics for estimating battery SOH from the temperature difference curve smoothed by Kalman filtering. In recent years, the incremental analysis method has been widely employed in the analysis and extraction of battery aging characteristics such as incremental capacity analysis (ICA) and differential voltage analysis (DVA) of batteries [38,39]. The incremental capacity (IC) and differential voltage (DV) curves obtained from constant current charging and discharging data contain abundant characteristic variables that effectively reflect the battery degeneration process and describe the reaction mechanism of internal battery aging, which along with the peaks and locations of the curves can be used for SOH estimation [40]. Li et al. [41] extracted features from the difference curve of battery capacity after smoothing the static charging curve with Gaussian filtering, then obtained the mapping relationship between the features and SOH, which can efficiently cut down the computational burden and accomplish rapid SOH estimation. However, the charging curve of different charging and discharging rates was not considered and discussed, meaning that this research lacks certain applicability.
In order to bridge the shortcomings of the above-mentioned studies, a simple and practical approach based on incremental energy analysis (IEA) and bidirectional long short-term memory (BiLSTM) is developed in the paper to enhance the precision of battery SOH estimation. To evaluate the effectiveness of the SOH estimation model and the applicability of the SOH estimation method, we compared our proposed approach with three estimation models established using different algorithms and carried out two kinds of cyclic aging experiments with different charging rates.
The structure of this paper is organized as follows. In Section 2, the definition of battery SOH is introduced. In Section 3, the proposed incremental energy analysis method is illustrated and four clear peaks are extracted, then the Pearson correlation coefficients of the four peaks and the SOH are calculated. In Section 4, the LSTM algorithm and the composition of BiLSTM are described in detail. In Section 5, the feasibility and validity of the proposed SOH estimation method are proven and evaluated. Finally, the pivotal conclusions are summarized in Section 6.

2. Battery Health Status Definition

With repeated charge–discharge cycles, battery capacity continues to decline and internal resistance continues to increase. When the SOH value is less than 80%, the battery cannot operate normally. Therefore, the SOH of battery is a key indicator that describes its current performance and degradation degree. Generally speaking, there are two commonly used perspectives for defining battery SOH, namely, based on battery capacity and based on battery internal resistance, which can be expressed as shown below [42,43]:
SOH = Q current Q new × 100 %
SOH = R terminated R current R terminated R new × 100 %
where Q current and Q new represent the currently available capacity and the initial capacity specified by the factory, respectively, while R terminated , R current , and R new represent the ohmic internal resistance at the end of battery life, the current state, and the initial state, respectively. Because the capacity definition method is more accurate, the parameter is easy to obtain, and there is more literature on the definition of SOH using battery capacity, in this paper we use Equation (1) to define SOH.

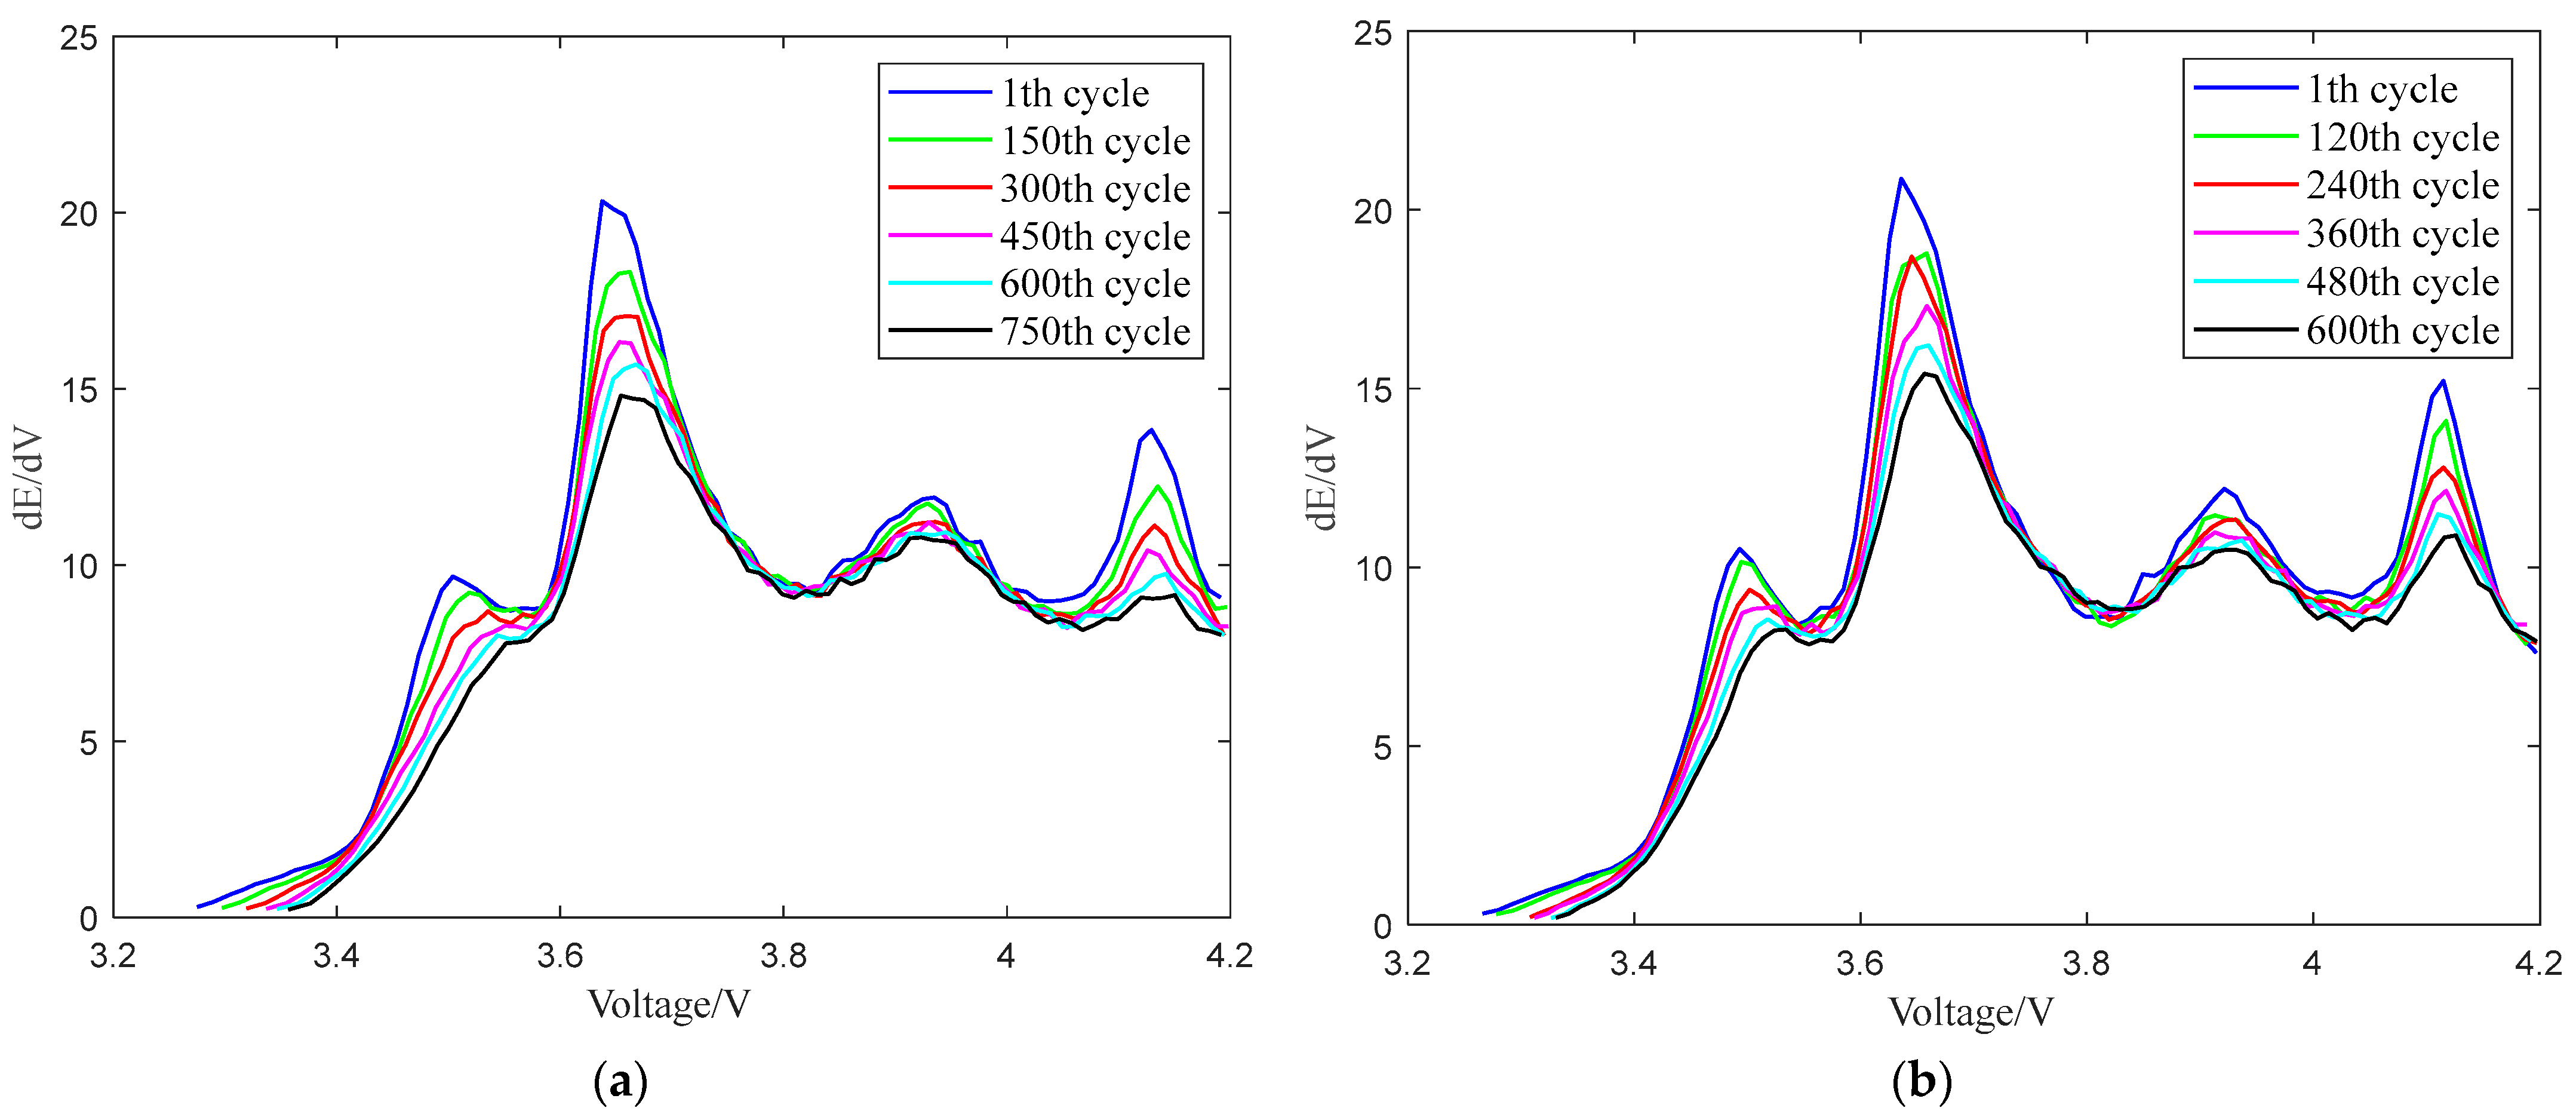
3. Incremental Energy Analysis
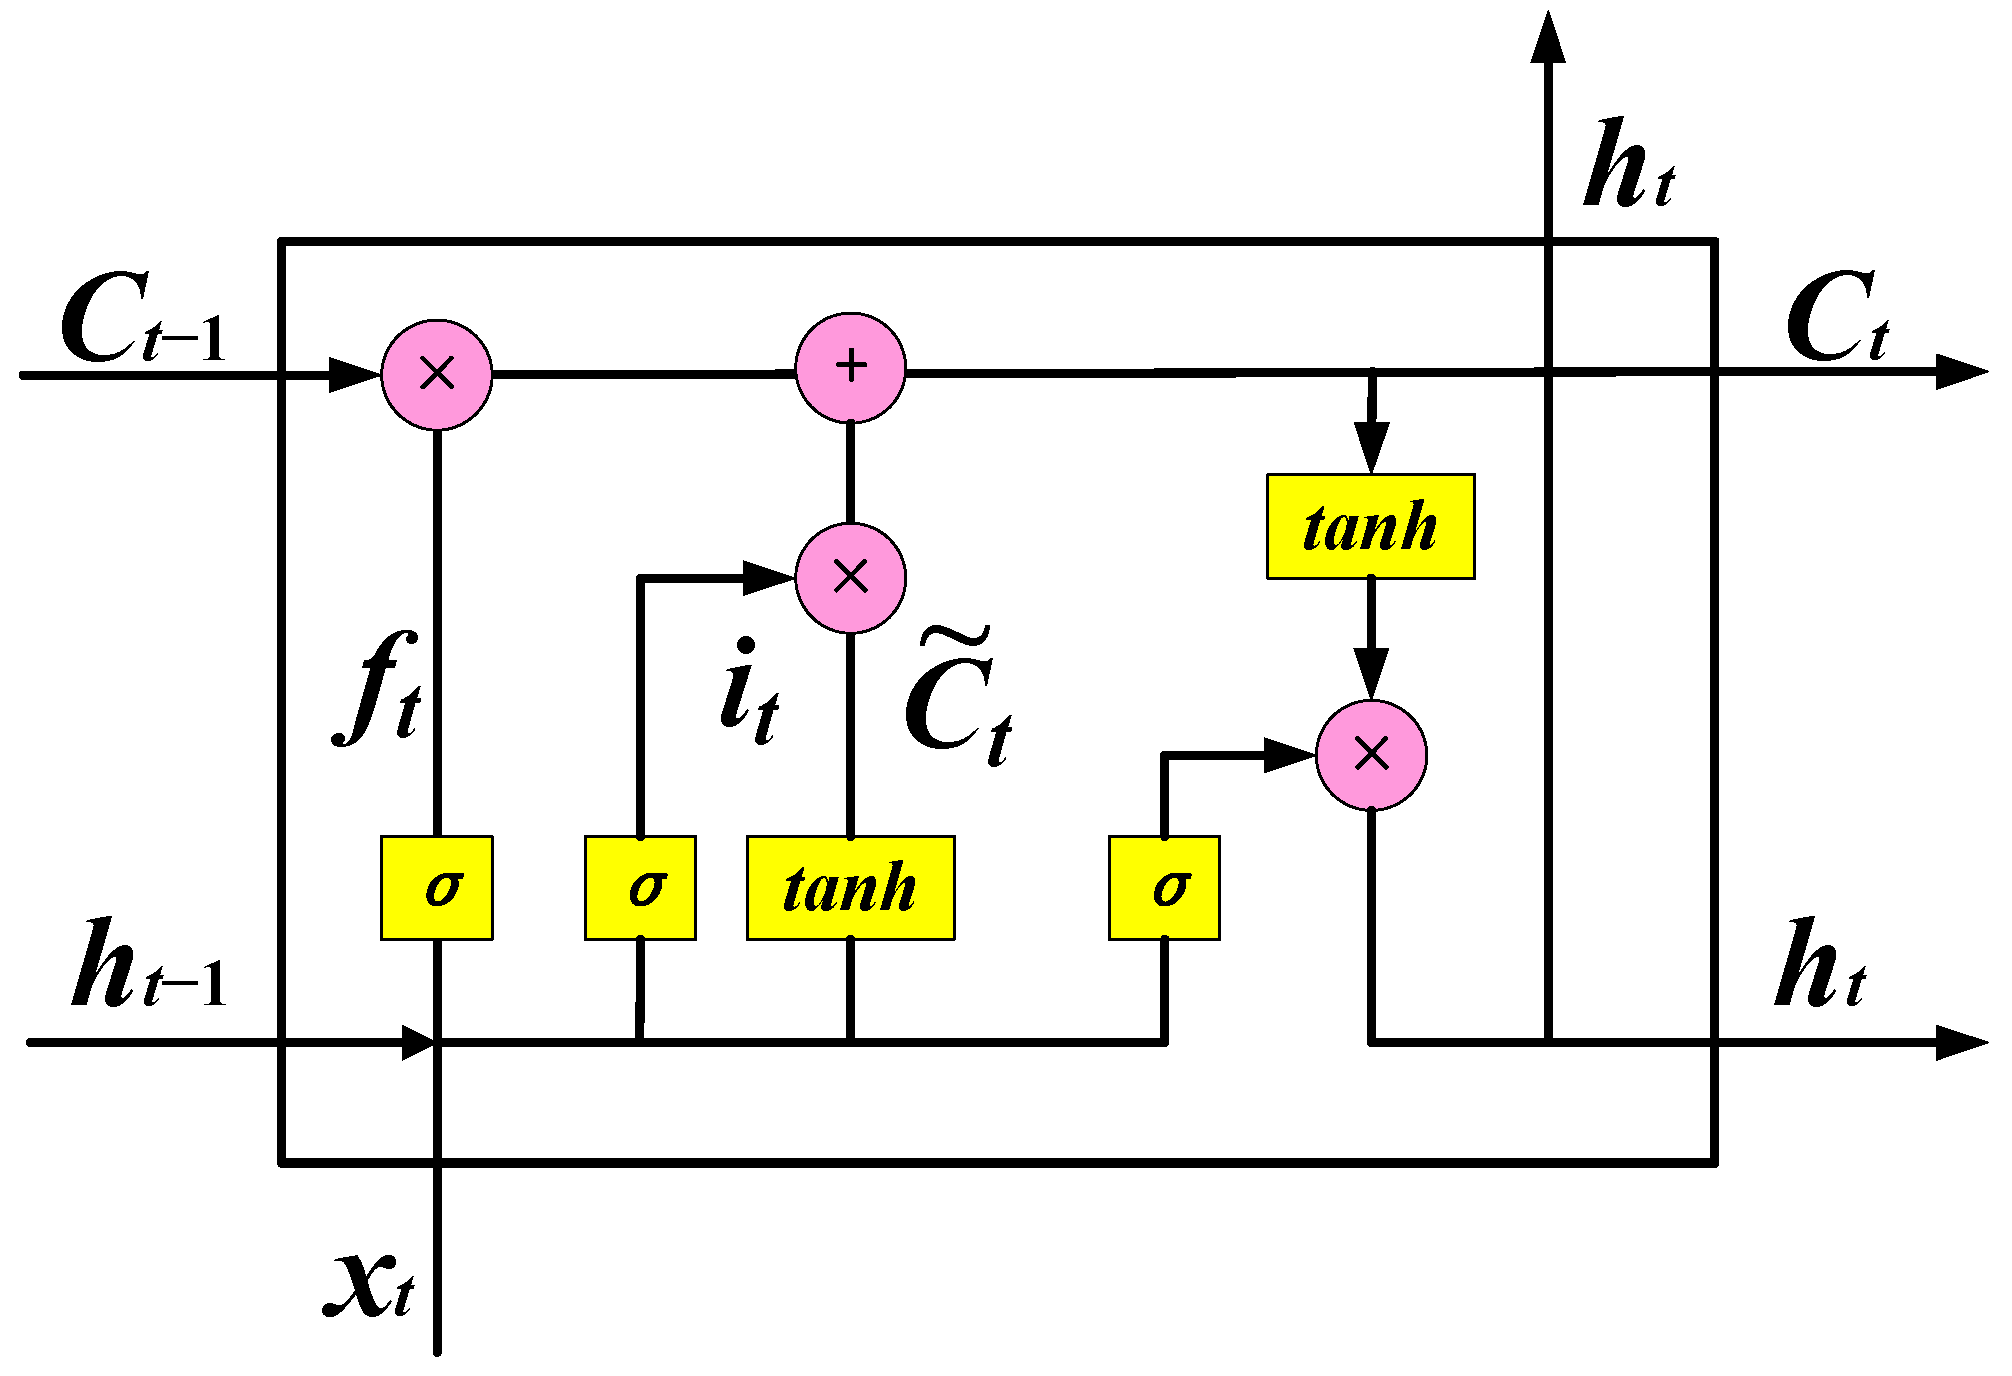
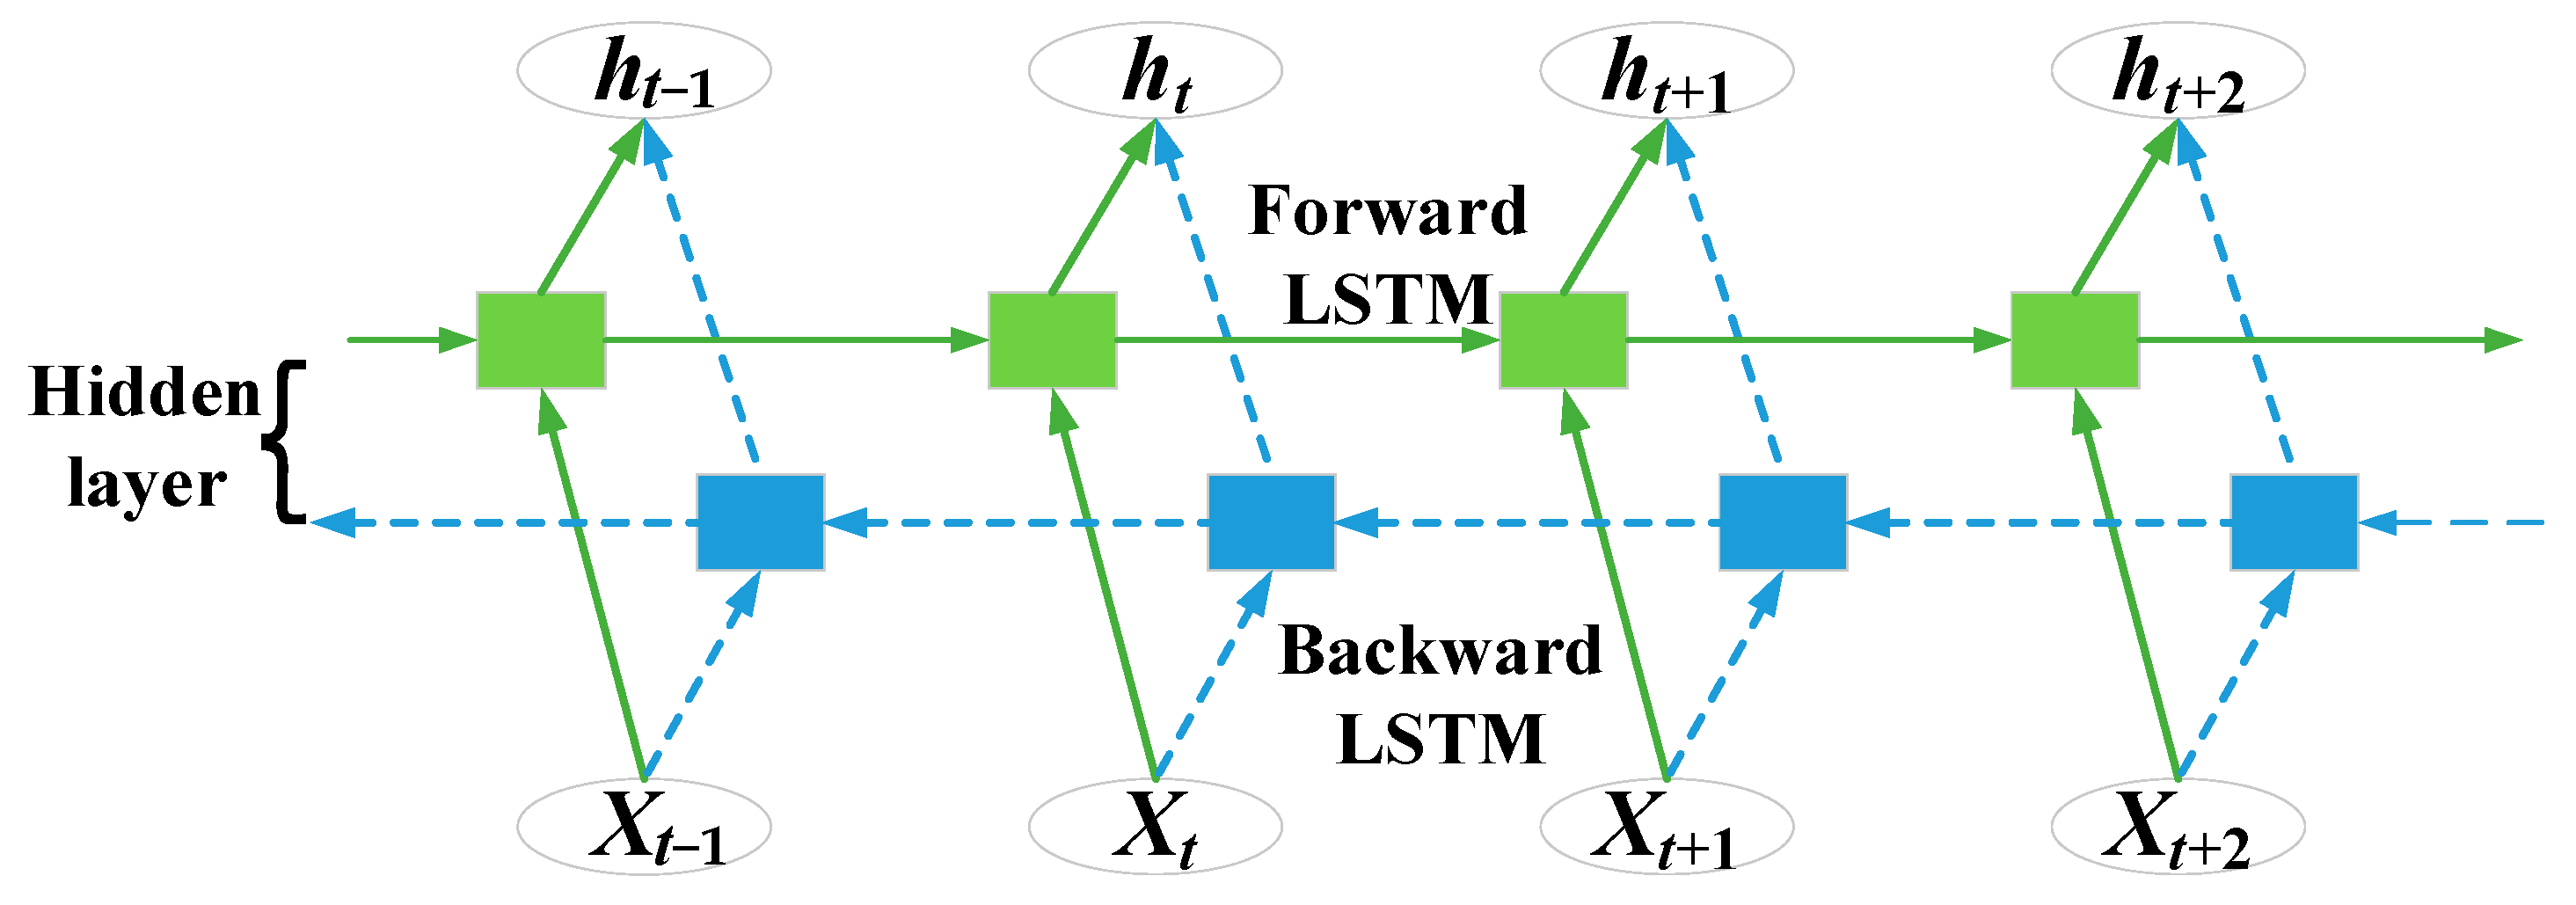
In order to achieve a clear IC curve, the preferred incremental capacity analysis approach commonly requires a smoothing function to fit the capacity and voltage data collected during constant current charging and discharging, establishing a hidden relationship between capacity and terminal voltage (Q-V) curves; further, the first derivative of the curve is converted into the capacity increment and terminal voltage (dQ/dV-V) curve, while a Kalman filter can be used to smooth the curve [44]. The shifted curve contains more abundant and sensitive characteristics, which is beneficial for analyzing and extracting more effective features to describe the battery aging process. Therefore, the proposed IEA in this work uses a simpler procedure to characterize the degeneration mechanism under the CC-CV charging mode with different charging rates. In analogy with the traditional incremental capacity method, we adopt the ratio of the energy change value Δ E to the fixed voltage difference value Δ V , which can decrease the fitting error to a certain extent; the substitution process can be expressed as follows:
E = f ( V ) = t 0 t 1 V ( t ) · I d t
d E d V Δ E Δ V
where E is the energy in the CC charging phase, t0 and t1 represent the start and end times of CC charging phase, respectively, V denotes the voltage of the CC charging phase, and f indicates the functional relation of E and V.
The experimental data of 0.1C and 0.2C charging at different rates are compared and analyzed in this paper. Moreover, from an electrochemical perspective, the incremental energy (IE) method clearly indicates the phase equilibrium position trend, where the voltage exhibits a slow increase while complex and vigorous electrochemical reactions occur within the battery. This phenomenon occurs due to the rapid change in the battery’s available energy with respect to voltage.
The IE curves of two different charging rates are shown in Figure 1; there are four obvious peaks in the IE curve. It can be seen from Figure 1 that the energy charging curve at 0.1C is at the upper left of the energy charging curve at 0.2C, which indicates that under the condition of lower current, more energy can be charged and the total charging time increases significantly. In addition, the IE curve has the same trend of shifting, the values of the four peaks of the IE curve increase with the lower charging rate, and the voltage positions corresponding to the peak values decrease.
Throughout the degradation of battery performance, the IE curve contains health characteristic information that can be used to characterize battery aging, as shown in Figure 2. It can be seen that there are four clear peaks in the IE aging curve under different numbers of cycles and that the four peaks gradually decrease as the number of charging–discharging cycles increases; furthermore, the voltage values corresponding to the four peaks remain basically unchanged. In general, the internal degradation pattern of the battery here depends on chemical analysis. Different battery types have different chemical properties at different charging/discharging rates, temperatures, and charging modes (e.g., constant current, constant voltage). During the loss of lithium ions, lithium is oxidized and lithium ions are released from the graphite at the negative (anode); the lithium ions undergo a reduction reaction at the positive (cathode). Because the side reactions are irreversible, when the equilibrium state changes this leads to deterioration of battery performance, which in the process of use further forms a vicious cycle to accelerate battery aging [45]. Therefore, the four peaks are used as a class of essential aging characteristics to evaluate battery SOH in this paper. Additionally, in order to achieve a more rapid and efficient estimate of battery SOH, Pearson correlation analysis is used to further excavate the underlying mapping relationship between the four aging peaks and battery SOH, denoted as follows:
P = i = 1 n X i X ¯ Y i Y ¯ i = 1 n X i X ¯ 2 i = 1 n Y i Y ¯ 2
where X i and Y i denote the aging peak value and health status value, respectively, of the ith cycle, while X ¯ and Y ¯ respectively indicate the average values of the aging peak and health status.
The correlation coefficient between the aging peak and SOH with two different charging rates are listed in Table 1. It is worth noting that the correlation coefficients between the four peak characteristics and SOH are greater than 0.91, among which the correlation coefficients of peak II and peak IV are very close, and the largest, the d E / d V (the ratio of the energy change value Δ E to the fixed voltage difference value Δ V ), is highly correlated with capacity. The larger the correlation coefficient, the greater the correlation between peak characteristics and capacity; while the correlation of peak III is the smallest, the correlation coefficient of peak I remains effectively unchanged in the IE aging curves for the two different charging rates. Therefore, the two aging peaks with the maximum correlation coefficient, that is, the peaks II and IV, are employed for estimating battery SOH in this paper.

4. BiLSTM

In conventional recurrent neural networks (RNNs), parameter updating takes place via back-propagation algorithms and error propagation is transmitted forward step by step based on the reverse order of time. However, because the ability of RNNs to process relatively long sequences is limited, the gradient disappearance or explosion phenomenon appears, which can influence the estimation accuracy of long-sequence data. In order to solve this issue, the best approach at present is to introduce a gating mechanism to overcome the problem of long-term dependency, as in an LSTM network. The basic structure of LSTM is shown in Figure 3; the LSTM contains three specific gate structures, called the forget gate, input gate, and output gate, which control information transfer in the LSTM cell and decide the input, reservation, and output of the information, respectively. Taking into account that the energy data of the charging process is a time series, the battery SOH degrades as the number of cycles increases; LSTM networks are widely employed in many fields as an excellent solution for dealing with such time series problems. Consequently, in this paper the historical energy data of charging and discharging cycles are adopted for SOH estimation by implementing an LSTM network.
The procedure of using the LSTM to process input data can be described by the following computational formulas:
f t = σ ( w f [ h t 1 , x t ] + b f )
i t = σ ( w i [ h t 1 , x t ] + b i )
c ˜ t = tanh ( w c [ h t 1 , x t ] + b c )
o t = σ ( w o [ h t 1 , x t ] + b o )
C t = f t C t 1 + i t c ˜ t
h t = o t tanh ( S t )
σ ( x ) = 1 1 + exp ( x )
tanh ( x ) = exp ( x ) exp ( x ) exp ( x ) + exp ( x )
where it and c ˜ t are the respective outputs of the input gate and input node at time t, ft, ot, and ht denote the output of forget gate, output gate, and hidden layer at time t, respectively, Ct is an intermediate storage variable that multiplies the state information of the input gate into the state space, wi, wf, wc, and wo represent the weight parameters of the input gate, forget gate, input state, and output gate, respectively, bi, bf, bc, and bo indicate the bias term of the input gate, forget gate, input state, and output gate, respectively, and tanh represents the sigmoid and hyperbolic tangent activation function.
Additionally, due to the regeneration phenomenon of battery capacity, the LSTM can only extract the capacity sequence information of the battery in the forward direction, and cannot obtain the reverse capacity sequence information. In consideration of this, the BiLSTM algorithm is proposed to overcome SOH estimation inaccuracy due to the battery capacity regeneration phenomenon. As shown in Figure 4, the BiLSTM network layer is composed of forward and backward propagation LSTM layers, which can better establish the dependency between past capacity data and future capacity data.
After calculating the current time value of the forward LSTM layer and the current time value of the backward LSTM layer, the two are used to jointly determine the final output value, which can effectively improve the robustness and generalization of the network and is very suitable for processing large-scale data and unstable data. The network output process is as follows:
h t = f ( x t , h t 1 )
h t = w t h t + w t h t + b t
where w t and w t represent the weights of the forward LSTM hidden layer output and reverse LSTM hidden layer output, respectively, while h t is the linear superposition of the forward hidden layer state and reverse hidden layer state.

5. Experimental Results and Analysis

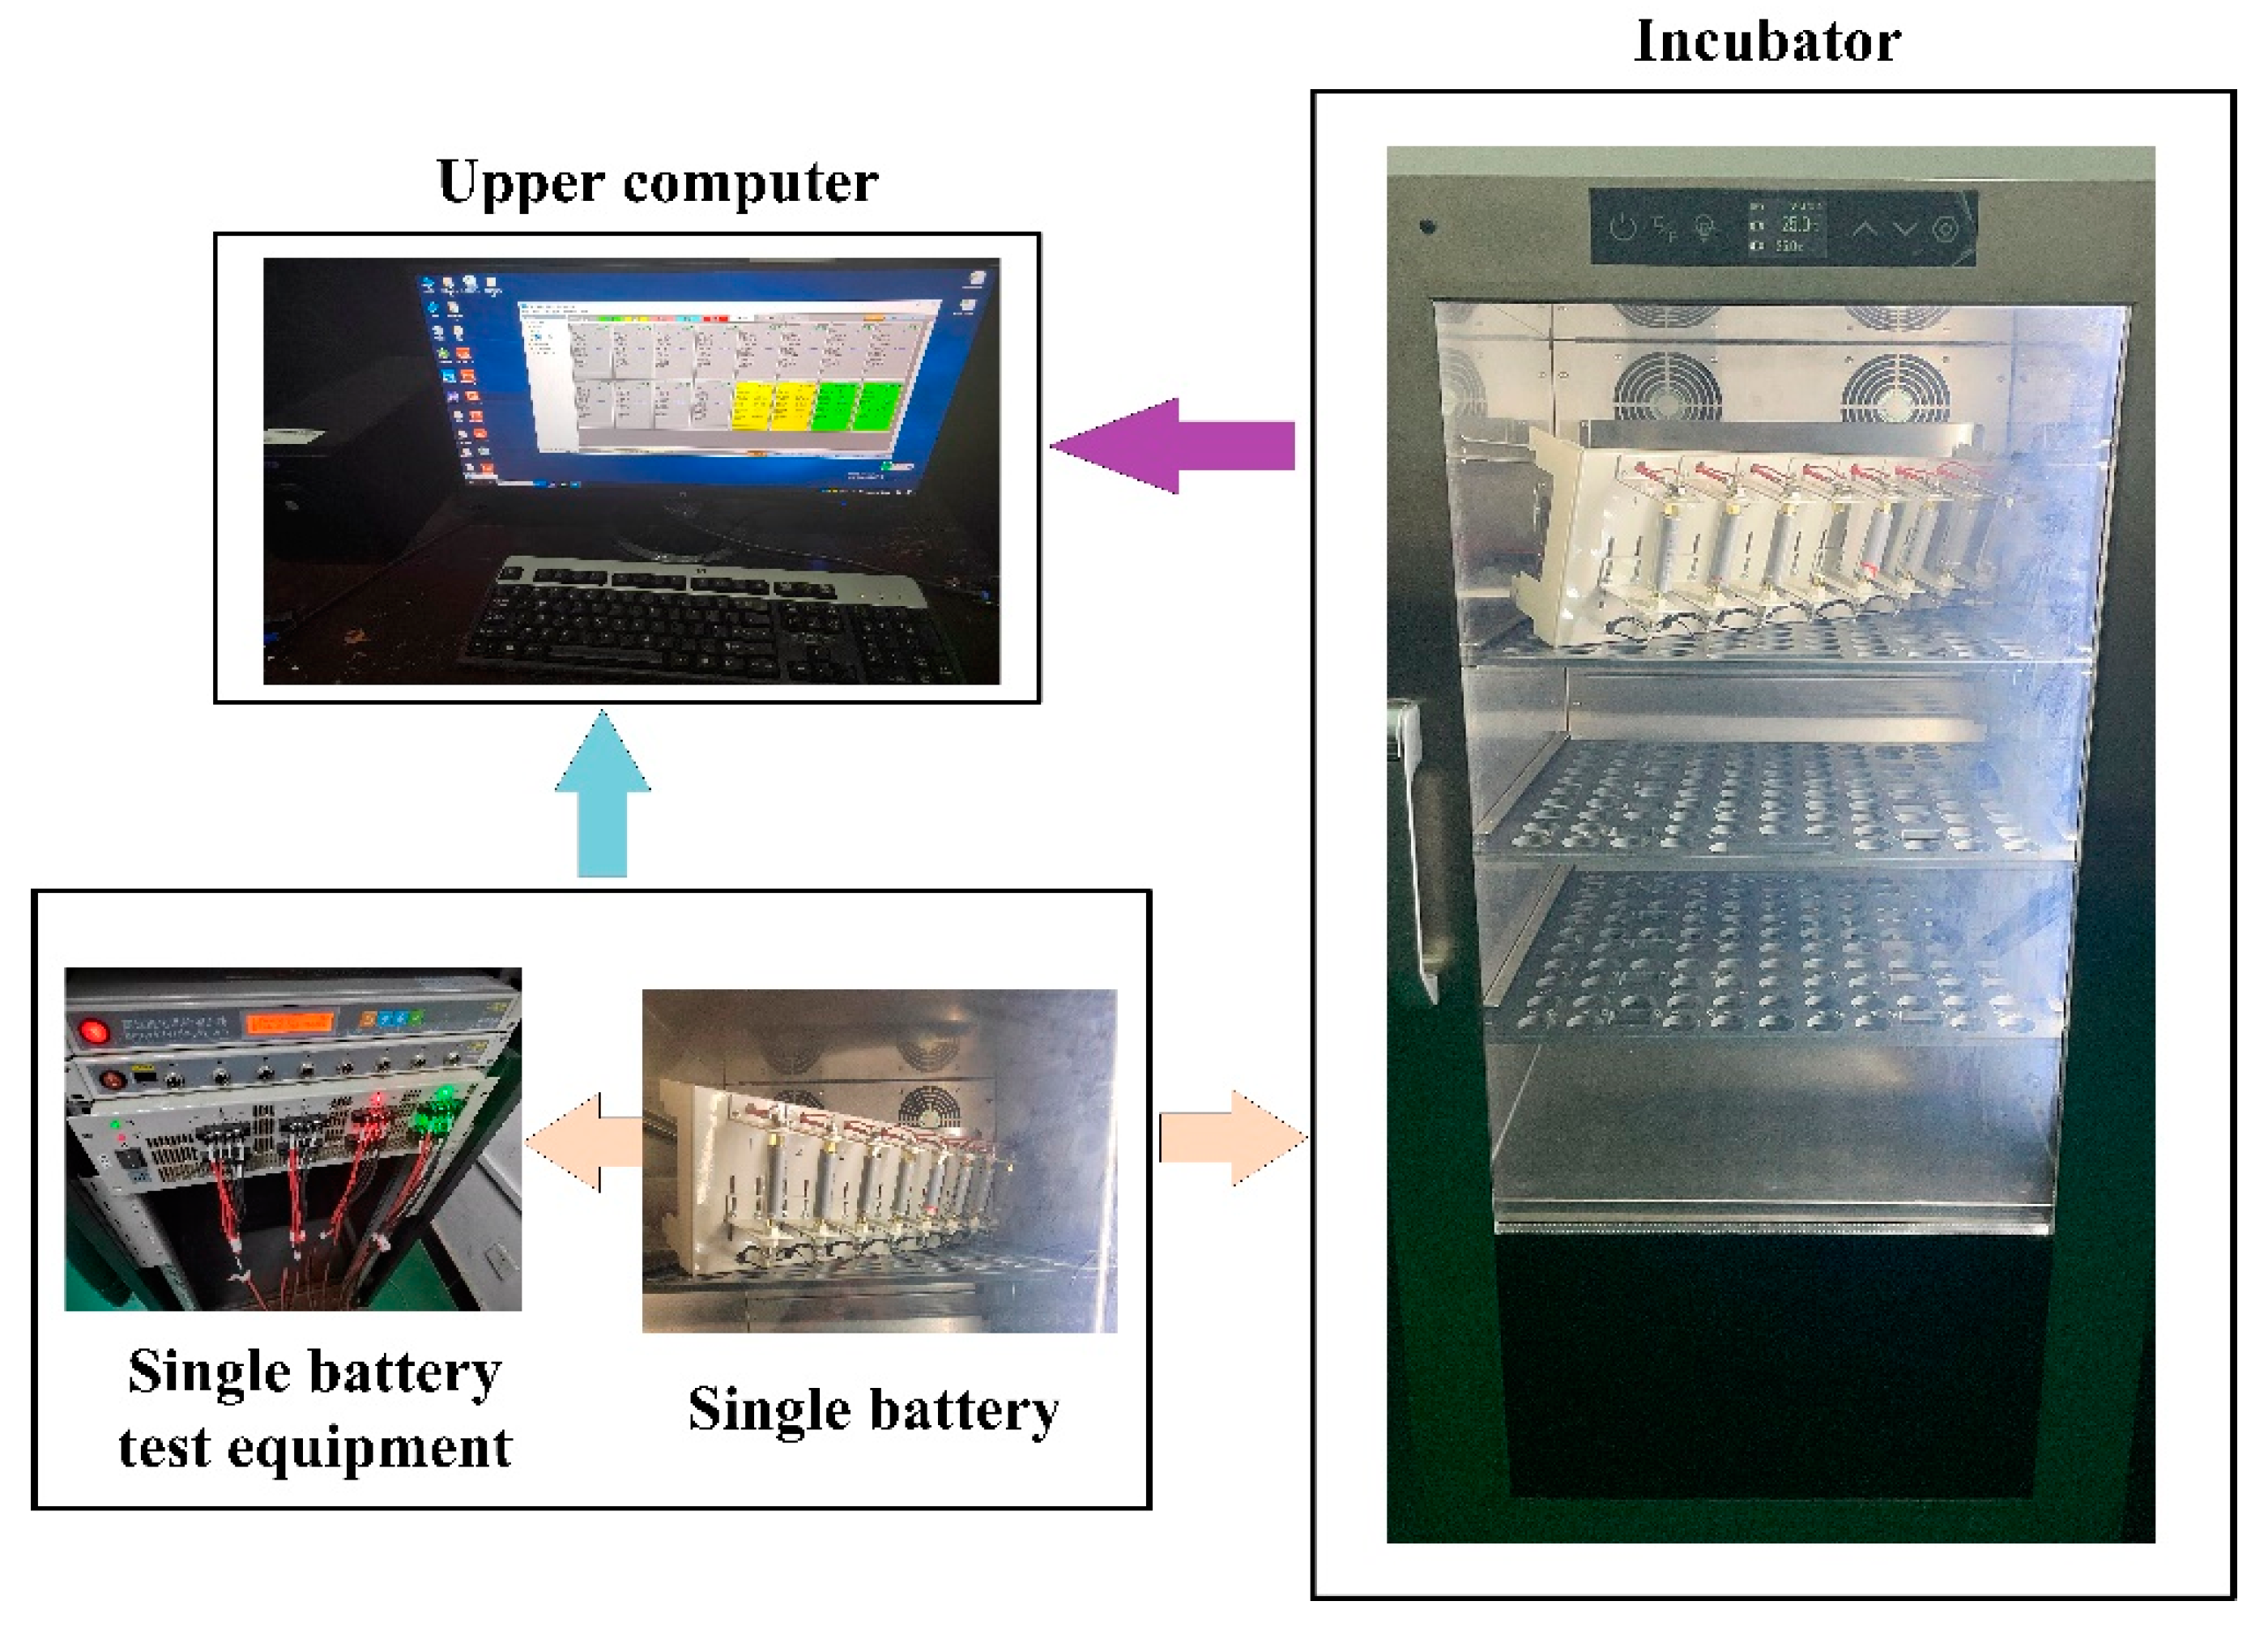
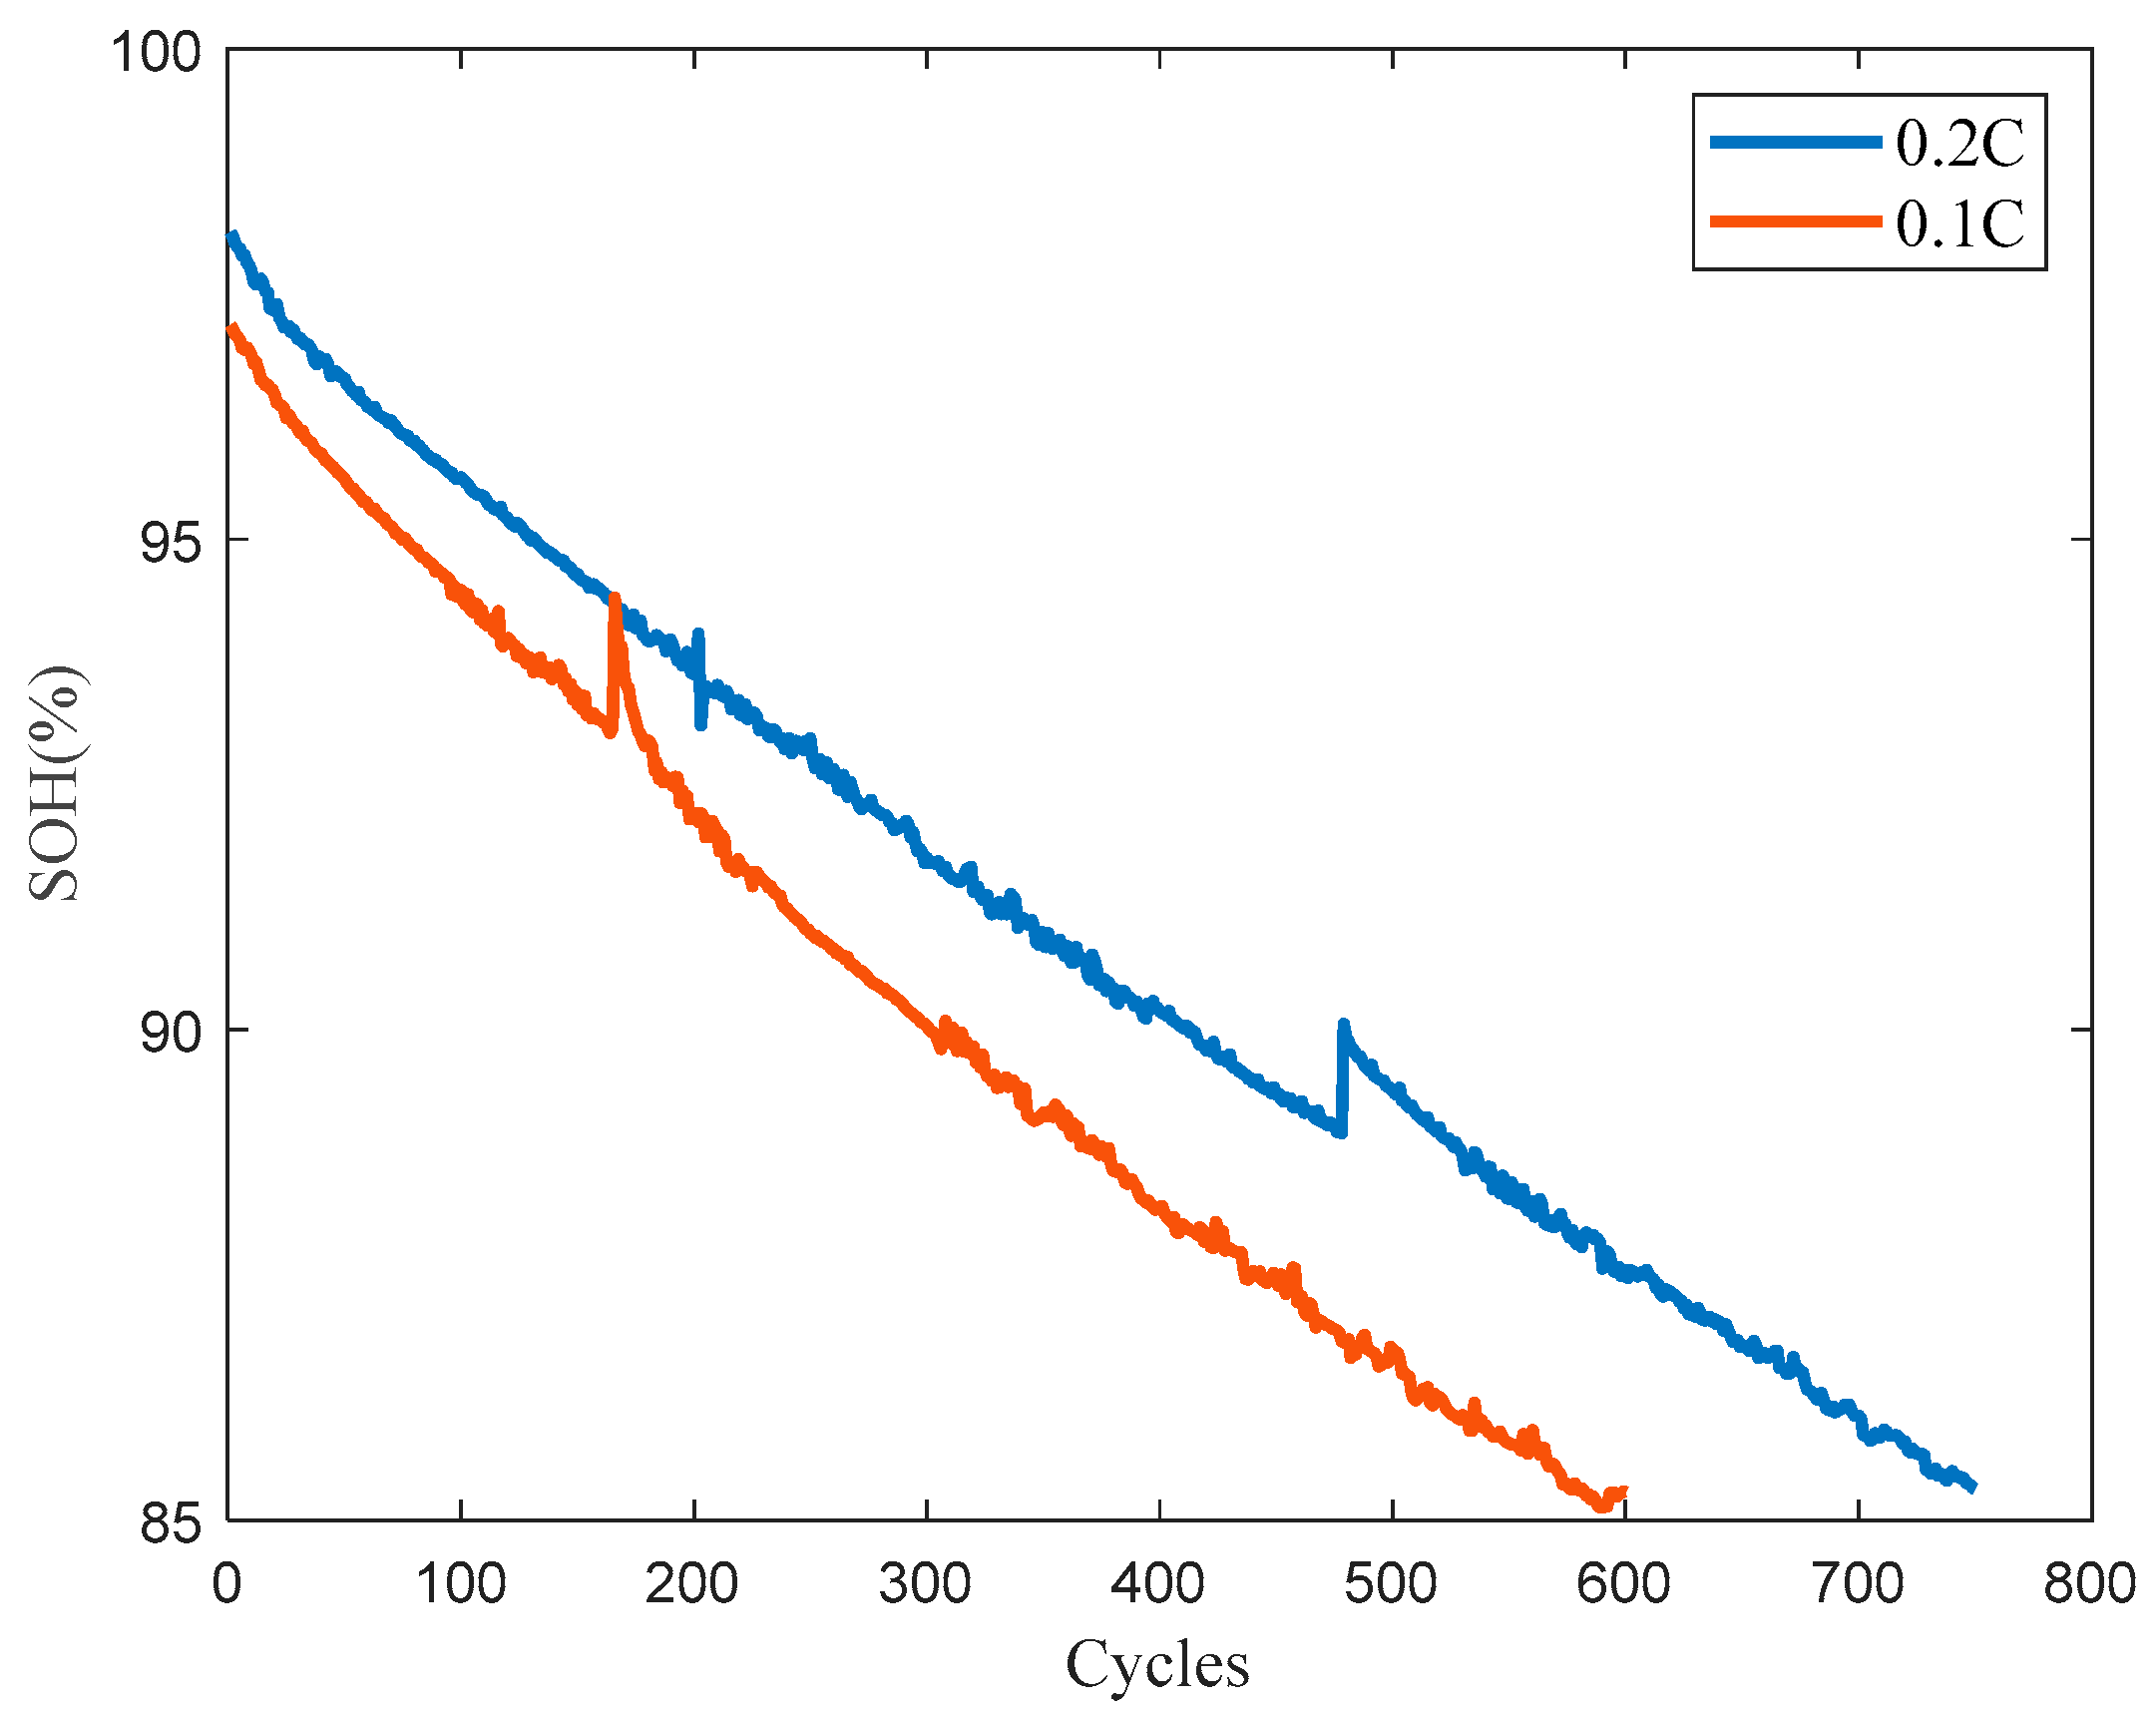
5.1. Battery Dataset

Two cylindrical lithium ion batteries with the same specifications were implemented with 0.48 A (0.2C) and 0.24 A (0.1C) constant current charging until the battery voltage achieved the upper cut-off voltage 4.2 V, then the 4.2 V voltage of battery was maintained until the charging current reduced to the lower cut-off current of 48 mA; the battery specifications are shown in Table 2. The two batteries were subjected to repeated charging–discharging testing at room temperature (25 °C); with respect to the batteries charged at 0.2C and 0.1C constant current, they conducted 750 and 600 charging–discharging cycles, the energy of the 0.2C constant current charging battery was decreased from 8.4813 W·h to 7.2401 W·h, and the energy of the 0.1C constant current charging battery was reduced from 8.3982 W·h to 7.2392 W·h. Next, the aging data of the batteries were measured based on the efficient battery test system, as shown in Figure 5, in which the upper computer in the testing system was employed to record the data in the experiment and the two batteries were tested using an Neware BTS 4000. Eventually, the incubator was used to control the temperature of the single battery. The SOH measurements of the two lithium ion batteries are shown in Figure 6. It can be seen that the SOH of the battery is continuously degraded with the increasing number of charging–discharging cycles, and both are accompanied by the SOH regeneration phenomenon. As there is a resting state in the battery during the charging–discharging cycle, the internal side reaction products dissolve and the voltage gradually increases. As a result, the available capacity of the battery briefly recovers or even increases compared to the previous cycle, then the battery capacity decays faster; this demonstrates that overcoming the battery capacity regeneration phenomenon is essential for accurate monitoring of battery SOH.

5.2. The SOH Estimation Process

Considering the feature extraction, model calculation cost, and SOH estimation accuracy, the overall framework of the proposed SOH estimation methodology is shown in Figure 7. It can be divided into three parts: data preprocessing, SOH estimation model training, and SOH estimation. Specifically, the IE curve is drawn based on the charging energy data of the battery to extract the peak characteristics and the normalized feature data is used as the network input; then, the input data are divided into two parts, a training set and a testing set, according to a ratio of 1:1, and the battery SOH estimation model of BiLSTM is constructed based on the training set. Finally, the performance of the proposed battery SOH estimation method is validated by the testing data.

5.3. Evaluation Metrics

To evaluate the performance of SOH estimation, the mean absolute error (MAE), root mean square error (RMSE), and determination coefficient R2 are used to measure estimation performance in this work; they are respectively defined as follows:
MAE = 1 n i = 1 n y ^ i y i
RMSE = 1 n i = 1 n y i y ^ i 2
R 2 = 1 i = 1 n ( y i y ^ i ) 2 i = 1 n ( y i y ¯ i ) 2
where y ^ i and y i are the estimated SOH and actual SOH, respectively, and n refers to the number of testing cycle.

5.4. Experimental Results and Analysis

The battery’s energy and voltage data in the CC phase of the 0.1C and 0.2C charging–discharging cycles were first measured. Afterwards, the IE aging curve was drawn according to the ratio of the energy change value to the fixed voltage difference value, and the four related energy peaks were extracted from the IE aging curve. Pearson correlation analysis was used to calculate the correlation between each peak and the battery SOH to determine the input data of the SOH estimation model. Based on the divided training and testing set, the SOH estimation model was established and the model performance index was evaluated. The battery SOH of the testing data was estimated according to the trained estimation model, and is shown as the dark blue line in Figure 8. The SOH estimation results shown in the figure clearly indicate that the proposed method based on IEA and BiLSTM can accurately evaluate battery SOH under two different charging rates. The performance indicators with respect to the battery SOH evaluation results of the two different charging rates are recorded in Table 3. It can be seen from the table that the MAE and RMSE values are both very low, which indicates that the estimated SOH trajectory is consistent with the actual SOH degradation trend. In addition, the closer the coefficient of determination R2 is to 1, the more accurately the model estimates the real SOH decline. In summary, the proposed method can closely estimate the battery SOH deterioration trend.
In order to further prove the validity of the proposed SOH estimation method based on incremental energy analysis and BiLSTM, a comparative experiment was carried out including the LSTM, SVM, and ELM neural networks for the case of estimating battery SOH with 0.1C and 0.2C constant current charging. The comparative experimental results of the two cases are displayed in Figure 9. In order to more clearly represent the error in the estimation results under the two cases, Table 4 shows the specific data of MAE, RMSE and R2.
Based on the evaluation results of the four algorithms for estimating battery SOH, it is evident that LSTM exhibits superior memory capabilities in capturing dependencies within time series data and can partially address the issue of gradient disappearance and explosion. However, LSTM falls short in accurately estimating long-term dependencies between sequences. Furthermore, during the training process the accumulation of error gradients leads to significant updates to the weights being required, resulting in decreased estimation accuracy.
In the case of SVM, its utilization of a kernel function allows for the mapping of low-dimensional and nonlinear data into a higher-dimensional space, transforming these data into linear data for solving. However, the constant adjustment of the penalty coefficient and width factor of the kernel function makes it difficult to precisely track the true decay law of the battery SOH; consequently, multiple jump points may appear in the estimated results.
ELM, on the other hand, employs randomly initialized weights in the hidden layer, eliminating the need for manual assignment or iterative learning and updating. ELM lacks feedback capability, and relies on the gradient descent method for learning and updating weights. As a result, ELM demonstrates fast calculation output and strong generalization ability. However, the occurrence of local regeneration phenomena in battery SOH significantly affects the estimation results, causing substantial fluctuations.
In our proposed SOH estimation method, BiLSTM effectively learns historical and future SOH values, thereby overcoming the challenges posed by the regeneration phenomenon in battery SOH. Additionally, the extraction of multiple peak features from the IE aging curve profoundly captures the underlying aging law of battery SOH.

6. Conclusions

In future intelligent lithium ion battery management technologies, the battery’s state of health is a vital evaluation index of aging, and the use of machine learning methods to estimate battery SOH has attracted increasing focus in recent years. Therefore, an SOH estimation method based on bidirectional long short-term memory neural network and incremental energy analysis is proposed in this paper. The proposed SOH estimation method was compared with LSTM, SVM, and ELM models. Notably, that the performance of the proposed method was superior to the other estimation techniques, with significantly smaller RMSE and R2 values. The RMSE of the proposed method for charging rates of 0.2C and 0.1C were 0.2745% and 0.3358%, respectively; the BiLSTM model reduced the RMSE by 9.31–47.88% at 0.2C and by 14.74–36.41% at 0.1C, and the determination coefficients at 0.2C and 0.1C were 98.72% and 98.31%, respectively. In addition, the proposed BiLSTM model increased the R2 value by 0.29–5.26% at 0.2C and by 0.16–4.21% at 0.1C.
In the future, we intend to investigate the effects of different temperature conditions, charging and discharging modes, and types of batteries on SOH estimation.

Author Contributions

Validation, formal analysis, and writing, Y.L.; methodology and software, L.L.; conceptualization, C.Z.; project administration, H.L. All authors have read and agreed to the published version of the manuscript.

Funding

This work was supported by the Graduate Innovation and Entrepreneurship Project of Anqing Normal University through Anhui Provincial Grant No. 2022cxcysj161.

Institutional Review Board Statement

Not applicable.

Informed Consent Statement

Not applicable.

Data Availability Statement

The datasets that support the findings of this study were measured in the authors’ laboratory, and are available from the corresponding author upon reasonable request.

Conflicts of Interest

The authors declare no conflict of interest.

References

  1. Noura, N.; Boulon, L.; Jemeï, S. A Review of Battery State of Health Estimation Methods: Hybrid Electric Vehicle Challenges. World Electr. Veh. J. 2020, 11, 66. [Google Scholar] [CrossRef]
  2. Lyu, Z.; Gao, R.; Li, X. A partial charging curve-based data-fusion-model method for capacity estimation of Li-Ion battery. J. Power Sources 2021, 483, 229131. [Google Scholar] [CrossRef]
  3. Zhao, Z.; Chen, Z.; Shu, X.; Shen, J.; Lei, Z.; Zhang, Y. State of health estimation for lithium-ion batteries based on hybrid attention and deep learning. Reliab. Eng. Syst. Saf. 2023, 232, 109066. [Google Scholar] [CrossRef]
  4. Haram, M.H.S.M.; Lee, J.W.; Ramasamy, G.; Ngu, E.E.; Thiagarajah, S.P.; Lee, Y.H. Feasibility of utilising second life EV batteries: Applications, lifespan, economics, environmental impact, assessment, and challenges. Alex. Eng. J. 2021, 60, 4517–4536. [Google Scholar] [CrossRef]
  5. Dong, G.; Han, W.; Wang, Y. Dynamic Bayesian network-based lithium-ion battery health prognosis for electric vehicles. IEEE Trans. Ind. Electron. 2020, 68, 10949–10958. [Google Scholar] [CrossRef]
  6. Wang, Y.; Tian, J.; Sun, Z.; Wang, L.; Xu, R.; Li, M.; Chen, Z. A comprehensive review of battery modeling and state estimation approaches for advanced battery management systems. Renew. Sustain. Energy Rev. 2020, 131, 110015. [Google Scholar] [CrossRef]
  7. Liu, K.; Shang, Y.; Ouyang, Q.; Widanage, W.D. A data-driven approach with uncertainty quantification for predicting future capacities and remaining useful life of lithium-ion battery. IEEE Trans. Ind. Electron. 2020, 68, 3170–3180. [Google Scholar] [CrossRef]
  8. Yang, F.; Shi, D.; Mao, Q.; Lam, K.-H. Scientometric research and critical analysis of battery state-of-charge estimation. J. Energy Storage 2023, 58, 106283. [Google Scholar] [CrossRef]
  9. Hannan, M.A.; Hoque, M.M.; Hussain, A.; Yusof, Y.; Ker, P.J. State-of-the-art and energy management system of lithium-ion batteries in electric vehicle applications: Issues and recommendations. IEEE Access 2018, 6, 19362–19378. [Google Scholar] [CrossRef]
  10. Goh, H.H.; Lan, Z.; Zhang, D.; Dai, W.; Kurniawan, T.A.; Goh, K.C. Estimation of the state of health (SOH) of batteries using discrete curvature feature extraction. J. Energy Storage 2022, 50, 104646. [Google Scholar] [CrossRef]
  11. Hannan, M.A.; Hoque, M.M.; Peng, S.E.; Uddin, M.N. Lithium-ion battery charge equalization algorithm for electric vehicle applications. IEEE Trans. Ind. Appl. 2017, 53, 2541–2549. [Google Scholar] [CrossRef]
  12. Xiong, R.; Li, L.; Tian, J. Towards a smarter battery management system: A critical review on battery state of health monitoring methods. J. Power Sources 2018, 405, 18–29. [Google Scholar] [CrossRef]
  13. Wang, J.; Jia, Y.; Yang, N.; Lu, Y.; Shi, M.; Ren, X.; Lu, D. Precise equivalent circuit model for Li-ion battery by experimental improvement and parameter optimization. J. Energy Storage 2022, 52, 104980. [Google Scholar] [CrossRef]
  14. Oji, T.; Zhou, Y.; Ci, S.; Kang, F.; Chen, X.; Liu, X. Data-driven methods for battery soh estimation: Survey and a critical analysis. IEEE Access 2021, 9, 126903–126916. [Google Scholar] [CrossRef]
  15. Zhang, S.; Guo, X.; Dou, X.; Zhang, X. A rapid online calculation method for state of health of lithium-ion battery based on coulomb counting method and differential voltage analysis. J. Power Sources 2020, 479, 228740. [Google Scholar] [CrossRef]
  16. Tian, J.; Xiong, R.; Shen, W.; Sun, F. Electrode ageing estimation and open circuit voltage reconstruction for lithium ion batteries. Energy Storage Mater. 2021, 37, 283–295. [Google Scholar] [CrossRef]
  17. Messing, M.; Shoa, T.; Habibi, S. Estimating battery state of health using electrochemical impedance spectroscopy and the relaxation effect. J. Energy Storage 2021, 43, 103210. [Google Scholar] [CrossRef]
  18. Chen, X.; Lei, H.; Xiong, R.; Shen, W.; Yang, R. A novel approach to reconstruct open circuit voltage for state of charge estimation of lithium ion batteries in electric vehicles. Appl. Energy 2019, 255, 113758. [Google Scholar] [CrossRef]
  19. Jiang, B.; Zhu, J.; Wang, X.; Wei, X.; Shang, W.; Dai, H. A comparative study of different features extracted from electrochemical impedance spectroscopy in state of health estimation for lithium-ion batteries. Appl. Energy 2022, 322, 119502. [Google Scholar] [CrossRef]
  20. Li, W.; Demir, I.; Cao, D.; Jöst, D.; Ringbeck, F.; Junker, M.; Sauer, D.U. Data-driven systematic parameter identification of an electrochemical model for lithium-ion batteries with artificial intelligence. Energy Storage Mater. 2022, 44, 557–570. [Google Scholar] [CrossRef]
  21. Guo, R.; Shen, W. A review of equivalent circuit model based online state of power estimation for lithium-ion batteries in electric vehicles. Vehicles 2022, 4, 1–29. [Google Scholar] [CrossRef]
  22. Dubarry, M.; Beck, D. Perspective on Mechanistic Modeling of Li-Ion Batteries. Acc. Mater. Res. 2022, 3, 843–853. [Google Scholar] [CrossRef]
  23. Li, W.; Fan, Y.; Ringbeck, F.; Jöst, D.; Han, X.; Ouyang, M.; Sauer, D.U. Electrochemical model-based state estimation for lithium-ion batteries with adaptive unscented Kalman filter. J. Power Sources 2020, 476, 228534. [Google Scholar] [CrossRef]
  24. Zheng, Y.; Cui, Y.; Han, X.; Ouyang, M. A capacity prediction framework for lithium-ion batteries using fusion prediction of empirical model and data-driven method. Energy 2021, 237, 121556. [Google Scholar] [CrossRef]
  25. Meng, J.; Azib, T.; Yue, M. Early-Stage end-of-Life prediction of lithium-Ion battery using empirical mode decomposition and particle filter. Proc. Inst. Mech. Eng. Part A J. Power Energy 2023, 237, 09576509231153907. [Google Scholar] [CrossRef]
  26. Samanta, A.; Chowdhuri, S.; Williamson, S.S. Machine learning-based data-driven fault detection/diagnosis of lithium-ion battery: A critical review. Electronics 2021, 10, 1309. [Google Scholar] [CrossRef]
  27. Zhang, C.; Zhao, S.; He, Y. An integrated method of the future capacity and RUL prediction for lithium-ion battery pack. IEEE Trans. Veh. Technol. 2021, 71, 2601–2613. [Google Scholar] [CrossRef]
  28. Abbott, B.P.; Abbott, R.; Abbott, T.D.; Abernathy, M.R.; Acernese, F.; Ackley, K.; Adams, C.; Adams, T.; Addesso, P.; Adhikari, R.X.; et al. Observation of Gravitational Waves from a Binary Black Hole Merger. Phys. Rev. Lett. 2016, 116, 061102. [Google Scholar] [CrossRef] [Green Version]
  29. Jing, Y.; Zhen, P.; Wang, H. The Remaining Useful Life Estimation of Lithium-ion Battery Based on Improved Extreme Learning Machine Algorithm. Int. J. Electrochem. Sci. 2018, 13, 4991–5004. [Google Scholar]
  30. Zhang, C.; Zhu, Y.; Dong, G.; Wei, J. Data-driven lithium-ion battery states estimation using neural networks and particle filter-ing. Int. J. Energy Res. 2019, 43, 8230–8241. [Google Scholar]
  31. Tong, Z.; Miao, J.; Mao, J.; Wang, Z.; Lu, Y. Prediction of Li-ion battery capacity degradation considering polarization recovery with a hybrid ensemble learning model. Energy Storage Mater. 2022, 50, 533–542. [Google Scholar] [CrossRef]
  32. Meng, H.; Geng, M.; Xing, J.; Zio, E. A hybrid method for prognostics of lithium-ion batteries capacity considering regeneration phenomena. Energy 2022, 261, 125278. [Google Scholar] [CrossRef]
  33. Harper, G.; Sommerville, R.; Kendrick, E.; Driscoll, L.; Slater, P.; Stolkin, R.; Walton, A.; Christensen, P.; Heidrich, O.; Lambert, S.; et al. Recycling lithium-ion batteries from electric vehicles. Nature 2019, 575, 75–86. [Google Scholar] [CrossRef] [Green Version]
  34. Greenbank, S.; Howey, D. Automated feature extraction and selection for data-driven models of rapid battery capacity fade and end of life. IEEE Trans. Ind. Inform. 2021, 18, 2965–2973. [Google Scholar] [CrossRef]
  35. Cai, L.; Lin, J.; Liao, X. An estimation model for state of health of lithium-ion batteries using energy-based features. J. Energy Storage 2022, 46, 103846. [Google Scholar] [CrossRef]
  36. Liu, W.; Xu, Y. Data-driven online health estimation of Li-ion batteries using a novel energy-based health indicator. IEEE Trans. Energy Convers. 2020, 35, 1715–1718. [Google Scholar] [CrossRef]
  37. Chen, Z.; Zhao, H.; Zhang, Y.; Shen, S.; Shen, J.; Liu, Y. State of health estimation for lithium-ion batteries based on temperature prediction and gated recurrent unit neural network. J. Power Sources 2022, 521, 230892. [Google Scholar] [CrossRef]
  38. Dubarry, M.; Anseán, D. Best practices for incremental capacity analysis. Front. Energy Res. 2022, 10, 1023555. [Google Scholar] [CrossRef]
  39. Ma, Z.; Yang, R.; Wang, Z. A novel data-model fusion state-of-health estimation approach for lithium-ion batteries. Appl. Energy 2019, 237, 836–847. [Google Scholar] [CrossRef]
  40. Zhao, S.; Zhang, C.; Wang, Y. Lithium-ion battery capacity and remaining useful life prediction using board learning system and long short-term memory neural network. J. Energy Storage 2022, 52, 104901. [Google Scholar] [CrossRef]
  41. Lin, C.; Xu, J.; Shi, M.; Mei, X. Constant current charging time based fast state-of-health estimation for lithium-ion batteries. Energy 2022, 247, 123556. [Google Scholar] [CrossRef]
  42. Zhang, Z.; Min, H.; Guo, H.; Yu, Y.; Sun, W.; Jiang, J.; Zhao, H. State of health estimation method for lithium-ion batteries using incremental capacity and long short-term memory network. J. Energy Storage 2023, 64, 107063. [Google Scholar] [CrossRef]
  43. Hoque, M.A.; Nurmi, P.; Kumar, A.; Varjonen, S.; Song, J.; Pecht, M.G.; Tarkoma, S. Data driven analysis of lithium-ion battery internal resistance towards reliable state of health prediction. J. Power Sources 2021, 513, 230519. [Google Scholar] [CrossRef]
  44. Dubarry, M.; Beck, D. Analysis of synthetic voltage vs. capacity datasets for big data Li-Ion Diagn. Progn. Energ. 2021, 14, 2371. [Google Scholar]
  45. Naumann, M.; Schimpe, M.; Keil, P.; Hesse, H.C.; Jossen, A. Analysis and modeling of calendar aging of a commercial LiFePO4/graphite cell. J. Energy Storage 2018, 17, 153–169. [Google Scholar] [CrossRef]
Figure 1. IE curves under two different charging rates.
Wevj 14 00188 g001
Figure 2. The IE aging curves under two different charging rates: (a) IE aging curves at 0.2C and (b) IE aging curves at 0.1C.
Wevj 14 00188 g002
Figure 3. Basic structure of an LSTM.
Wevj 14 00188 g003
Figure 4. BiLSTM structure.
Wevj 14 00188 g004
Figure 5. The battery testing system.
Wevj 14 00188 g005
Figure 6. SOH measurements of the two lithium ion batteries.
Wevj 14 00188 g006
Figure 7. The proposed framework for battery SOH estimation.
Wevj 14 00188 g007
Figure 8. SOH estimation results under two different charging rates: (a) 0.2C and (b) 0.1C.
Wevj 14 00188 g008
Figure 9. Comparative results of SOH estimation under two different charging rates: (a) 0.2C and (b) 0.1C.
Wevj 14 00188 g009
Table 1. Results for the correlation coefficient between all aging peaks and SOH.
Charging RateI PeakII PeakIII PeakIV Peak
0.2C0.97230.98950.91150.9873
0.1C0.97150.98720.95660.9896
Table 2. Battery specifications.
SpecificationValue
Rated capacity2.4 Ah
Normal voltage3.6 V
Allowed voltage range3 V~4.2 V
End-of-charge current48 mA
Max charging/discharging current2400 mA/1200 mA
Table 3. SOH estimation performance for the two different charging rates.
Charging RateMAE (%)RMSE (%)R2
0.2C0.24370.27450.9872
0.1C0.25850.33580.9831
Table 4. Performance index of the comparative experiment.
Charging RateEstimation MethodMAE (%)RMSE (%)R2
0.2CBiLSTM0.24370.27450.9872
LSTM0.33410.40960.9764
SVM0.36040.47240.9406
ELM0.41830.52670.9379
0.1CBiLSTM0.25850.33580.9831
LSTM0.30140.34990.9421
SVM0.26880.33480.9471
ELM0.44150.52770.9435
Disclaimer/Publisher’s Note: The statements, opinions and data contained in all publications are solely those of the individual author(s) and contributor(s) and not of MDPI and/or the editor(s). MDPI and/or the editor(s) disclaim responsibility for any injury to people or property resulting from any ideas, methods, instructions or products referred to in the content.

