Article

An Improved Gaussian Process Regression Based Aging Prediction Method for Lithium-Ion Battery

1
School of Information Engineering, Southwest University of Science and Technology, Mianyang 621010, China
2
Tianfu Institute of Research and Innovation, Southwest University of Science and Technology, Chengdu 610299, China
3
School of Manufacturing Science and Engineering, Southwest University of Science and Technology, Mianyang 621010, China
*
Author to whom correspondence should be addressed.
World Electr. Veh. J. 2023, 14(6), 153; https://doi.org/10.3390/wevj14060153
Submission received: 13 May 2023 / Revised: 5 June 2023 / Accepted: 7 June 2023 / Published: 9 June 2023
(This article belongs to the Special Issue Lithium-Ion Batteries for Electric Vehicle)

Abstract

:
A reliable aging-prediction method is significant for lithium-ion batteries (LIBs) to prolong the service life and increase the efficiency of operation. In this paper, an improved Gaussian-process regression (GPR) is proposed to predict the degradation rate of LIBs under coupled aging stress to simulate working conditions. The complicated degradation processes at different ranges of the state of charge (SOC) under different discharge rates were analyzed. A composed kernel function was conducted to optimize the hyperparameter. The inputs for the kernel function of GPR were improved by coupling the constant and variant characteristics. Moreover, previous aging information was employed as a characteristic to improve the reliability of the prediction. Experiments were conducted on a lithium–cobalt battery at three different SOC ranges under three discharge rates to verify the performance of the proposed method. Some tips to slow the aging process based on the coupled stress were discovered. Results show that the proposed method accurately estimated the degradation rate with a maximum estimation root-mean-square error of 0.14% and regression coefficient of 0.9851. Because of the proposed method’s superiority to the exponential equation and GPR by fitting all cells under a different operating mode, it is better for reflecting the true degradation in actual EV.

1. Introduction

As a green energy source with high energy and power densities, a long life, and a low self-discharge rate, lithium-ion batteries (LIBs) are indispensable components of electric vehicles (EVs) [1,2,3,4]. In the battery-management system (BMS) of EVs, as the basis of evaluating battery performance, the state of health (SOH) plays a significant role in the reasonable use and replacement with LIBs for the control unit [5,6,7,8]. Because of the complicated internal electro-chemical processes, LIBs are regarded as an intensively non-linear time-varying system. That makes it a challenge to estimate the SOH accurately. In order to explore the degradation mechanism of LIBs at work, the effect of aging stress has been studied in different operating modes.
The capacity degradation of LIBs during operation is mainly caused by loss of lithium inventory (LLI), loss of active material (LAM), and incremental changes in resistance [9,10]. These are affected by the charging rate, discharge rate, cut-off voltage of the charge and discharge, temperature, the depth of discharge (DOD) and the SOC range, etc. [11,12,13]. Ref. [14] demonstrated that the solid electrolyte interface (SEI) can be extensively reinforced by carrying the formation cycles at elevated temperatures. Under these conditions, decomposition of the ionic liquid present in the electrolyte favored the formation of a thicker and more protective layer. The influence of temperature on the degradation mechanism was investigated by analyzing the incremental-capacity (IC) curves in [15]. A joint grey relational-analysis-based SOH estimation method considering temperature effects was proposed to explore the degradation mechanism of LIBs at different temperatures and a generic temperature regressive model was developed. The long-term effects of charging current rates and cut-off voltages on capacity degradation and resistance increase were compared in [16]. When the charging stress exceeded the critical value, battery-degradation speed was greatly accelerated. Therefore, the charging current and cut-off voltage needed to be reduced to retard battery degradation when the battery degraded to a certain extent. A higher SOC indicated higher terminal voltage, which led to a greater electric-potential difference between the anode and cathode. The side-reaction rate to LAM was higher because of the higher SOC range, resulting in a higher aging rate for the LIBs [17]. Degradation mechanisms for cycle aging at high and low temperatures as well as increased cycling degradation at a high SOC were calculated separately in [18]. Comparing the CC (constant current) and CC-CV (constant voltage) tests at low temperatures, the additional CV charging at a higher SOC led to a strong increase in capacity loss, which was even more pronounced at the higher current rate. A degradation mechanism in 26 Ah commercial Li-ion battery cells comprising graphite as the negative electrode and a mixed metal oxide of LiMn2O4 (LMO) and LiNi1/3Mn1/3Co1/3O2 (NMC) as the positive electrode were investigated, and it was found that the cycle life was shorter for the cell cycled in the higher SOC range, which was correlated to the increased cell resistance and thickness of the SEI layer in the graphite electrode and the manganese dissolution from the positive electrode [19]. The research in [20] showed that cells cycled with high cut-off voltages and a wide SOC range (20% to 95%) were severely affected by material degradation and electrode shift, whereas a high cut-off voltage and a narrow SOC range (65% to 95%) caused greater electrode degradation but negligible cell unbalance.
Besides the research on the electrochemical principle of different operations, there is a large number of studies on the relationship between the single stress of temperature, the rate of charging and discharging, the SOC range and DOD, etc., and the degradation rate of LIBs. In the actual working condition, every stress is coupled with each other. For example, a high discharging rate will accelerate the degradation rate, as will high temperature, but the effect of these two stresses is greater than the sum of each because these stresses are not independent but coupled with each other. Instead of remaining unchanged in actual working conditions, aging stresses are mutually related to each other. For double aging stresses, if one is outside of the working threshold, the other one is the major factor for degradation. Otherwise, they couple with each other to affect the degradation of LIBs.
A Gaussian process (GP) is a stochastic process that is, in general, a collection of random variables indexed by time or space. The inference of continuous variables leads to Gaussian-process regression (GPR), where the prior GP model is updated with training data to obtain a posterior GP distribution. GPR is good at solving high-dimensional, small-sample regression classification because of simple training models, flexible nonparametric inference, and hyper-parameter adaptive acquisition. Nevertheless, GPR is less effective for problems with larger training sets because there is a large number of matrix-inversion operations to increase the calculation amount and execution time.
In this paper, the coupled stress of the SOC range and discharge rate is studied to analyze the degradation mechanism of LIBs at a normal temperature. An improved Gaussian-process-regression (GPR) method is proposed to ameliorate the prediction of the degradation rate. The remainder of this paper is organized as follows. In Section 2, aging regimens are introduced and the degradation mechanisms are analyzed. Section 3 describes the exponential equation and the proposed method to predict the degradation rate under coupled aging stress. The performances of the proposed method and exponential equation are discussed in Section 4. Conclusions are presented in the final section.

2. Experiments

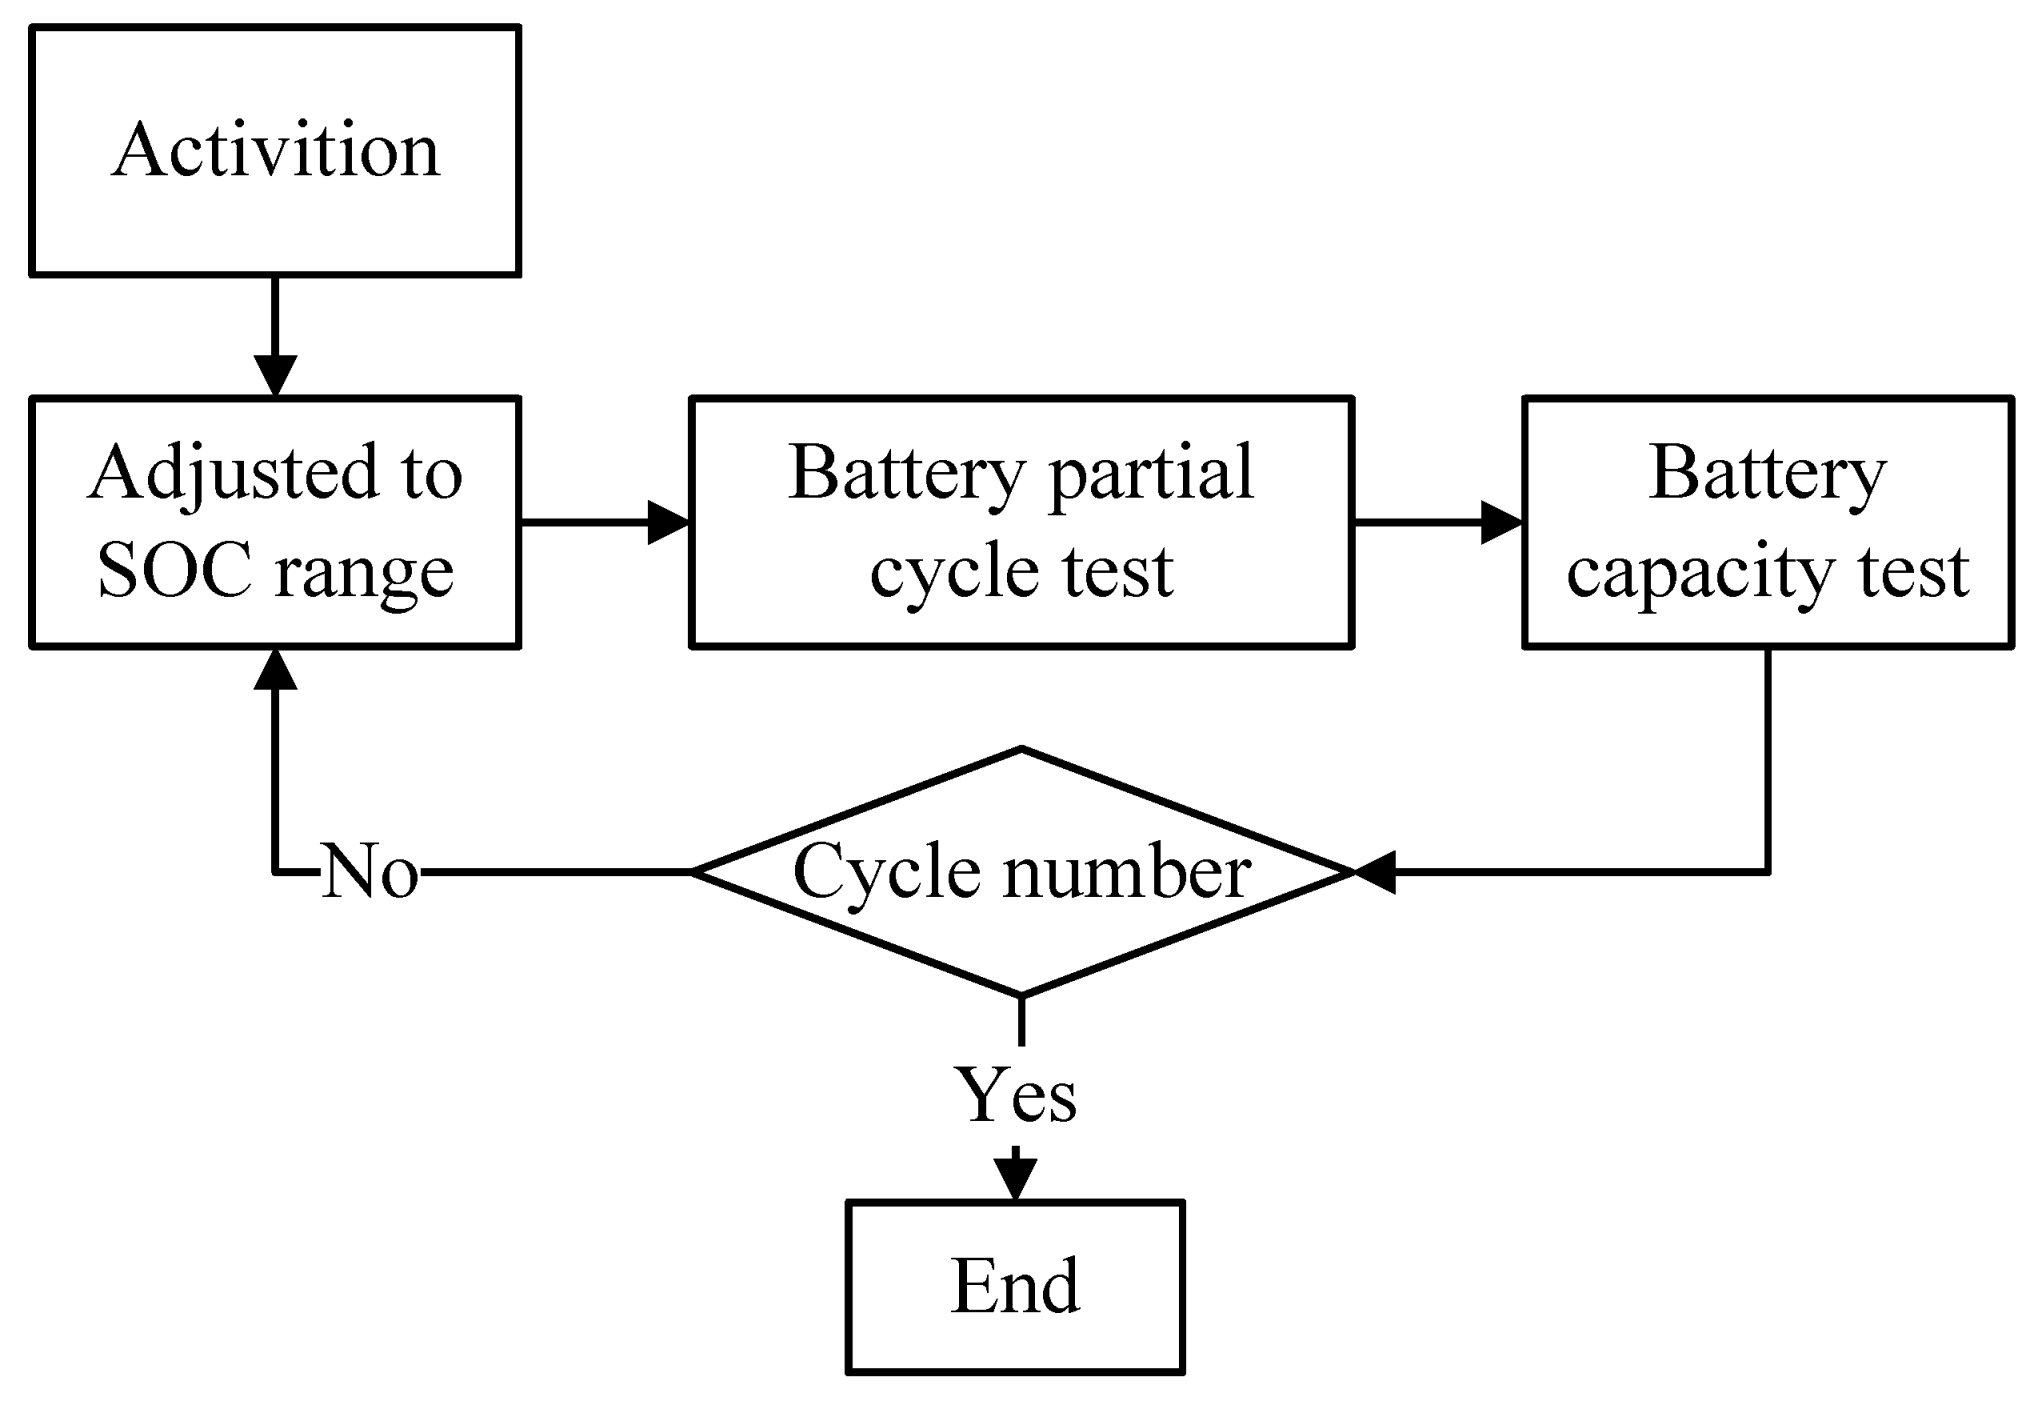
2.1. Aging Protocols

All experiments were performed on a MACCOR Series 4000 battery-test bench with eight channels, as shown in Figure 1. The current range was −10 to 10 A with an accuracy of ±0.05% full scale, and the voltage range was 0 to 5 V with accuracy of 1 mV. The temperature chamber was from HONGZHAN-PLB150, and had a temperature range of −20 to 120 °C with a fluctuation of ±0.5 °C and a deviation of ±2 °C. Commercial high-rate charge/discharge 18650 cylindrical cells (1.5 Ah, ICR18650HB4, LG) containing LiCoO2 as the positive electrode and graphite as the negative electrode were used in this study. The manufacturer specifications for the cells are presented in Table 1.
Considering the most common battery-operation scenarios, the wide SOC range was set to be 15–90% (75% DOD) with a middle SOC of 52.5%, and it was divided into three equal ranges (25% DOD), with middle SOCs of 27.5%, 52.5%, and 72.5%. In order to investigate the degradation effects of coupled stress, cells were cycled in four different SOC ranges: 15–40%, 40–65%, 65–90%, and 15–90% at three different discharge rates: 2 C, 6 C, and 10 C, where 1 C is 1.5 A. The end of the test was set for when cells cycled in the narrow SOC range (15–40%, 40–65%, and 65–90%) reached 1500 partial cycles and cells cycled in the wide SOC range (15–90%) reached 700 partial cycles.
The experiment included four steps, as shown in Figure 2: (1) activation to obtain the actual battery capacity, (2) adjustment to make the battery work in the special SOC range, (3) a partial-cycle test to obtain the effect of coupled aging stress, and (4) a battery-capacity test to obtain the capacity after the partial-cycle test.
(1)
Activation
According to the electric-vehicle-battery test-procedure manual, the cells should be activated before the aging-cycle tests. (1). The battery cell was discharged at a constant current of 0.5 C to 2.5 V, where C is the rated capacity of the battery cell in ampere hours, and then took an hour to rest. (2). The battery cell was charged at a constant current of 0.5 C to 4.2 V followed by a constant voltage charge until the charge current dropped below 0.05 C, which allowed the battery cell to be fully charged. This fully charged battery cell was given 1 h of rest. (3). The battery cell was discharged at a constant current of 1 C until the battery voltage fell to 2.5 V and the discharge capacity was measured. The activation eliminated the film generated in the productive process to improve the internal activity. This process was repeated three times to obtain the actual battery capacity by taking the average value of three successive capacities. The battery capacity was considered stable when the differences of these three successive capacities were within 2%.
(2)
Adjustment
After the activation or capacity test, the SOC range of the battery should be adjusted to the appropriate starting point. (1). The cell was be fully charged at a constant current of 0.5 C to 4.2 V followed by a constant voltage charge until the charge current dropped below 0.05 C and then took an hour rest. (2). The cell was discharged at 0.2 C for the corresponding time listed in Table 2.
(3)
Battery Partial-Cycle Test
The aging-cycle tests began with a discharge rate corresponding to the end of the SOC range, followed by a rest (20 min for narrow SOC range, 40 min for wide SOC range). Then, the battery cell was charged with 1 C back to the SOC starting point, followed by an appropriate rest. After we repeated the aging-cycle tests 100 times for the narrow SOC range and 50 times for the wide SOC range, the battery cell was rested for 10 h, and then the capacity tests were carried out.
(4)
Battery-Capacity Test
The capacity tests began with a 0.5 C constant current discharge of the battery cell to 2.5 V, followed by an hour of rest. Then, the cells were charged with a 0.5 C constant current charge to 4.2 V, followed by a constant voltage charge until the charge current dropped below 0.05 C. The fully charged battery cell was given an hour to rest. After that, the capacity of the battery cell was assessed by a 1 C constant discharge to 2.5 V.
The final degradation rates of the 12 cells and the role of each cell are presented in Table 3. Nine cells were marked with a “√” symbol to identify the parameters of the aging model, and three cells of the narrow SOC range were marked with a “?” symbol to verify the performance of the proposed model.

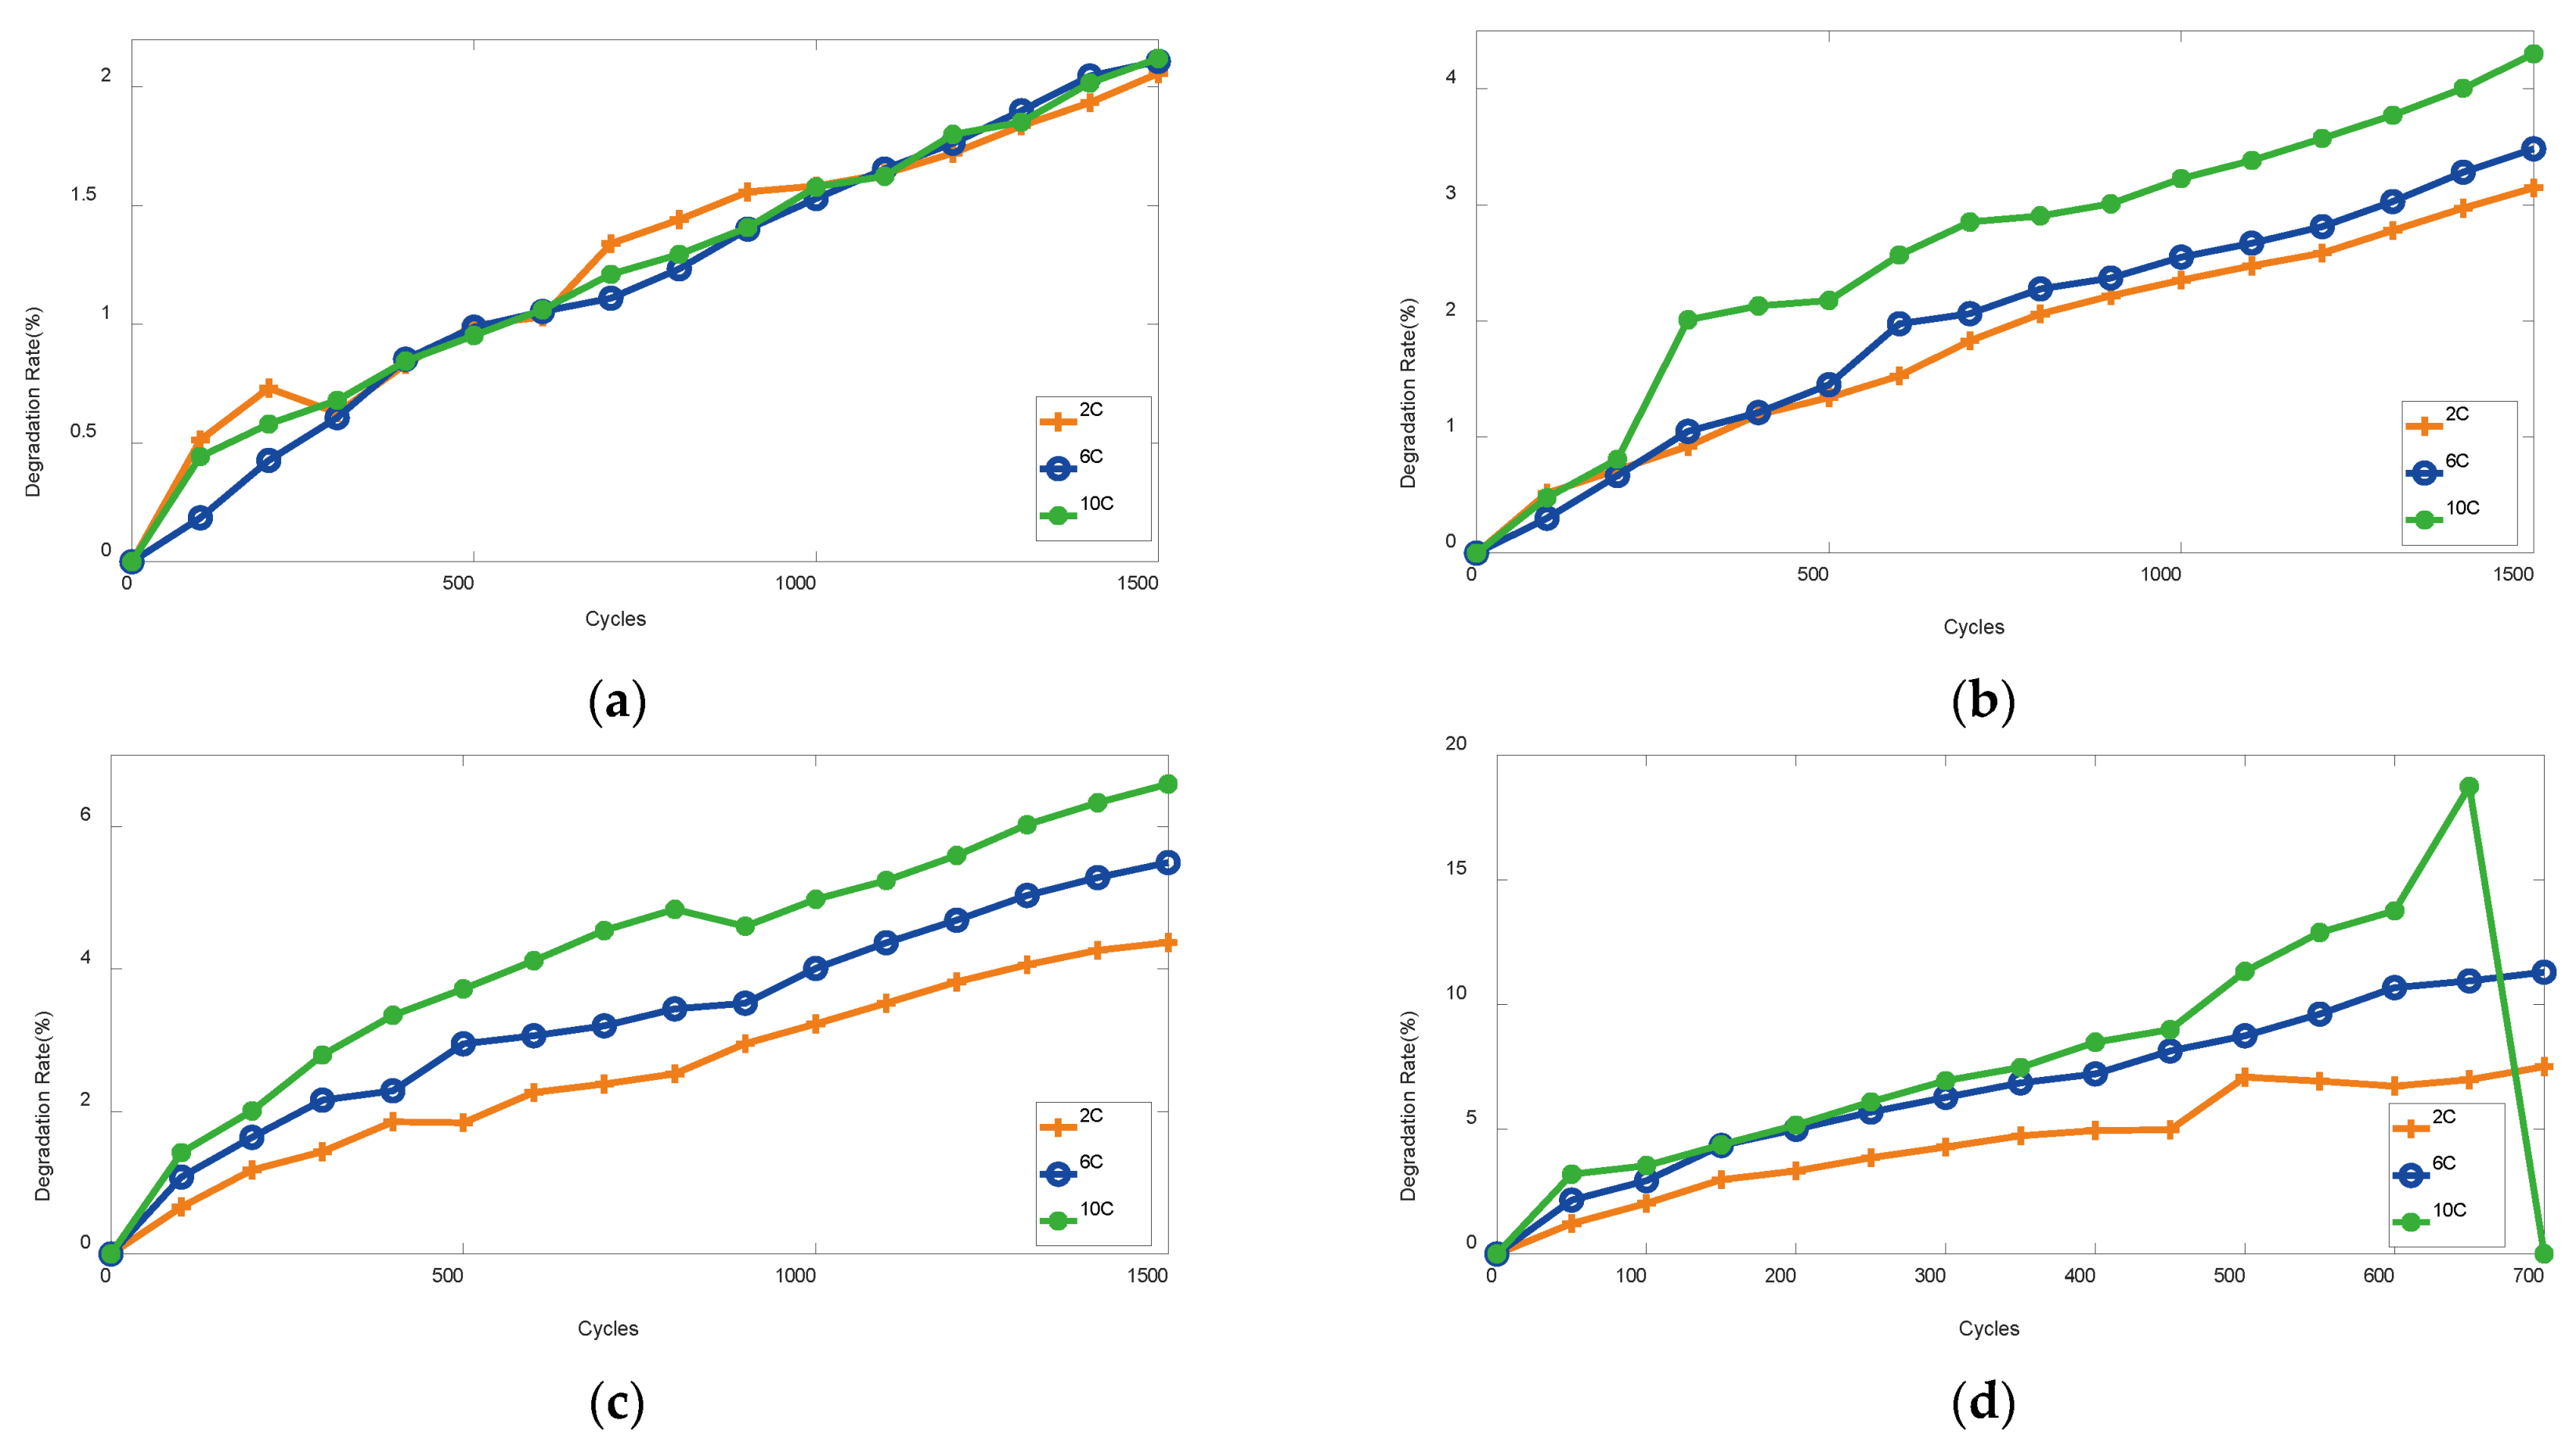
2.2. Experimental Results

The degradation rates of the 12 cells are illustrated in Figure 3 and listed in Table 4.
The three cells cycled with an SOC range of 15–40% under different discharge rates are shown in Figure 3a. After 1500 partial cycles, the degradation rates of cells discharged with 2 C, 6 C, and 10 C were 2.057%, 2.108%, and 2.12%, respectively. The degradation trends of the three cells were similar. This reveals that the discharge rate had little influence on cells degrading in the low SOC range. Figure 3b displays the degradation rates of cells cycled in moderate SOC, which ranged from 40% to 65%. After 1500 partial cycles, the degradation rates of cells discharged with 2 C, 6 C, and 10 C were 3.147%, 3.483%, and 4.302%, respectively. The cell with 6 C degraded 0.336% more than the one with 2 C, whereas the cell with 10 C degraded 0.819% more than the one with 6 C. The curves reveal that the discharge rate had more effect than the SOC range on the cell in the moderate SOC range. The degradation rate of the cell with 10 C accelerated from the beginning because of the creation of SEI. The degradation rates of the cells discharged with 2 C, 6 C, and 10 C in the high SOC range of 65–90% were 4.372%, 5.494%, and 6.595%, respectively, which is shown in Figure 3c. The cell with 6 C degraded 1.122% more than the one with 2 C, whereas the cell with 10 C degraded 1.101% more than the one with 6 C. The degradation trends of all three cells flattened after a rapid change because of the increased LAM and SEI based on the high voltage. The dominant aging stress should have been the discharging rate for the cell in the high SOC range. The three cells cycled with a wide SOC range of 15–90% under different discharge rates are shown in Figure 3d. After 650 partial cycles, the degradation rates of cells discharged with 2 C, 6 C, and 10 C were 6.989%, 10.951%, and 18.753%, respectively. The curve of the cell with 10 C rose quickly after 500 cycles because of the sudden collapse of the cathode active material. When a LIB is cycled in a wide SOC range with a high discharge rate, the frequent deep intercalation and deintercalation of lithium ions induces great mechanical stress in the electrode active material particles, increasing the damage to the crystal structure of the electrode material. The durability and stability of the cathode deteriorate with the gradual decline of the cathode active material, inducing the sudden collapse of the cathode active material. Therefore, discharge rate became the major influencer after 500 cycles, and the cell became damaged between cycles 650 and 700. In addition, we should be aware of the regularities of cells cycled with the same discharging rate in different SOC ranges. The degradation rate of a high SOC range (65–90%) is higher than that of a moderate SOC range (40–65%) with the same discharge rate, whereas the degradation rate of a moderate SOC range is higher than that of a low SOC range (15–40%) with the same discharge rate.
There were also some interesting patterns under different operation modes. The degradation rate of the low SOC range was slower than that of the moderate SOC range, and that of the high SOC range was the fast. Furthermore, the aging trend of the low SOC range was appropriately linear, whereas the trend line of the high SOC range flattened after a rapid change, as the higher slope was accompanied by a faster discharge rate. By analyzing the degradation mechanistic, the aging in the low SOC range was determined to be mainly due to the LLI, whereas the aging in the moderate SOC range was mainly due to the LLI, with a slight LAM. Moreover, the degradation in the high SOC range was induced by the LLI and LAM of both positive and negative electrodes. In the case of ensuring power and energy, the cells should be working in the low SOC range as much as possible to prolong their lives.
In the wide SOC range, there would have been a significant amount of heat because of the high discharge rate of 6 C and 10 C. With the long discharge time, the two cells of 6 C and 10 C had similar degradation trends with the aging dominant stress of temperature. Heat radiation is important for cells with long-term high discharge rates. The discharge rate should be limited for degraded cells in order to avoid the sudden collapse of weak electrodes.

3. Methodology

For the complex electrochemical reaction inside the LIBs, the electrochemical parameters of LIBs coupled with aging stress, such as solid-phase diffusion coefficients, solution-phase conductivity, solution-phase diffusion coefficient, and the electrochemical-reaction rate, obey the Arrhenius law [21,22]. Therefore, the exponential equation was selected to fit the relationship of the degradation rate at first. In order to address the deficiency issue of predicting the degradation on different aging stages, GPR was employed because of its ability to solve high-dimensional, nonlinear, and small-sample regression problems based on probability theory. The input and the kernel function of GPR should be selected based on the degradation properties of the cells. Therefore, the single aging stress and single kernel function are too simple to satisfy the demand of the complex degradation of LIBs. A composed kernel function was proposed to improve the prediction of GPR with optimized input characteristics.

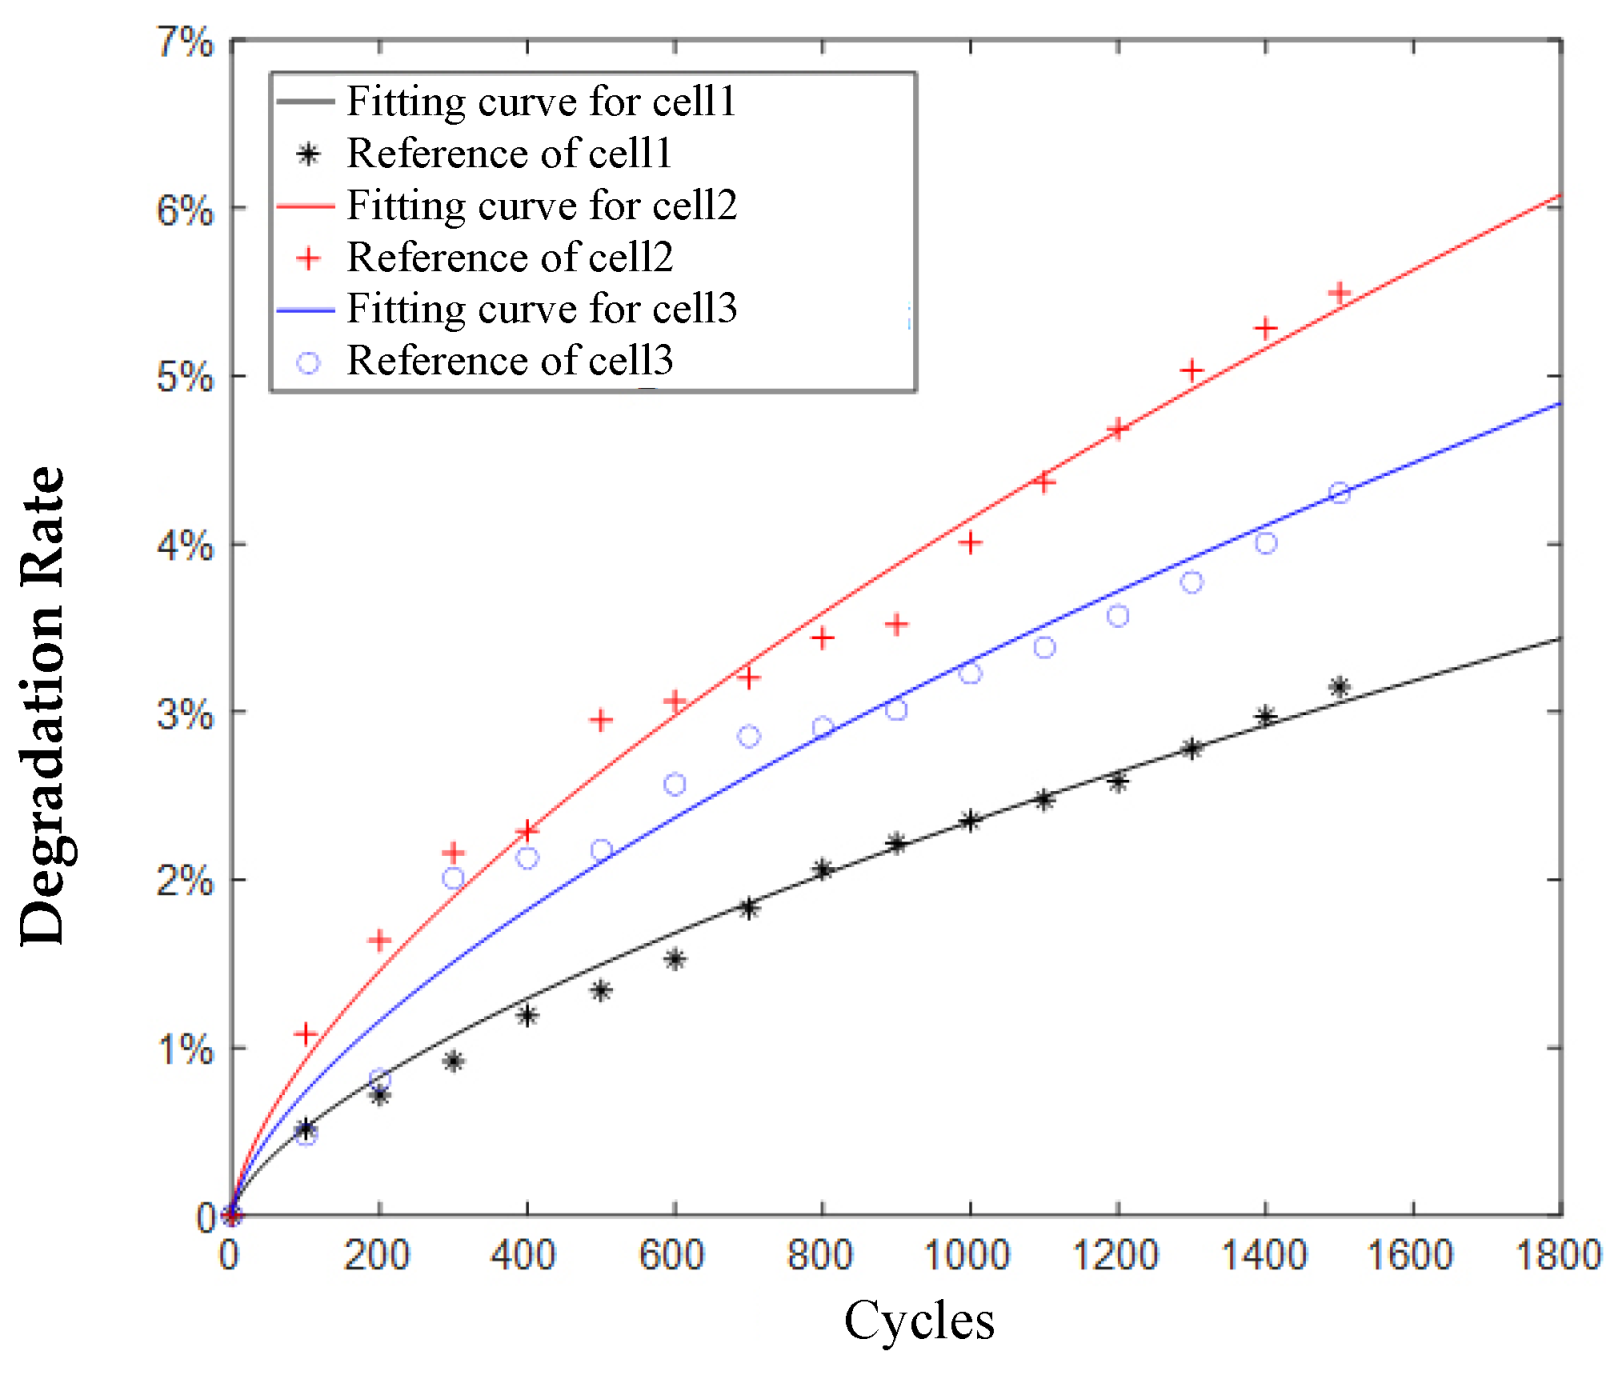
3.1. Exponential Equation

A first principle of a one-dimensional model involving solvent diffusion and kinetics for capacity fade in a lithium-ion battery is presented in [23]. The variation of the rate constant of the SEI-film-formation reaction and the solvent diffusivity were found to follow an Arrhenius-type relationship. Therefore, we transformed the Arrhenius law into Equation (1) to fit the degradation data shown in Table 4.
Q l o s s = A 1000 ( E c 100 ) b
where Q l o s s is the degradation rate, E c represents the equivalent cycles to discharge the equivalent capacity, and A and b are the undetermined parameters for different discharge modes.
The exponential-fitting coefficients for different operating modes are listed in Table 5. The value of b varies between 0.62 and 0.68, so it was set to 0.65 to simplify the computation. The value of A was different because of the discharge rate, SOC range, and DOD, so it should be obtained from a function of single aging press of the discharge rate (Cdis), the mid-value of the SOC range (SOCm) with DOD to indicate different SOC ranges, a double aging press of the mid-value of SOC range (SOCm) coupled with the discharge rate (Cdis), and DOD coupled with the discharge rate (Cdis), as in Equation (2).
A = k 1 S O C m + k 2 D O D + k 3 C d i s + k 4 S O C m C d i s + k 5 D O D C d i s
where k1, k2, k3, k4, and k5 are the coefficients of each aging press. They can be calculated by recursive least square (RLS) and are listed in in Table 6.

3.2. Gaussian-Process Regression

The Gaussian process is a kind of stochastic process that quantitatively describes the dynamic relationship of random events in time series, with the random process satisfying normal distribution. The probability density of a one-dimensional Gaussian process can be represented as in Equation (3) [24].
N ( x | μ , δ 2 ) = 1 2 π δ 2 exp ( ( x μ ) 2 2 δ 2 )
where μ is the mean value, and δ 2 is the covariance.
If the mean-vector-and-covariance matrix is multidimensional, the Gaussian process can be determined in Equation (4) [24].
f ( x ) G P ( m ( x ) , k ( x , x ) )
where m ( x ) = E [ f ( x ) ] is the mean function, and k ( x , x ) = E [ ( m ( x ) f ( x ) ) ( m ( x ) f ( x ) ) ] is the covariance function, which is also called the kernel function. It can quantify the relevance between two random variables: x and x .
Gaussian-process regression is defined as in Equation (5).
y = f ( x ) + ε
where x is the input variable, y is the output, and ε is the white noise, with a mean of 0 and variance of σ n 2 . The prior distribution of observations can be expressed as Equation (6). Meanwhile, the joint prior distribution of the training-set output and testing-set output is shown in Equation (7) [24].
y N ( 0 , K ( X , X ) + σ n 2 I n )
[ y f * ] = N ( 0 , [ K ( X , X ) + σ n 2 I n K ( X , X * ) K ( X , X * ) T K ( X * , X * ) ] )
where y is the output vector of the training-input vector X , f * is the output vector of the testing-input vector X * , K ( X , X ) is the symmetric positive definite matrix (kernel matrix), and I n is the identity matrix.
Based on Bayesian theory, the posteriori distribution can be derived from the prior distribution as in Equation (8) [24].
f * | X , y , X * N ( f * | f * ¯ , cov ( f * ) )
where
f * ¯ = K ( X , X * ) T [ K ( X , X ) + σ n 2 I n ] 1 y
cov ( f * ) = K ( X * , X * ) K ( X , X * ) T [ K ( X , X ) + σ n 2 I n ] 1 K ( X , X * )
If the hyperparameter set of the kernel function is θ , the maximum posterior estimation can be expressed as in Equation (11).
p ( θ | y , X ) = p ( y | X , θ ) p ( θ ) p ( y | X )
The optimal solution of θ should be transformed to a negative logarithmic-likelihood function as in Equation (12) because of the lack of prior information of θ . Equation (13) is the partial derivative of θ [24]. A penalty term of complexity is employed as 1 2 log | K ( X , X ) + σ n 2 I n | in Equation (12) to avoid potential overfitting.
L ( θ ) = log p ( y | X , θ ) = 1 2 y T ( K ( X , X ) + σ n 2 I n ) 1 y 1 2 log | K ( X , X ) + σ n 2 I n | n 2 log 2 π
{ L ( θ ) θ = 1 2 t r [ ( α α T C 1 ) C θ ] α = [ K ( X , X ) + σ n 2 I n ] 1 y C = K ( X , X ) + σ n 2 I n

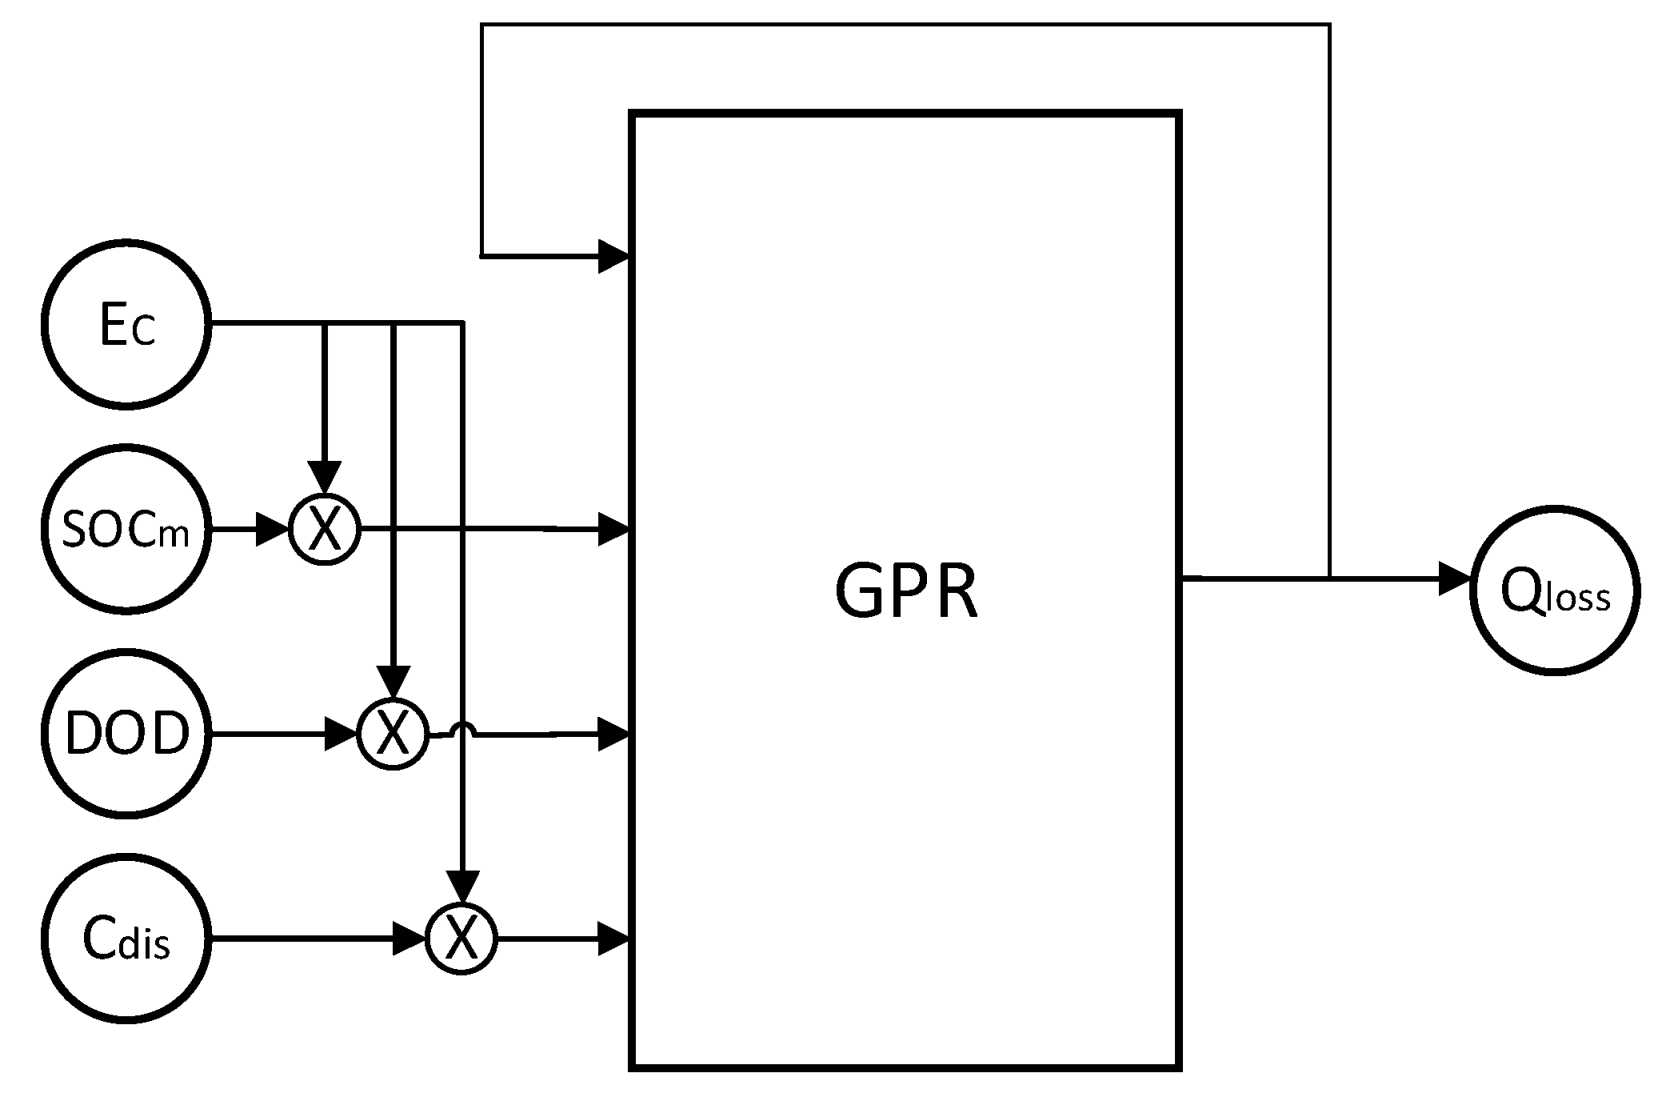
3.3. Improved Gaussian-Process Regression

There are various forms of kernel functions for different subjects, such as the squared-exponential (SE) function, the rational-quadratic (RQ) function, the Matern function, the linear (LIN) function, etc. The SE function, RQ function, and Matern function are good at describing local properties, and the LIN function is skilled at expressing global features. The degradation of LIBs is too complicated for a single kernel function, so a new kernel function combining the Matern function and LIN function was created to optimize the hyperparameter. The root-mean-square error (RMSE) of each function, calculated with Equation (14), is represented in Table 7. The initial hyperparameters were set to 0 and the conjugate gradient was employed to optimize the hyperparameter of different kernel functions.
RMSE = 1 N i = 1 n ( D r i D r i ) 2
where D r i is the reference degradation rate, and D r i is the estimated degradation rate.
According to Table 7, the RMSE of SE, RQ, and Matern was reduced through the combination with LIN, as the Matern + LIN function had the minimum RMSE. LIBs have different decay rates in the degradation process, as the value of the Matern function decreases more quickly if the distance is greater. Meanwhile, the LIN function can enhance the predictive power because the degradation trend is approximately linear as a whole. Therefore, Matern + LIN was selected as the kernel function for LIB degradation.
The mid-value of the SOC range, the DOD, the rate of discharge, and the discharge cycle played the role of characteristics as the input of the GPR. Nevertheless, the invariance of nearly all inputs except the discharge cycle led to poor hyperparameter optimization. In order to avoid potential overfitting by unchanged input parameters, we coupled the invariant characteristics with the variant characteristic to preserve both pieces of characteristic information at the same time. Furthermore, the previous information regarding the degradation was employed as an input to improve the prediction accuracy. As a consequence, the inputs of the improved GPR model were the mid-value SOC range (SOCm) coupled with the discharge cycle (Ec), the DOD coupled with the discharge cycle (Ec), the discharge rate (Cdis) coupled with the discharge cycle (Ec), and the previous loss capacity (Qloss), as shown in Figure 4.

4. Results and Discussion

As shown in Table 3, the cells cycled in the 45~65% SOC at a discharge rate of 2 C (cell 1), in the 45~65% SOC at a discharge rate of 10 C (cell 2), and the 65~90% SOC at discharge rate of 6 C (cell 3) were employed to verify the performance of the proposed method. The A, calculated with Equation (2) and shown in Table 6, was 10.8, 15.06, and 18.98 for cell 1, cell 2, and cell 3, respectively. The exponential-fitting curves with the calculated A and a b of 0.65 are indicated in Figure 5 and the performance is listed in Table 8, where the regression coefficient (R2) represents the goodness of fit, which can be calculated by Equation (15).
R 2 = 1 i = 1 n ( D r i D r i ) 2 i = 1 n ( D r i D r ¯ i ) 2
where D r ¯ i is the average value of D r i . The closeness of R2 to 1 indicates the fitting precision of the model.
In Figure 5, the best exponential-fitting curve was for cell 1, which cycled in the 45~65% SOC at a discharge rate of 2 C. Its goodness of fit was 0.9895, with an RMSE of 0.09%. The exponential-fitting curve for cell 2 cycled in the 45~65% SOC at a discharge rate of 10 C behaved well in the latter part but unsatisfactorily in the first part. The reference degradation rates were obviously greater than the fitting value because the high discharge rate gave rise to the generation of the SEI. After a few cycles, the SEI was established and tended toward steadiness. As a result, the goodness of fit was 0.965, with an RMSE of 0.17%. Meanwhile, the exponential-fitting curve for cell 3, which cycled in the 65~90% range at a discharge rate of 6 C, shows good fitness in the first and the end stages but slightly worse fitness in the middle segment. This phenomenon was mostly due to the increased LAM and SEI. As the discharge rate of 6 C was less than 10 C, the estimation speed of SEI was slower. The coupled effect of LAM and SEI was plenty, but there was a slight difference between the fitting curve and the reference data. As a consequence, the goodness of fit was 0.9858 but the RMSE was 0.22%. Furthermore, the degradation rate of cell 3 was fastest because coupled aging stress is more effective on battery degradation.
An improved GPR was proposed to try to represent the changes in the electrochemical process of the battery under operation. Its performance was compared with the exponential equation, as shown in Figure 6, where EE represents the exponential equation, IGPR represents the improved IGPR, and CI represents the confidence interval. The detailed performance of different methods is listed in Table 8.
Results show that the improved GPR was superior to the exponential equation and GPR. Because cell 1 was cycled in the moderate SOC range at a moderate discharge rate, the fitting curve of the improved GPR was more linear than that of the exponential fitting. For the cells cycled at a high discharge rate, there were two turnings to indicate the electrochemical changes according to the coupled aging stress. It fit better than that of the exponential equation at different discharge stages, especially in the beginning.
For all three cells, the RMSE of the improved GPR was smaller than that of the other two methods, as the R2 was closer to 1 than for the other two. For the improved GPR, the RMSE of cell 1, cell 2, and cell 3 was 0.03%, 0.14%, and 0.08%, respectively, which is smaller than that of exponential equation at 0.09%, 0.22%, and 0.17%, respectively, and that of GPR at 0.15%, 0.20%, and 0.17%, respectively. The regression coefficient of the improved GPR was 0.9985, 0.9851, and 0.9964 for the three cells, respectively, and that of the exponential equation was 0.9895, 0.9650, 0.9858, that of GPR was, 0.9698, 0.9715, and 0.9862. The comparison indicates that the improved GPR could fit all cells under different operating modes even with a high discharge rate under a high SOC range, whereas there was a discrepancy in the effect of the other two methods for different operations.
The average RMSE for all three cells by the improved GPR was 0.08%, which was smaller than that of the exponential equation, at 0.16%, and that of the GPR, at 0.17%. The average regression coefficient of the improved GPR was 0.9933, which was closer to 1 than the exponential equation, at 0.9801, and at the GPR, at 0.9758. Furthermore, the improved GPR reduced the uncertainty of prediction because the confidence interval was reduced from 1.25% of the GPR to 0.4%. All of this proves that the proposed method can better track the true degradation rate and provide accurate estimation under different operating modes.

5. Conclusions

An improve Gaussian-process regression to predict the degradation rate of LIBs is proposed in this paper. The degradation rate of LIBs cycled in different SOC ranges at different discharge rates was analyzed to indicate the influencing factors at different stages. Some tips about the strategy to slow the aging process based on the coupled stress are as follows: (1) The high SOC range for operation should be avoided as much as possible, (2) the DOD should be limited, (3) the low SOC range should be selected for high-rate discharge, and (4) for long-term high-rate discharge, heat dissipation is necessary.
To describe the effect of coupled aging stress, the exponential equation and Gaussian-process regression were employed to predict the degradation rate of different operating modes. Then, characteristics coupled with previous degradation information were employed as inputs of GPR to provide as much information as possible at the same time. A composed kernel function was proposed to improve the prediction of GPR. The verification results demonstrate that the proposed method provides highly accurate degradation-rate estimation for LIBs at different operating modes, with a 0.14% RMSE and a regression coefficient exceeding 0.9851. The comparison with the exponential equation and GPR showed that the estimation results of the proposed method were closer to the reference degradation rate. Future investigation will focus on the effect of three or more coupled degradation stresses to analyze the aging mechanism of lithium-ion batteries in an actual EV.

Author Contributions

Conceptualization, W.Q.; methodology, W.Q. and Y.P.; data curation, Y.P.; software, W.Q. and Y.P.; writing—original draft preparation, W.Q.; writing—review and editing, H.D.; supervision, Z.L.; funding acquisition, W.Q. All authors have read and agreed to the published version of the manuscript.

Funding

This research was funded by the Doctoral Fund of the Southwest University of Science and Technology (grant number 17zx7111) and the Key R&D Project of the Science and Technology Department of Sichuan Province (grant number 2023YFG0224).

Data Availability Statement

The data underlying this article are available in the article.

Conflicts of Interest

The authors declare no conflict of interest.

References

  1. Cabrera-Castillo, E.; Niedermeier, F.; Jossen, A. Calculation of the State of Safety (Sos) for Lithium Ion Batteries. J. Power Sources 2016, 324, 509–520. [Google Scholar] [CrossRef] [Green Version]
  2. Hannan, M.A.; Hoque, M.D.M.; Hussain, A.; Yusof, Y.; Ker, A.P.J. State-of-the-Art and Energy Management System of Lithium-Ion Batteries in Electric Vehicle Applications:Issues and Recommendations. IEEE Access 2018, 6, 19362–19378. [Google Scholar] [CrossRef]
  3. Kouchachvili, L.; Yaïci, W.; Entchev, E. Hybrid Battery/Supercapacitor Energy Storage System for the Electric Vehicles. J. Power Sources 2018, 374, 237–248. [Google Scholar] [CrossRef]
  4. Yang, R.; Yu, G.; Wu, Z.; Lu, T.; Hu, T.; Liu, F.; Zhao, H. Aging of Lithium-Ion Battery Separators during Battery Cycling. J. Energy Storage 2023, 63, 107107. [Google Scholar] [CrossRef]
  5. Song, K.; Hu, D.; Tong, Y.; Yue, X. Remaining Life Prediction of Lithium-Ion Batteries Based on Health Management: A Review. J. Energy Storage 2023, 57, 17. [Google Scholar] [CrossRef]
  6. Wang, Y.; Li, K.; Peng, P.; Chen, Z. Health Diagnosis for Lithium-Ion Battery by Combining Partial Incremental Capacity and Deep Belief Network during Insufficient Discharge Profile. IEEE Trans. Ind. Electron. 2022, 70, 11242–11250. [Google Scholar] [CrossRef]
  7. Li, K.; Wang, Y.; Chen, Z. A Comparative Study of Battery State-of-Health Estimation based on Empirical Mode Decomposition and Neural Network. J. Energy Storage 2022, 54, 105333. [Google Scholar] [CrossRef]
  8. Wang, Y.; Li, K.; Chen, Z. Battery Full Life Cycle Management and Health Prognosis based on Cloud Service and Broad Learning. IEEE/CAA J. Autom. Sin. 2022, 9, 1540–1542. [Google Scholar] [CrossRef]
  9. Han, X.; Feng, X.; Ouyang, M.; Lu, L.; Li, J.; Zheng, Y.; Li, Z. A Comparative Study of Charging Voltage Curve Analysis and State of Health Estimation of Lithium-Ion Batteries in Electric Vehicle. Automot. Innov. 2019, 2, 263–275. [Google Scholar] [CrossRef] [Green Version]
  10. Ghosh, A.; Foster, J.M.; Offer, G.; Marinescu, M. A Shrinking-Core Model for the Degradation of High-Nickel Cathodes (Nmc811) in Li-Ion Batteries: Passivation Layer Growth and Oxygen Evolution. J. Electrochem. Soc. 2021, 168, 020509. [Google Scholar] [CrossRef]
  11. Birkl, C.R.; Roberts, M.R.; McTurk, E.; Bruce, P.G.; Howey, D.A. Degradation Diagnostics for Lithium Ion Cells. J. Power Sources 2017, 341, 373–386. [Google Scholar] [CrossRef]
  12. Han, X.; Lu, L.; Zheng, Y.; Feng, X.; Li, Z.; Li, J.; Ouyang, M. A Review on the Key Issues of the Lithium Ion Battery Degradation among the Whole Life Cycle. eTransportation 2019, 1, 100005. [Google Scholar] [CrossRef]
  13. Collath, N.; Tepe, B.; Englberger, S.; Jossen, A.; Hesse, H. Aging Aware Operation of Lithium-Ion Battery Energy Storage Systems: A Review. J. Energy Storage 2022, 55, 20. [Google Scholar] [CrossRef]
  14. Rodrigues, M.-T.F.; Sayed, F.N.; Gullapalli, H.; Ajayan, P.M. High-Temperature Solid Electrolyte Interphases (Sei) in Graphite Electrodes. J. Power Sources 2018, 381, 107–115. [Google Scholar] [CrossRef]
  15. Qu, W.; Shen, W.; Liu, J. A Joint Grey Relational Analysis Based State of Health Estimation for Lithium Ion Batteries Considering Temperature Effects. J. Energy Storage 2021, 42, 103102. [Google Scholar] [CrossRef]
  16. Gao, Y.; Jiang, J.; Zhang, C.; Zhang, W.; Ma, Z.; Jiang, Y. Lithium-Ion Battery Aging Mechanisms and Life Model under Different Charging Stresses. J. Power Sources 2017, 356, 103–114. [Google Scholar] [CrossRef]
  17. Wang, A.; Kadam, S.; Li, H.; Shi, S.; Qi, Y. Review on Modeling of the Anode Solid Electrolyte Interphase (Sei) for Lithium-Ion Batteries. NPJ Comput. Mater. 2018, 4, 15. [Google Scholar] [CrossRef] [Green Version]
  18. Schimpe, M.; von Kuepach, M.E.; Naumann, M.; Hesse, H.C.; Smith, K.; Jossen, A. Comprehensive Modeling of Temperature-Dependent Degradation Mechanisms in Lithium Iron Phosphate Batteries. J. Electrochem. Soc. 2018, 165, A181–A193. [Google Scholar] [CrossRef] [Green Version]
  19. Bjorklund, E.; Wikner, E.; Younesi, R.; Brandell, D.; Edstrom, K. Influence of State-of-Charge in Commercial LiNi0.33Mn0.33Co0.33O2/LiMn2O4-Graphite Cells Analyzed by Synchrotron-Based Photoelectron Spectroscopy. J. Energy Storage 2018, 15, 172–180. [Google Scholar] [CrossRef]
  20. Benavente-Araoz, F.; Varini, M.; Lundblad, A.; Cabrera, S.; Lindbergh, G. Effect of Partial Cycling of Nca/Graphite Cylindrical Cells in Different Soc Intervals. J. Electrochem. Soc. 2020, 167, 9. [Google Scholar] [CrossRef]
  21. Han, X.; Ouyang, M.; Lu, L.; Li, J.; Zheng, Y.; Li, Z. A Comparative Study of Commercial Lithium Ion Battery Cycle Life in Electrical Vehicle: Aging Mechanism Identification. J. Power Sources 2014, 251, 38–54. [Google Scholar] [CrossRef]
  22. Zhang, L.; Wang, L.; Hinds, G.; Lyu, C.; Zheng, J.; Li, J. Multi-Objective Optimization of Lithium-Ion Battery Model Using Genetic Algorithm Approach. J. Power Sources 2014, 270, 367–378. [Google Scholar] [CrossRef]
  23. Sankarasubramanian, S.; Krishnamurthy, B. A Capacity Fade Model for Lithium-Ion Batteries Including Diffusion and Kinetics. Electrochim. Acta 2012, 70, 248–254. [Google Scholar] [CrossRef]
  24. Yang, D.; Zhang, X.; Pan, R.; Wang, Y.; Chen, Z. A Novel Gaussian Process Regression Model for State-of-Health Estimation of Lithium-Ion Battery Using Charging Curve. J. Power Sources 2018, 384, 387–395. [Google Scholar] [CrossRef]
Figure 1. Battery-test equipment.
Wevj 14 00153 g001
Figure 2. Experimental workflow.
Wevj 14 00153 g002
Figure 3. Details of the degradation rate under different operating modes. (a) SOC range of 15–40%; (b) SOC range of 40–65%; (c) SOC range of 65–90%; (d) SOC range of 15–90%.
Wevj 14 00153 g003
Figure 4. The improved GPR model.
Wevj 14 00153 g004
Figure 5. The exponential-fitting curves and reference degradation rate.
Wevj 14 00153 g005
Figure 6. Comparation of the proposed method with the exponential equation and GPR. (a) Cell cycled in the 45~65% SOC at a discharge of 2 C; (b) cell cycled in the 45~65% SOC at a discharge of 10 C; (c) cell cycled in the 65~90% SOC at a discharge of 6 C.
Wevj 14 00153 g006
Table 1. Cell specifications (ICR18650HB4).
ItemNominal CapacityNominal VoltageStandard
Charging
Current
Standard
Discharging
Current
Maximum Charging
Current
Maximum Discharging Current
Specification1.5 Ah3.65 V750 mA (0.5 C)300 mA (0.2 C)6 A (4 C)30 A (20 C)
Table 2. Configuration for SOC adjustment.
SOC RangeStart PointDOD (%)Discharge Capacity (Ah)Discharge Time (min)
15~40%40%600.9180
40~65%65%350.525105
65~90%90%100.1530
15~90%90%100.1530
Table 3. Final degradation rates (%).
15–40%Role40–65%Role65–90%Role15–90%Role
2 C2.0573.147?4.3727.086
6 C2.1083.4835.494?8.753
10 C2.124.302?6.58510.149
Table 4. Degradation rates (%).
Cycle15~40
@2 C
15~40
@6 C
15~40
@10 C
40~65
@2 C
40~65
@6 C
40~65
@10 C
65~90
@2 C
65~90
@6 C
65~90
@10 C
Cycle15~90
@2 C
15~90
@6 C
15~90
@10 C
1000.510.190.440.520.300.480.661.081.42501.222.163.20
2000.730.430.580.720.670.811.181.642.011002.032.943.54
3000.630.610.680.921.052.011.442.162.791502.984.354.38
4000.830.850.851.191.212.131.862.293.352003.335.005.17
5001.000.990.951.341.452.181.842.953.722503.865.696.10
6001.031.051.061.531.982.572.273.064.123004.296.286.95
7001.341.111.211.832.062.852.393.204.543504.746.867.48
8001.441.231.302.062.282.912.533.444.844004.957.228.49
9001.561.401.412.222.373.012.953.524.604504.988.149.00
10001.581.531.582.352.553.233.234.014.985007.098.7511.33
11001.631.651.622.482.673.383.524.375.245506.939.6212.89
12001.721.761.802.592.813.573.824.695.596006.7310.6813.76
13001.841.901.852.783.033.774.065.036.036506.9910.9518.75
14001.932.052.022.973.284.014.265.286.337007.5111.30
15002.062.112.123.153.484.304.375.496.60
Table 5. Parameters for the exponential equation.
2 C6 C10 C
AbAbAb
15~40%7.4760.627.060.656.7030.66
40~65% 11.390.67
65~90%15.140.64 24.110.64
15~90%21.340.6530.320.6635.220.65
Table 6. Parameters of the k series.
Parameterk1k2k3k4k5
Value10.1217.71−12.9723.2724.27
Table 7. RMSE of different functions.
KernelSERQMaternLINSE + LINRQ + LINMatern + LIN
RMSE (10−4)2.34231.75261.59542.41561.82151.72351.2312
Table 8. Comparation of different methods.
40~65%@2 C (Cell 1)40~65%@10 C (Cell 2)65~90%@6 C (Cell 3)Average
RMSER2RMSER2RMSER2RMSER2
Exponential equation0.09%0.98950.22%0.96500.17%0.98580.16%0.9801
GPR0.15%0.96980.20%0.97150.17%0.98620.17%0.9758
Improved GPR0.03%0.99850.14%0.98510.08%0.99640.08%0.9933
Disclaimer/Publisher’s Note: The statements, opinions and data contained in all publications are solely those of the individual author(s) and contributor(s) and not of MDPI and/or the editor(s). MDPI and/or the editor(s) disclaim responsibility for any injury to people or property resulting from any ideas, methods, instructions or products referred to in the content.

