Article

Charging after Lockdown: The Aftermath of COVID-19 Policies on Electric Vehicle Charging Behaviour in The Netherlands

by
Mylène van der Koogh
1,2,*,
Rick Wolbertus
1 and
Renee Heller
1
1
Energy & Innovation Group, Urban Technology, Faculty of Techology, Amsterdam University of Applied Sciences, Weesperzijde 190, 1097 DZ Amsterdam, The Netherlands
2
Energy & Industry Group, Engineering Systems and Services, Faculty of Technology Policy and Management, Jaffalaan 5, 2628 BX Delft, The Netherlands
*
Author to whom correspondence should be addressed.
World Electr. Veh. J. 2023, 14(3), 67; https://doi.org/10.3390/wevj14030067
Submission received: 22 December 2022 / Revised: 27 February 2023 / Accepted: 1 March 2023 / Published: 7 March 2023

Abstract

:
During the COVID-19—related lockdowns (2020–2022), mobility patterns and charging needs were substantially affected. Policies such as work from home, lockdowns, and curfews reduced traffic and commuting significantly. This global pandemic may have also substantially changed mobility patterns on the long term and therefore the need for electric vehicle charging infrastructure. This paper analyzes changes in electric charging in the Netherlands for different user groups during different phases of the COVID-19 lockdown to assess the effects on EV charging needs. Charging needs dropped significantly during this period, which also changed the distribution of the load on the electricity grid throughout the day. Curfews affected the start times of charging sessions during peak hours of grid consumption. Infrastructure dedicated to commuters was used less intensively, and the charging needs of professional taxi drivers were drastically reduced during lockdown periods. These trends were partially observed during a post–lockdown measuring period of roughly 8 months, indicating a longer shift in mobility and charging patterns.

1. Introduction

1.1. Background

COVID-19 lockdowns halted transport movements all across the world; electric vehicles were no exception. People were working from home more and contacting each other through digital means. Car–related transport decreased by up to 50% in 2020 [1]. The use of electric vehicles in the Netherlands saw a similar drop. Many suggested that the effects of working from home would last longer than the COVID-19 lockdowns as the benefits of working from home, such as work effectiveness, decreased commute times, fewer traffic jams, and cleaner air, were experienced at a mass scale for the first time [2,3,4]. Major companies have announced new work-from-home policies. Additionally, car transport shifted throughout the day as most only ventured out for necessary appointments.
These policies also affected the movements, and thus the charging needs, of electric vehicle drivers. This study examines differences in charging behavior during the COVID-19 lockdowns, with a special focus on curfews and user groups, and finally post-lockdown to see the implications of new company policies. This is done by analyzing a dataset on charging behavior from 2020 up to and including October 2022. From this analysis, strategic effects on charging infrastructure planning are derived.

1.2. Literature

The COVID-19 lockdowns disrupted the EV manufacturers supply chains, productions, and operations [5]. Despite these disruptions, the full fleet of battery-electric vehicles in the Netherlands grew 70% in 2020, compared to 2019 [6]. In 2020 as well as 2021, 1 out of 5 newly sold vehicles in the Netherlands were electric [7]. This is because the Dutch have been intensively addressing decarbonization through mobility in their national [8], regional [9], and local policies (e.g., [10]). Mobility is one of the four key pillars mentioned in their Climate Agreement [11,12]. This has led to an uptake of electric vehicles and the development of one of the densest charging networks in the world [13].
The COVID-19 lockdowns affected different aspects of the energy system. For example, the roll-out of PV solar panels was much lower than predicted in 2020 because of manufacturing and supply chain issues and decreased urgency because of lower peak demands during COVID-19 [14]. The effect of COVID-19 and related policies on the charging of electric vehicles has been monitored by various researchers. Two researchers monitored two charging points at a public facility in California, USA [15]. They found that charging sessions declined from the start of lockdown and came to a complete halt between August and the first half of November 2020. The state of California then dealt with multiple issues, such as increasing pandemic-related death rates, wildfires, and blackouts, explaining the lack of sessions. At the end of 2020, they monitored charging activity at roughly 25% of the original capacity (a −75% decrease). The authors also found an increase in sessions starting in May 2021, which they attribute to the roll-out of vaccines. Some researchers have also been monitoring pandemic EV charging in Utah [16]. Here, only a maximum decrease of −40% (or 60% of full capacity) was measured, with the steepest decline in May 2020. A group of Dutch researchers focused on three charging locations in the Dutch city of Utrecht [17]. They compared a residential area with an office area and an event location. During the first lockdown, they saw the most decline at the event location (−99.2%), followed by the office area (−89.6%), and the least decline at the residential area (−73.6%). Results from this study differ from the USA studies, since the first lockdown phase around March 2020 had the strongest effect (only 25% of full capacity, or a −75% decline), whereas the later lockdown phases in 2020 led to a smaller decline. A Chinese study of four cities found similar declines in the range of roughly 50–70% in early 2020 and correlated the decline in EV charging demand with the number of confirmed COVID-19 cases and the associated hospitalizations, with one factor being more important than the other, depending on the city [18].
There have also been studies addressing the different charging behaviors associated with distinct user segments. In the Netherlands, start times of charging, charging durations, time between charging, the kWh charged, and the number of selected locations to charge can differ significantly between user segmentations (such as residents, commuters, taxi drivers, and shared vehicles) [19].
These studies, although insightful, are based on a limited number of observations over a limited time span. In the upcoming analysis, we will look at the different lockdown phases, types of areas, and user segmentations in the Netherlands using a longer measuring period. This enables us to further determine the effects of COVID lockdowns on electric vehicle charging.

2. Methods

2.1. Data

Charging data was collected from public charging stations in the Netherlands in the cities of Amsterdam, Rotterdam, Utrecht, and The Hague. In total, more than 7.5 million charging sessions were collected from January 2020 up to October 2022. Background on the dataset and the data collection process can be found in another publication [20]. An example of data variables gathered can be seen in Table 1.

2.2. Timeframes

We used the ‘Coronavirus timeline’ of the Dutch government to compare important lockdown dates with our charging data [21]. The fuel comparison with kWh charged was scaled by the availability of traffic fuel (petrol) usage during COVID-19. The Dutch Central Bureau of Statistics keeps track of traffic, fuel, behavior, and car ownership, among others. This data was available on a monthly basis until April 2021. The energy (kWh) charged was summed with all the charging points that were available at January 2020 to avoid measuring increased roll-out and adoption. Office comparisons were made by selecting public charging points from office areas and by fingerprinting sessions to determine which behavior corresponded with employee charging behavior. A night curfew was installed to combat the spread of the new variants of COVID-19. The curfew was first installed in January 2021 and was extended until the end of April 2021. The curfew had two distinct phases with two different end times. In the fall of 2021, another partial lockdown was installed, and in December 2021, the last hard lockdown in the Netherlands was installed. This final lockdown took place for another month, and from February 2022 on, there were no more lockdowns in the Netherlands. Some restrictions, such as the use of vaccination passports and well-ventilated rooms, continued until the spring and summer of 2022.

2.3. Approach

We selected data from the important periods as specified in the Coronavirus Timeline [21] and compared them with other months during lockdown. Data was analyzed using Rstudio. Table 2 shows an overview of the analyses that can be found in this paper.

3. Results

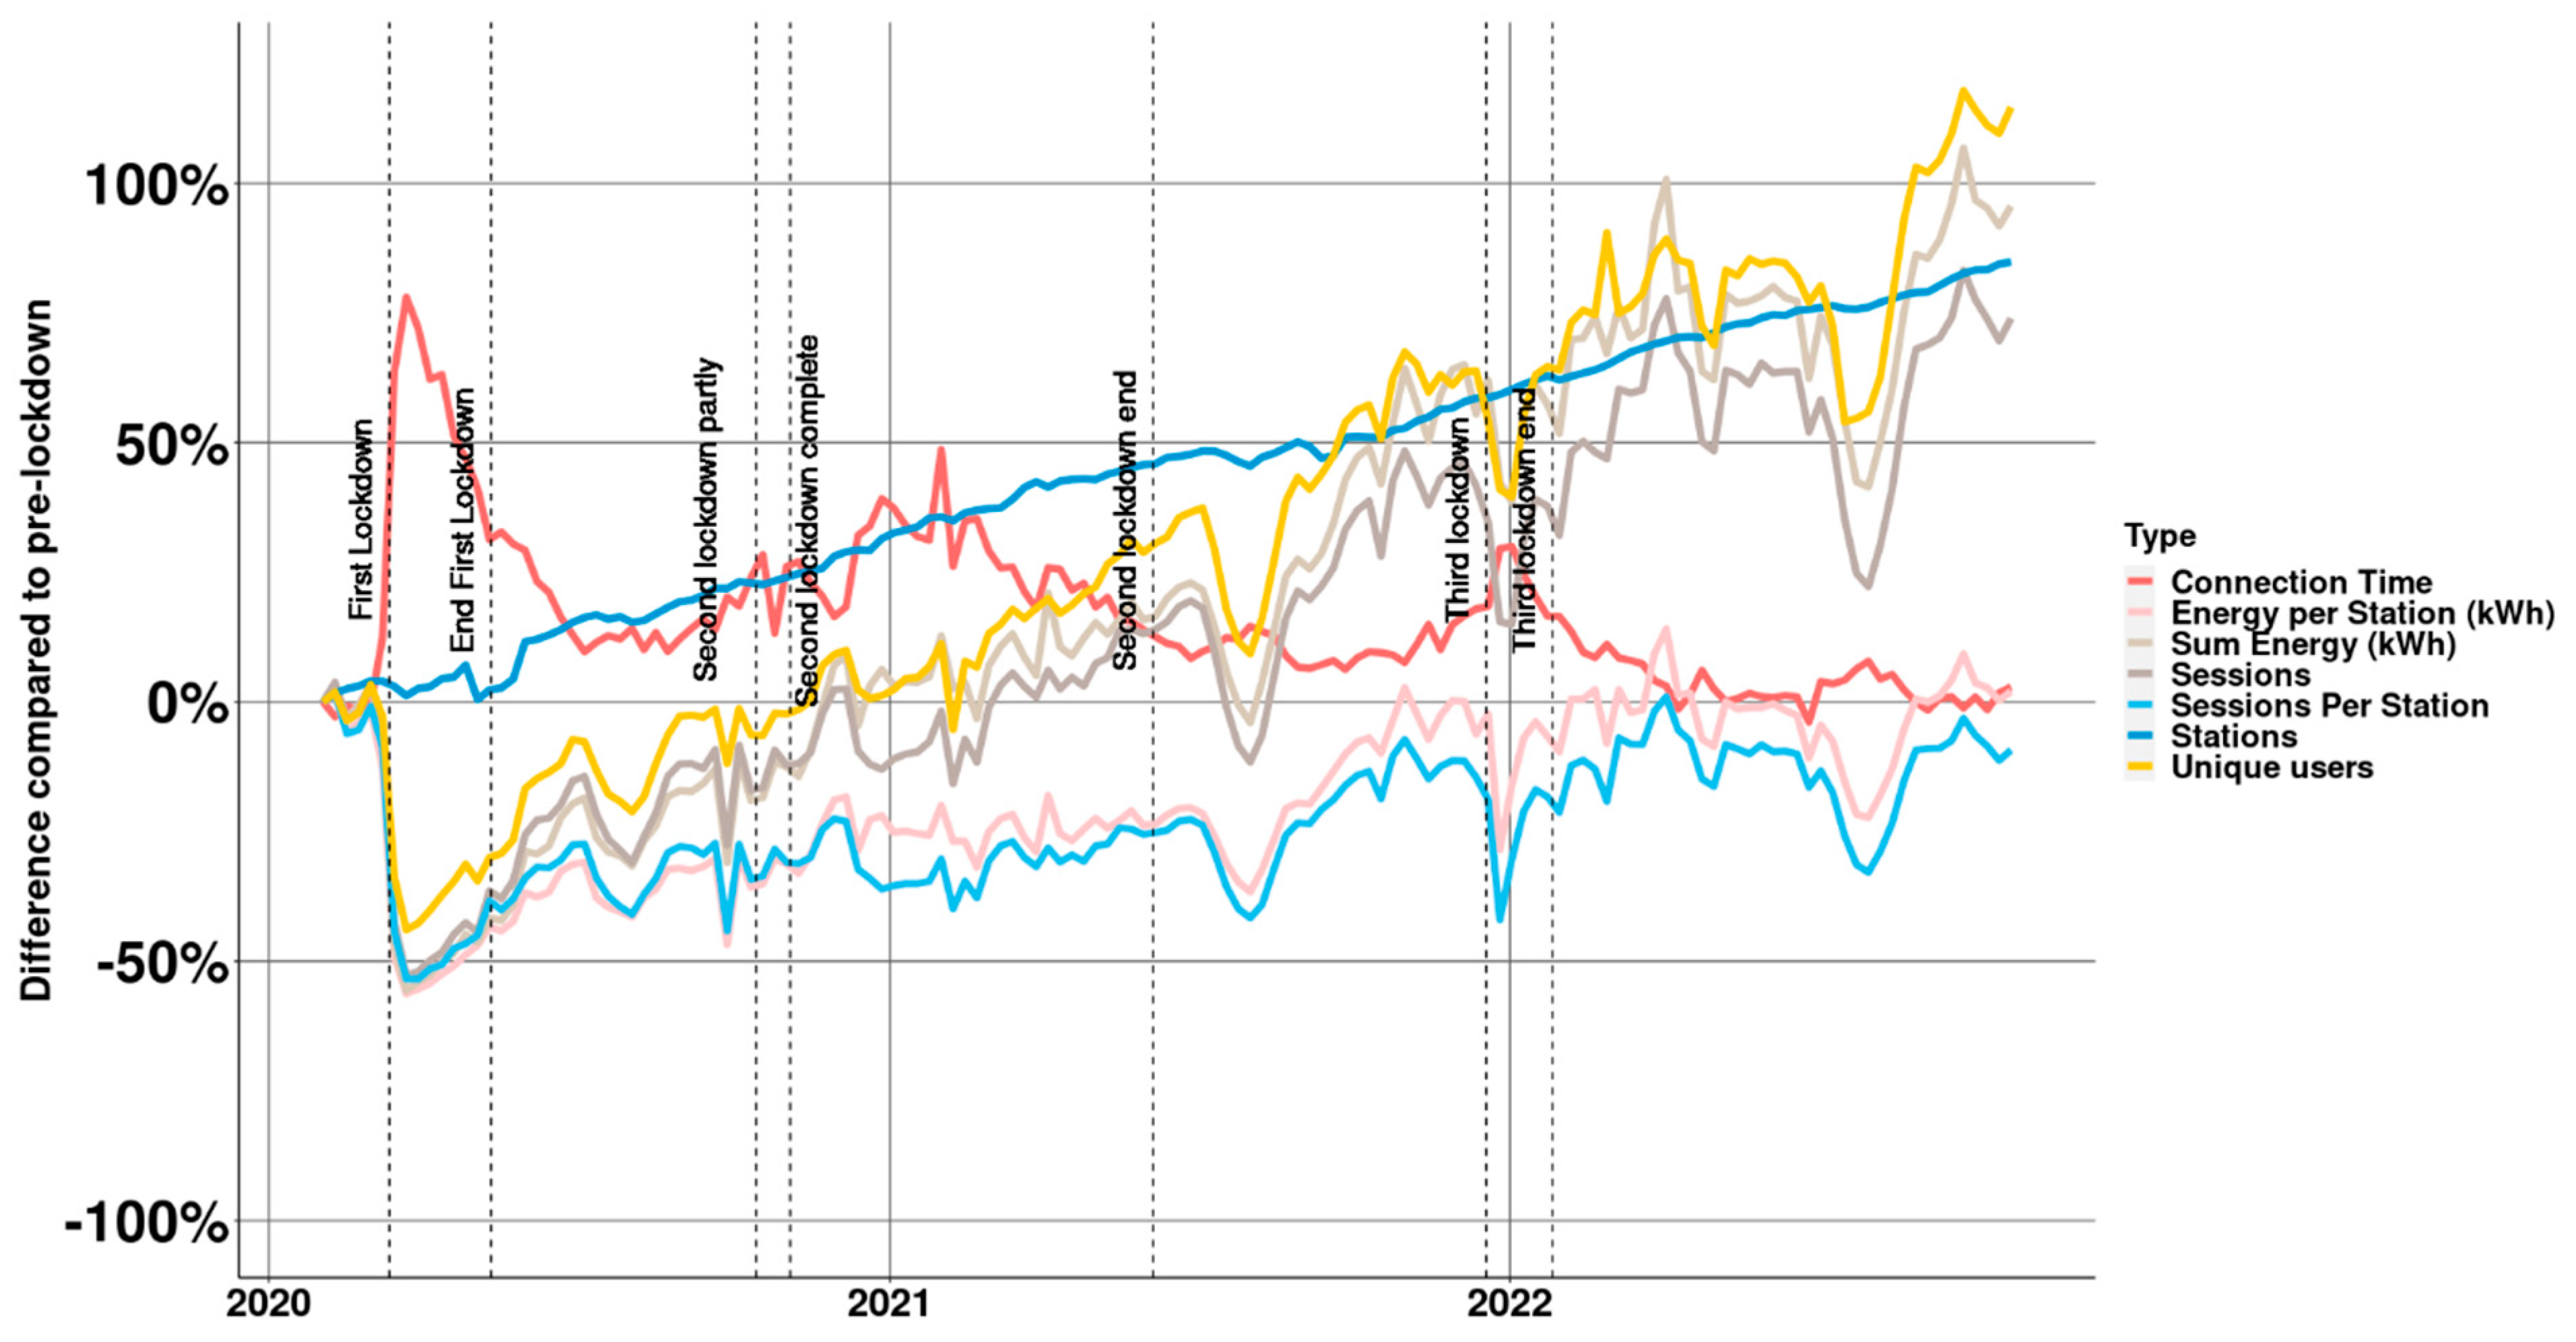
3.1. COVID-19 Impact Analysis

COVID-19 lockdowns saw an immediate impact on charging behavior once installed, with a 50% reduction in charging sessions and energy charged (see Figure 1). At the same time, average connection time at the charging station increased by over 50% as EV drivers left their cars at the station during the early days of the lockdown. After restrictions were lifted in early June 2020, it still took a while before at least the same number of users were reached (partly also due to underlying growth in the number of electric vehicles).
The second lockdown in the fall of 2020 had a far lesser impact on charging behavior. It was only in late January 2021, when curfews were installed, that the number of charging sessions per charging station dropped again. Still, a significant reduction in the number of charging sessions per station could be observed compared to February 2020. It was not until March 2022, when all restrictions were lifted, that charging station use, both in terms of sessions per station and average connection time, was similar to pre-COVID.
This recovery continues during the rest of 2022 (except for the summer period, which is expected). By the end of 2022, the number of unique users in the charging network will have more than doubled compared to pre-COVID levels (January 2020). The number of unique users only grew by 50% between early 2021 and early 2022; this means growth has accelerated again since then.
Given that the number of charging sessions per station and connection have returned to pre-COVID levels, the question arises if a significant effect could be expected of COVID-19 lockdowns on car-related transport behavior and consequently charging behavior. For further inspection, charging behavior across the day for different phases of the COVID-19 lockdown is examined (see Figure 2). What stands out is that there is a significant reduction in evening demand compared to pre-lockdown behavior. Work demand seems to have returned to pre-COVID levels (see the significant reduction in the first lockdown), but charging session starts seem to have been shifted across the day away from classical 9−to−5 office behavior. March and April 2022 show a slight increase in the evening peak, but not as strong as in the morning. Such results might indicate more flexible working hours or hybrid working environments. Such a shift in charging behavior away from the peak might also be good news for grid operators as local power demand is shifted towards the day (coinciding with solar production) and away from peak hours. A post-lockdown line was added, covering an 8−month period after no more restrictions were in place. This line is very similar to other lines during lockdowns, and the gap between this line and the pre-lockdown line can still be observed, especially at the end of the day. This confirms that there is a persistent effect on the start times of charging sessions.
Additional insights are gained by comparing users that were already charging in January 2020 and are still charging in 2022. For this analysis, were included users that charged at least five times in January 2020 and were still charging in March 2022. The analysis excludes user groups such as taxis and shared vehicles. A total of 586 users (19550 charging sessions) were included in the analysis. Results of this comparison are shown in Table 3 for different metrics.
Although some metrics have stayed nearly the same (such as energy per session and connection time), it can also be seen that the same drivers have been charging much less, both in terms of the number of charging sessions and total energy in a single month. Although the turnover per charging station has come close to normal since March 2022, EV drivers individually still drive less. This can also be seen from the number of unique charging stations they visited, as well as the different neighborhoods and cities. Most charging tends to be done at a few charging stations. These results could show indications of the lasting effects of new COVID-19 travel habits among EV drivers as a possible result of a shift in workplace norms.

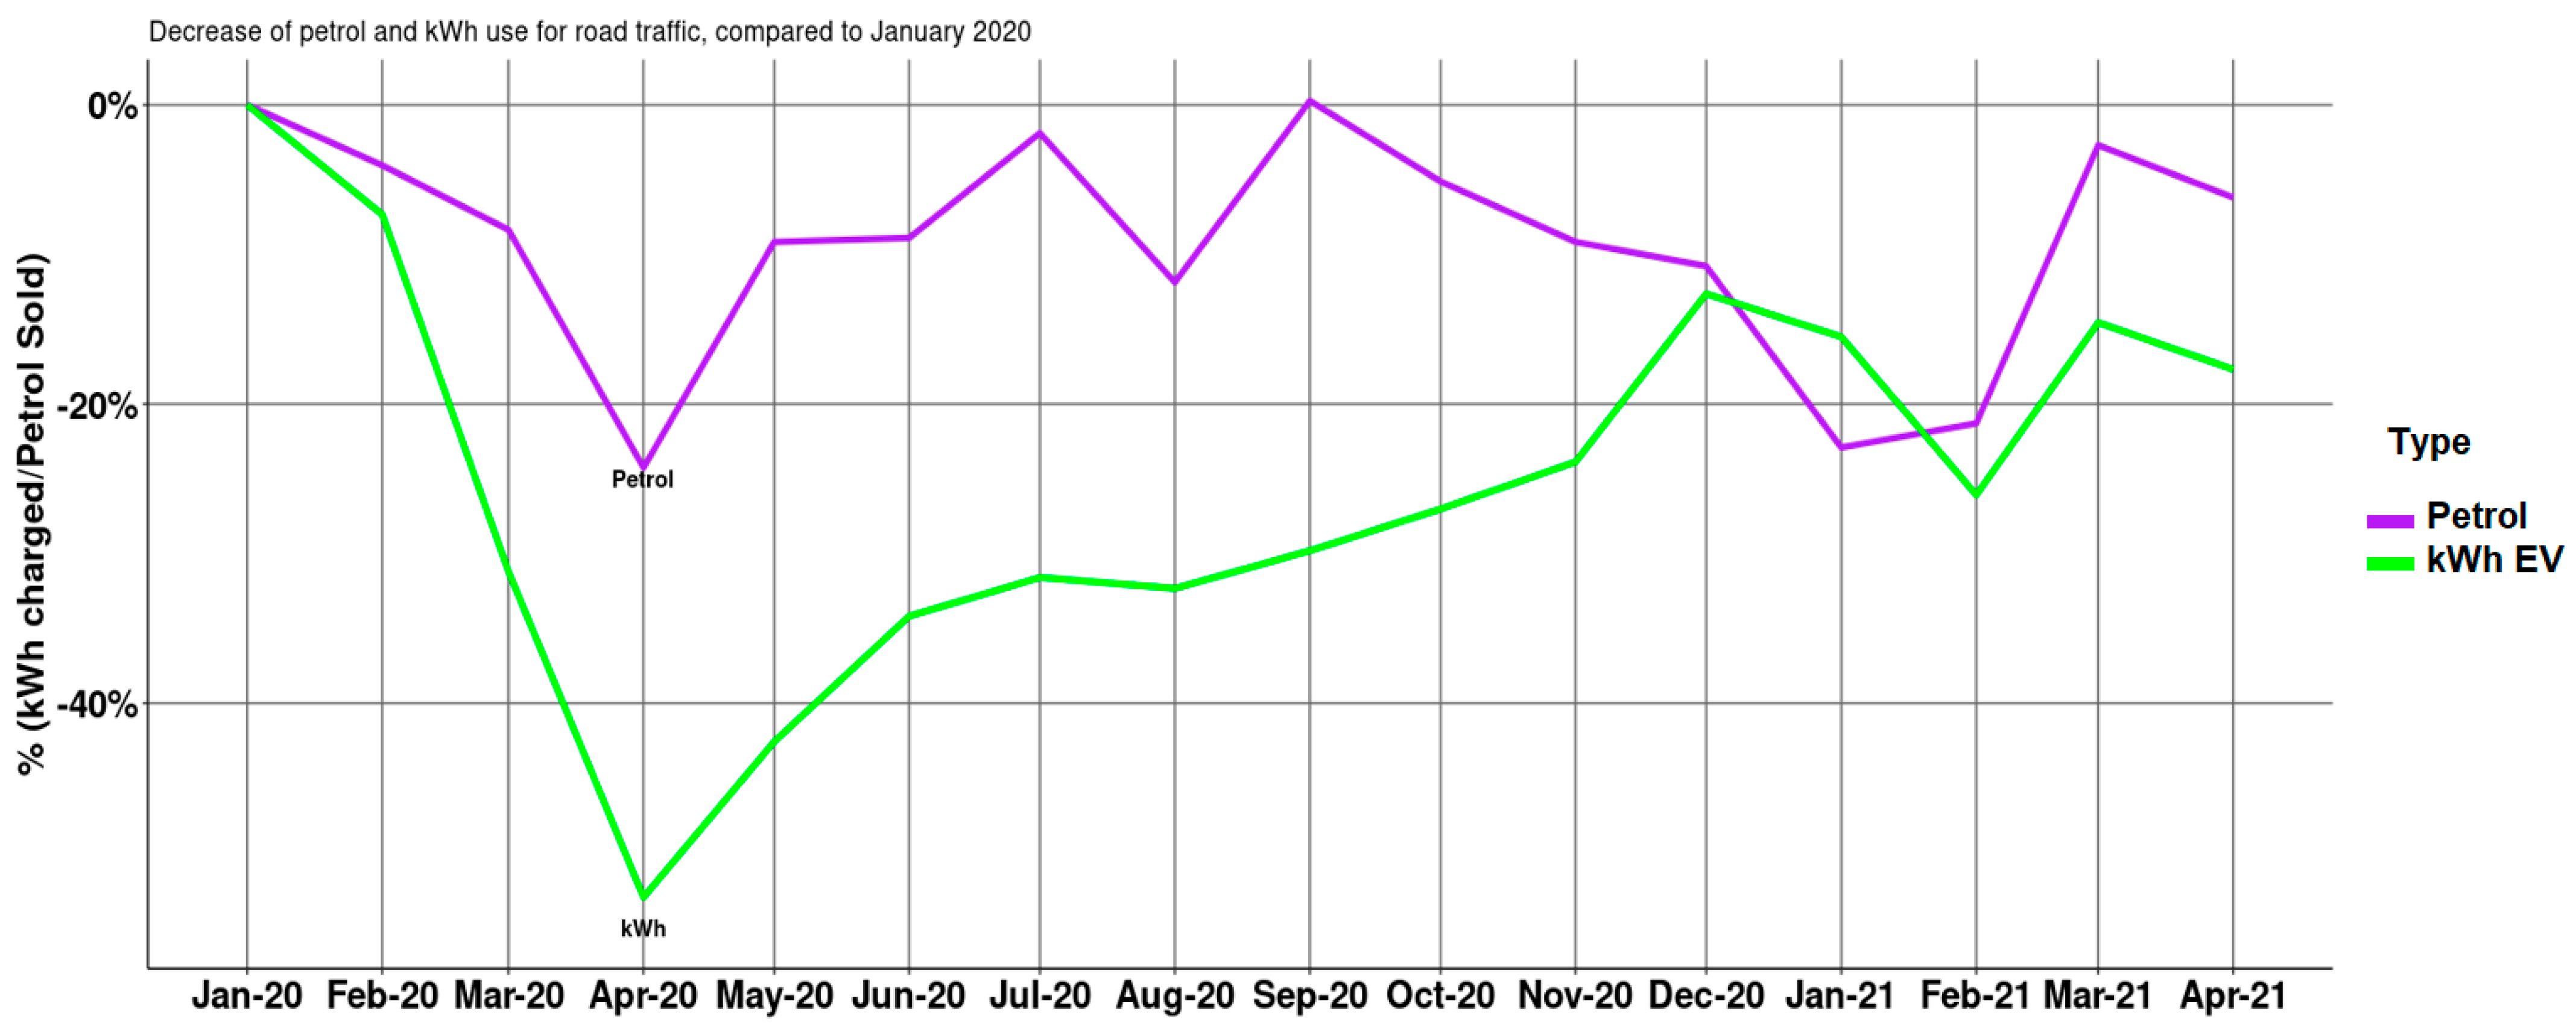
3.2. Fuel Comparison (2020–2021)

COVID-19 has led to a decrease in mobility activities during 2020 and 2021. We compared this decrease of energy charged with the decrease of (traffic) petrol sales using CBS data [22]. The comparison point was set for January 2020. The data was aggregated into monthly data between January 2020 and April 2021. Only charging points that were in the system as of January 2020 were used in the analysis to avoid adoption growth effects. In April 2021, 97% of these locations were still active, indicating a maximum potential loss of 3% of locations or location charging data.
Figure 3 shows the differences in decreases in petrol and electricity sales for vehicles from January 2020 until April 2021. Both lines show a strong decrease around the first lockdown at the end of March 2020. The underlying data reveals that in March, petrol sales decreased by almost 10%, whereas kWh charged decreased ~30%. In April, the decrease was the strongest, with a ~25% decrease in traffic petrol sales and ~50% decrease in kWh charged. This decrease recovers partially during the summer, and in September 2020, petrol sales were even slightly higher than in January 2020. Both lines also show a dip (extra decrease) in petrol sales and kWh charged during curfews, where the initial effect seems stronger for petrol sales but recovers faster.
The much higher reduction in electricity sales compared to petrol can be explained by the different user groups. As electric transport is mostly centered around passenger cars, with only a few trucks on the road, gasoline and diesel vehicles are present in all sectors. Goods transports barely decreased during lockdowns, explaining the difference between the two. The overall reduction in 2020 (compared to 2019) was ~20% for passenger cars (24% for business related travel), and only 3% for goods-related transport [23].

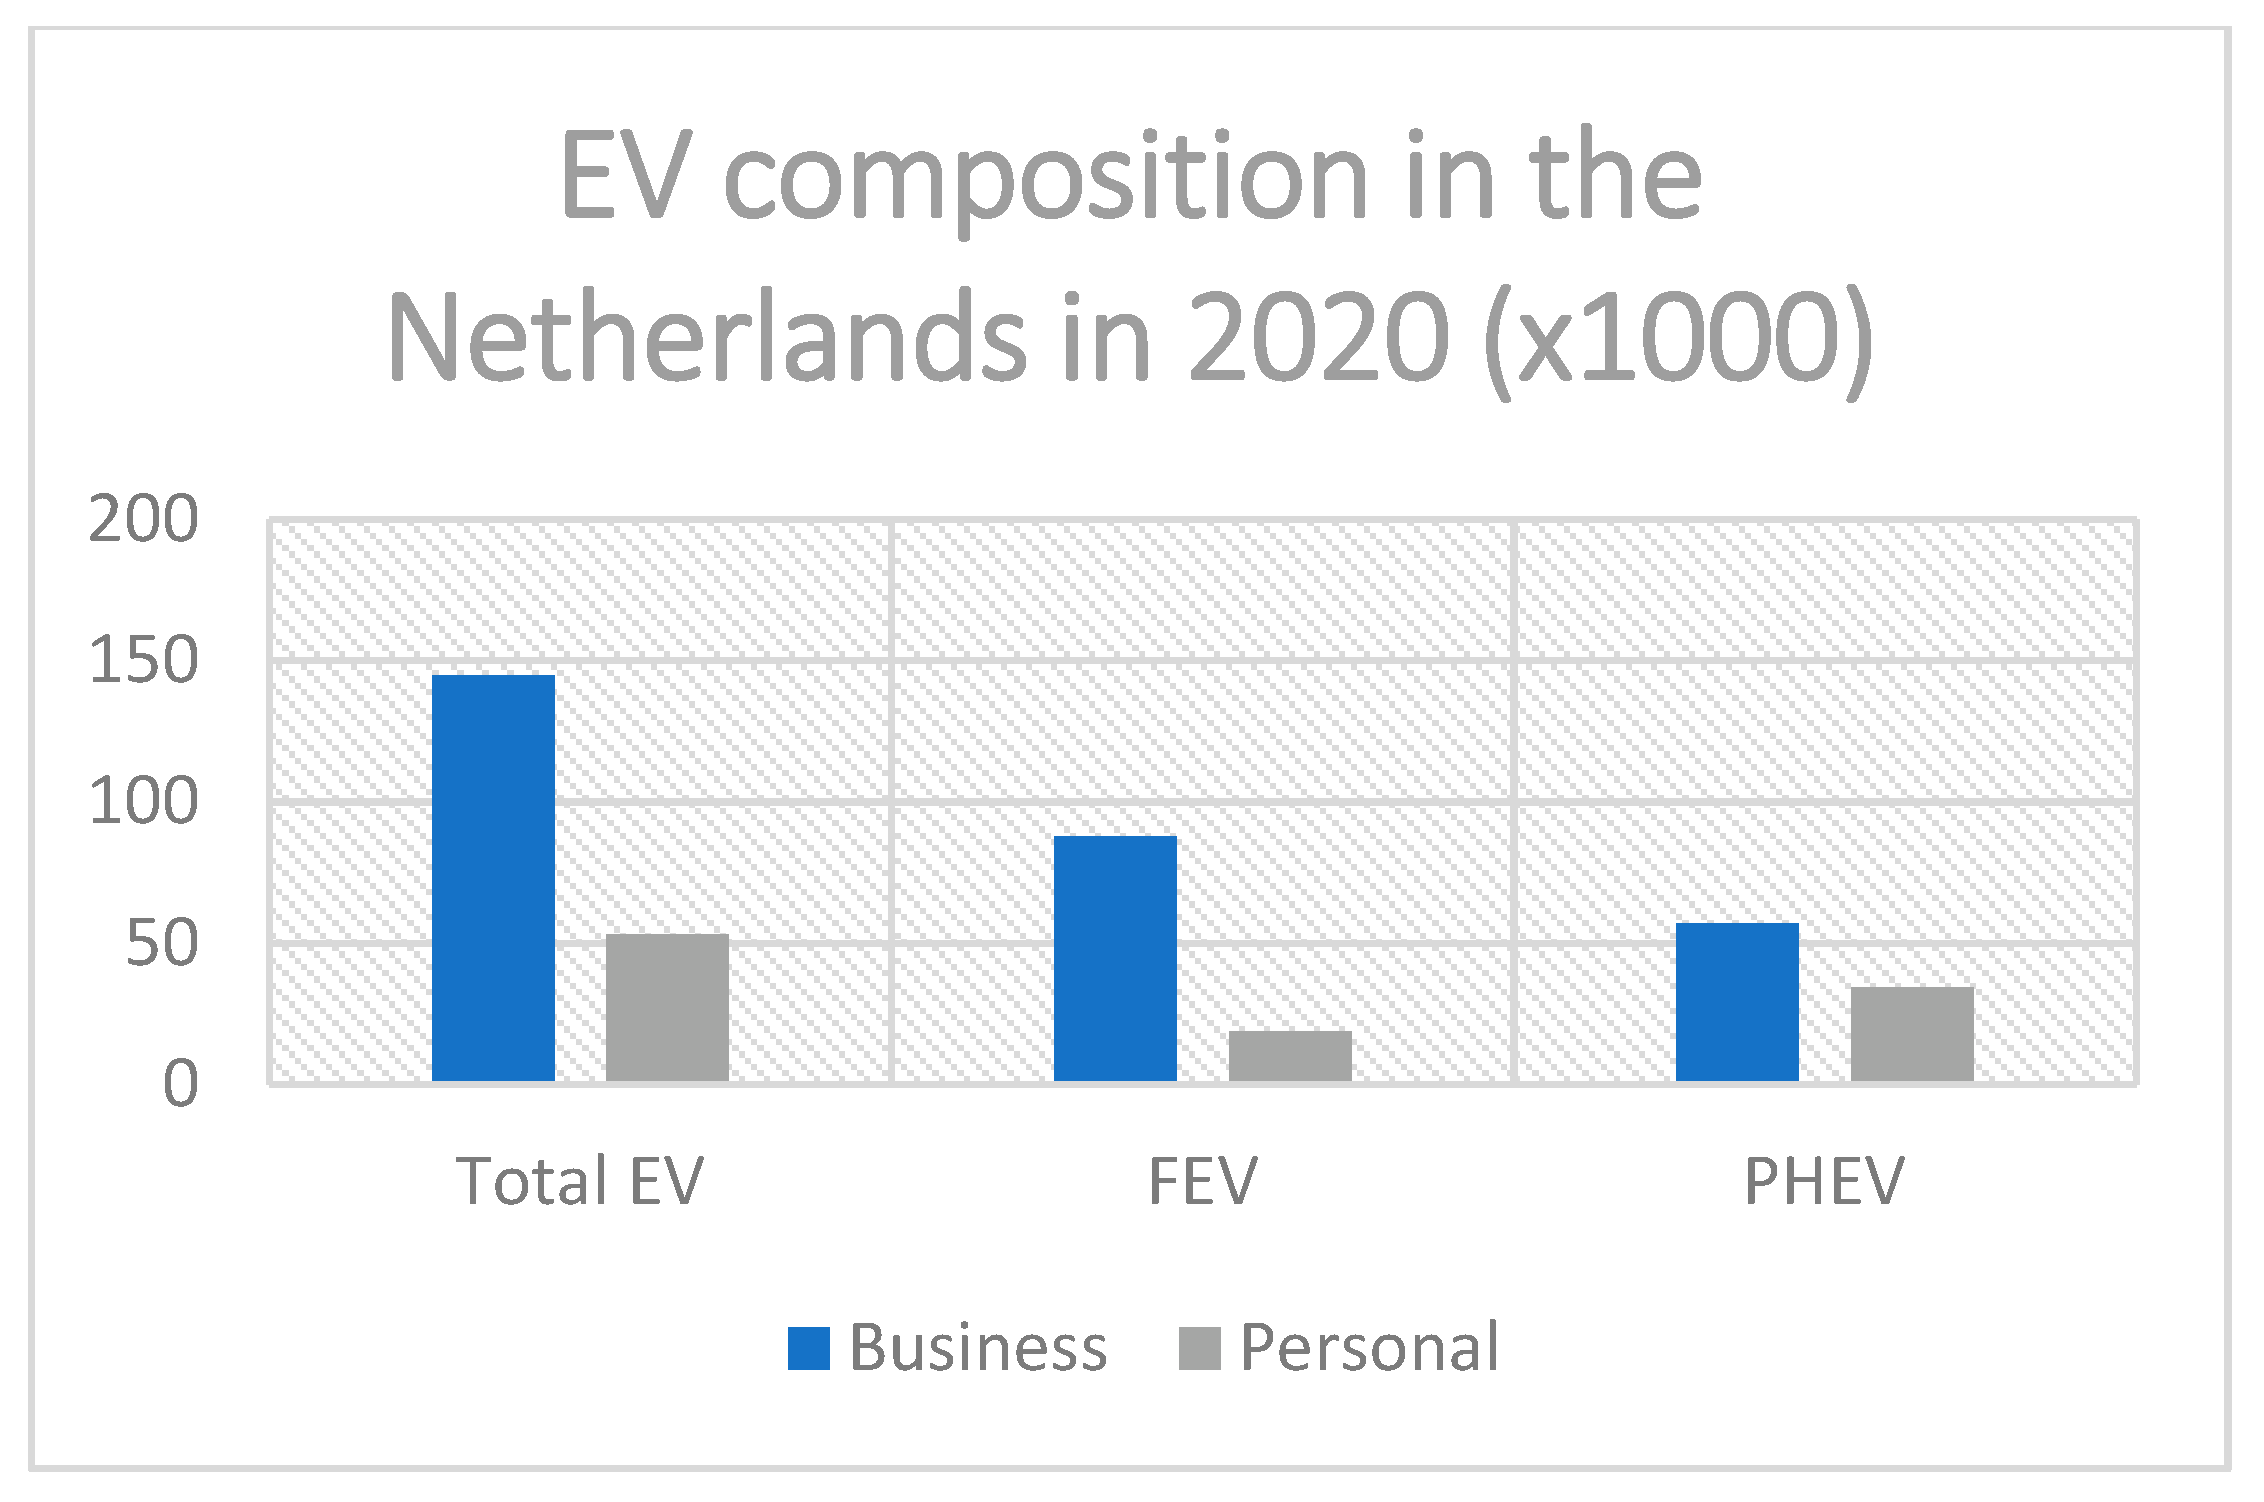
3.3. User Group Comparison

EV charging had a much stronger decrease during the initial lockdown (March-April 2020) than petrol vehicles. A potential contributing factor to this effect (aside from transport) could be business related. Considering the entire personal vehicle fleet in the Netherlands in 2020, only 17.3% is categorized as business (company car, business lease, or personal lease) [24]. However, this number is much higher for electric vehicles (see Figure 4). Additional CBS and RDW data reveal that in 2020, only roughly a third of the electric vehicles on Dutch roads were owned personally [25]. For full electric vehicles, only 21% were personally owned.
The charging behavior of professional user groups is analyzed to determine how these groups were affected during COVID-19 and compared to the full set containing all public charging. Decrease rates were calculated using the initial charging numbers for each group in January 2020 (this is the 0% point in the graphs). The following sections will discuss charging during COVID-19 for office areas, employees/commuters, taxi drivers, and shared vehicles.
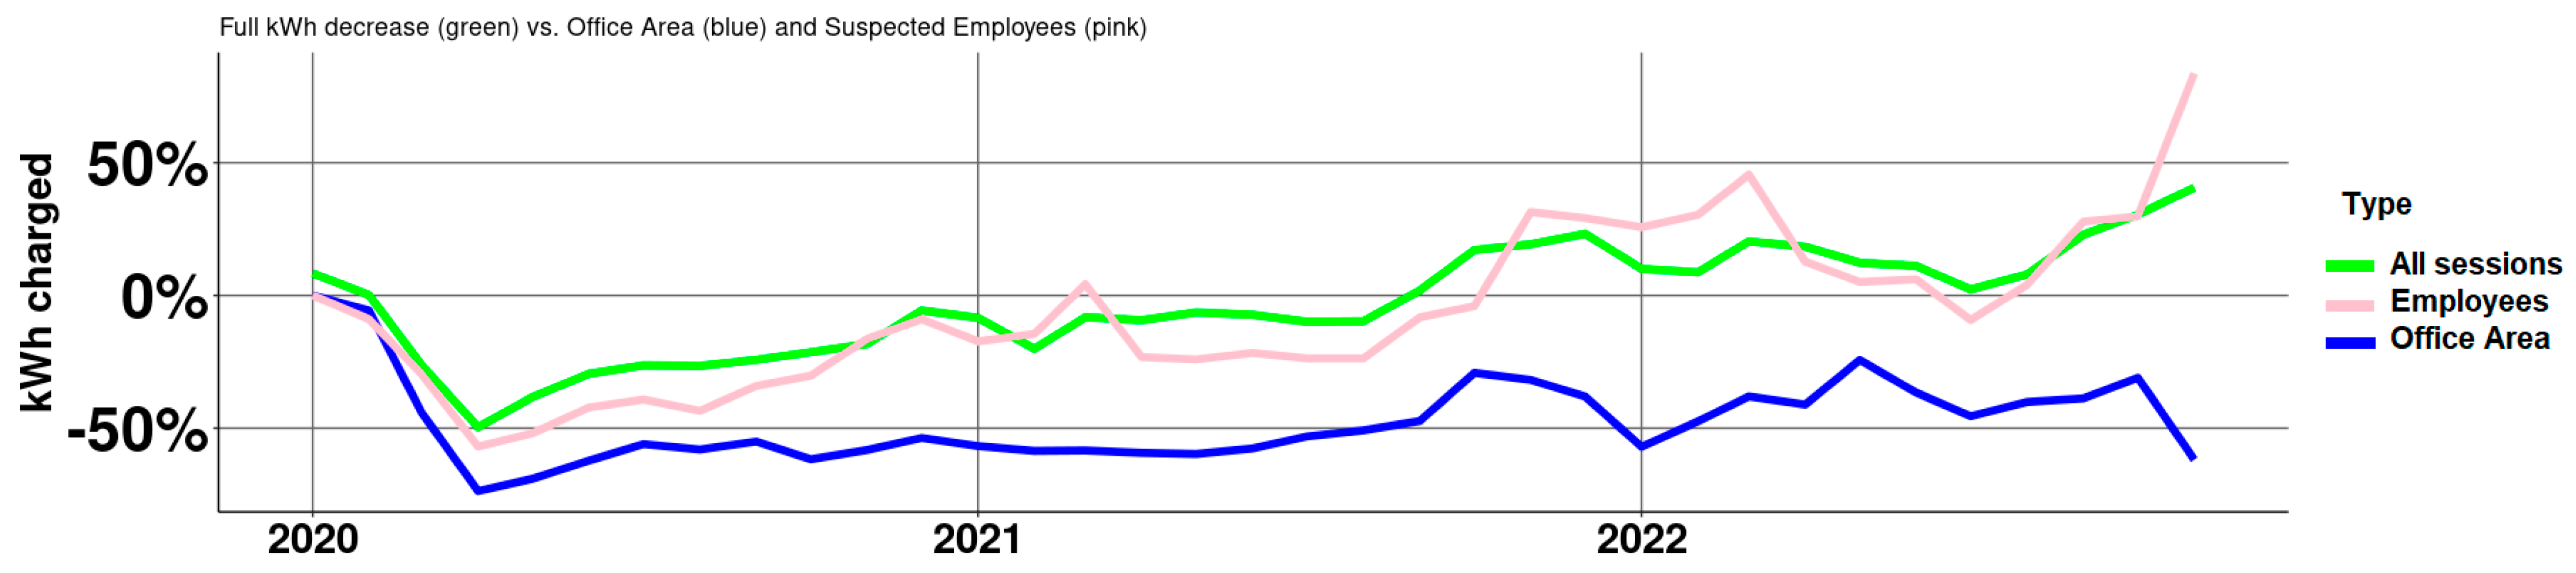
  • Office Comparison (2020–2022)
A potential explanation for the stronger initial lockdown decrease in kWh charged is the low percentage of personal vehicle owners in the EV fleet. Most electric vehicles are business owned and/or leased. This implies that the vehicle has an important function in either commuting to work, business-related travel, or traffic-related services. Some lockdowns included a work from home policy, either mandated or highly advised, which affected the number of commuters on the road. Working from home was still recommended at times when leisure activities were allowed again. The following paragraphs will address office charging, using three groups to compare (see Table 4).
17 charging points that were in Sloterdijk Office Area (‘Bedrijventerrein i’) are analyzed and compared with all public EV charging in 2020–2022. The full set of sessions and the office area sessions with the sessions of individual users that are identified as employees are compared. We assumed the following while identifying potential employees on the public charging network: Employees start their charging sessions on weekdays between 7 and 10 a.m., and their connection time is between 3 and 10 h. We found that 7–8% of the sessions corresponded with this behavior.
In 2020, we see a steep decline for kWh charged in all groups in March-April 2020 (see Figure 5). This is when the COVID-19 lockdowns started in the Netherlands. Office area charging points were affected, even more so than the full set of sessions. The energy charged at the office decreased by 70%. The green and pink lines (all sessions and suspected employees) do not decrease as strongly and recover more quickly than the blue line (charging points in the Sloterdijk I office area). The 7–8% of sessions that we suspect are from employees showed similar decreases to the full set of sessions and recovered more quickly than both groups towards the end of 2020.
Charging at the office area did recover slightly by fall 2021. Suspected employees charged more during early 2021 than before, and the demand for this group experienced a steeper growth at the end of 2021. The green line (full kWh charging) and the pink line (suspected employees) exceed 100% in 2021, despite our efforts to select only locations that were available from January 2020 on. This shows that, in some cases, the kWh charged per station is higher than before COVID.
Halfway through 2022, the office area recovers to almost 75% of the original kWh charged (before COVID). kWh charged by those we expect to commute (suspected employees) peaked temporarily again in March 2022. This can be explained since March has a cold temperature in the Netherlands (which makes batteries less efficient and users likely to drive more), there are 31 days in the month, and no holidays occur during this month. There is an expected drop during the summer for all groups (vacation), but in general, by the general population as well as the suspected employees, up to 25% more kWh is charged at these charging points compared to pre-COVID levels. In November 2022, a similar peak to March 2022 is found, and the overall activity is also higher. In the office area, a reverse effect is found, which cannot be explained by trends or lockdowns. It is possible that charging points were limited in availability and that there were office specific reasons for this drop that cannot be confirmed through the data.
We looked at multiple months for each year to account for potential EV adoption growth effects and compare them with the full set of new charging points (Table 5).
  • Growth/Adoption effect: The charging points used in the analysis (online since January 2020) were shared by more distinct users than pre-COVID, after June 2021. The occupancy rates on these charging points have now doubled compared to pre-COVID. The kWh increase that surpasses pre-COVID is therefore partially attributable to the adoption/growth effect, despite measuring the same charging points.
  • Representability: The charging points used in the analysis (online since January 2020) were mostly still online in October 2022. There is no significant loss of charging points, which makes them comparable over the years. Despite the fact that new installations have doubled the number of charging points available, 70% of the current (Oct−22) user base is using the charging points that have been installed since January 2020.
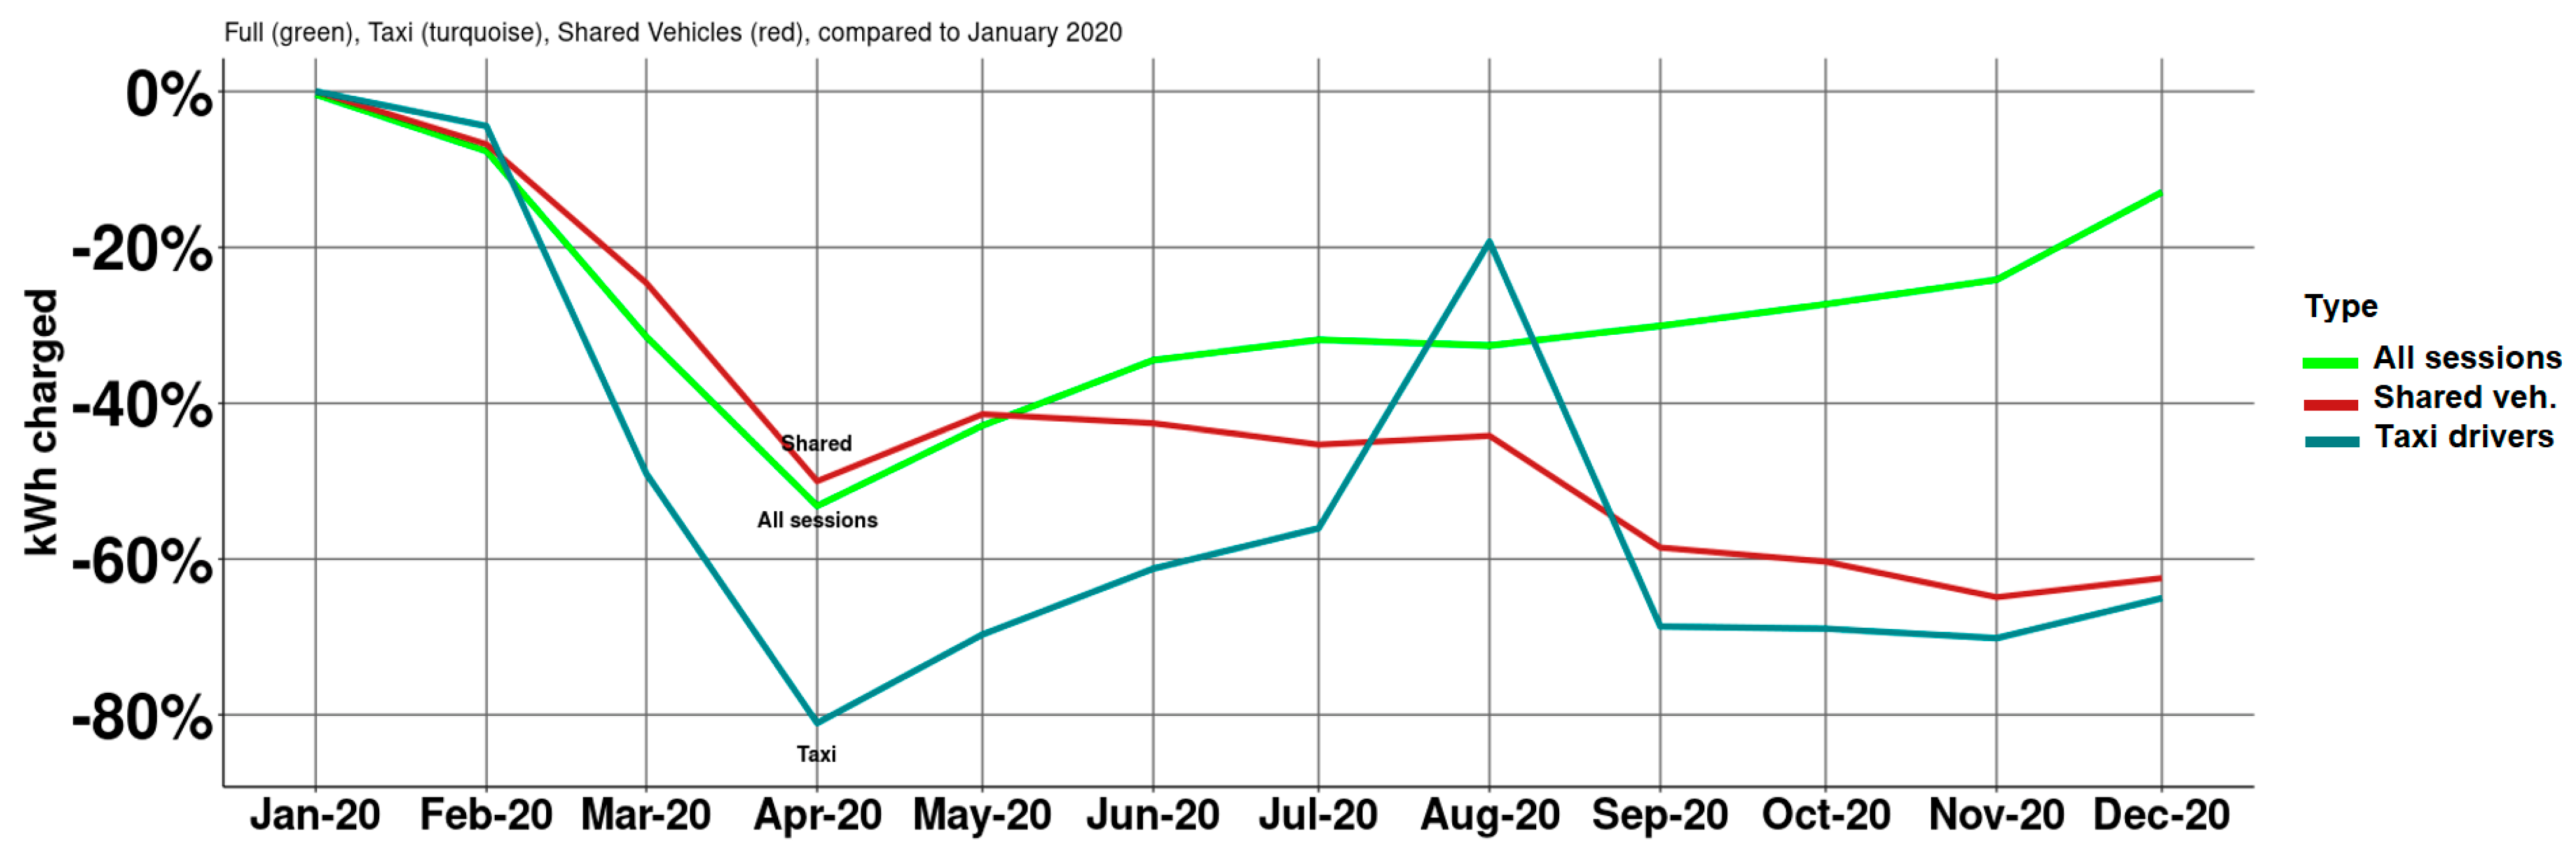
  • Shared vehicles and Taxi drivers (2020 only)
We were able to distinguish between a group of shared vehicles (185 unique RFIDs, minimum per month active: 175) and a group of Amsterdam taxi drivers (630 unique RFIDs, minimum per month active: 603). These groups also show a similar dip during the first lockdown (see Figure 6), with taxi drivers having the most extreme kWh decrease of 80% compared to January 2020. The charging of taxi drivers found some momentum again during the summer, when some policies were temporarily lifted and the catering industry opened up. In 2021 and 2022, the number of identified RFIDs drops significantly, to 2/3rd and 1/6th of their original number, respectively. Potential explanations include takeovers, drivers who are out of business, and replaced cards. However, this drop is too significant to confidently represent the segments after 2020; therefore, we chose not to include user segment analysis over a longer time period.

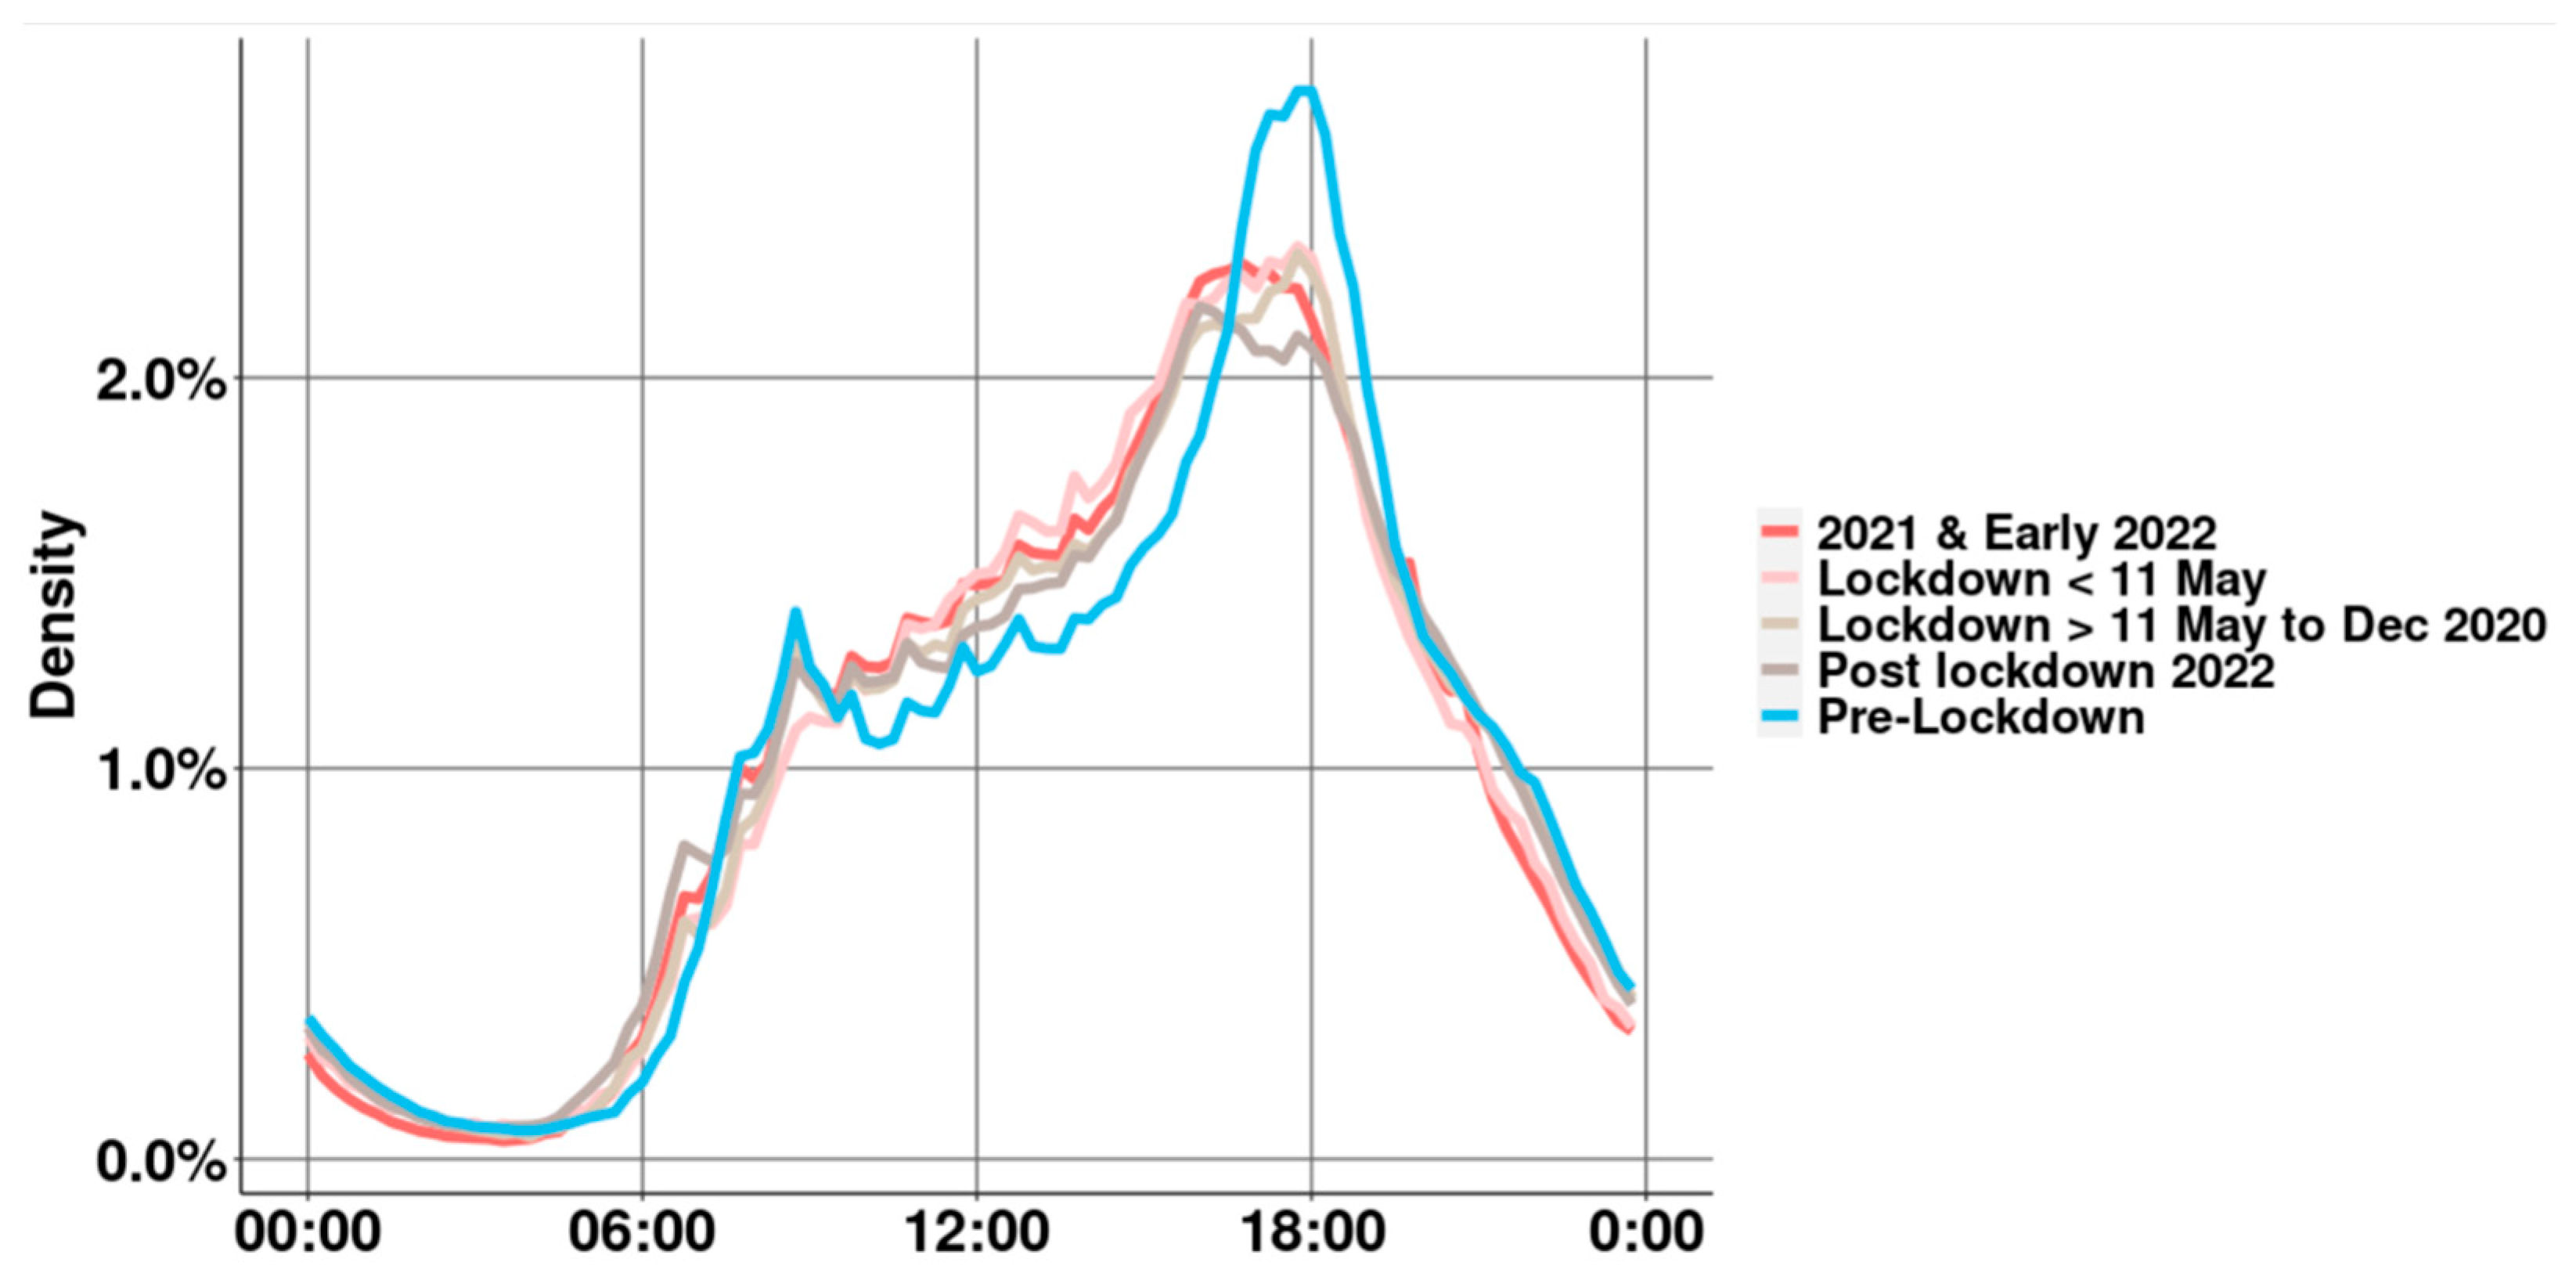
3.4. Curfew Analysis (2021)

A curfew was installed to combat the spread of the new variants of COVID-19. The curfew was first installed on 23 January 2021. Curfew times took place between 9 p.m. (21:00) and 4:30 a.m. (4:30). On 31 March 2021, the curfew was extended with a delayed start time of 10 p.m. (22:00). The curfew took place until 28 April 2021 [21]. For this analysis, we compared the kWh charged in the evening (after 7 p.m.) over four periods of time: the month before the curfew, the 9 p.m. curfew, the 10 p.m. curfew, and the month after the curfew. Details can be found in the table below (Table 6). Percentages are calculated over the entire set of sessions (considering all hours of the day).
  • Outside of curfews, the percentage of sessions that start between 7 p.m. and 8 p.m. is between 5.3% (before curfew measurement) and 5.9% (after curfew measurement). During both curfews, this percentage increased to 7.8% (during the 9 p.m. curfew) and 7.4% (during the 10 p.m. curfew). This means that charging that started between 7 p.m.–8 p.m. increased by almost 50% during both phases of the curfew (compared to before and after measurements).
  • Before curfew, the percentage of all sessions that started after 9 p.m. was 7.8%. During the first curfew, this number dropped to 2.5%. This is a decline of more than 60%. During the second curfew, this percentage recovered to 7.9%, almost identical to the before curfew measurement.
  • The percentage of sessions that started exactly between 9 p.m. and 10 p.m. decreased to 1.5% during the first curfew, a decline of more than 50%. There was barely any difference between the 9 p.m.–10 p.m. start times of the second curfew (3.6%) and the before curfew measurement (3.5%). We observed no late-evening decline during the second curfew, as opposed to the first curfew.
The violin plot (Figure 7) illustrates how curfews affected the start times of public EV charging during lockdown. The month before and after the curfew are almost identical in shape, whereas the shapes of the two curfew periods differ. The first curfew period differs strongly and on multiple occasions in the evening. The second curfew illustrates the same 8 p.m. spike as the first curfew, but later in the evening the shape becomes more similar to the periods before and after the curfew.

4. Discussion

4.1. Lockdown Effects

The COVID-19 lockdowns had a significant effect on travel demand and, therefore, EV charging demand. Initial lockdowns brought the world to a standstill with a reduction of more than 50% in the energy that was charged at public charging stations in the Netherlands. This resulted in much longer connection times at charging stations as most stayed at home. 2020 saw a slow recovery in the number of charging sessions and energy charged, but this was mainly fuelled by a large number of new EVs coming to the market. It was only until March 2022 that the energy transferred at charging stations was comparable to pre-COVID levels.

4.2. Demand Migration

Overall, the demand migration caused by COVID-19 reduced the 6 p.m. charging peak (see Figure 2). This effect is still at play, months after all restrictions were lifted. This capacity reduction occurs at a moment when other household electricity use peaks, so this reduction helps to keep grid capacity growth at lower levels than before COVID-19. Of course, for real grid capacity expansion, a local grid investigation is needed, but this analysis gives a first indication of possible lower capacity needs.
Curfews affected demand differently (see Figure 7). During the first (9 p.m.) curfew, the number of sessions that started at 9 p.m. dropped significantly, and the number of sessions between 9 p.m. and 10 p.m. also dropped significantly. During the second (10 p.m.) curfew, we saw some increase in sessions between 8 p.m. and 9 p.m., compared to other periods, but we did not observe a decrease in sessions that started after 9 p.m..

4.3. User Segments

The effects on charging commercial vehicles differed. Taxi drivers, shared vehicles, and office chargers were all affected by lockdowns, though to a different extent. Dutch media and local governments have also reported the challenges of taxi drivers (including non-electric taxi drivers). TaxiPro, the Dutch trade magazine for the taxi sector, reported a 90% loss of work in 2020 [26]. This is more extreme than the −80% we have measured for electric taxi drivers who are active in the urban agglomeration of the Netherlands. The municipality of Amsterdam monitored its taxi sector in 2020 and found similar patterns as our sample of electric taxi drivers: an average 77% decrease at the first lockdown and a recovery during the summer months [27]. Dutch Royal Traffic reported that 30% of the taxi drivers that were active in early 2020 had quit their jobs by summer 2020 [28]. The municipality of Amsterdam also reported in their monitor that, despite the loss of taxi drivers and a shrinking sector, the percentage of electric taxi drivers did not change much. Although taxi drivers were affected the most, the initial impact for shared vehicles did not differ much from the full user group. In late 2020, differences started to arise, with the full group of sessions recovering from initial effects while kWh consumption for shared vehicles lowered even more. The electricity demand for public charging in an office area was much lower than the already reduced demand for public EV charging altogether, although the demand that is associated with suspected employee charging did not differ as much from normal charging.

4.4. Limitations

EV adoption is growing steadily in the Netherlands. It is challenging to determine the demand reduction long-term, since the fleet is growing and resources are shared between more users over time. This made policy sensitivity analysis more difficult from late 2021 on: it cannot always be said which portion of the demand increasing again can be attributed to lifted restrictions, and which portion should be attributed to the growth of the user base (see Table 5). Another issue is the long-term availability of charging points. Some of the charging points were not used every month, and it is not possible to determine from our data if this is because of user preference or, for example, technical or construction issues that temporarily prevented users from accessing these charging points altogether. In the latter case, some users may have opted for a charging point that was installed after the January 2020 baseline period, and therefore, these sessions were not included in our data analysis. Only 17 charging points in one office area were investigated, and although initial effects are expected because of the work from home policy, additional data is necessary to generalize the after-lockdown effects for the larger population of office chargers. Suspected employees were recognized through an assumption; therefore, it is possible that this group contains some sessions that coincidentally were made under the same behavior by non-employees.

5. Conclusions

First, a conclusion is given by answering the research questions as determined in Section 2.3. The paper will conclude with implications for the future based on the persisting effects that are still observed after lockdowns.

5.1. Conclusions

What is the overall effect of COVID-19 lockdowns on various charging indicators? (2020–2022) Lockdown and work from home policies during the COVID-19 pandemic have led to a decline in charging, different start times for charging during the day, and longer connection times. The adoption of new vehicles and the roll-out of new stations did still increase during this period.
  • How does the decrease in kWh sales compare to the decrease in petrol sales for traditional vehicles? (2020–2021)
Lockdown and work from home policies affected energy use in all traffic, but more so (overall) in electric vehicles than in petrol vehicles. A potential explanation is that the majority of EV adoption is personal and business-related. In general, electric mobility was more heavily reduced than vehicles driven by petrol as most applications of electric mobility are still in personal vehicles. In the Netherlands, most EVs are also company lease cars, so it can be expected that these drivers mostly work at offices, for whom it is easier to work from home than other professions. As well, logistics, which continued to be nearly fully operational during the lockdowns, have not been electrified. Therefore, petrol sales did not fall to the same levels as could be seen with EV charging.
  • Does this decrease also differ between specific user segments? (2020–2022)
As explained in Section 4, user segments were affected differently by lockdowns and work-from−home policies. The impact was most visible in April 2020, where consumption was drastically lowered, especially for taxi drivers, and in the measured office area. This was expected because of the work-from−home policy. The effect of lockdowns on taxi drivers was recognized through local outlets as well. Based on the comparisons by local news outlets and municipalities [26,27,28], we can conclude that electric taxi drivers in the urban agglomeration were slightly less (but still strongly) affected by COVID-19 lockdowns than the taxi sector altogether and that the percentage of EV adoption among taxi drivers was not negatively affected by the lockdowns. The taxi sector did have great challenges in overcoming its negative lockdown effects.
  • What was the effect of the 2021 curfews on the start times of charging in the evening? (2021)
Both curfews temporarily increased the number of sessions that started between 7 p.m. and 8 p.m.. This demand migration towards 7 p.m.−8 p.m., could have created issues for a larger user pool, since this increase in demand does happen during a peak consumption window. Charging in the later evening declined during the first curfew of 9 p.m., whereas the second curfew of 10 p.m. did not show these effects. Even after the curfew deadline, charging was still occurring. In fact, in the later evening, the second curfew resembled the period before the curfews, indicating that the second curfew had little effect on late night charging and that demand in the late night was not as high as during the first curfew.

5.2. Future Implications

Analysis of charging patterns from early 2022, when nearly all restrictions were lifted, shows that there could be some long-lasting effects of the COVID lockdown period. A clear shift in the timing of charging sessions in the evening could be observed, indicating that strict 9−to−5 workplace norms are no longer in place. This does not necessarily have an impact on the number of charging stations but could result in a shift in local energy demand (away from a peak) and longer connection times (an earlier start but the same end time). This increases the potential for smart charging of electric vehicles at these stations. A comparison of a group of EV drivers active before and directly after COVID restrictions (Table 3) showed that this group charged significantly less (up to 30%) and charged at fewer different locations. A possible explanation is that business-related travel was reduced as there was a substantial shift to online meetings. A comparison of office areas with the general population also showed a significant reduction after COVID restrictions.
The last COVID restrictions (such as vaccination passports and evening lockdowns) were halted in spring 2022, 8 months before the last analysis update of this study in fall 2022. Since then, EV charging has significantly increased again. Since the start of COVID, the number of users has more than doubled, and many new charging stations have been installed. The kWh that is charged by various user groups has recovered to 50–70% of original kWh use (office charging points) and even more than before the pandemic (commuters and the general population). Office areas have not recovered fully to their pre-COVID charging levels (see Figure 5), and start times of charging sessions also do not follow the after work/evening peak that was observed before COVID (Figure 2). This indicates that there is a persisting effect where working from home and working flexible hours are still partially available for employees (more than before COVID lockdowns). However, because of new adoption, we expect office infrastructure to stay relevant over time.

Author Contributions

Conceptualization, R.W., M.v.d.K. and R.H; methodology, M.v.d.K. and R.W.; software, M.v.d.K. and R.W.; validation, R.W., M.v.d.K. and R.H.; investigation, M.v.d.K. and R.W.; writing—original draft preparation, R.W. and M.v.d.K.; writing—review and editing, R.H and M.v.d.K.; visualization, R.W. and M.v.d.K.; supervision, R.H.; project administration, R.W.; funding acquisition, R.W. All authors have read and agreed to the published version of the manuscript.

Funding

This research was funded by NWO RAAK-SIA grant number RAAK.PRO03.128.

Data Availability Statement

Data is curated through a project consortium. For details about access, visit ev.data.nl.

Acknowledgments

The authors would like to thank all partners in the RAAK-SIA−funded Future Charging project, with special thanks to the municipalities of Amsterdam, Rotterdam, Utrecht, The Hague, and the surrounding metropole regions for the availability of their public charging data.

Conflicts of Interest

The authors declare no conflict of interest.

References

  1. Kim, J.; Kwan, M.-P. The Impact of the COVID-19 Pandemic on People’s Mobility: A Longitudinal Study of the U.S. from March to September of 2020. J. Transp. Geogr. 2021, 93, 103039. [Google Scholar] [CrossRef] [PubMed]
  2. Huang, X.; Li, Z.; Jiang, Y.; Li, X.; Porter, D. Twitter Reveals Human Mobility Dynamics during the COVID-19 Pandemic. PLoS ONE 2020, 15, e0241957. [Google Scholar] [CrossRef] [PubMed]
  3. Heiler, G.; Reisch, T.; Hurt, J.; Forghani, M.; Omani, A.; Hanbury, A.; Karimipour, F. Country-Wide Mobility Changes Observed Using Mobile Phone Data During COVID-19 Pandemic. In Proceedings of the 2020 IEEE International Conference on Big Data (Big Data), Atlanta, GA, USA, 10–13 December 2020; pp. 3123–3132. [Google Scholar] [CrossRef]
  4. Kramer, A.; Kramer, K.Z. The Potential Impact of the COVID-19 Pandemic on Occupational Status, Work from Home, and Occupational Mobility. J. Vocat. Behav. 2020, 119, 103442. [Google Scholar] [CrossRef] [PubMed]
  5. Wen, W.; Yang, S.; Zhou, P.; Gao, S.Z. Impacts of COVID-19 on the Electric Vehicle Industry: Evidence from China. Renew. Sustain. Energy Rev. 2021, 144, 111024. [Google Scholar] [CrossRef] [PubMed]
  6. Rijksdienst voor Ondernemend Nederland. Elektrisch Rijden Op (de) Weg—Voertuigen En Laadpunten: Overzicht Tot En Met 2020; Rijksdienst voor Ondernemend Nederland: The Hague, The Netherlands, 2021. [Google Scholar]
  7. Rijksdienst voor Ondernemend Nederland. Electric Vehicle Statistics in the Netherlands; Rijksdienst voor Ondernemend Nederland: The Hague, The Netherlands, 2021. [Google Scholar]
  8. RVO. Nationale Agenda Laadinfrastructuur. Available online: https://www.klimaatakkoord.nl/documenten/publicaties/2019/01/08/achtergrondnotitie-mobiliteit−laadinfrastructuur (accessed on 15 January 2021).
  9. MRA-Elektrisch Werkprogramma 2019 Samenvatting. 1–20 April 2019. Available online: https://api1.ibabs.eu/publicdownload.aspx?site=noordholland&id=1100095163 (accessed on 15 January 2021).
  10. Gemeente Amsterdam. Laad Me: Strategisch Plan laadinfrastructuur 2030–2040. 2020. Available online: https://www.amsterdam.nl/wonen-leefomgeving/duurzaam-amsterdam/publicaties-duurzaam−groen/laad-strategisch−plan-laadinfrastructuur/?PagClsIdt=15860861#PagCls_15860861 (accessed on 15 January 2021).
  11. Rijksoverheid. Climate Agreement. 2019. Available online: https://www.rijksoverheid.nl/documenten/rapporten/2019/06/28/klimaatakkoord (accessed on 15 January 2021).
  12. de Rijksoverheid. Klimaatakkoord C2: Mobiliteit. Available online: Klimaatakkkoord.nl.2018. (accessed on 15 January 2021).
  13. International Energy Agency. Trends in Charging Infrastructure. 2022. Available online: https://www.iea.org/reports/global-ev−outlook−2022/trends-in−charging-infrastructure (accessed on 27 November 2022).
  14. Aminifar, F.; Shahidehpour, M.; Alabdulwahab, A.; Abusorrah, A.; Al-Turki, Y. The Proliferation of Solar Photovoltaics: Their Impact on Widespread Deployment of Electric Vehicles. IEEE Electrif. Mag. 2020, 8, 79–91. [Google Scholar] [CrossRef]
  15. Shahriar, S.; Al-Ali, A.R. Impacts of COVID-19 on Electric Vehicle Charging Behavior: Data Analytics, Visualization, and Clustering. Appl. Syst. Innov. 2022, 5, 12. [Google Scholar] [CrossRef]
  16. Palomino, A.; Parvania, M.; Zane, R. Impact of COVID-19 on Mobility and Electric Vehicle Charging Load. In Proceedings of the 2021 IEEE Power & Energy Society General Meeting (PESGM), Washington, DC, USA, 26–29 July 2021; pp. 1–5. [Google Scholar] [CrossRef]
  17. Brinkel, N.; Schram, W.; AlSkaif, T.; van Sark, W. A Quantitative Analysis of the Short-Term and Structural Impact of COVID-19 Measures on Electric Vehicle Charging Patterns. In Proceedings of the 2021 International Conference on Smart Energy Systems and Technologies (SEST), Vaasa, Finland, 6–8 September 2021; pp. 1–6. [Google Scholar] [CrossRef]
  18. Zhou, K.; Hu, D.; Li, F. Impact of COVID-19 on private driving behavior: Evidence from electric vehicle charging data. Transp. Policy 2022, 125, 164–178. [Google Scholar] [CrossRef] [PubMed]
  19. Helmus, J.; van den Hoed, R. Unraveling user type characteristics: Towards a taxonomy for charging infrastructure. In Abstract from The 28th International Electric Vehicle Symposium and Exhibition; Kintex: Goyang, Republic of Korea, 2015. [Google Scholar]
  20. Maasse, S.; van den Hoed, R. Charging Data Management, Five Issues to Solve. In Proceedings of the EVS 2019—32nd International Electric Vehicle Symposium and Exhibition, Lyon, France, 19–22 May 2019. [Google Scholar]
  21. Rijksoverheid. Timeline Coronavirus. Available online: https://www.rijksoverheid.nl/onderwerpen/coronavirus-tijdlijn (accessed on 1 December 2021).
  22. Centraal Bureau Statistiek. Environment and Energy during Corona; Centraal Bureau Statistiek: Heerlen, The Netherlands, 2021. [Google Scholar]
  23. Bovag. Invloed van Corona op de Mobiliteitsretail. Available online: https://mijn.bovag.nl/downloads/onderzoek-cijfers/invloed-corona−op-mobiliteitsretail−2020/bovag_invloed-corona−op-mobiliteitsretail_dec−2020 (accessed on 20 April 2022).
  24. Vereniging Nederlandse Autoleasemaatschappijen. Car Lease Market in Numbers 2020; Vereniging Nederlandse Autoleasemaatschappijen: Bunnik, The Netherlands, 2021. [Google Scholar]
  25. Centraal Bureau Statistiek. Growth Number of Pluggable Cars Continues; Centraal Bureau Statistiek: Heerlen, The Netherlands, 2021. [Google Scholar]
  26. Krabbendam, V. Dit Betekent de Harde Lockdown voor Straattaxi’s, Contractvervoer en Touringcars. Available online: https://www.taxipro.nl/special/2020/12/14/dit-betekent−de-harde−lockdown-voor−straattaxis-contractvervoer−en-touringcars/?gdpr=accept (accessed on 12 April 2022).
  27. Gemeente Amsterdam. Taximonitor 2020; Amsterdam, The Netherlands, 2020. Available online: https://openresearch.amsterdam/nl/page/72356/taximonitor-2020 (accessed on 12 April 2022).
  28. Redactie AT5. Koninklijk Nederlands Vervoer: “Dertig Procent van de Taxichauffeurs Is Door Corona Gestopt”. Available online: https://www.at5.nl/artikelen/203651/koninklijk-nederlands−vervoer-dertig−procent-van−de-taxichauffeurs−is-door−corona-gestopt (accessed on 12 April 2022).
Figure 1. Effect of COVID-19 lockdowns on charging behavior over time.
Wevj 14 00067 g001
Figure 2. Density plot for charging session start across the day for different phases in 2020–2022.
Wevj 14 00067 g002
Figure 3. Comparison of national traffic petrol sales (purple) with kWh charged in G4 municipalities (green) in 2020 [22].
Wevj 14 00067 g003
Figure 4. EV owner composition in the Netherlands in 2020 [24,25].
Wevj 14 00067 g004
Figure 5. Comparing the full set of sessions (green, top line) with the sessions in Sloterdijk office area (blue, lower line) and the sessions with behaviour that is associated with employees (pink line). kWh decrease is based on the kWh charged that was observed for each group in January 2020.
Wevj 14 00067 g005
Figure 6. User segments and decrease of kWh charged during COVID-19 lockdowns in 2020. The kWh decrease is determined by comparing the kWh charged of each group with their kWh charged in January 2020.
Wevj 14 00067 g006
Figure 7. Violin plot illustrating the differences in start time distribution between 6 p.m.−11 p.m.. From left to right: Curfew 1, Curfew 2, Month after, Month before.
Wevj 14 00067 g007
Table 1. Data variables and examples.
Variable Example
RFID60DF4D78
Address Prinsengracht 767, Amsterdam
Start Connection Date Time 24−04−2015 13:56:00
End Connection Date Time 24−04−2015 17:14:00
Connection Time 2:18:00
Volume 6.73 kWh
Table 2. Overview of analyses in this paper.
AnalysisQuestionData SelectionIndicators Results
Section 3.1
Impact analysis
What is the overall effect of COVID-19 lockdowns on various charging indicators? (2020–2022)All EV drivers Connection times, kWh charged, sessions, users & stations Baseline comparison, Line plot, Summary stats
Section 3.2
Fuel comparison
How does the decrease in kWh sales compare to the decrease in petrol sales for traditional vehicles? (2020–2021)All chargepointskWh charged (and external data of petrol sold)Baseline comparison, Line plot
Section 3.3
User comparison
Does this decrease also differ between specific user segments? (2020–2022)Employees, Office chargers, Taxi drivers, Shared vehicles kWh chargedFingerprinting, Baseline comparison, Line plot
Section 3.4
Curfew analysis
What was the effect of the 2021 curfews on the start times of charging in the evening? (2021)All EV driversStart times of charging in the evening Summary stats, Violin plot
Table 3. Comparison between January 2020 and March 2022 for EV drivers active in all months.
DateSessions/
User
Energy/Session (kWh)Connection TimeUnique Number of Charging Stations/UserSum of Energy Charged (kWh)Number of Unique Neighbourhoods Visited
January 202014.916.512.73.22211.94
March 202210.917.011.92.61591.58
Table 4. Parameters of Office comparison groups.
Comparison GroupParameters
All sessions (full set)All public charging data
Sloterdijk Office AreaAll charging from 17 charging points in an office location
Suspected employees
(office/commuters)
All charging sessions during weekdays (mon-fr), starting between 7–10 a.m. and connected between 3–10 h
Table 5. Number of active charging points and users.
Active ChargePoints and Users:
Sessions filtered on ChargePoints that have been online since Jan−2020
Point in time# unique RFIDs
(1 month)
Locations (used in 1 month)RFIDs / Locations
(1 month)
January 202061,86677308
June 202045,46075026.06
January 2021 *59,09274907.89
June 202171,92575099.58
January 202285,344732611.65
June 2022102,232705914.48
October 2022119,866733916.33
Active ChargePoints and Users:Full Set (Without Jan−2020 filter)
Point in time# Unique rfids
(1 month)
# of used locations (1 month)RFID / location
(1 month)
January 202061,98777308
June 202054,78788416.19
January 202166,75210,4096.41
June 202185,22511,8807.17
January 2022110,90013,3108.33
June 2022143,80814,4729.94
October 2022169,98915,82710.74
(* the number of RFIDs was higher in December 2020 than January/February 2021, CPO policy may have played a role).
Table 6. Summary statistics of sessions started in the evening during Curfew phases.
Summary Statistics Before Curfew
~1.5 Month Sample
First Curfew
~2 Month Sample
Second Curfew
~1 Month Sample
After Curfew
~1 Month Sample
Sample size (# of sessions)700,633 910,988 314,976 340,565
# of sessions that started between
7 p.m.–8 p.m.
37,477 70,828 23,453 20,207
Percentage5.3%7.8%7.4%5.9%
# of sessions that started between
8 p.m.–9 p.m.
30,052 40,526 16,958 15,283
Percentage4.3%4.5%5.4%4.5%
# of sessions after 9 p.m. 54,53022,82825,153 22,646
Percentage7.8 %2.5%7.9%6.6%
# of sessions that started between
9 p.m.−10 p.m.
24,660 13,786 11,361 11,046
Percentage3.5%1.5%3.6%3.2%
Disclaimer/Publisher’s Note: The statements, opinions and data contained in all publications are solely those of the individual author(s) and contributor(s) and not of MDPI and/or the editor(s). MDPI and/or the editor(s) disclaim responsibility for any injury to people or property resulting from any ideas, methods, instructions or products referred to in the content.

