1. Introduction
Autonomous and electrical vehicles (EV)s are reshaping transport sector. They are subsystems of the future intelligent transport systems (ITS)s [
1] and have the potential to bring safer, more efficient, environmentally friendly, and sustainable transport. We are in a transition from personally owned means of transport towards a mobility as a service (MaaS) platform. Thanks to AVs, we will have more efficient transport, with less pollution and better safety. Electric cars make it feasible to have green transport if the electricity used for them is green [
2]. EVs are reducing greenhouse gas emissions from internal combustion engines (ICE)s. Thanks to MaaS, we will have a smaller number of vehicles on the road and the same benefits introduced by AVs. However, the introduction of AVs on the highest level of autonomy, with no driver involved, brings a number of ethical, moral, and legal issues that must be resolved. MaaS has its own level of maturity, and it varies around the world. As with any new product, public acceptance of a new technology or a new service (in this case, mobility) is a key factor in its implementation. MaaS is available in urban areas in Europe, North America, and Australia, and increasingly in Asia as well. A field investigation into maturity requirements to operate mobility as a service in Rome [
3] has shown various limitations. One of them is the low public readiness to pay for the service. Electrical and autonomous vehicles will be subsystems in new mobility solutions, but they all have their own technology acceptance frameworks. In all of them—AVs, EVs, and MaaS—information and communications technology (ICT) plays a key role. Typical MaaS users belong to social groups which are ICT users, regular commuters, and millennials. Global introduction, maturity, and acceptance of MaaS is subjected in many other studies, like one in Sydney [
4]. AVs and EVs are just transport modes in multimodal MaaS and subsystems in intelligent transport systems.
ICT supports vehicles through a connectivity and networking system known as a vehicular ad hoc network (VANET). VANET is also a subsystem in the intelligent transport system. ITS monitors traffic using Internet of Things (IoT) and will soon control it with the aid of artificial intelligence (AI). EVs have few hybrid technologies while AVs are categorized into five, according to the National Highway Traffic Safety Administration [
5], or six levels of autonomy, as per the Society of Automotive Engineers (SAE) [
6] taxonomy.
According to the newest SAE classification, from 2021, AV at level 0 has no autonomous functions, and the driver always has full control of the car. At level 1, the car has some autonomous features like automated braking or electronic stability control, but the driver is still in charge of steering. At level 2, the car can accelerate or steer on its own, but the driver still needs to be focused and prepared to take over at any time. Level 3 vehicles can perform all driving activities under certain circumstances, but the driver must be ready to take over when necessary. The driver must still be present, even when the vehicle is autonomous at level 4, and take over in some circumstances, like inside a specific geographic area, or in certain weather conditions. When a vehicle reaches level 5, it is completely autonomous and does not need a human driver.
All technological innovations are disruptions on the market and the automotive sector must respond with new business models. As AV and EV transitions are global, we have applied a hard systems approach (HSA) and soft system approaches (SSAs) in management, to predict and propose future pathways. HSA is used to deal with the AV transition in terms of technology, referring to hardware and software—sensors, actuators, processors, control software, and AI algorithms—used to make vehicles autonomous. AI algorithms for real time processing, self-driving, are still being improved, as it is an evolving process [
7]. Big data processing for driving must be performed in real time, i.e., fast enough in the defined time frame, known as the response time. That response time should be the same as humans’ reaction time (RT), 180–200 ms, as given in [
8], or better. Our auditory RT (ART) is shorter than visual RT (VRT). ART is around 140–160 ms, which is less that of VRT. This is the reason that active safety applications, found on the level 1 and 2 of the AVs, use audio warning messages.
Finally, not everyone will decide to invest in full autonomy. At the lower levels, levels 1 and 2, driver warnings and many other applications for active safety are already in place and there are no issues in adoption. Issues arise at the highest levels, levels 4 and 5, i.e., with full automation. AVs on that level are mobile robots on the road. At levels 3 and 4, the driver is expected to take over control of the vehicle. The other parameter, driver response time to take over control of the vehicle, is also extremely important, as presented in the “Designing for the Extremes: Modeling Drivers’ Response Time to Take Back Control From Automation Using Bayesian Quantile Regression” [
9].
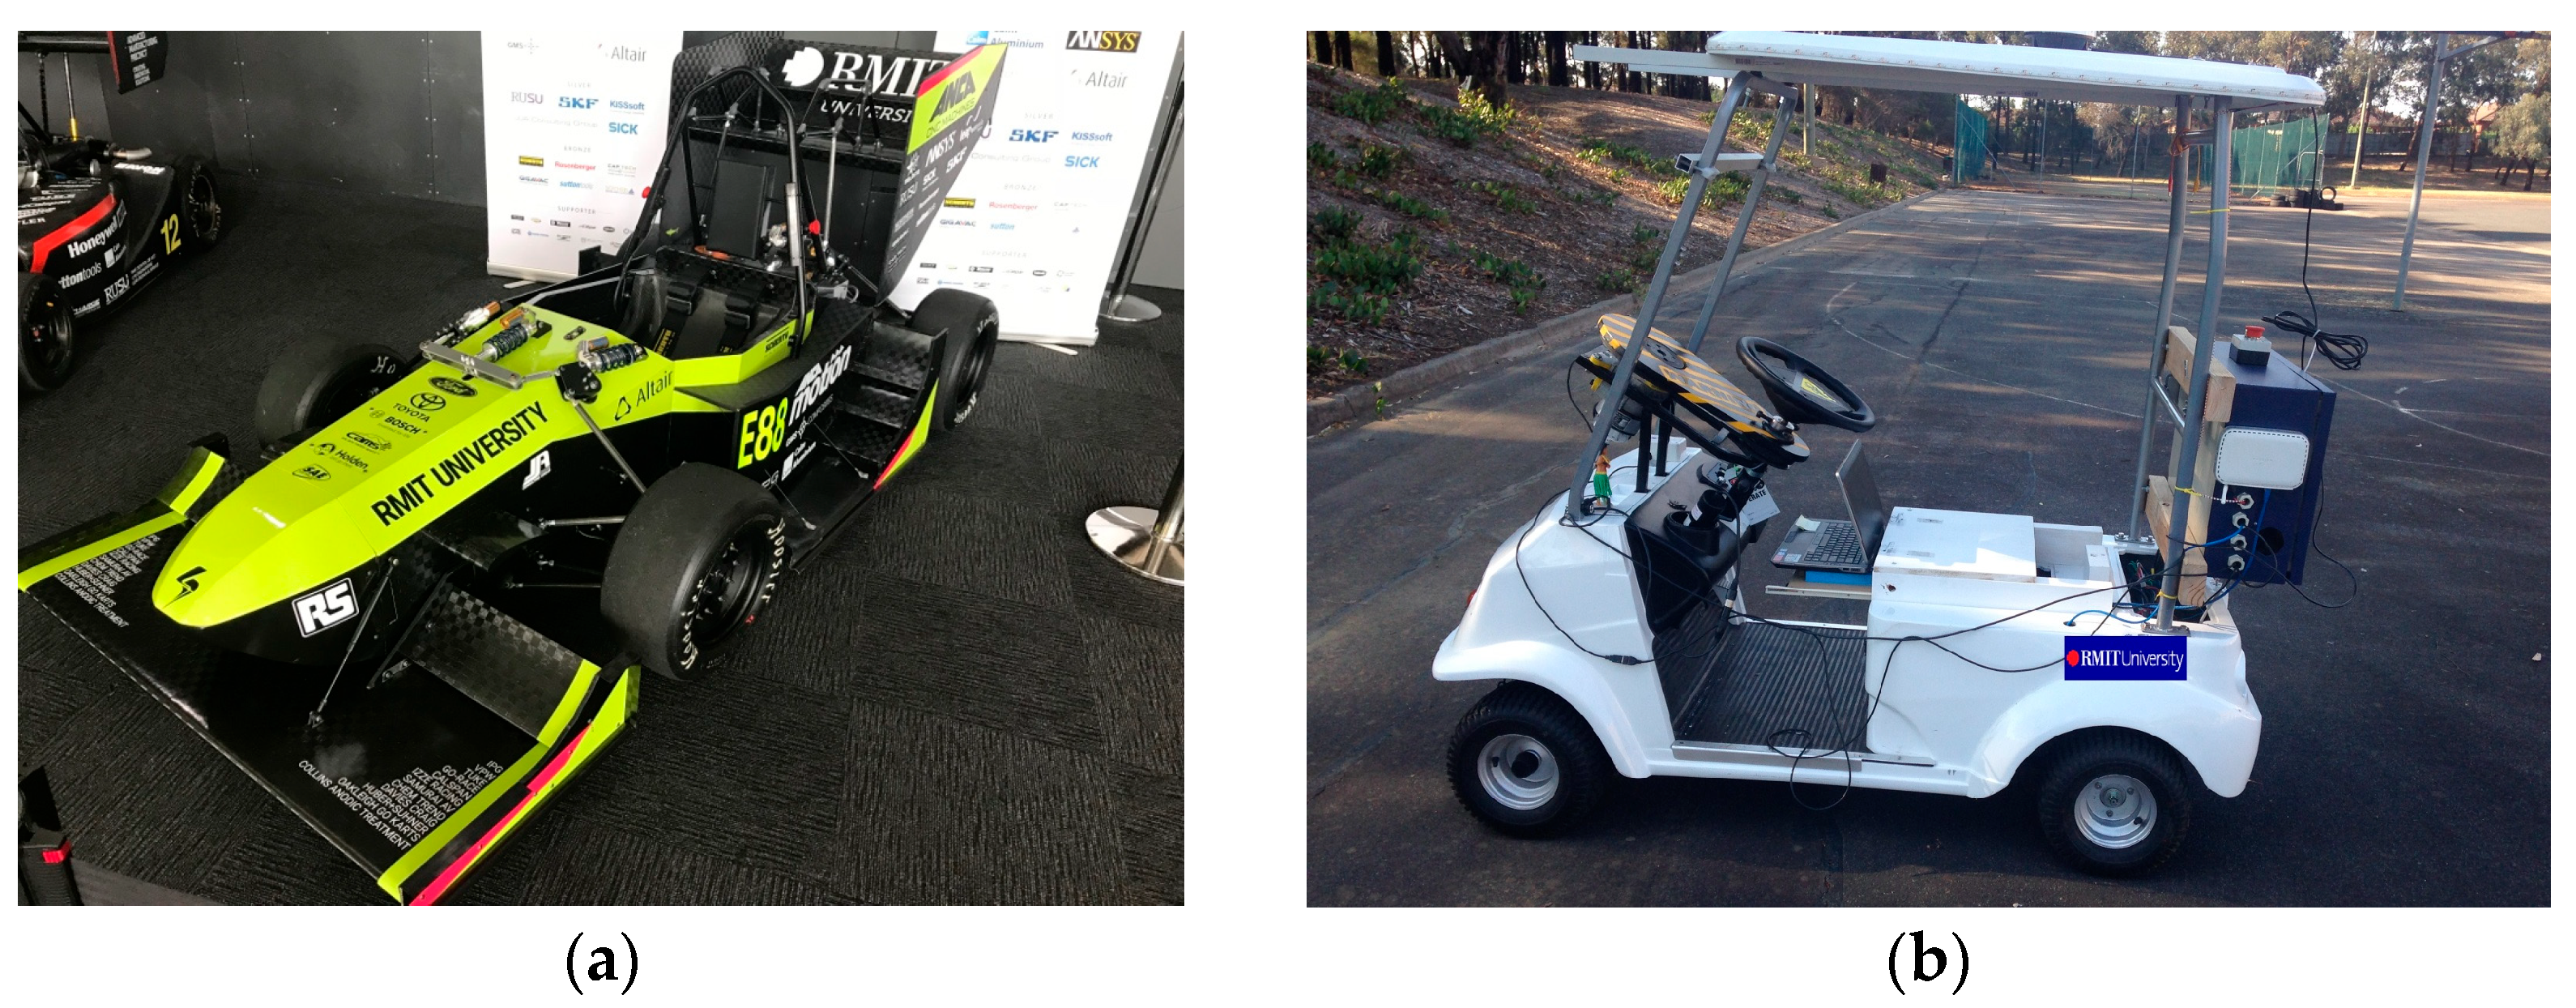
Figure 1a shows an electrical vehicle designed by RMIT University students, while
Figure 1b shows an RMIT autonomous vehicle. AV software was developed for a commercially available electrical vehicle. A MATLAB program was running on a laptop sitting in the driver’s seat, replacing the driver. LiDAR was used to map the environment. We have developed sampling-based robot motion planning algorithms and tested them with our AV [
10].
Applying HSA, we concluded that the technology is ready for the transition. The next step was to apply SSA. SSA is generally used for solving management and business problems. In the scenario of full AV introduction, SSA is used when handling moral and ethical dilemmas and concerns with governmental rules and regulations. Since mobile robots, i.e., our autonomous vehicles, coexist and interact with the environment and other AVs and non-AVs on the road, we must deal with ethical and moral issues, and we require a regulatory framework to approve the application of those intelligent systems.
In any system, all stakeholders are involved in making decisions. They have different views of the systems, enabling new ways of solving problems and moving forward. With SSA, we are managing the transition to autonomous vehicles by working with all parties, including the government, traffic authorities, manufacturing companies, and the public. The introduction of autonomous vehicles has raised concerns about user safety, costs, reliability, sustainability, and ride comfort [
11]. We use the soft systems approach because it is a method for comprehending and undertaking difficult issues with a lack of clear solutions or agreements. The SSA approach is defined by a focus on comprehending the dynamic and complex nature of real-world problems. It develops workable solutions that consider the requirements and viewpoints of stakeholders. The SSA approach emphasises the use of qualitative and participative data collection and analysis. These techniques, which could include interviews, focus groups, presentations, and seminars are used to collect primary data about the experiences, viewpoints, and requirements of various stakeholders. The use of conceptual models and diagrams to describe and comprehend complex systems and problems is another important SSA component. Relationships between various components are represented using the system’s approach, which can also contain conceptual frameworks, mental models, and causal loop diagrams. They are used to identify important drivers and feedback mechanisms. Due to the complex and dynamic nature of the systems, the SSA approach is especially well suited for the management of the introduction of autonomous cars. Following that, we have conducted longitudinal surveys. They have included participants from all stakeholder groups.
AVs are subsystems of ITSs, which are subsystems of smart cities. Smart cities are metropolitan areas that use cutting-edge technology to enhance quality of life among citizens and economic growth. They use the Internet of Things (IoT), which generates big data, ICT, and AI to process data. As they have the potential to revolutionise transport, decrease traffic and pollution, and enable new mobility services, autonomous cars are seen as a crucial part of smart cities. The futuristic city of NEOM, which is being constructed in Saudi Arabia, is one example of a smart city that is being developed [
12,
13]. The 26,500 square mile metropolis of NEOM is built to be a global hub for cutting-edge technologies [
14]. Autonomous vehicles will be used for transport services and to link the city to the surrounding areas. The deployment of autonomous vehicles in NEOM is anticipated to provide several advantages, including greater mobility for citizens, increased safety, and decreased congestion and pollution.
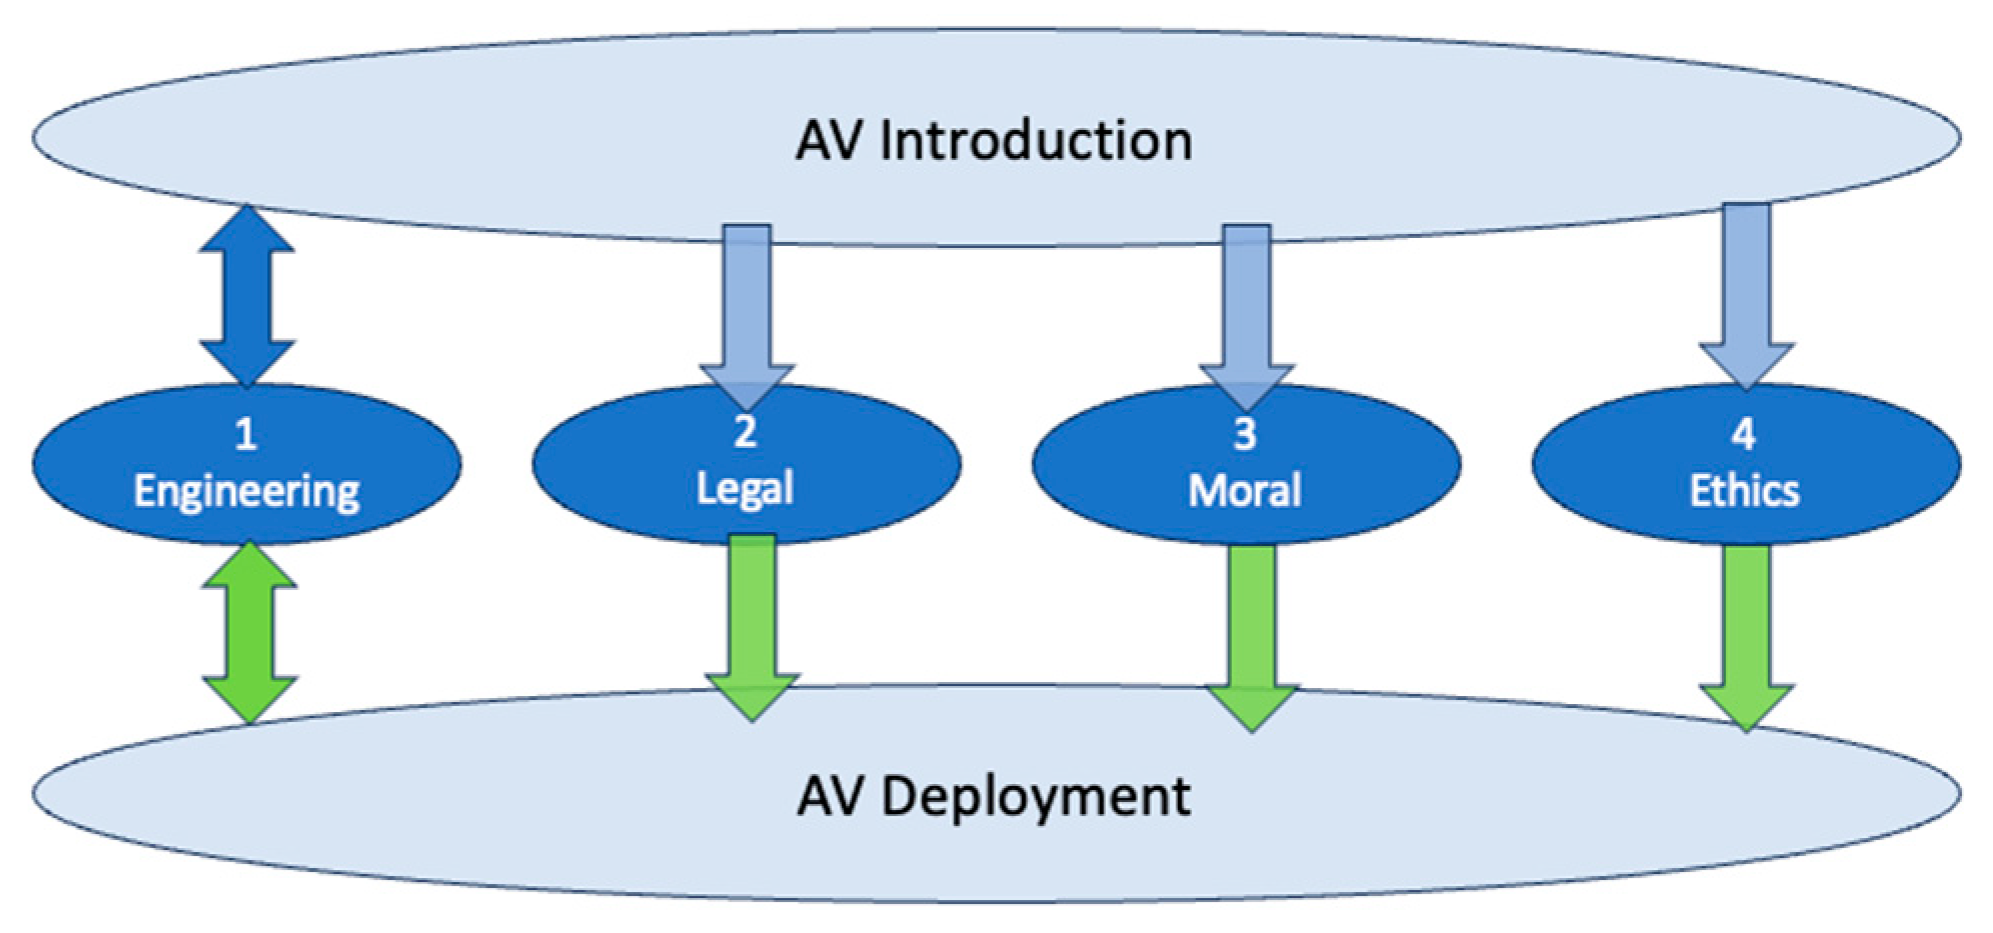
AV technology is ready for deployment when the following four stages of the technology acceptance model (TAM) are completed: engineering, legal, moral, and ethical. They are shown in
Figure 2. The engineering stage has bidirectional links, because we have feedback involved in the continuous engineering improvements based on regular evaluations, technology progress, and changes in customer requirements.
Autonomous vehicles, at all levels of autonomy, play a significant role in the development of modern transport systems [
15]. Clarifying issues, especially from stage 3 to stage 5, as shown in
Figure 2, is the most significant obstacle to AV adoption, not the technical aspect [
16]. Despite the amount of potential effective solutions from the adoption of self-driving vehicles in improving road safety, we need to highlight benefits associated with self-driving vehicles. According to previous studies, there is notable concern among drivers about self-driving vehicles and many of them are hesitant to use them [
17]; however, drivers welcomed active safety through driver warning systems [
18]. Therefore, the basic benefits of AVs, such as increased safety and fuel efficiency, may not be enough [
19]. We believe that increased public awareness of AVs may contribute to promoting this technology and advance its adoption.
While some efforts were made to understand why people would use AVs or to what extent social and personal factors may influence this acceptance, few of them have measured the extent of familiarity with AVs. The community’s attitudes and readiness to purchase AVs have an impact on when and how autonomous technologies will be adopted. The presented study aims to fill in this research gap and obtain stakeholders’ views. We investigated public awareness of AVs and measured consumers’ readiness for the transition to new technologies in Saudi Arabia. Up to now, there has been a lack of studies on public opinion about autonomous vehicles in the Middle East.
2. Materials and Methods
Our methodology defines various approaches and procedures used in finding new knowledge and relationships in investigated domains across engineering, social, business, medical, and other. In natural sciences, we use mathematical apparatus in modelling systems. Unfortunately, mathematical formulas cannot be applied to all systems. In such scenarios, we use data collection for model development and further analysis. Three methodologies could be applied for this type of research: qualitative, quantitative, and mixed methods.
The qualitative approach is used to collect non-numerical data such as opinions, emotions, and behaviour. Using a quantitative method, numerical data types are collected that can be quantified, measured, and graded. In this case, after data collection, statistical analysis is used for data interpretation, correlation, presentation, or system structure and behaviour. In the next step, inductive reasoning could be applied. It starts with specific or particular observations to determine general findings. Finally, there is a combined, mixed method. We have used a comprehensive approach in combining both qualitative and quantitative methods. Open-ended questions were used to collect qualitative data, and Likert scale survey questions to collect quantitative data. Combining qualitative and quantitative research methods can achieve better results.
A questionnaire is a primary research method used to identify public perception about AVs due to its ability to gain in-depth opinions [
20,
21]. In 2022, a survey was conducted on the topic of AVs introduction in Saudi Arabia as a follow-up to the KSA survey from 2021. Our investigation methodology was to conduct a cross-sectional survey first. A cross-sectional study is an approach for looking into responses from all stakeholder groups at a certain point in time. Follow-up investigations are longitudinal studies, collecting data repeatedly over a time. The first cross-sectional survey conducted in KSA was during the COVID-19 restrictions in 2021 and managed to obtain 213 responses, which was already reported. This paper is a report on the second longitudinal survey conducted the following year, in 2022. Differences in findings are highlighted in this report.
The purpose of the study was to collect primary data and compare survey results from one country to another and in different time periods. We are planning to conduct multi-year longitudinal studies. The results will be utilized to assist legislation preparation, technology development, and to increase public awareness. Throughout this section, we outline the survey instructions, the questionnaire content, the demographic data of the participants, the limitations, the validity, and the model selection.
The questionnaire, with 31 questions, was designed to collect de-identified data. Responses were collected through a secure survey design system, Qualtrics. The investigation was approved by the RMIT University Ethics Committee (#23507). All recommended best practices for executing the survey were followed. The KSA survey was in Arabic and all mandatory instructions were translated. In the pamphlet, we explained the purpose of the survey and reminded respondents that participation is voluntary and that their comments would be kept private and anonymous. After presenting a brief description of the survey, the participants were asked about their age and whether they are drivers themselves. The survey would end at this point for a given participant if that participant was underage (younger than 18 years of age) or did not drive before. It was mentioned to participants that the survey would take about 7–10 min to complete. Contact details of the principal investigator were given for any possible enquiries. The survey started when a participant’s consent was obtained. Each participant was free to withdraw at any time. We wanted to measure participants’ familiarity with AVs, expected benefits, and concerns surrounding adopting autonomous technology.
The questionnaire had four sections. Demographic data were collected first, including gender, age, educational levels, stakeholder group, and current mode of transport used. The next set of questions was aimed at assessing the depth of the respondents’ familiarity with the AVs. Afterwards, a set of questions were focused on respondents’ expectations about AVs, car ownership in the future, preferred level of automation, time to buy, and timeframe for the transitions in Saudi Arabia. The third section covers anticipated benefits and risks from the transition into autonomous technology.
In the last 15 questions, the survey proceeded with enquiries into the importance of AVs’ specific functionality, such as safety, comfort, performance, and system security. The use of quantitative data is the principal focus of the questionnaire and they are collected through multiple-choice questions. The participants were also asked two open-ended questions used to collect qualitative data. They were asked to give their opinions about the benefits and the risks of AV transition: “Please list the benefits you can predict from this transition” and “Please list the risks you can predict from this transition”. All questions measured different attributes, and the scales of each are given in the
Table 1.
For the purposes of this study, two dependent variables were used based on the following questions: “To what extent do you see benefits from the transition to autonomous vehicles?” and “To what extent do you see risks from the transition to autonomous vehicles?”. These questions aim to analyse the public’s awareness of AVs. One of the hypotheses is that those who are better informed of the broader benefits of driverless transport could have a higher interest in buying an AV with a higher level of automation sooner, compared to those who are less informed of the overall benefits.
In terms of the grouping strategy, the categories for user demographics, such as gender, age, and education level were designed based on previous studies in the field [
22]. The inclusion of these variables was intended to test whether there are any differences between the categories in relation to the adoption of AVs. For example, previous studies found that age and gender might affect consumers’ willingness to use driverless vehicles; for example, those who are men and young are more likely to have positive attitudes towards AVs [
23,
24,
25,
26].
In addition, the survey included two clustering questions that specify the typical members of major stakeholder groups and their roles in their organisation. This provides a better quality of findings through classifying them according to specific groupings. That enables us to determine the causal relationships between the public’s awareness of AVs and their status of belonging in various stakeholder groups.
Further to this, prior knowledge of AVs was examined, as participants were asked whether they have ever heard about or seen an autonomous vehicle before participating in this survey. This allowed us to better understand their perception of AVs. For example, those who have seen AVs before have different biases from those who have just heard about AVs, and subsequently from those who have never heard about or seen AVs at all. These three distinct categories were beneficial in categorising responses into groups for representing their varied perception of AVs based on prior knowledge.
In terms of customer opinions and preferences, we asked about the willingness to buy a vehicle with a certain level of AV technology. We asked about the timing of the purchase as well as opinions of car ownership. Finally, we enquired about their expectations for the timing of full AV introduction in Saudi Arabia.
The questionnaire was distributed online to residents of Saudi Arabia and was accessible for two weeks, starting on the 20 June 2022 and closing on the 3 July 2022. During this period, a total of 115 surveys were finalised, but just 108 were considered to be valid, among respondents aged 18 and over. Out of 108 participants, 17.6% were women and 82.4% were men. Nobody selected the “prefer not to say” option.
Table 2 presents the demographic characteristics of the 2022 Saudi Arabia survey. Since each group has more than 15 samples, it enables us to include an independent samples
t-test for each demographic to compare the gender differences. The results showed a range of credentials in terms of age, level of education, and current management role. The respondents’ ages ranged from 18 to over 55, where the majority of participants (40.75%) were in the age group of 26–35 years old (compared with 19.25% nationally [
27]). The younger age group, aged 18–25 years old, represents 22.22% of the sample (compared with 13% nationally [
27]), while middle-age group, aged 36–55 years old, represented 36.11% of the sample (compared with 32.9% nationally [
27]).
More than half of the participants (>52%) have a higher education level (master’s degree or another postgraduate degree). This demographic differs from the previous studies [
28,
29] and is higher than recent studies [
30,
31]. The survey has also involved a question about the currently used mode of transport. The majority of respondents (96.3%) are car owners. Just 3.7% of respondents use public transport. Respondents were from three major stakeholders’ groups, which are industry (12.4%), government (59%), and general public (28.6%).
The respondents’ management role was recorded using a scoring system from the highest level of leadership or management to no management role at all. There were six levels of choice. We had the following responses: At the highest level, level 5, we had 29.5% participants. Following that, level 4 comprised 21%, level 3 comprised 12.4%, level 2 comprised 9.5%, level 1 comprised 11.4%, followed by level 0 at 16.2%. Women scored less than the men on average age (t = −2.9883,
p = 0.006) and the level of management role (t = −2.4485,
p = 0.022). This is due to the following reasons: (a) this study was conducted in Saudi Arabia, where women could not drive legally until June 2018 (about four years before the survey was conducted); (b) in the Saudi workforce, men have dominated this sector for decades, and the participation of women has effectively commenced in the past few years, since 2018. Accordingly, there are constraints in our survey. Most of the participants were male, comprising 82.4% of the respondents, compared to 57.76% nationally [
27]. Despite the fact that the difference in the genders’ sizes does not generate any bias, this limits the representation of one gender. However, the percentage of women participants in this study is higher than in recent studies, as reported in [
31]. According to the National news [
32], Saudi women represent approximately 35% of the Saudi workforce.
Another constraint is that only one response was recorded from a participant older than 55 years. This is most likely because the study was distributed over social networking websites and online automotive groups. In Saudi Arabia, this older age group is hard to be found there. Most of the participants were in the age interval of (25, 55) years, representing 76.7% of the sample (compared with 51.86% in population nationally [
27]).
Looking at the population of Saudi Arabia, the majority of people are aged between 25 and 55 [
27]. Therefore, it could be the most important group in which to analyse opinions surrounding the adoption of and interest in driving AVs in the coming years. This should not be considered as a constraint when drawing conclusions from the survey data. In addition, to overcome this issue, we have merged two age groups, “36–55” and “above 55”. The new group is called age “above 35”.
Another constraint that should be considered is that no responses have been recorded from the traffic authorities; they are one of four major stakeholder groups. It could be a cause of security restrictions. This group might not be allowed to participate in any survey without permission from higher authorities. In Saudi Arabia, people working for traffic authorities are working under government regulations. Since almost 60% of responses were recorded from respondents in the government group, this percentage could be used to represent both groups.
No responses have been recorded from drivers with a primary school education level. This is most likely because the Kingdom of Saudi Arabia requires citizens to attend school and gives grants for those who study higher education. Accordingly, this is not a real constraint.
Another constraint is that 96.3% of the respondents are car owners. That does not provide a good representation of people using public transport. This could be due to the limited options available for travellers, since moving around in Saudi Arabia often requires a car. It is not a surprise that taxicabs are prevalent in the Kingdom. Transport by rail in Saudi Arabia is a relatively new option and only exists in some parts of the country as a link between cities. This will not cause bias, but it does limit the representation to one transport mode.
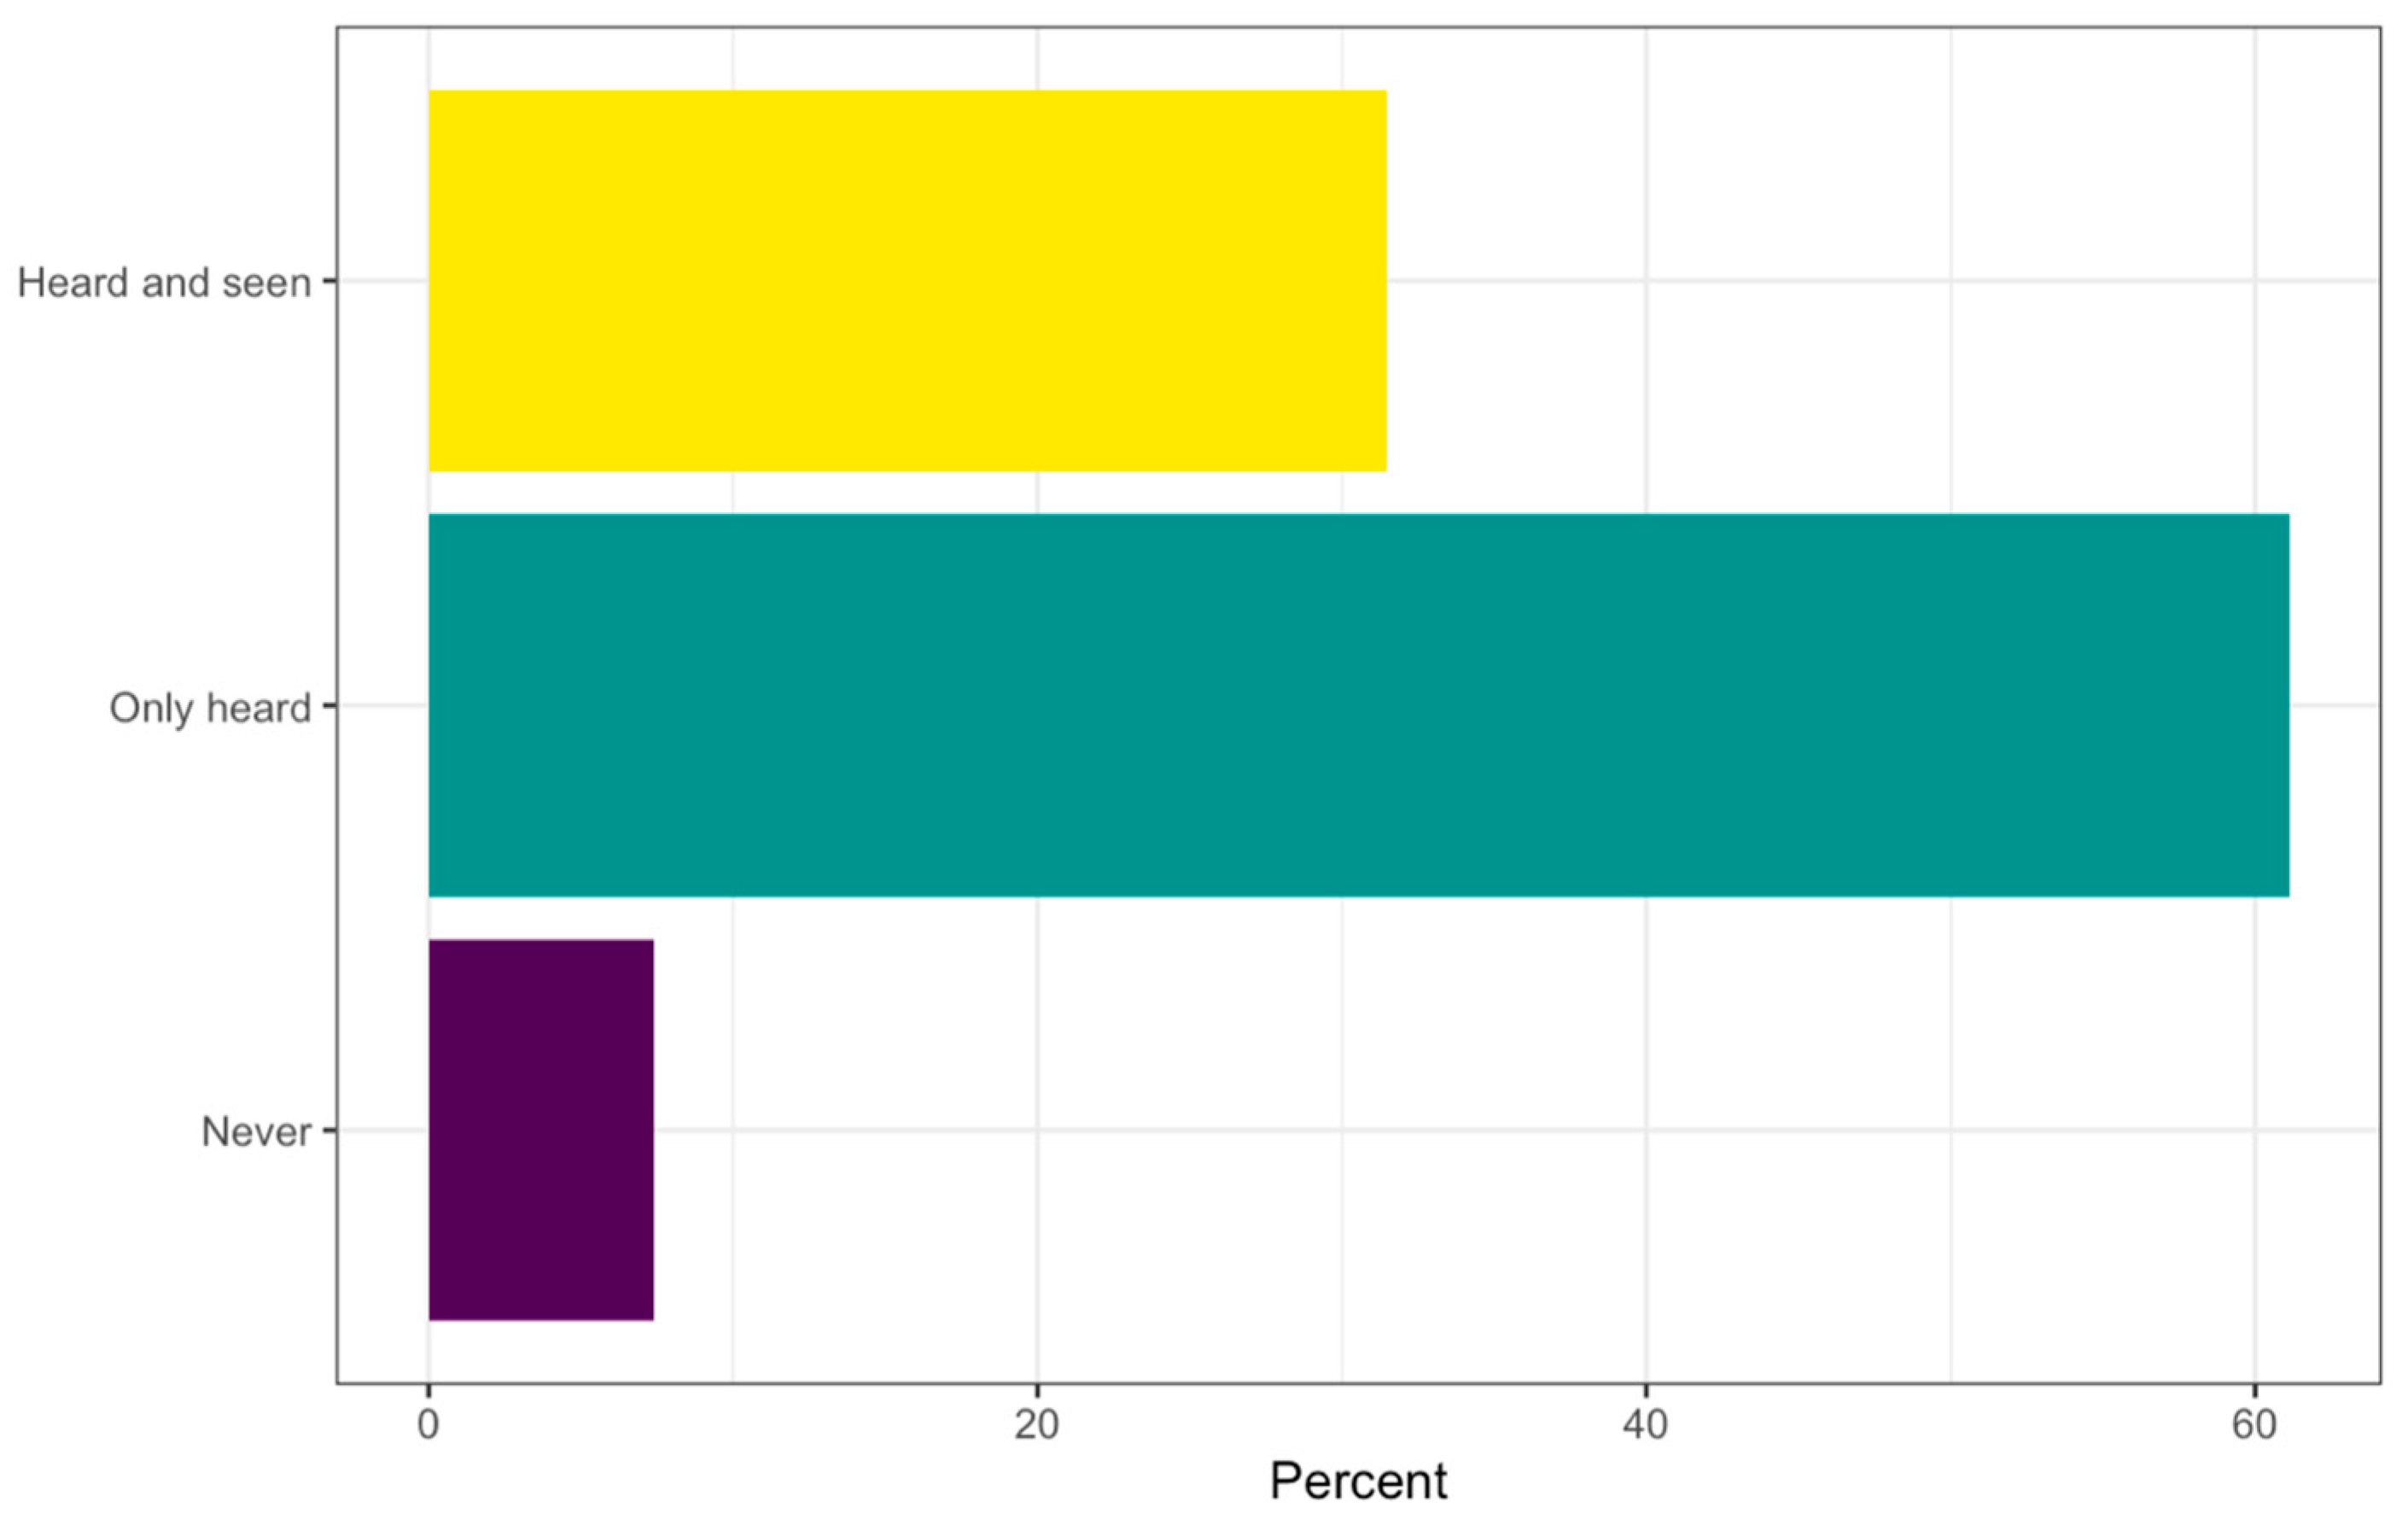
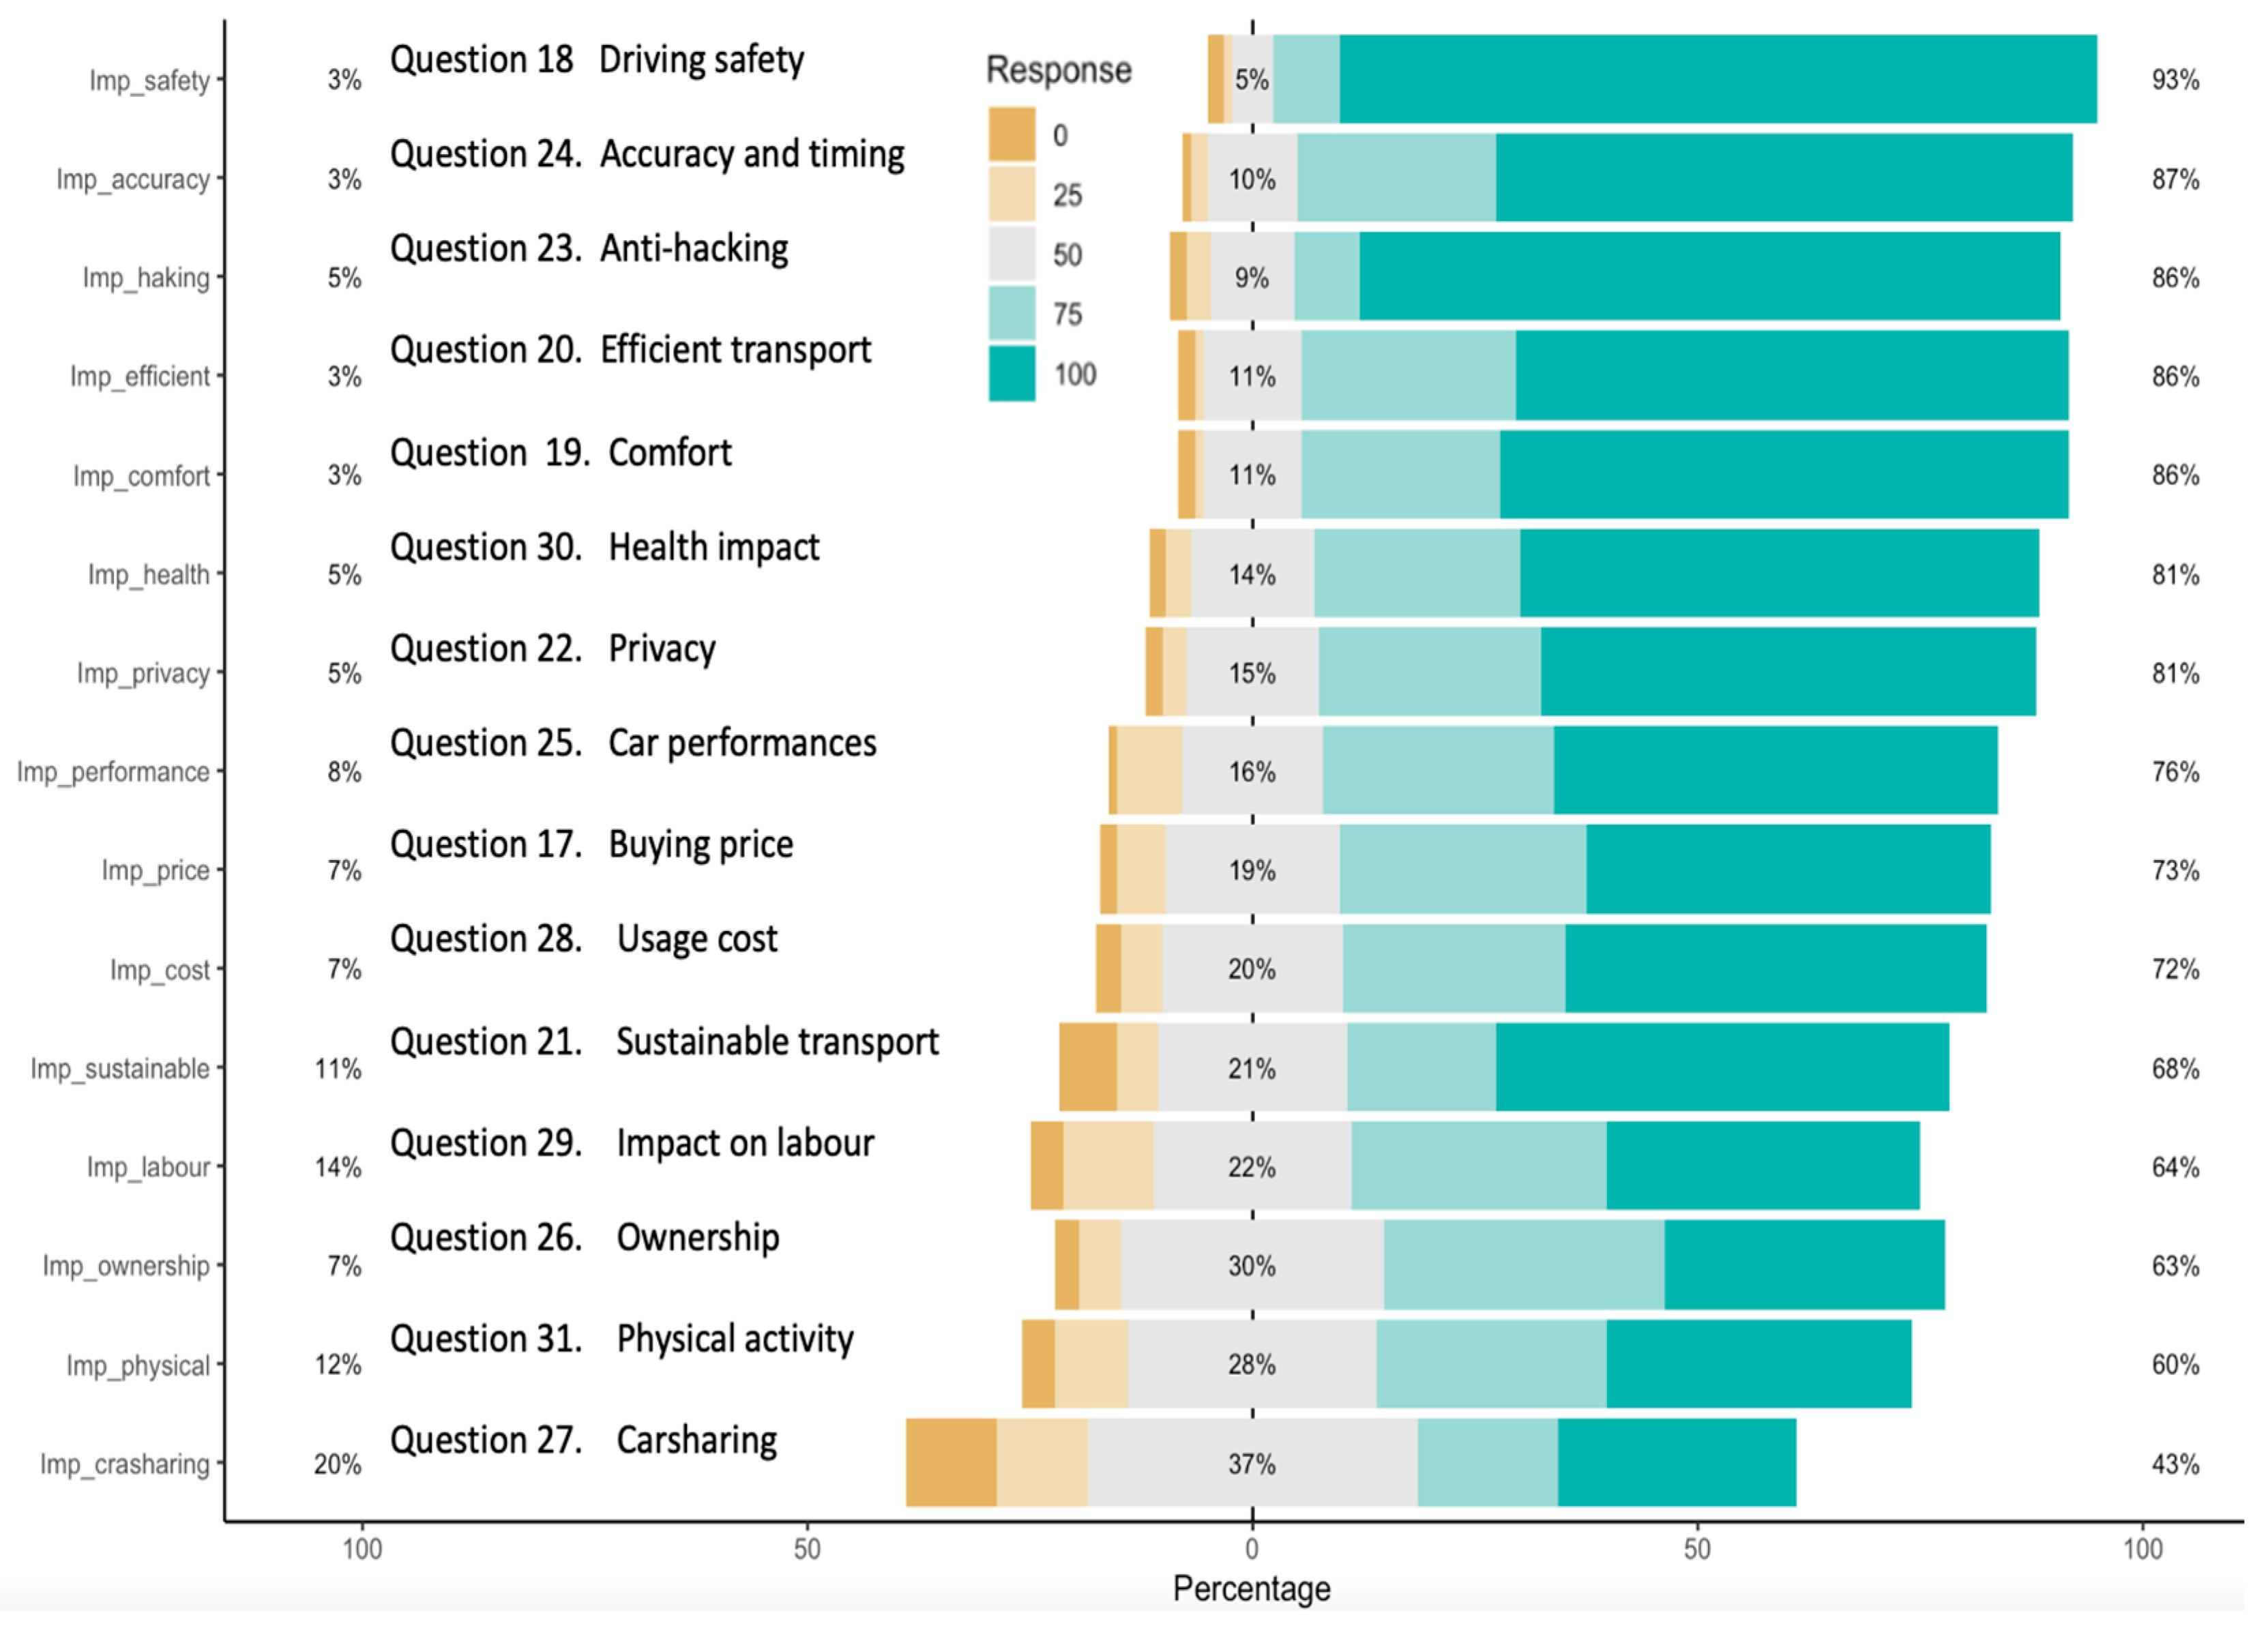
Although that there are some limitations associated with the selection of participants, our study has gathered responses from individuals holding roles in diverse levels of management in the industry, government, and public sectors. This has provided a wide range of responses. It enables us to see the differences between the major stakeholder groups. More than 90% of participants have heard about self-driving vehicles before participating in this survey, as shown in
Figure 3. The fact that we obtained responses from people who reported prior knowledge of the existence of AVs promotes the validity of the study. Their responses to the questions on their opinions and preferences surrounding AVs were answered with better knowledge as a result of their prior awareness. Alongside these points and in contrast to the existing studies, there was diversity in terms of their age and education levels. Therefore, the validity of this study is maintained due to the variety obtained in respondents’ categories and demographics (see
Table 2).
The fact that this survey was conducted in Saudi Arabia means that it does not represent the perceptions among the global population. We compared our results with the findings of a survey conducted in Saudi Arabia the year before and with other surveys of a similar nature conducted in other nations around the world. The sample of survey participants is sufficiently diverse to reliably represent the general population. Therefore, we anticipate that our investigation provides a contribution to the general research on this emerging technology.
We used classical statistical methods in our data processing because they have several advantages. Classical statistical methods often provide results that are easy to interpret, making them accessible to a wide audience. Considering the recent changes in the law surrounding women drivers in Saudi Arabia, we specifically utilized a t-test to explore the potential differences between men and women in terms of their age group, education level, transport mode, stakeholder group, and level of management role. This choice aligns with the recognition that demographic factors, including age and gender, were indicated in previous research as influential factors affecting individuals’ comfort, trust, and acceptance of autonomous technologies. By strategically implementing the t-test we sought to uncover and address any demographic variations that might have impacted the participants’ responses in our study. Also, we used a t-test to determine the preferred level and willingness to pay for AVs to measure the overall interest in owning and willingness to pay for self-driving vehicle technology. Other descriptive statistics were summarised to gain a better understanding of opinions, concerns, and general acceptance among Saudi drivers. The model that we have used is explained in the following section.
Model Approach
An ordinal logistic regression (OLR) approach was applied to examine significant factors that could help in understanding the level of awareness of AVs in Saudi Arabia. We used the benefit perception of AVs as a dependent variable, and this is defined through the benefit responses seen from the transition to increased use of AVs. OLR is a widely used classification method with several key advantages. Firstly, OLR is useful when the dependent variable is classified into three or more ordered categories. For example, the benefits of adopting autonomous technology in this study, with a 5-point Likert scale, is a perfect context for the application of the OLR method. Secondly, the OLR method does not need to assume equal intervals between scoring categories, unlike other regression models. Thirdly, the OLR method includes the ranking information in the dependent variable when returning the information on the contribution of each independent variable based on the cumulative-odds principle. Note that the interpretation of an estimated regression slope for OLR is somewhat complex. It is considered to be one of the most respected methods in the field of data analytics.
Before we fitted the ordinal logistic model, it was necessary to decide what outcomes to compare and what the most reasonable model was for the logit. In our case, we wanted to compare the lower probability with higher probability of public perception of benefits from the transition to increased use of AVs. Therefore, the proportional odds model was deemed to be suitable due to the following attractive characteristics: (a) instead of considering the probability of an individual event, it considers the probabilities of that event and all events that are ordered before the focal event in the ordered hierarchy, and compare it to the probability of a larger response; (b) it provides explainable and straightforward coefficients of the regression due to the transformations used during the estimation and the log odds interpretation of the output.
The coefficients and the intercept have different interpretations in the OLR model. Unlike simple linear regression, in the OLR model we obtain (J-1) intercepts, where J is the number of categories in the dependent variable. The intercepts can be interpreted as the expected odds in the listed categories, whereas the coefficients of the regression will be interpreted in terms of the increase in the log odds. Note that a lower cumulative odds value corresponds to fewer observations in the lower score categories, which results in a trend for higher scores. To understand more how to interpret the coefficients, let us first establish some notation and review the concepts involved in ordinal logistic regression.
Let
represent the response variable, in this case, “perceptions of the benefits associated with the transition to increased use of AV”, on a scale with
-ordered levels of categories (i.e., 1 to 5; with 1 = no benefits at all and 5 = associated benefits of very high level). Then, we use
to denote the probability of
, falling at or below a particular level, with j taking values from 1 to J. In this context, Equation (1) expresses the odds of
being less than or equal to a specific level.
Given that
is zero, and division by zero is impossible, the logarithmic function is introduced. Consequently, the log odds, often referred to as the logit, is defined by Equation (2).
The partial proportional odds can be parametrized as given in Equation (3).
where
is the model intercept and
…
are model coefficient parameters representing the slopes with
p independent variables for
. More details on ordinal logistic regression can be found in textbooks on logistic regression models [
33,
34]. The here-presented evaluation, plots, and analysis depict the distribution of results for most of the questions.
3. Results
A total of 115 participants completed the survey; 15 of the respondents added further commentary about the study. They suggested changes that might be made in the following longitudinal surveys. Approximately 75 participants reported their expectations surrounding the benefits and risks we might face during the transition to increased use of AVs. After inspecting the data, 7 responses were removed due to incomplete answers, resulting in a final sample of 108 responses. Although 7 entries were deleted, the remaining sample size of 108 is sufficient enough to perform the analysis.
Participants’ responses to the question related to prior knowledge of AVs revealed that the majority of them (more than 90%) have already heard about autonomous or self-driving vehicles before participating in this survey. However, only 30% of respondents have previously seen AVs, as seen in
Figure 3. Furthermore, the respondents’ age and level of education serve as the key measures for comparison when examining their AV-related concerns, since these two characteristics were identified as having a significant impact on respondents’ perceptions of AVs, as seen earlier [
28]. Therefore, these two factors can be compared to the initial question of the participants’ prior knowledge of AVs.
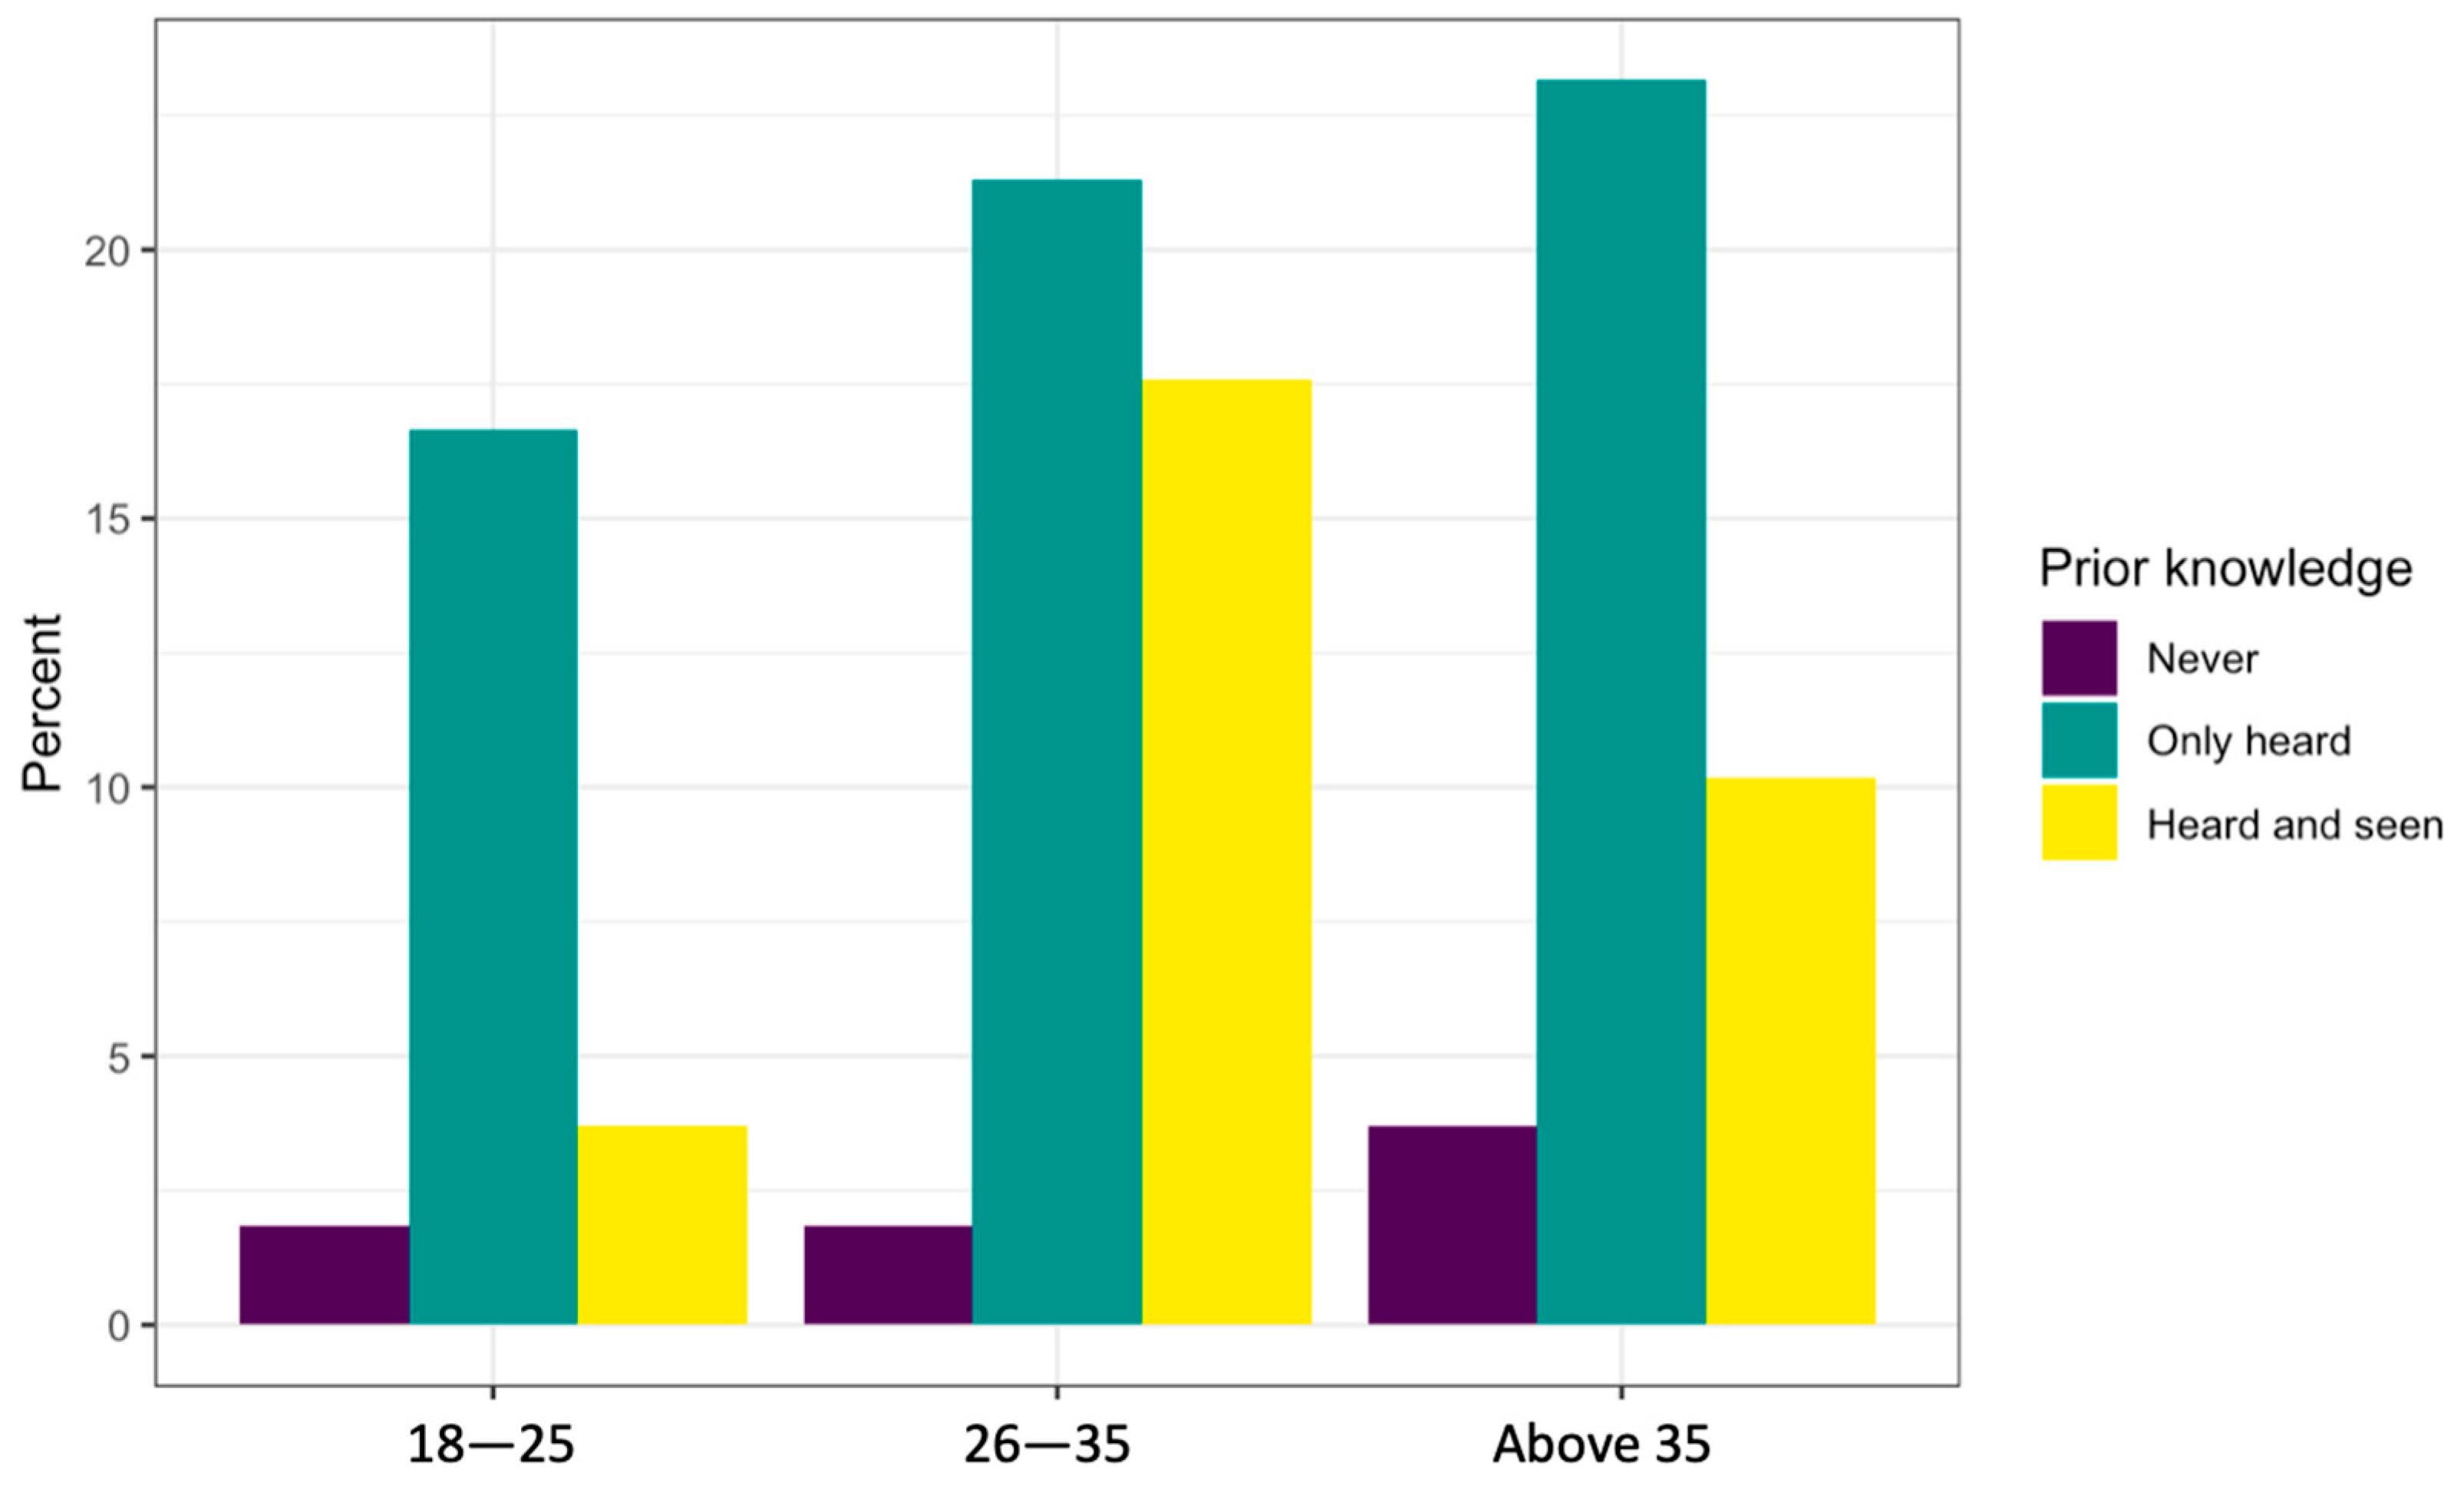
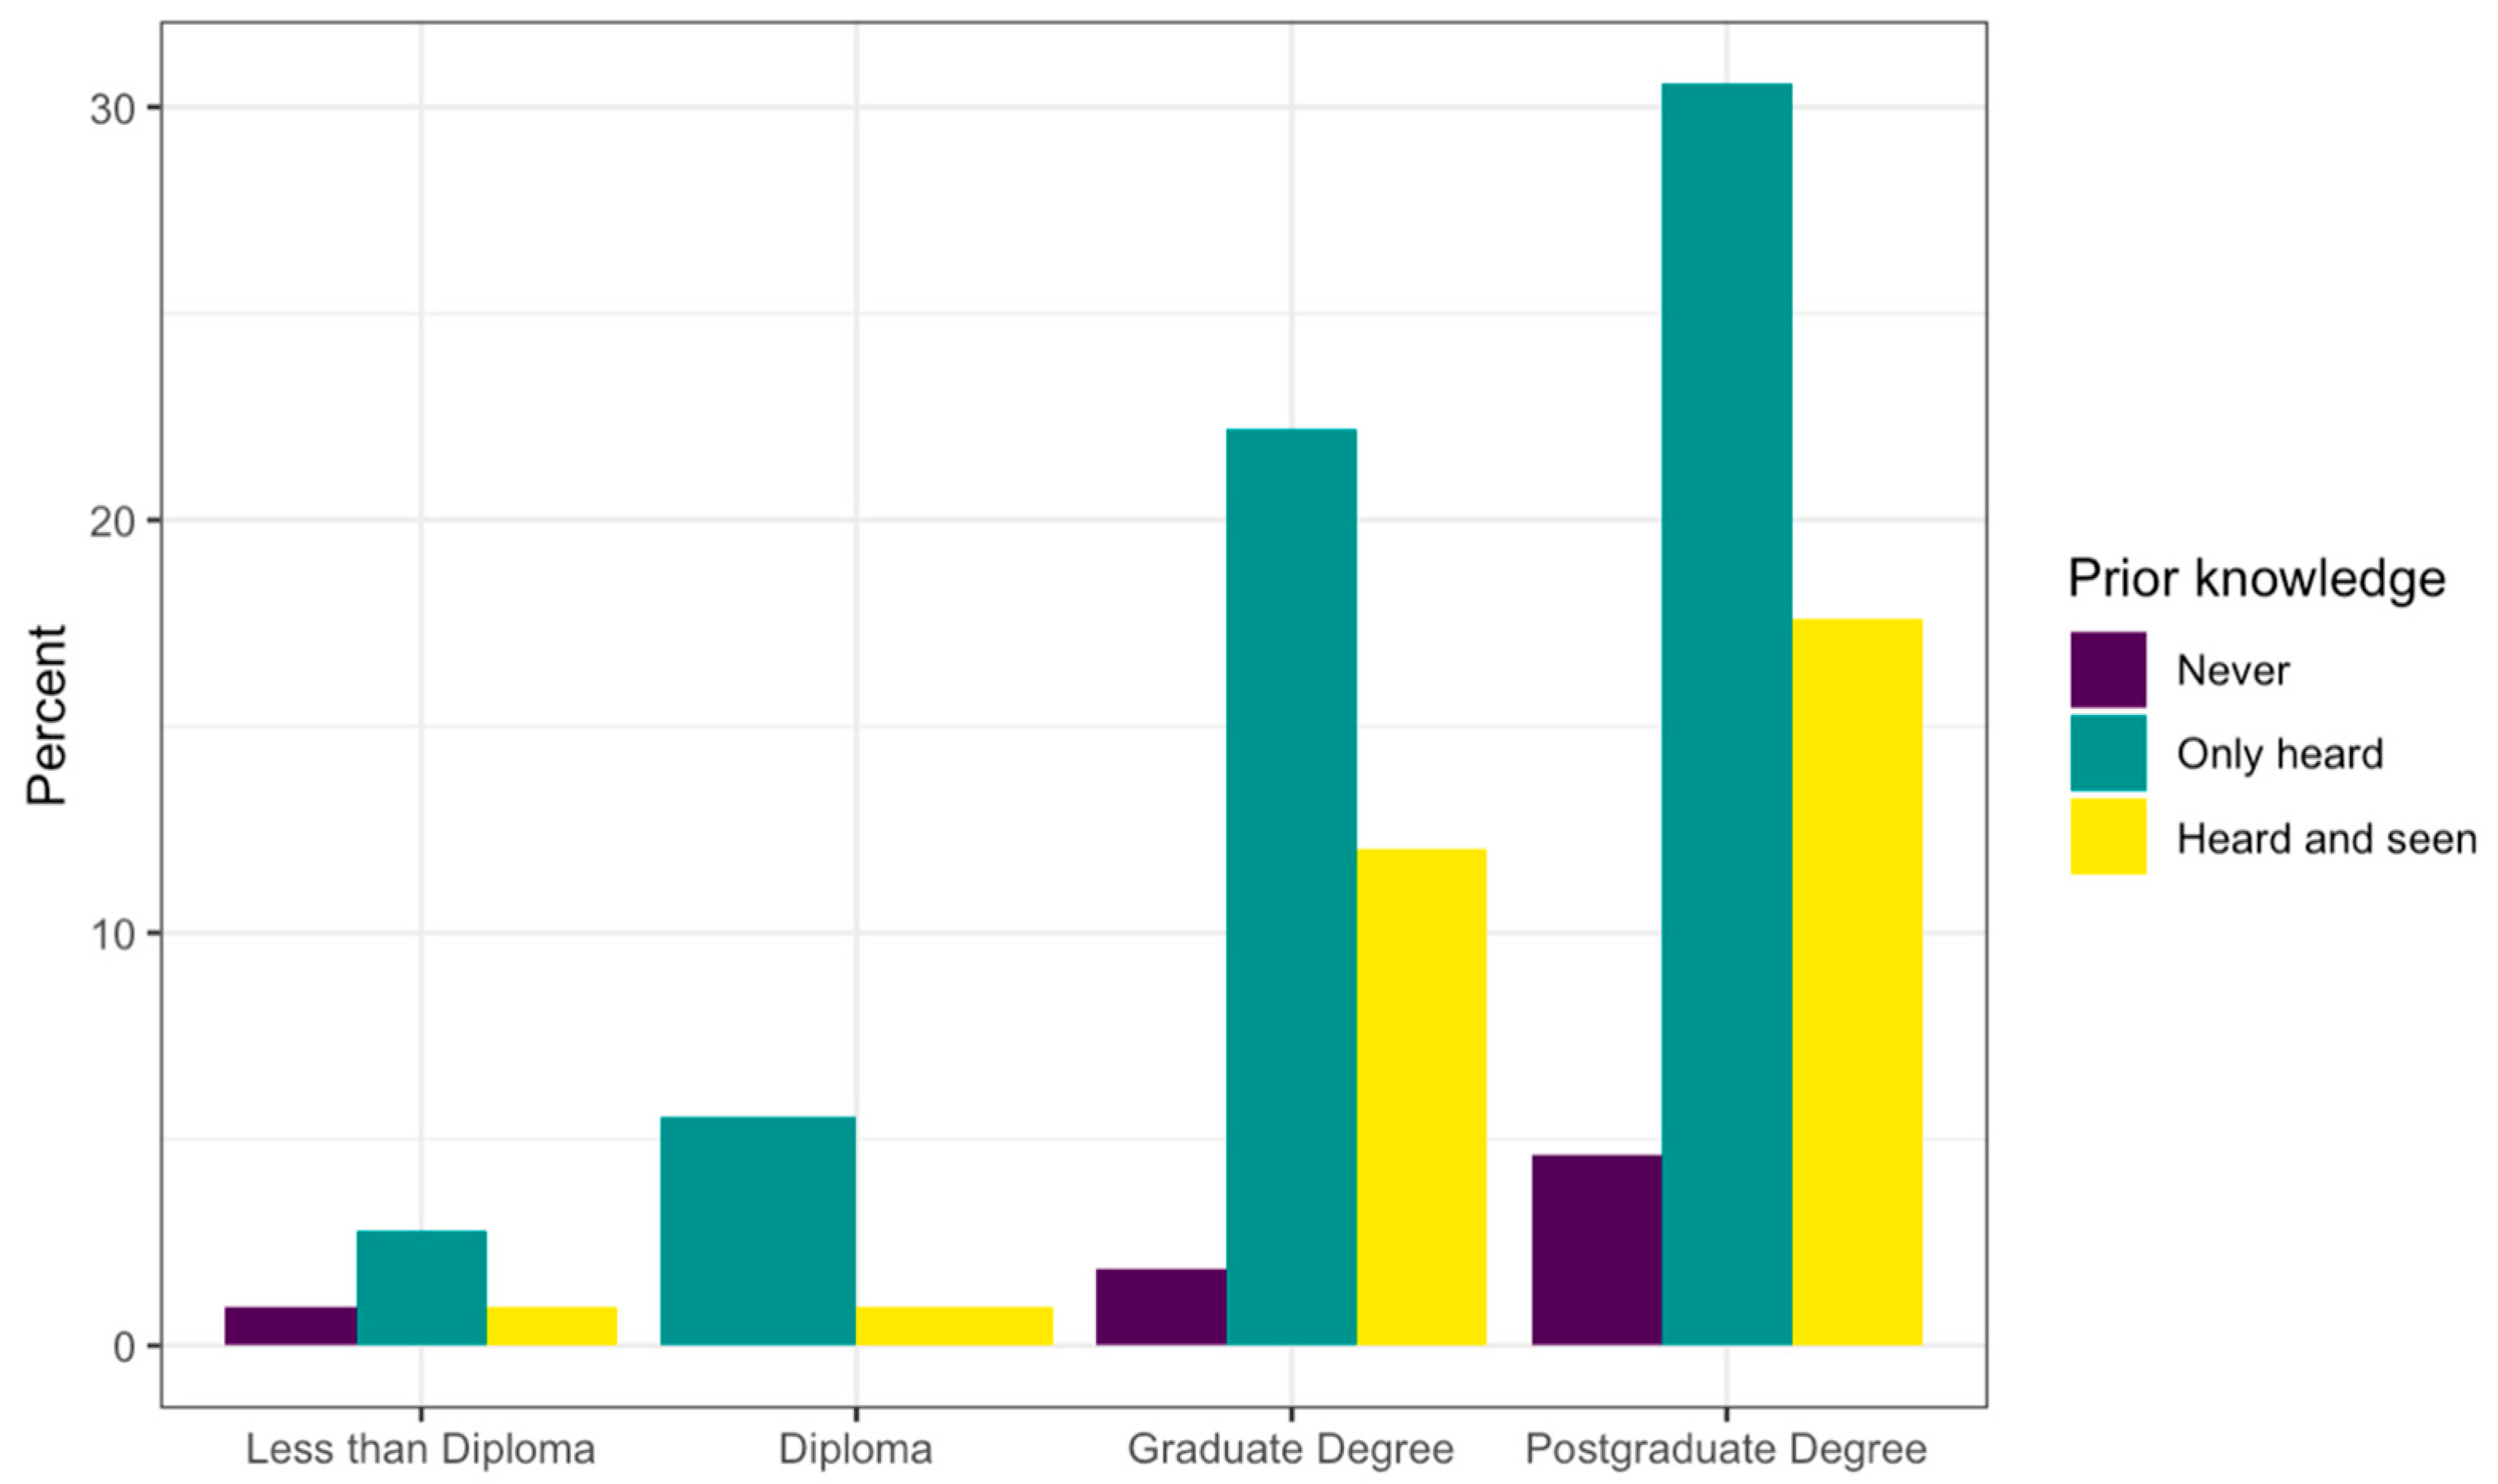
Figure 4 shows the age groups of the participants compared to their prior knowledge of the term “autonomous vehicle”. The above-35 age group had the largest proportion of respondents. However, for the younger age groups, there was a lower proportion of those who had never heard about AVs compared to those who have at least heard of them; those aged 18–25 years comprised approximately 20% of the respondents compared to around 39% respondents in the 26–35-year-old age group who had heard about and/or seen AVs. It is worth noting that the 26–35 age group had the highest subset of those who reported having seen AVs in real life. Additionally, the initial question of the participants’ prior knowledge of AVs can be also compared to their respective highest levels of education. As shown in
Figure 5, there is a clear correlation between the level of education and an awareness of AV technology.
Two further questions were asked to gauge the respondents’ interest regarding the preferred level of autonomy.
Table 3 presents the percentage of each AV level accepted by respondents along with the directional hypothesis that the average acceptance of AVs is higher than level 2 (partial automation). Based on
Table 3, the majority of respondents were more interested in having an automated driving system in their vehicles and less likely to buy a fully automated vehicle at level 5. Most frequently, respondents reported that they would buy a partially automated vehicle at level 4 (36.11%); this was followed by the preference for a partially automated vehicle at level 3 (24.07%). A one-tailed
t-test also showed that the acceptance of AVs is extremely significantly higher than level 2 in relation to the preferred level and the willingness to buy, with
p-values of
and
, respectively. The cumulative percentage of the preferred levels, from level 3 to level 5, derives an acceptance percentage of 70.37%. If we compare that with some of the other investigations, like “Why travelers trust and accept self-driving cars: an empirical study” [
35], then we can see that the acceptance level is 84.4%. The difference can be explained through the fact that participants in that survey were young Chinese college students; the results cannot be generalized. Our survey also shows that young and educated people are more inclined towards the transition because they are better informed. Finally, if we calculate a cumulative percentage of preferred levels, given in
Table 3, from level 2—partial automations with active safety features included—to level 5, we obtain a result of 82.41%; this is very similar to the results obtained by the other survey.
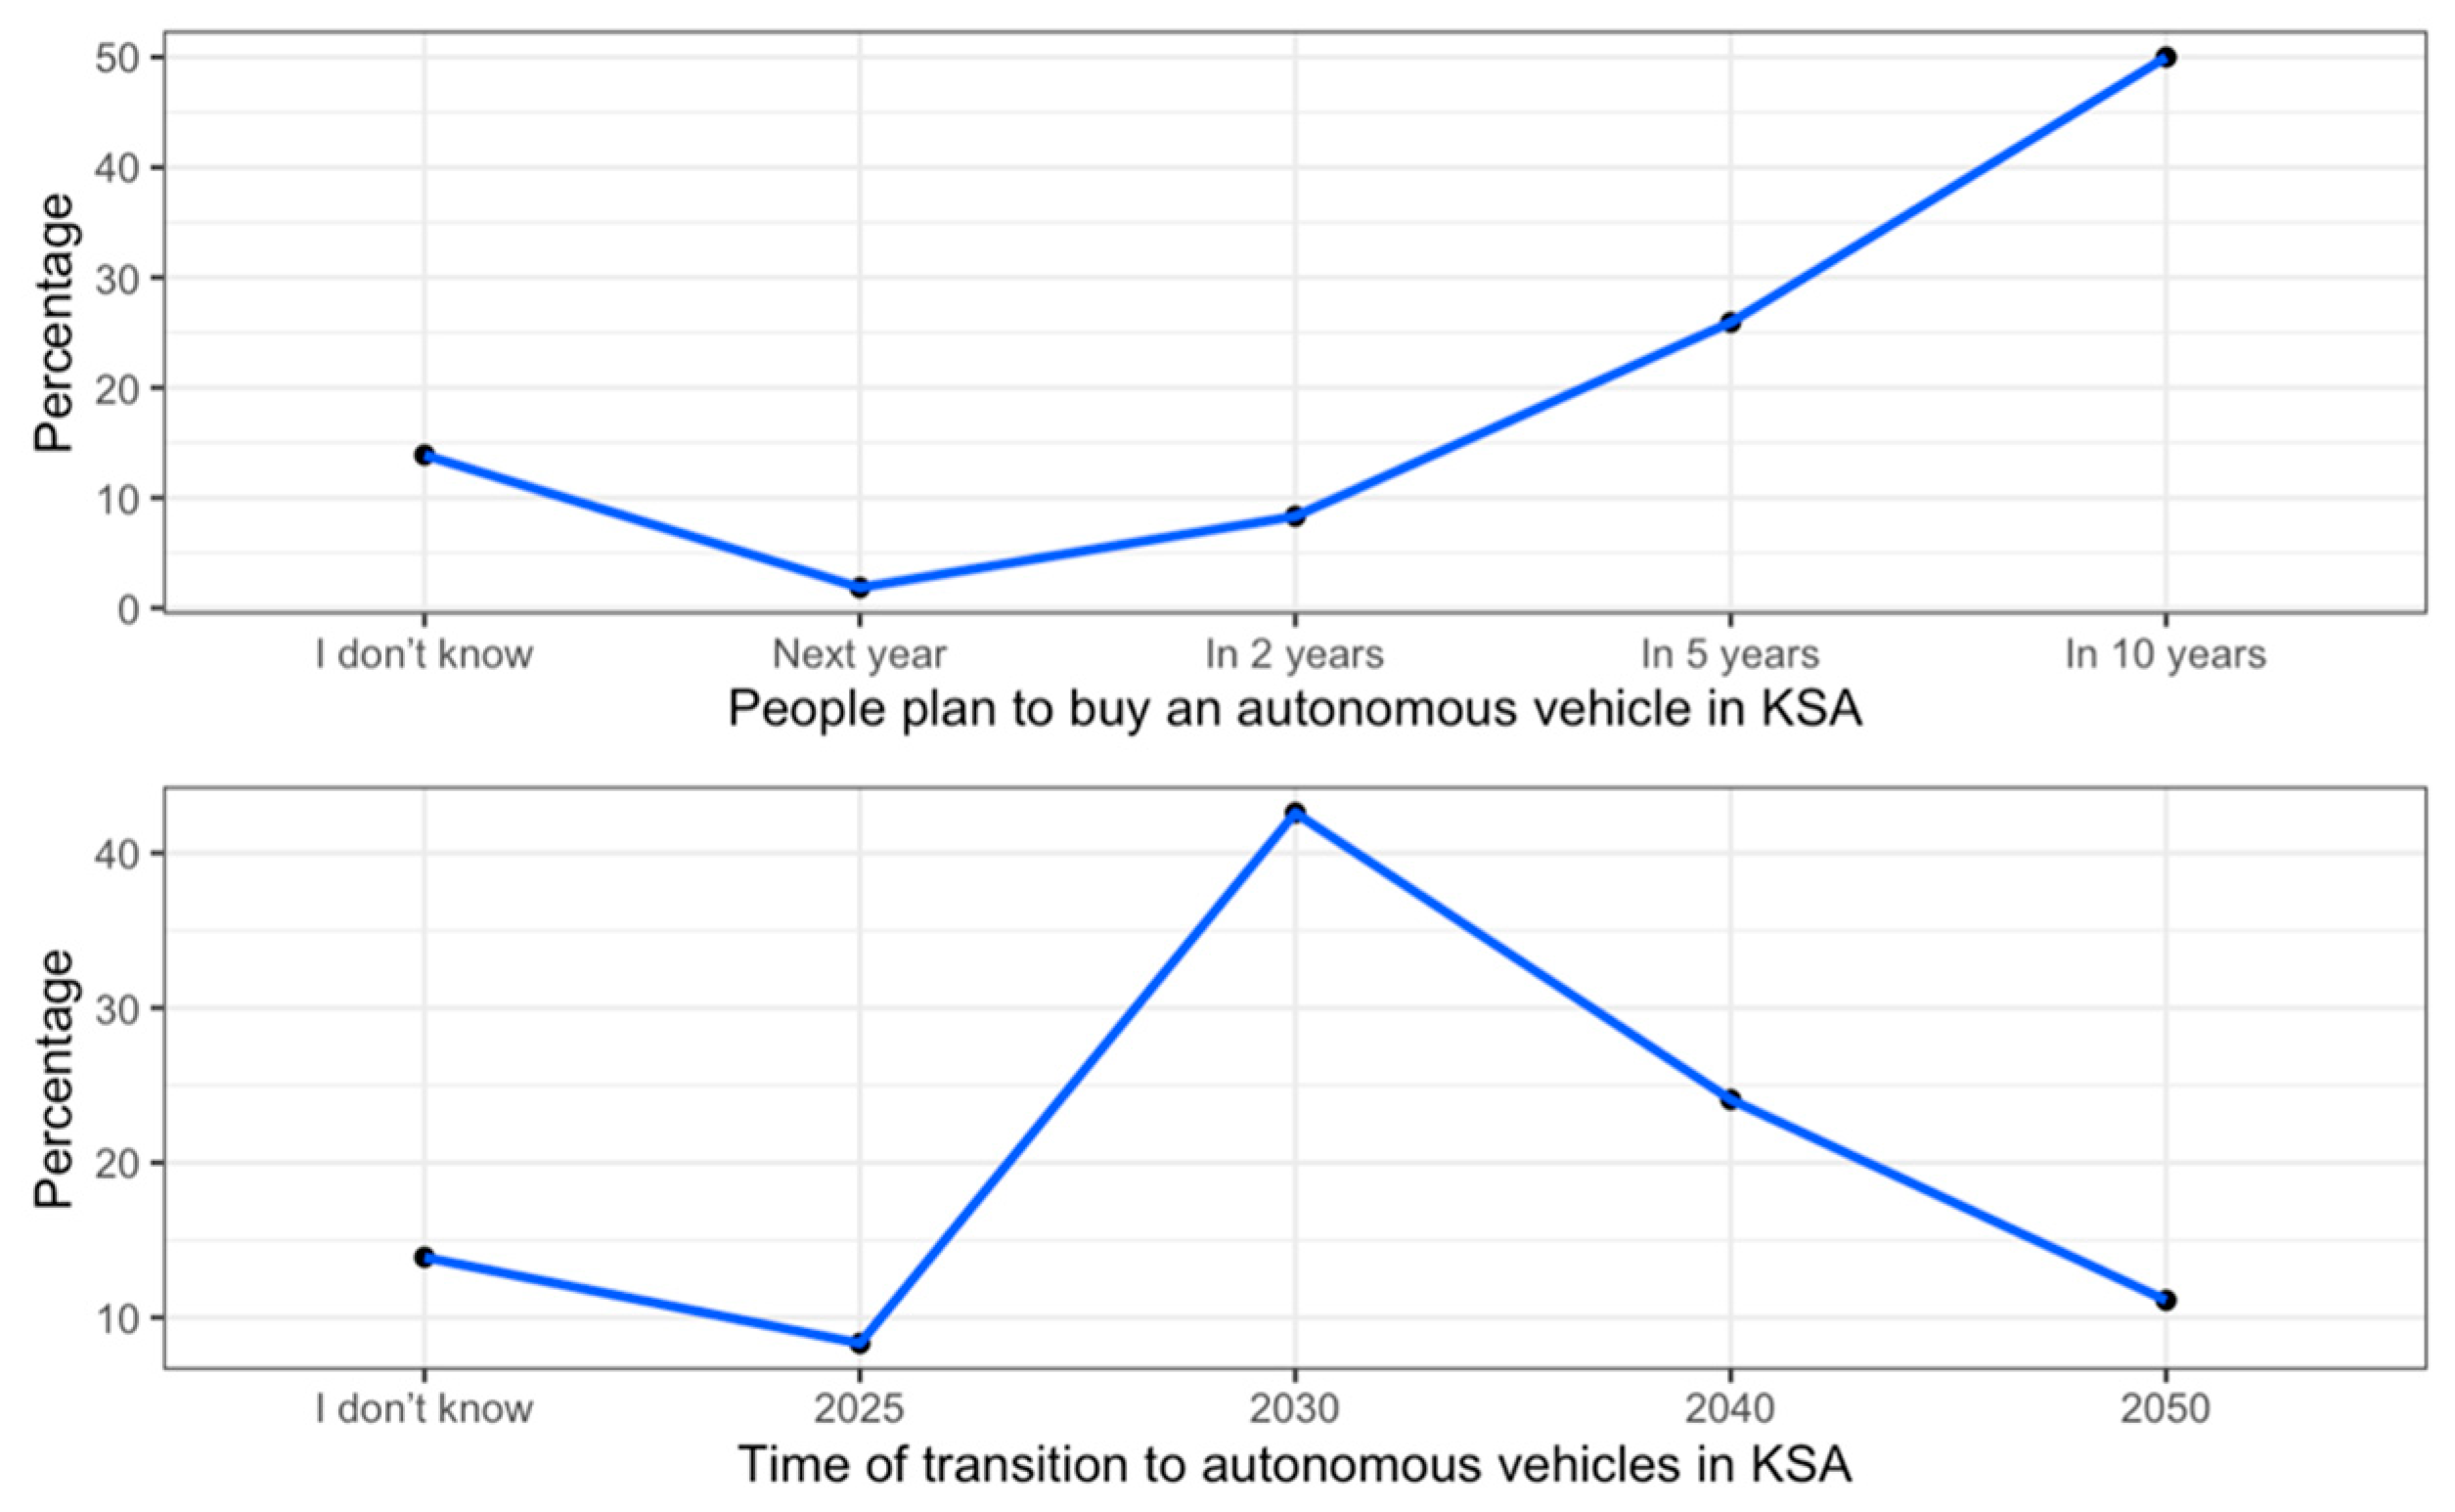
In line with previous questions, respondents were asked to report when they were planning to buy an AV and give their opinions on the timeline for the transition to AV technologies in KSA. Half of the respondents (50%) stated that they plan to buy an AV in 10 years, whereas more than 40% indicated a prediction that 2030 would be the transition year for AVs, as shown on
Figure 6. As expected, the year 2030 is aligned with the SA government’s long-term planning for the introduction of intelligent transport and smart cities.
Participants were asked questions about the benefits and risks they predict in the transition to increased use of AVs. Based on
Table 4, most had a positive attitude. When collapsed summaries (high responses versus low responses) were calculated, 51.86% of respondents answered that there would be significant benefits associated with the transition to increased use of AVs. A total of 48.15% answered that there would be minimal risks associated with the transition. There were very close percentages of respondents who answered this question by saying they predicted average benefits and risks would accompany the transition to increased use of AVs—34.26% and 39.81%, respectively.
Comparatively, previous research [
23,
24,
25,
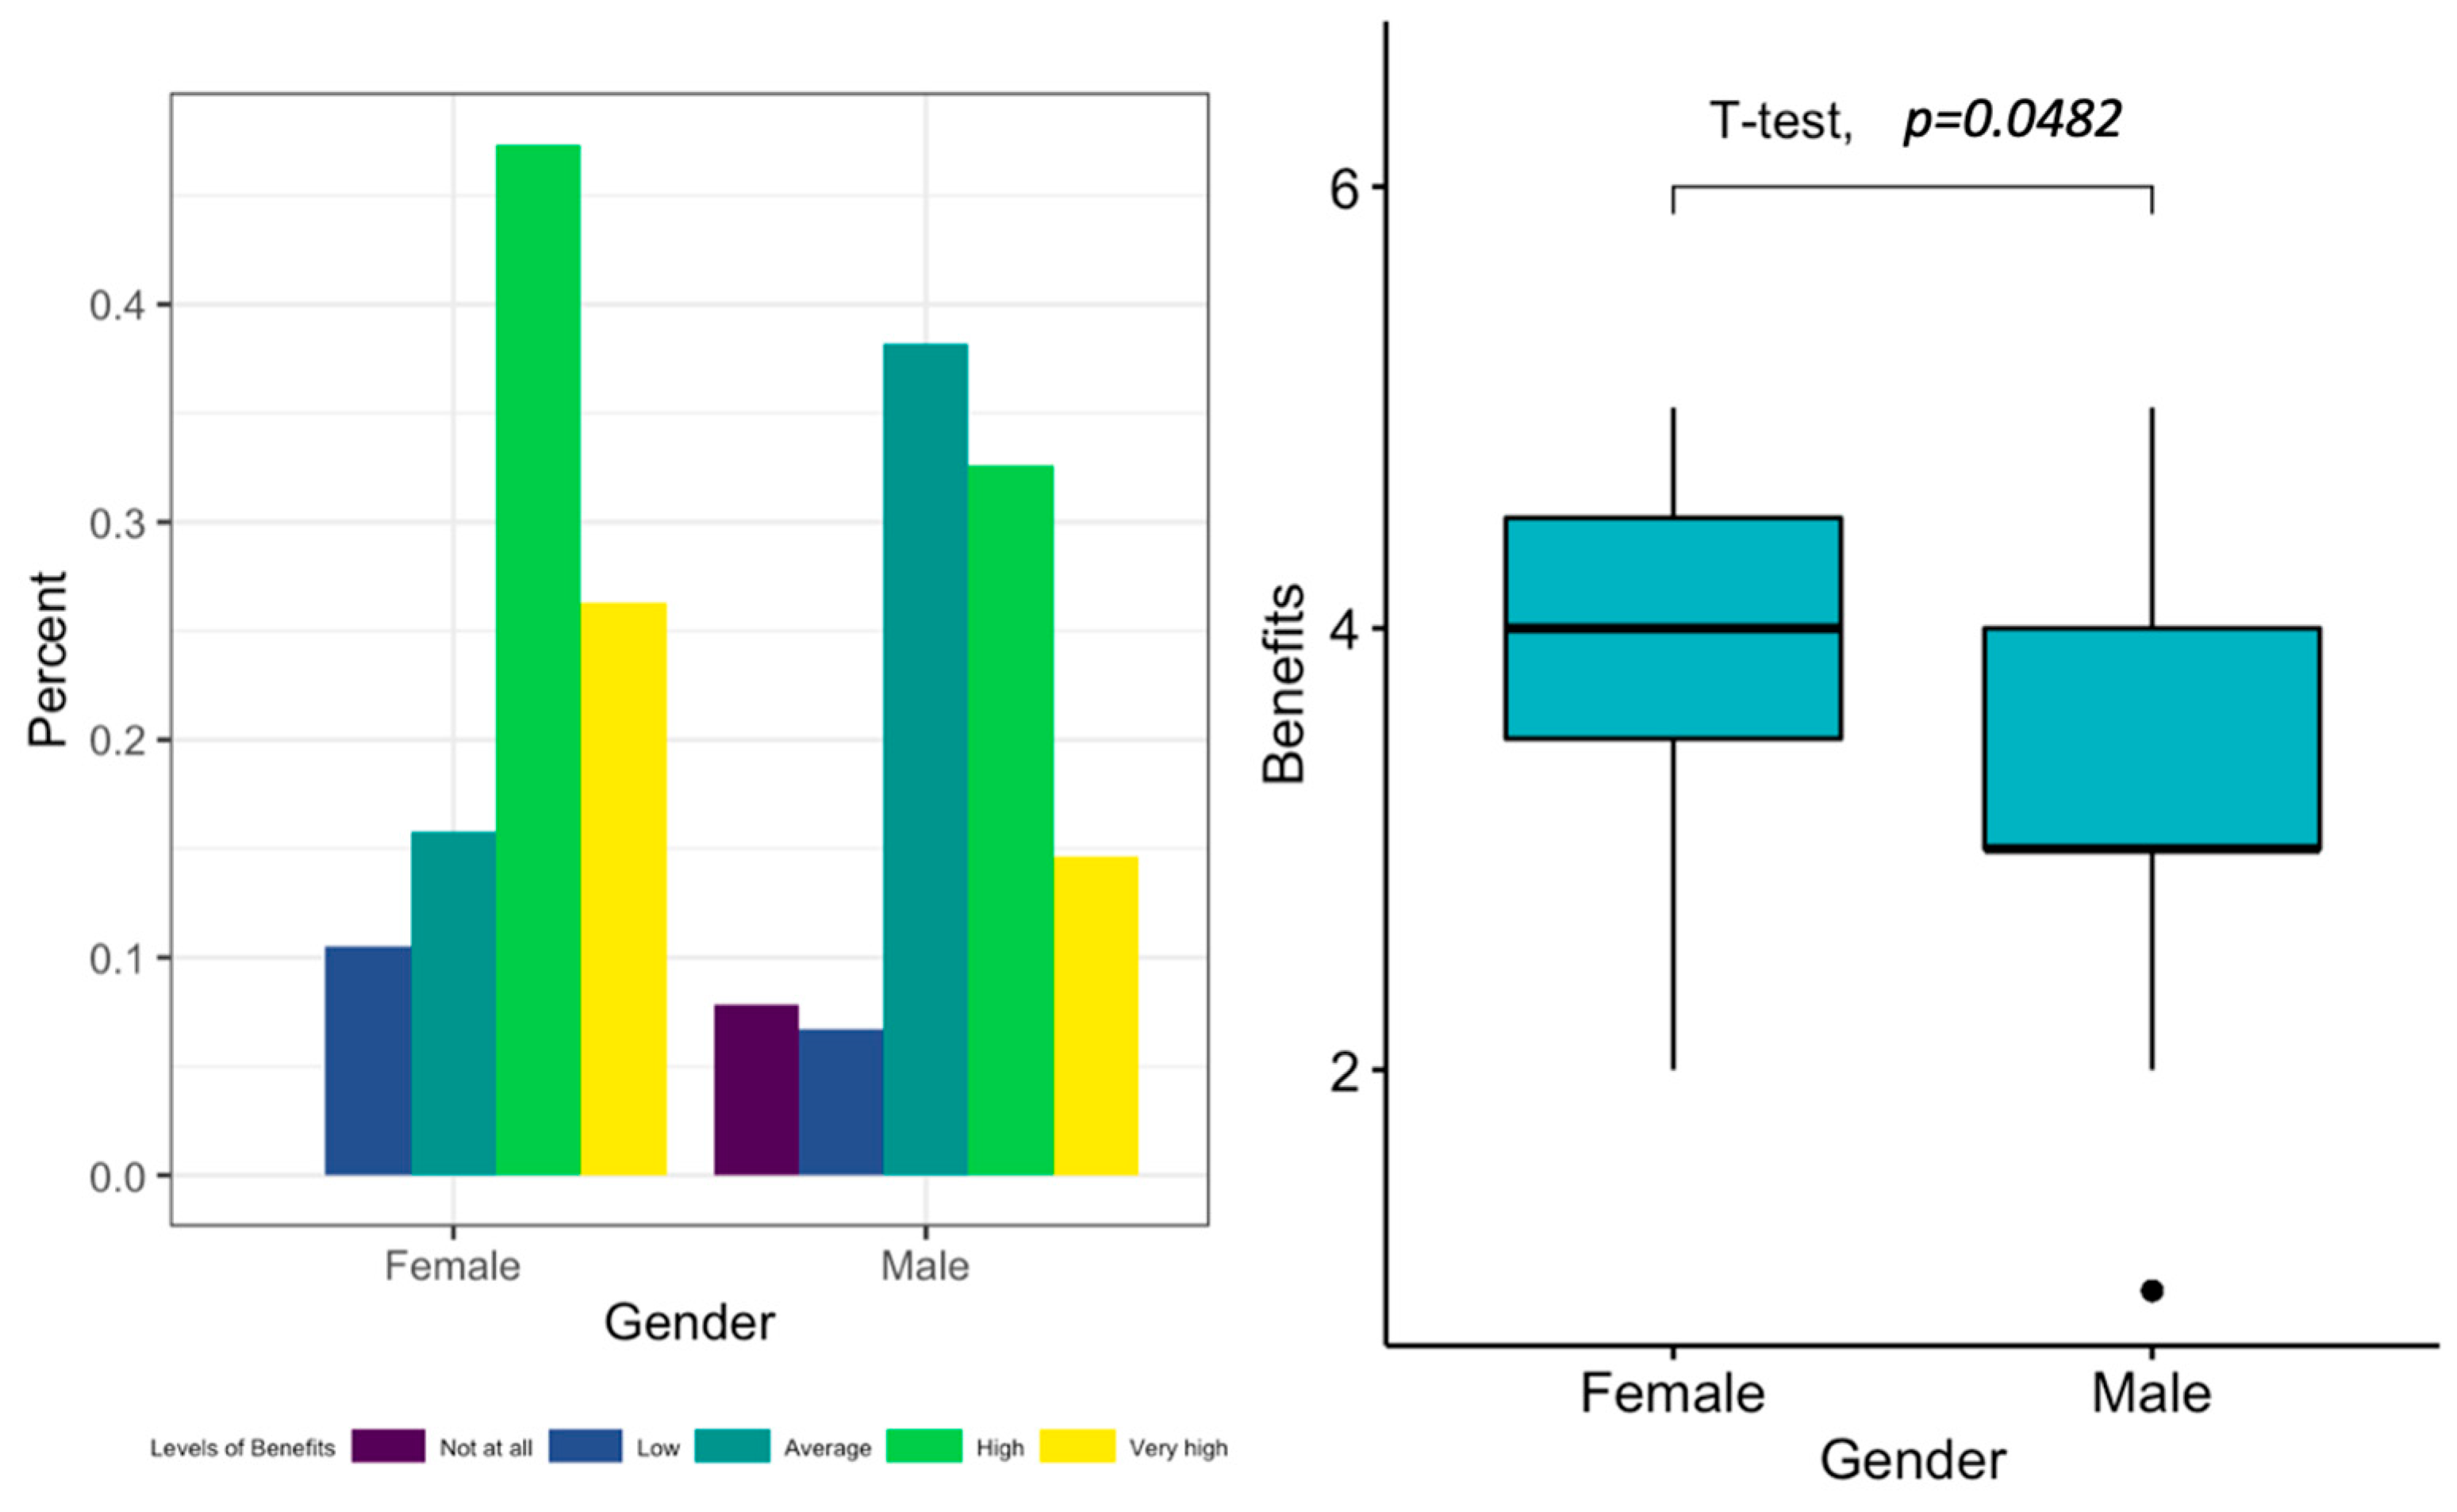
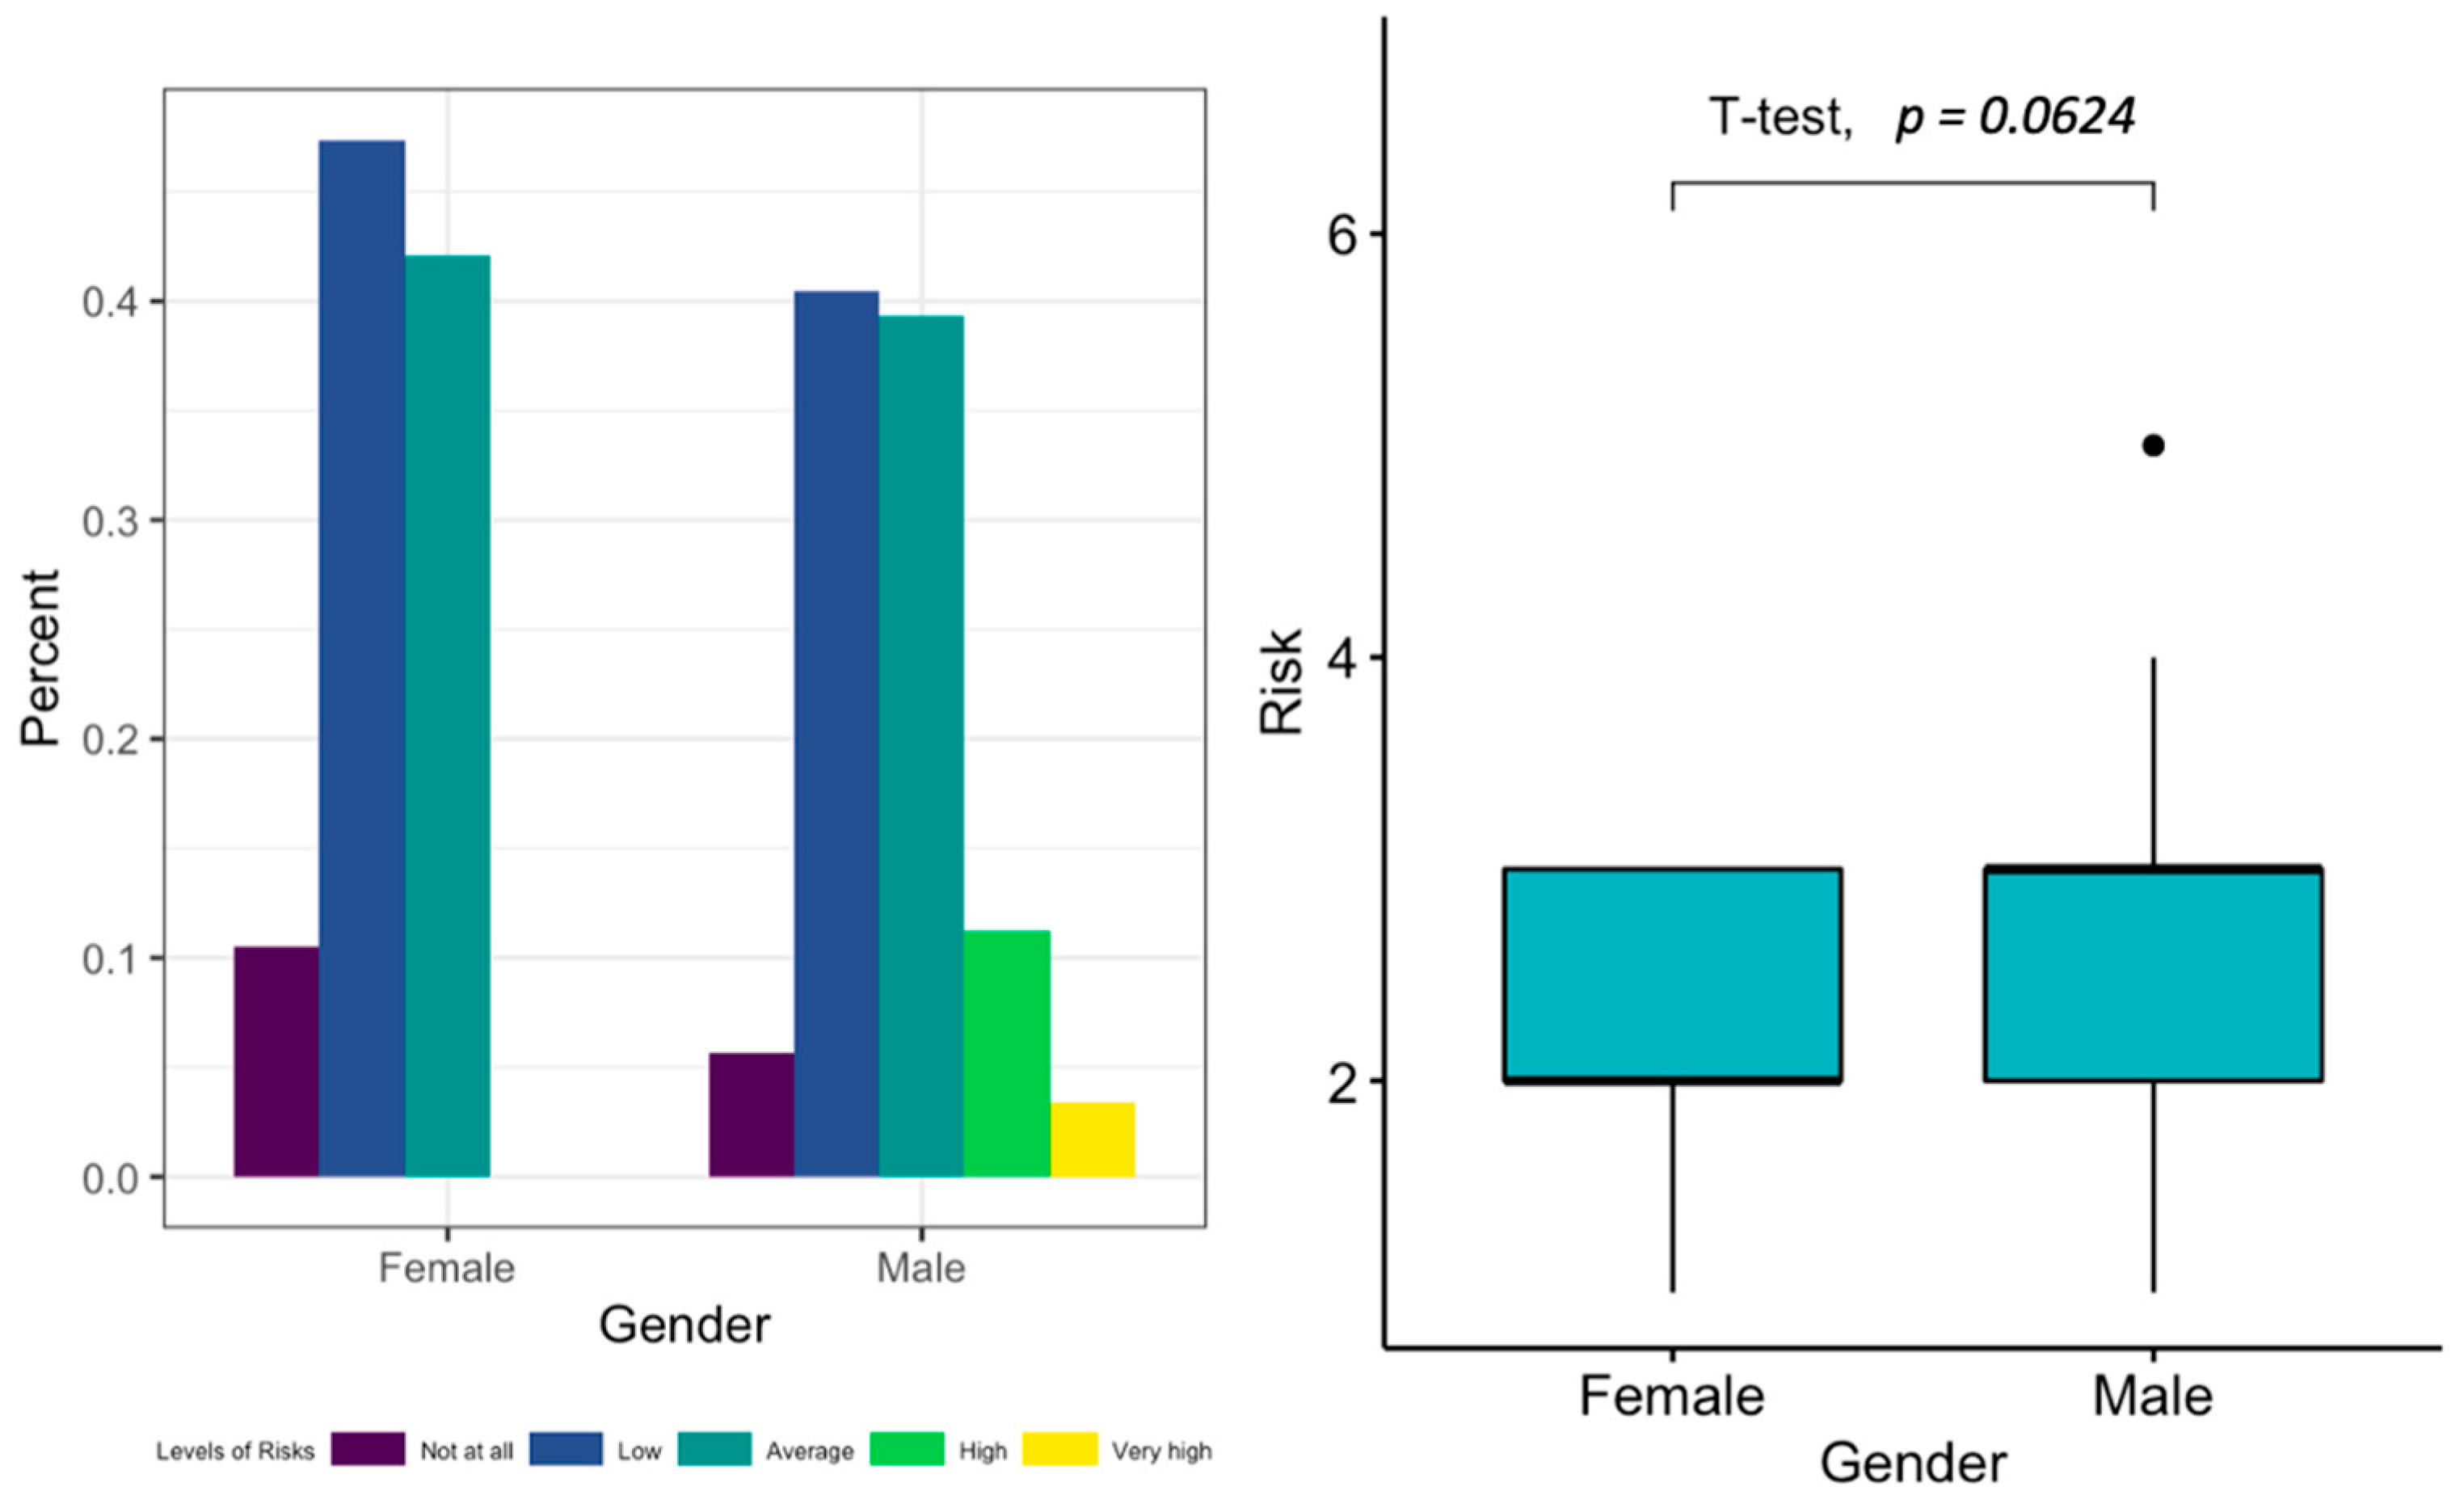
26] has found that gender might impact consumers’ perceptions. Thus, we include
Figure 7 and
Figure 8 to display gender comparisons: a bar chart and a box plot along, with an independent samples
t-test. In terms of general opinions, there was a clear trend observed among women and men who are more likely to have positive attitudes toward AVs. However, a between-groups
t-test showed that significantly more women would expect benefits from this transition than men (t = 2.0629,
p = 0.04817), whereas only slightly more women than men would expect fewer risks (t = −1.9295,
p = 0.06239); the difference was large enough to be statistically significant at a significance level of 10%.
Model Building in R
Ordinal logistic regression was performed with the perceived benefits of the transition toward increased use of AVs as the dependent variable, with six predictors (gender, age, education level, stakeholders’ groups, management role level, and prior knowledge). To fit the OLR model, transformation was necessary for some variables to prevent the possibility that the results of our research could be influenced by a small proportion of observations that appeared in some categories. For the gender variable, women were coded as 0 and men were coded as 1. The age variable was converted as follows: 0 = 35 or below 35, 1 = older than 35. The variable for the level of education was recoded: 0 = graduate degree or lower, 1 = postgraduate degree. The transport mode was excluded from the model to avoid misanalysis. For the stakeholder group variable, responses from the government group were coded as 0, responses from the industry group were coded as 1, and responses from the general public were coded as 2. Note that the traffic authority group was excluded, as no responses were recorded. The management role level variable ranged from 0 to 5, so the variable centred around scoring category 2 for better interpretability. That is, the 6 scoring categories (0, 1, 2, 3, 4, 5) were recoded to (−2, −1, 0, 1, 2), where the first 2 categories (i.e., level 0 and level 1) were merged.
Note that no changes are made to the variables except for rescaling. For the last predictor, “prior knowledge”, participants were asked to select one of the following options: “Never”, “Only heard”, and “Heard and seen”. The results showed that less than 10% of the respondents have never heard about AVs. Therefore, the first two categories (“Never” and “Only heard”) were merged and coded as 0, whereas the last category (“Heard and seen”) was kept and coded as 1.
Finally, the dependent variable “benefit” was represented with a 5-point Likert scale with the following options: “No benefits at all”, “Associated benefits of low level”, “Associated benefits of average level”, “Associated benefits of high level” and “Associated benefits of very high level”. Since there are relatively small proportions of observations at smaller values, i.e., “No benefits at all”, “Associated benefits of low level”, the observations from this variable were analysed based on three categories: first two categories (“No benefits at all”, “Associated benefits of low level”) were merged and named as “Low benefits”, third category was kept and renamed as “Average benefits”, and last two categories were merged and named as “High benefits” (see
Table 5).
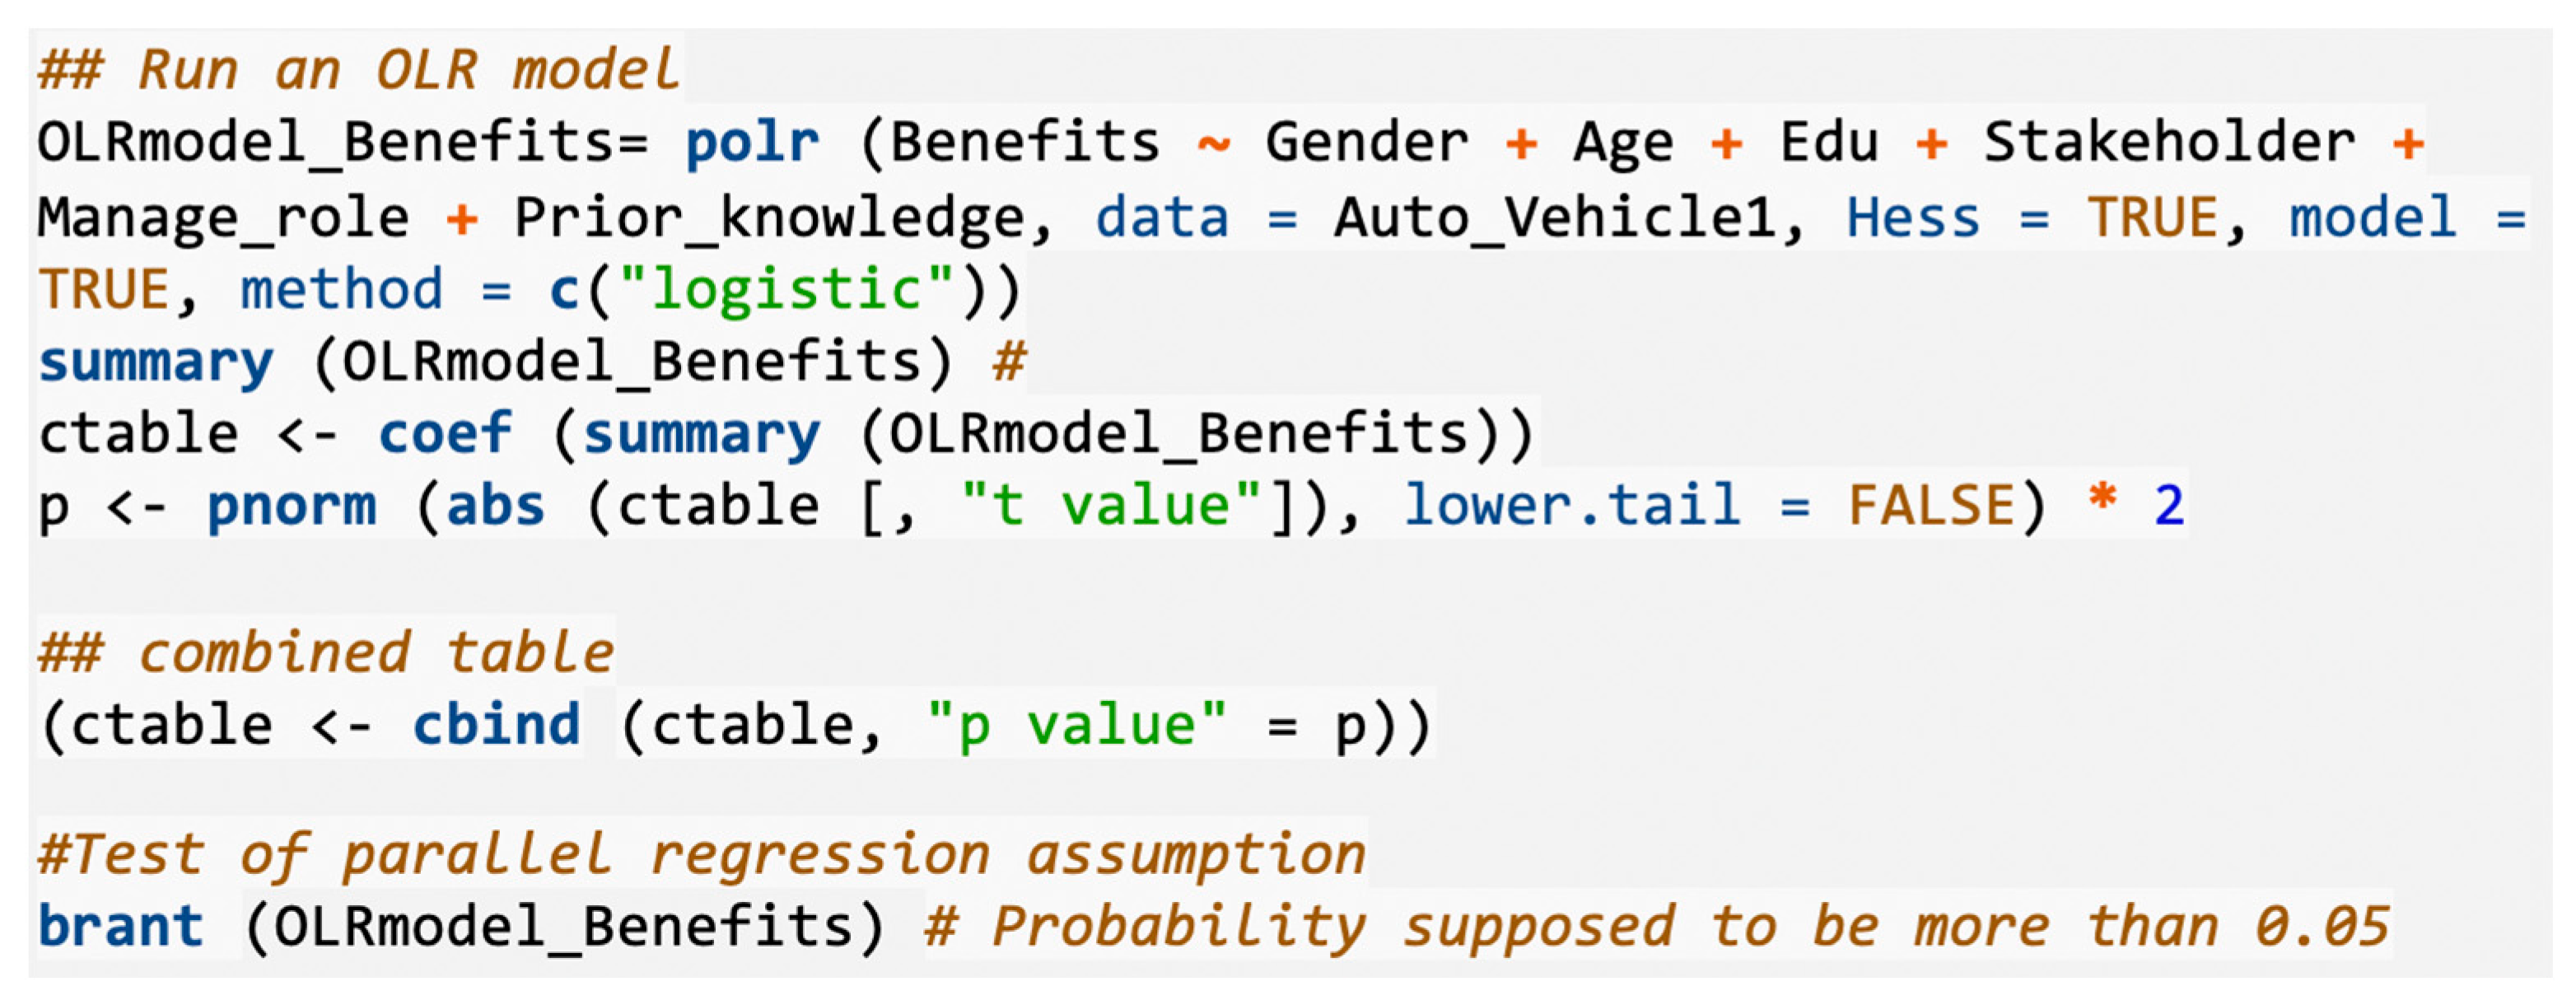
The R package MASS was used to run the function polr() to estimate an ordered logistic regression model. The command name comes from proportional odds logistic regression, highlighting the proportional odds assumption in our model. We also specify that Hess = TRUE; this ensures that the model returns the observed information matrix from the optimization (called the Hessian), which is used to obtain standard errors. The coefficients from this model can be somewhat difficult to interpret because they are scaled in terms of logs. Another way to interpret logistic regression models is to convert the coefficients into odds ratios; we interpret these as we interpret odds ratios from binary logistic regression. Similarly, the coefficients will be translated into odds ratios that are either lower or higher than one (viz., (0, 1)). That, in turn—when odds ratios are lower or higher than one—means that the predicted probability is decreasing or increasing as the covariate decreases or increases, respectively. To obtain the OR and confidence intervals, we simply exponentiate the estimates and confidence intervals. A piece of code from R is shown in
Figure 9.
5. Conclusions
This paper presents the results of an investigation into the community’s views on the transition to use of AVs in Saudi Arabia. The research was conducted at a time when AVs with a higher level of automation were relatively new to the KSA public and the market. A self-administered questionnaire was used to collect data on participants’ awareness and knowledge of AVs, their attitudes towards AVs, and their readiness to use autonomous cars. The results of the descriptive analyses show that there is a difference between women and men in the expected benefits they reported for the transition to use of AVs. However, both groups reported that they predicted that there would be no high risk in the introduction of AVs on the roads of KSA. We can see that autonomous vehicles with higher levels of autonomy are well accepted in Saudi Arabia. Our investigation shows that people are willing to pay for automation, but only a small proportion reported that they would pay for fully automated vehicles at level 5. The timeline for the transition toward use of AVs is predicted to be 10 years in the survey responses. This is well aligned with the KSA government’s strategy and planning for this important transition in the transport sector. At the same time, ITSs and smart cities are on the same timeline; these are directly correlated and interdependent.
The present findings confirmed the previously published outcomes in the literature, showing that Saudi women seem to favour AVs more than conventional vehicles. Results also showed that participants who had prior knowledge of AVs tended to have an attitude that was three times more positive towards the transition in comparison with people who had only heard or had never heard about AVs. This is the same finding that researchers have presented from conducting surveys in the EU, China, and other regions worldwide. There are concerns reported both in our study and globally present surrounding trust in the new technologies. It appears that, in addition to knowledge about a given new technology, trust in it is also built on existing relationship and trust with the manufacturers. This is common among drivers worldwide, but also among non-motorists and other road users. Further progress in AV technology and its introduction depends on the developments of more sophisticated AI algorithms. This constant improvement in AI is directly transferable and will influence AVs, intelligent transport systems, and smart cities.
The introduction of new technology will influence many sectors of human activities and businesses. Similar to any new industry revolution, workforce structure and requirements will change. In our survey, more than 50% of our participants expressed concern surrounding employment issues.
In conclusion, through increased safety, efficiency, and sustainability—in terms of lowering pollution—autonomous vehicles have the potential to revolutionise transport. AVs are a key modality among new mobility solutions and comprise a key subsystem in future ITSs. There are issues that need to be considered in terms of moral and ethical dilemmas with fully automated vehicles, as well as a regulatory framework for AVs. Progress is moving towards the development of comprehensive and reliable solutions for autonomous vehicles through utilising cutting-edge technologies, including big data analytics, IoT, ITS, AI, and cloud and edge computing. The whole ITS system, in the near future, will be supported by a more dependable and comfortable networking infrastructure thanks to the full application of ICT and VANET in handling the global transition to autonomous vehicles.
The limitation in our survey on the acceptance of new technologies in the automotive industry as presented here is that we have investigated only the transition to increased use of AVs and not the acceptance process surrounding electric vehicles. The AVs of the future will likely be electric vehicles, running on green electricity. Countries and regions around the world, like the EU, are introducing bans on the sale of new ICE vehicles, with relatively short timelines, like 2035. This indicates that we will see a smooth integration of AVs and EVs in the coming decade. Our investigation shows that the KSA community is ready for the AV transition by 2030, which is fully aligned with the government-planned Saudi Vision, 2030.
We plan to continue with our longitudinal surveys in the following years, both in KSA and globally. In addition to our qualitative and quantitative data collection, we will start with interviews and discussions with travel authorities and government representatives. Currently, two transitions are occurring—one to increased use of electrical vehicles and the other to increased use of autonomous vehicles; these transitions are occurring because ICEs are being phased out in many countries worldwide. This is a global process that requires a global management approach. Although it is global, public acceptance and timelines will be different. Trust in new technologies is based on trust in artificial intelligence and in the manufacturers that offer it. Governments play a key role in both of these transitions, and some have already made strategic, long-term decisions to invest and stimulate development. Saudi Arabia is one of them.


