Article

Research on Temperature Inconsistency of Large-Format Lithium-Ion Batteries Based on the Electrothermal Model

1
School of Automotive Studies, Tongji University, Shanghai 201804, China
2
Clean Energy Automotive Engineering Center, Tongji University, Shanghai 201804, China
*
Author to whom correspondence should be addressed.
World Electr. Veh. J. 2023, 14(10), 271; https://doi.org/10.3390/wevj14100271
Submission received: 25 July 2023 / Revised: 15 September 2023 / Accepted: 19 September 2023 / Published: 1 October 2023

Abstract

:
Large-format lithium-ion (Li-ion) batteries are increasingly applied in energy storage systems for electric vehicles, owing to their flexible shape design, lighter weight, higher specific energy, and compact layouts. Nevertheless, the large thermal gradient of Li-ion batteries leads to performance degradation and irreversible safety issues. The difference in the highest temperature position at various operational modes makes accurate temperature monitoring complicated. Accordingly, a full understanding of the temperature inconsistency of large-format Li-ion batteries is crucial. In this study, these inconsistent characteristics are analyzed by establishing an electrothermal model and conducting experiments based on an 8-Ah pouch-type ternary Li-ion battery with contraposition tabs. Regarding the characteristic of inhomogeneous temperature distribution, the analysis results demonstrate that it is primarily attributable to the uneven heat generation within the battery system and the effects of the two tabs. For the evolution of the highest temperature position, this study compares the maximum temperature rise of the positive tab and main battery body. The results illustrate that the operating temperature has a greater impact on the maximum temperature rise of the main battery body since its resistance strongly depends on the operating temperature compared to the positive and negative tabs. In addition, the electrothermal model is expected to be employed for the battery thermal management system (BTMS) to mitigate the battery temperature inconsistency.

1. Introduction

Severe energy crises and environmental pollution immensely promote the development and adoption of electrical vehicles (EVs) [1,2,3]. As the main energy storage system for EVs, Li-ion batteries are extensively applied due to their outstanding overall performance, such as no memory effect, high specific energy and power density, long cycling and calendar lifetime, and so forth [4,5,6]. Li-ion batteries generally generate a large amount of heat under typical cycling conditions, but the significant difference between the heat dissipation coefficient and thermal conductivity results in the uneven temperature distribution of the battery [7,8]. The large temperature gradient inside the battery has a significant impact on its performance and safety [9,10,11]. Carter et al. [11] demonstrated that the interelectrode temperature gradients lead to battery capacity degradation, and their directionality determines the distinct degradation modes of the battery. Wang et al. [12] discovered that the inhomogeneous temperature distribution inside the battery would be likely to induce local Li-plating even at room temperature. In addition, the battery thermal gradients also lead to nonuniform current density distribution and in-plane state-of-charge (SOC) differences, thereby exacerbating uneven aging inside the battery and increasing the hazard of battery thermal runaway [13,14]. Furthermore, the differences in temperature distribution of Li-ion batteries under various operating conditions put forward higher requirements for monitoring the battery temperature in real time [15]. This study collectively refers to the aforementioned two thermal behaviors as inconsistent temperature characteristics of the battery. With consumers in constant demand for batteries with large format and enhanced performance, the temperature inconsistency of Li-ion batteries would be likely to be enlarged. Therefore, a full understanding of the temperature inconsistency is conducive to the development of the BTMS as well as preventing battery performance degradation and potential hazards.
In theory, the temperature evolution of Li-ion batteries arises from heat generation and transfer during their operations. Heat generation is composed of reversible heat and irreversible heat. Specifically, reversible heat is primarily attributable to the entropy change during electrochemical reactions, and irreversible heat is mainly ascribed to the polarization and Ohmic resistances associated with the migration of ions and electrons [16]. To date, numerous calculation equations that describe battery heat generation have been formulated in terms of the electrochemical reaction mechanism of Li-ion batteries. Among them, the typical heat generation formula derived by Bernardi has been extensively employed in considerable studies [17]. Moreover, several simplified forms of calculating irreversible heat have also been proposed in the existing literature on the basis of Bernardi’s, which can be roughly categorized into two versions, namely the overpotential-based [18,19] and equivalent resistance-based [20,21] methods. As for reversible heat, it can be easily calculated based on the known entropic heat coefficient [15]. In addition, this term is generally neglected in some research due to its microscopic proportion to total heat generation [22].
In the case of heat transfer within the battery systems, this includes heat conduction, convection, and radiation. In particular, battery heat radiation is almost negligible, or it can be treated in conjunction with heat convection [23,24]. In recent decades, substantial analysis techniques have been proposed to simulate heat transfer processes, which can be divided into three groups, i.e., equivalent thermal resistance methods, order reduction methods, and numerical techniques. The equivalent thermal resistance methods model the heat conduction inside the battery as well as the heat convection and radiation at the boundary by utilizing various thermal resistances. For instance, Lin et al. [25] applied two thermal resistances to represent the heat transfer of cylindrical Li-ion batteries, and then Dai et al. [26] also employed this method for prismatic hard-cased Li-ion batteries. The order reduction methods convert the complicated nonstationary partial differential heat-conduction equation into a set of linear ordinary differential equations, such as polynomial approximation [22,27], integral method approximation [28], Galerkin approximation [29], and quadratic assumption [30]. Numerical techniques accurately simulate the heat transfer processes by solving energy conservation equations, including the finite element method (FEM) [31], the finite volume method (FVM) [13], and the finite difference method (FDM) [18].
Due to the reduced performance and safety of Li-ion batteries under high temperatures and large thermal gradients, effective heat dissipation techniques are crucial. Fundamentally, battery heat dissipation comprises two stages: the first is that the heat inside the battery is conducted to the surface, and then the heat is removed from the surface by contact with adjacent low-temperature media or materials [32]. Over time, a variety of heat-dissipation methods have been proposed in academic and industrial fields, which can be summarized into three types: active, passive, and hybrid. Active heat-dissipation techniques need to provide extra energy for actuators to dissipate heat [33]. Specifically, this technique includes liquid, forced air, thermoelectric effects, and so forth. In contrast, passive heat-dissipation techniques, which mainly include natural convection, phase-change material (PCM)-based actuators, and heat pipes, do not need any additional actuators. As for hybrid heat-dissipation techniques, they are generally composed of one of the active or passive techniques and PCM [34].
The remainder of this article is constructed as follows: Section 2 details the battery-testing procedure and the process of data analysis. The electrothermal model for large-format Li-ion batteries is established in Section 3. In Section 4, the electrothermal model is parameterized and the temperature inconsistency of large-format Li-ion batteries is fully analyzed. Finally, conclusions are drawn in Section 5.

2. Experiments and Thermal Behavior Analysis

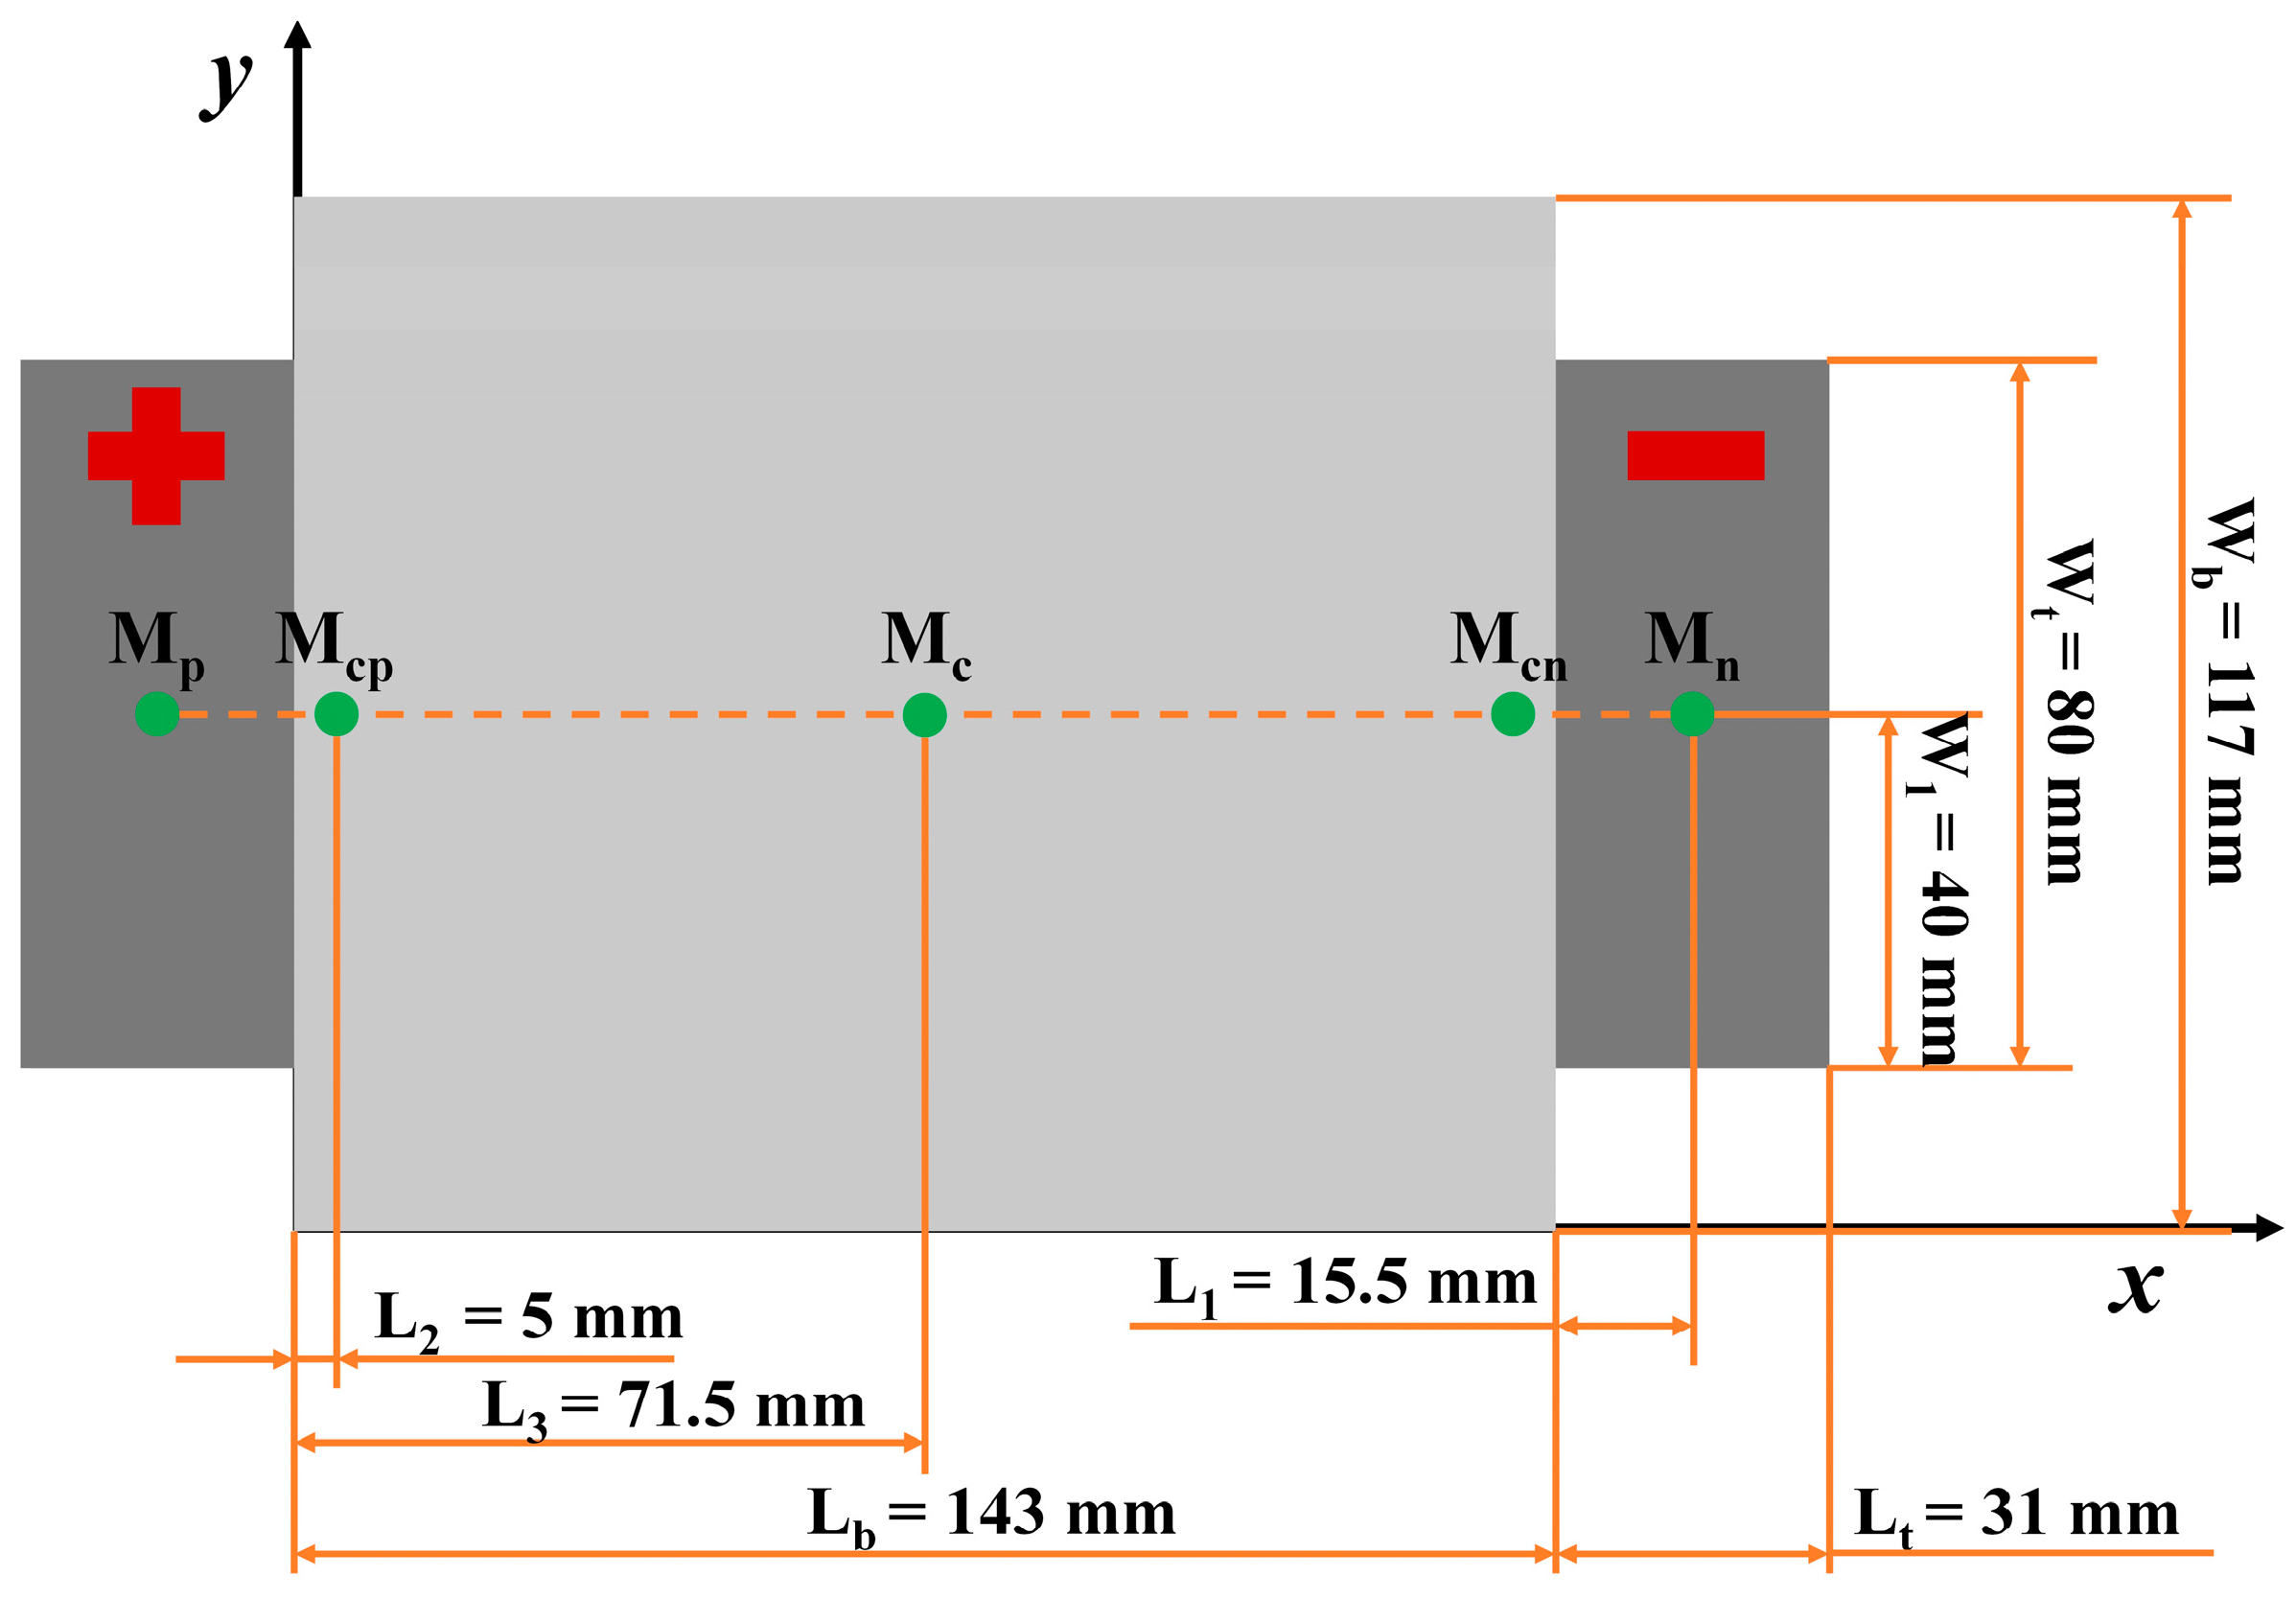
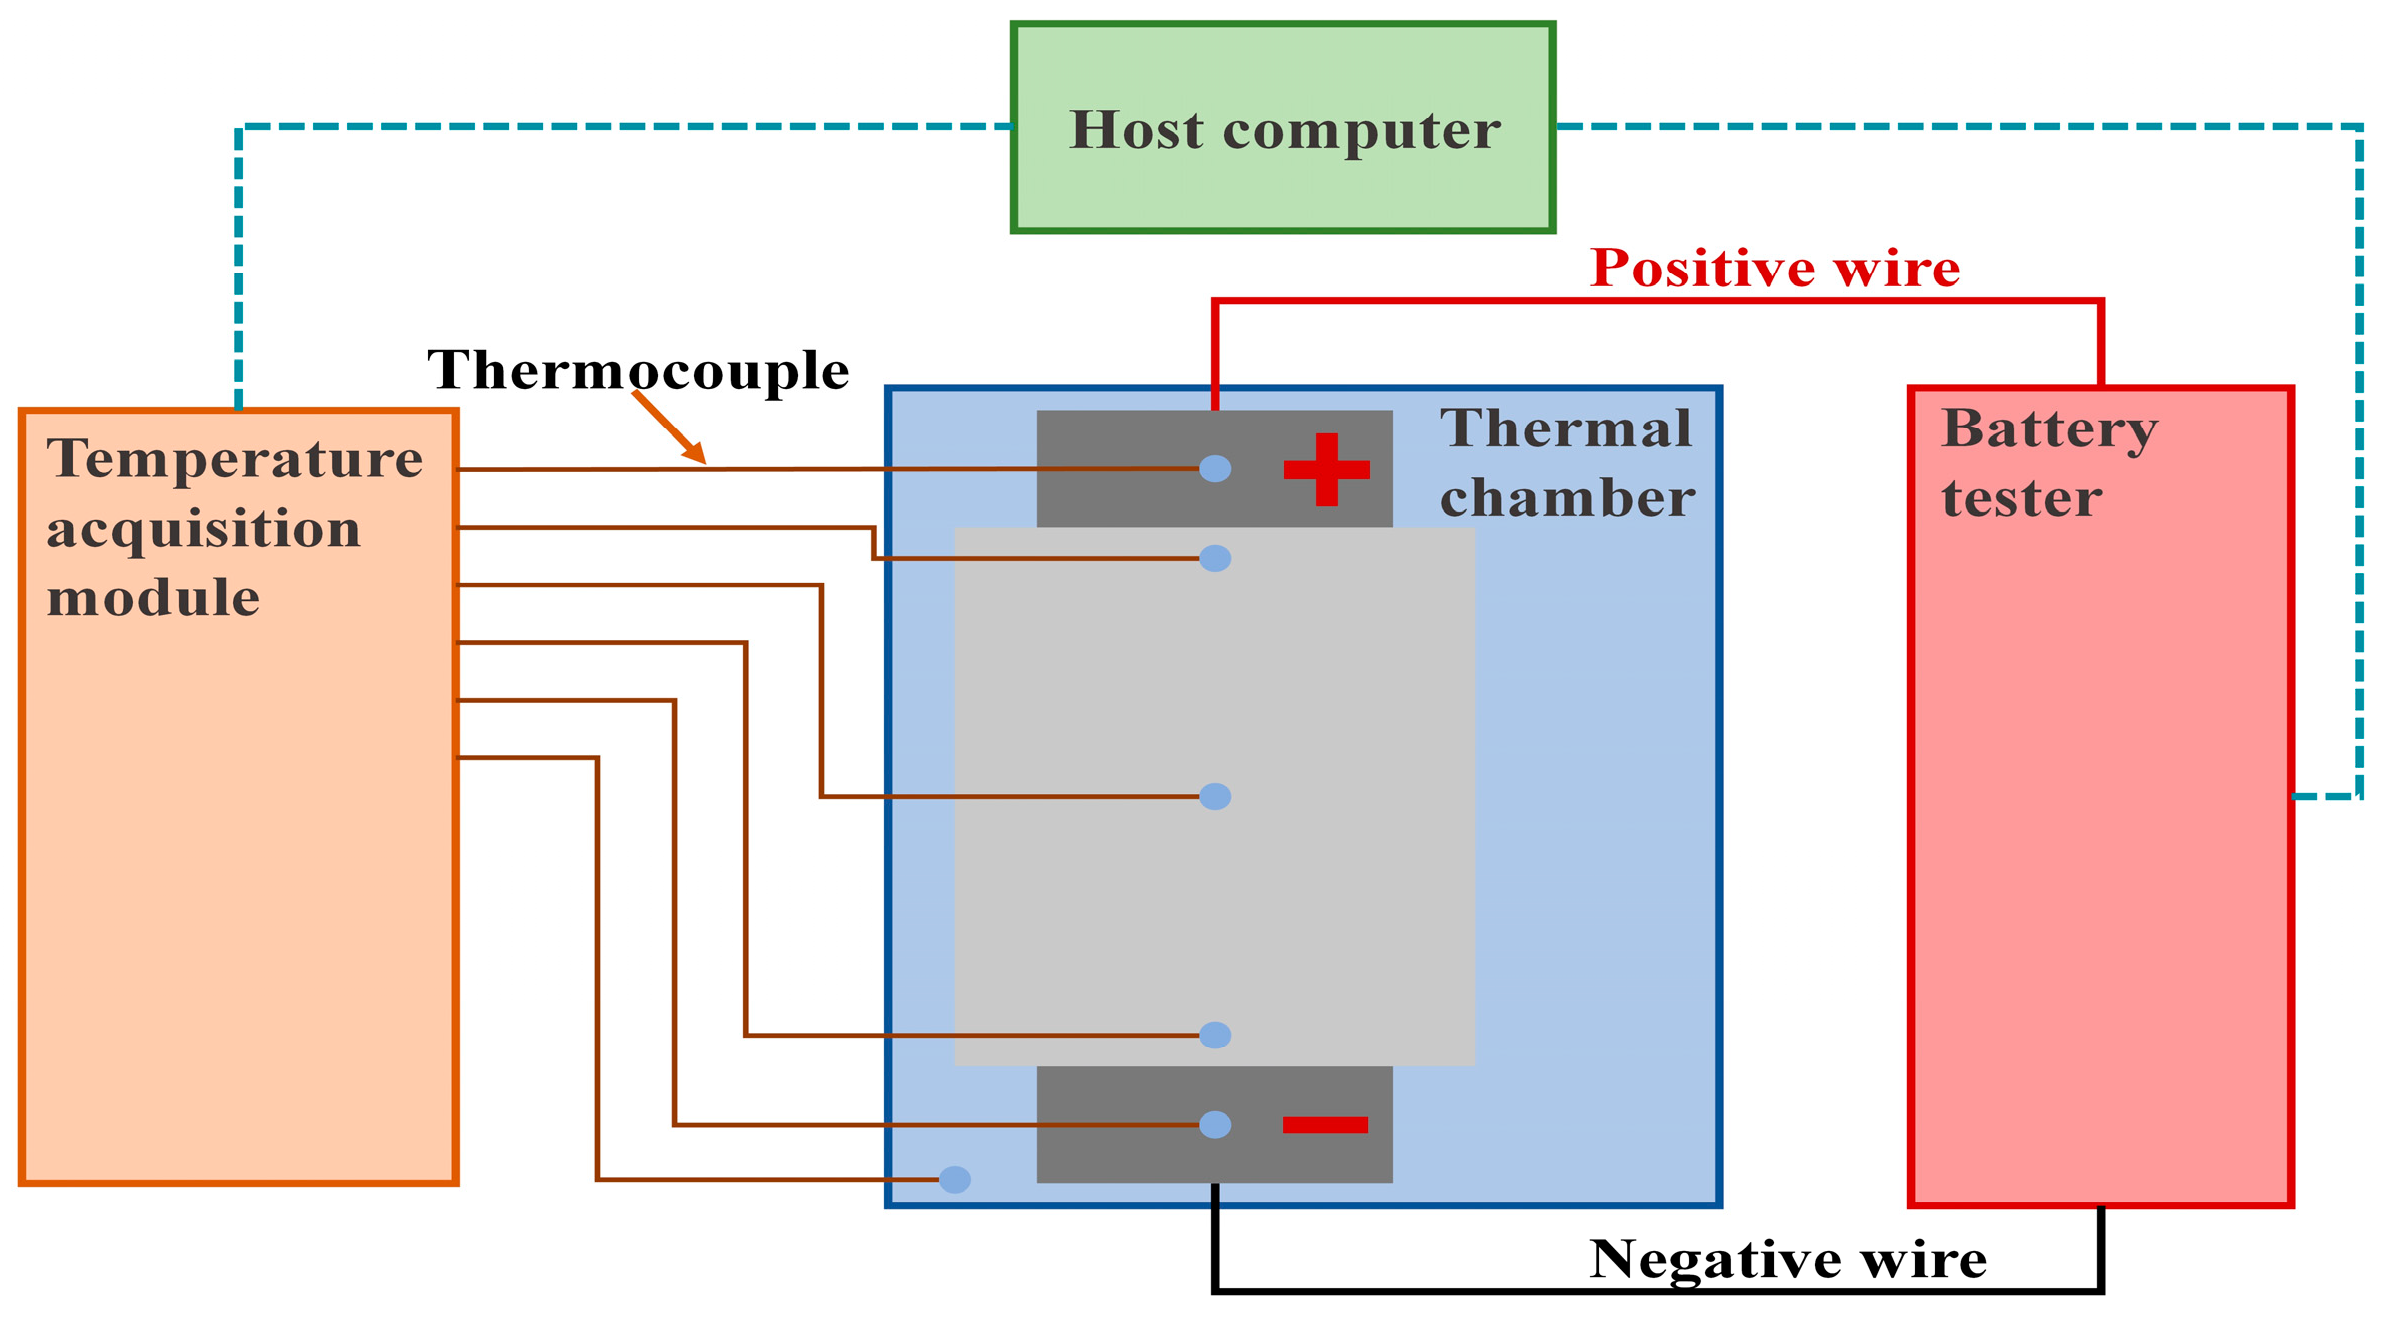
2.1. Testing Platform and Testing Schedule

In this study, experiments were carried out with an 8-Ah pouch-type ternary Li-ion battery with contraposition tabs. In accordance with the structure and shape of the battery, five temperature measurement points were preset on the surface of the battery in order to obtain its simplified thermodynamic and representative temperature dataset, and the schematic of the preset locations is illustrated in Figure 1. Moreover, the experimental platform for the battery testing is shown in Figure 2. Specifically, a Neware CT-8016-5V100A-NTFA battery tester with a measurement accuracy of 0.1% FSR (full-scale range) was used for the battery cycling. The constant experimental temperature was controlled with a DHT-375-40-AR-SD thermal chamber. Six TX-F-T T-type thermocouples with a measurement error of less than 0.5 °C and a Neware CA-4008-1U-VT-TX temperature acquisition module were employed to collect temperature signals. Since there is a difference between the temperature displayed in the thermal chamber and measured by the thermocouple, an additional thermocouple was placed in the thermal chamber to ensure the unity of the temperature signal, and the remaining five thermocouples were attached to the battery plane.
To acquire the detailed electric and thermal signals of the battery in a wide temperature range, the battery testing schedule, which consists of characterization tests and dynamic driving tests, was designed based on the aforementioned experimental platform [35].
The characterization tests, including the static capacity tests (SCTs) and hybrid pulse power characteristic (HPPC) tests, were performed at −20 °C, −15 °C, −10 °C, −5 °C, 0 °C, 5 °C, 15 °C, 25 °C, and 40 °C. Before conducting the HPPC tests, the SCTs needed to be carried out to obtain the actual capacity of the battery based on the manufacturing manual, i.e., the battery was fully charged with a constant current constant voltage (CCCV) charging protocol at a current of 8 A at 25 °C, and then the battery was discharged to the lower cut-off voltage at a constant current of 8 A at the experimental temperature. In each HPPC test, the battery was rested for 2 h to ensure the internal electrochemical status of the battery was close to equilibrium at each preset SOC (from 1 to 0 with an interval of 0.1). In addition, after the battery was rested, the charging and discharging pulses were applied when the preset SOC ranged from 0.9 to 0.1. The amplitude and duration of the pulses were 8 A and 10 s, respectively, and the interval between the charging and discharging pulses was set to 5 min.
The dynamic driving tests, including the federal urban dynamic schedule (FUDS) and the new European driving cycle (NEDC), were performed at −10 °C, 5 °C, and 25 °C. Specifically, the battery was first fully charged with a CCCV charging protocol, and then it was discharged to reach a suitable SOC by drawing a current of 1 C-rate as well as being rested for 2 h at the experimental temperature before each dynamic testing profile was employed. To avoid Li-plating inside the battery, the maximum currents of the dynamic testing profile were set to 6 C-rate at −10 °C and 5 °C, and those at 25 °C were set to 10 C-rate. Note that the current represented by 1 C-rate is the actual battery capacity at the current experimental temperature in this study. In addition, all tests were limited to a voltage window of 2.75~4.20 V.

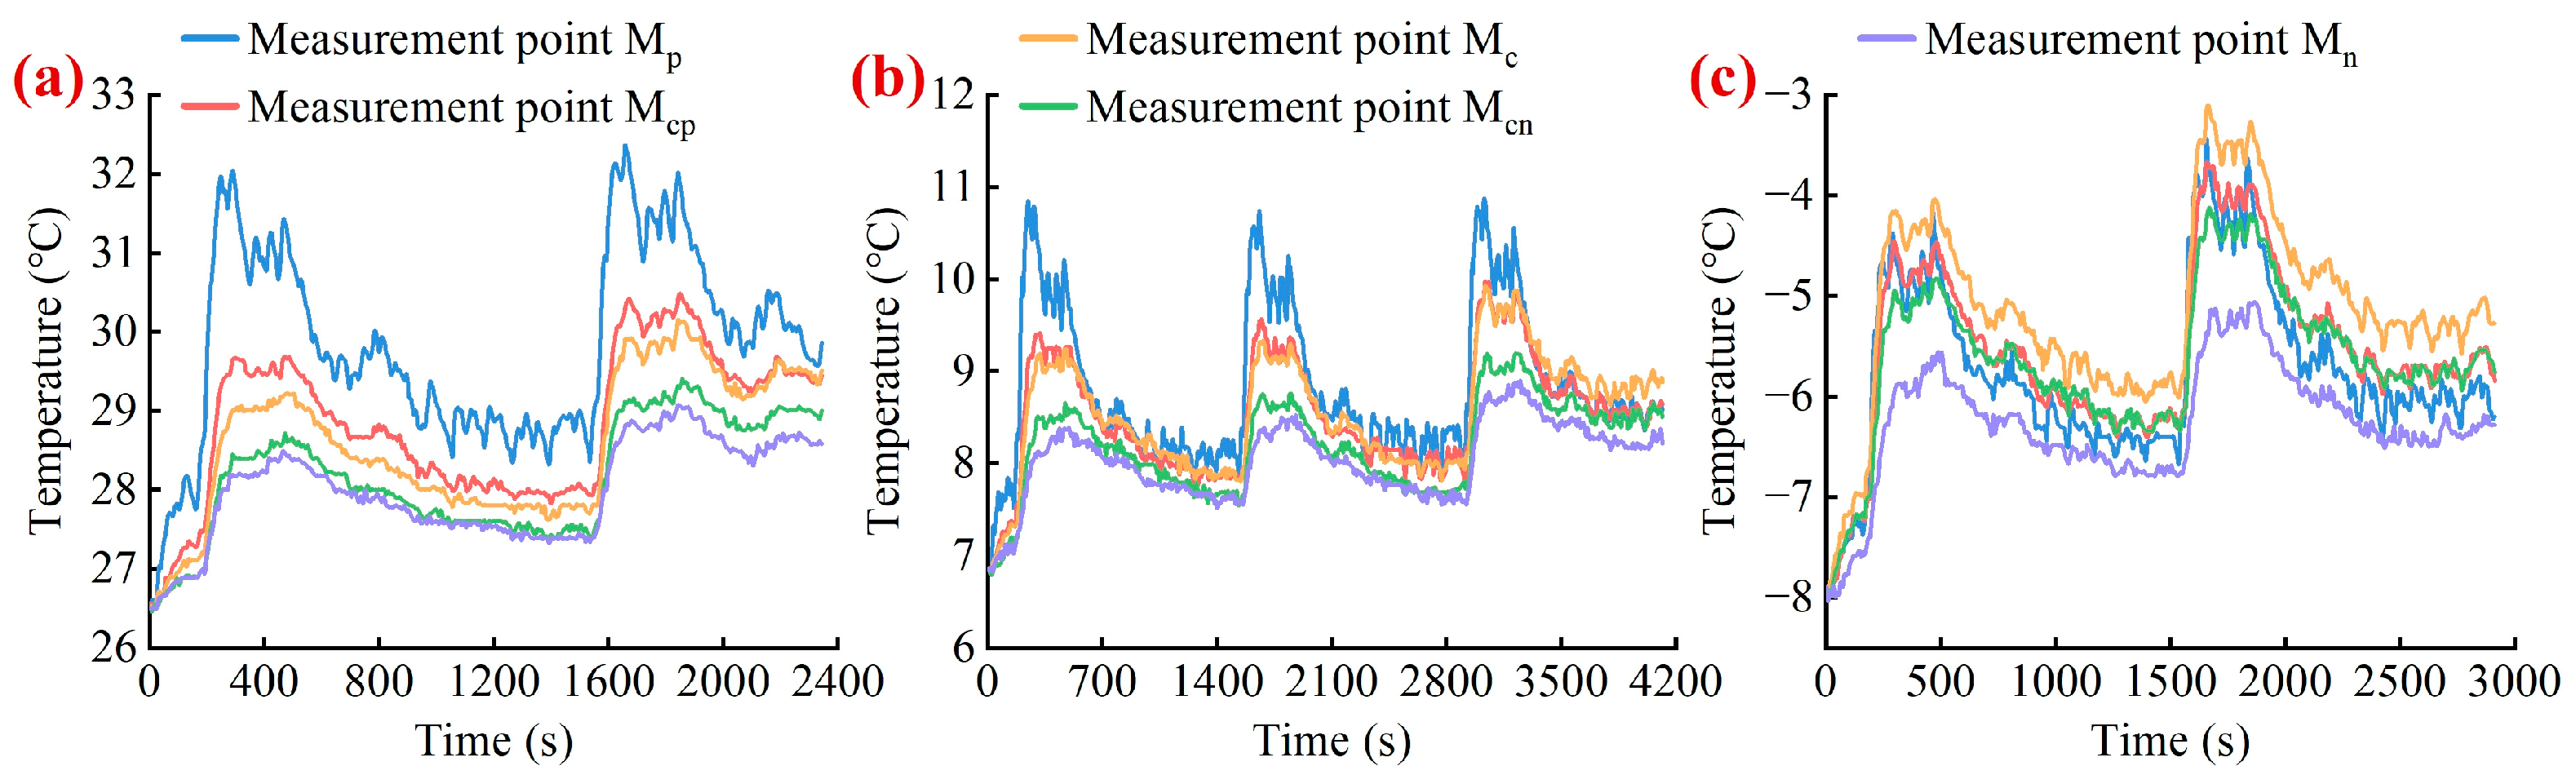
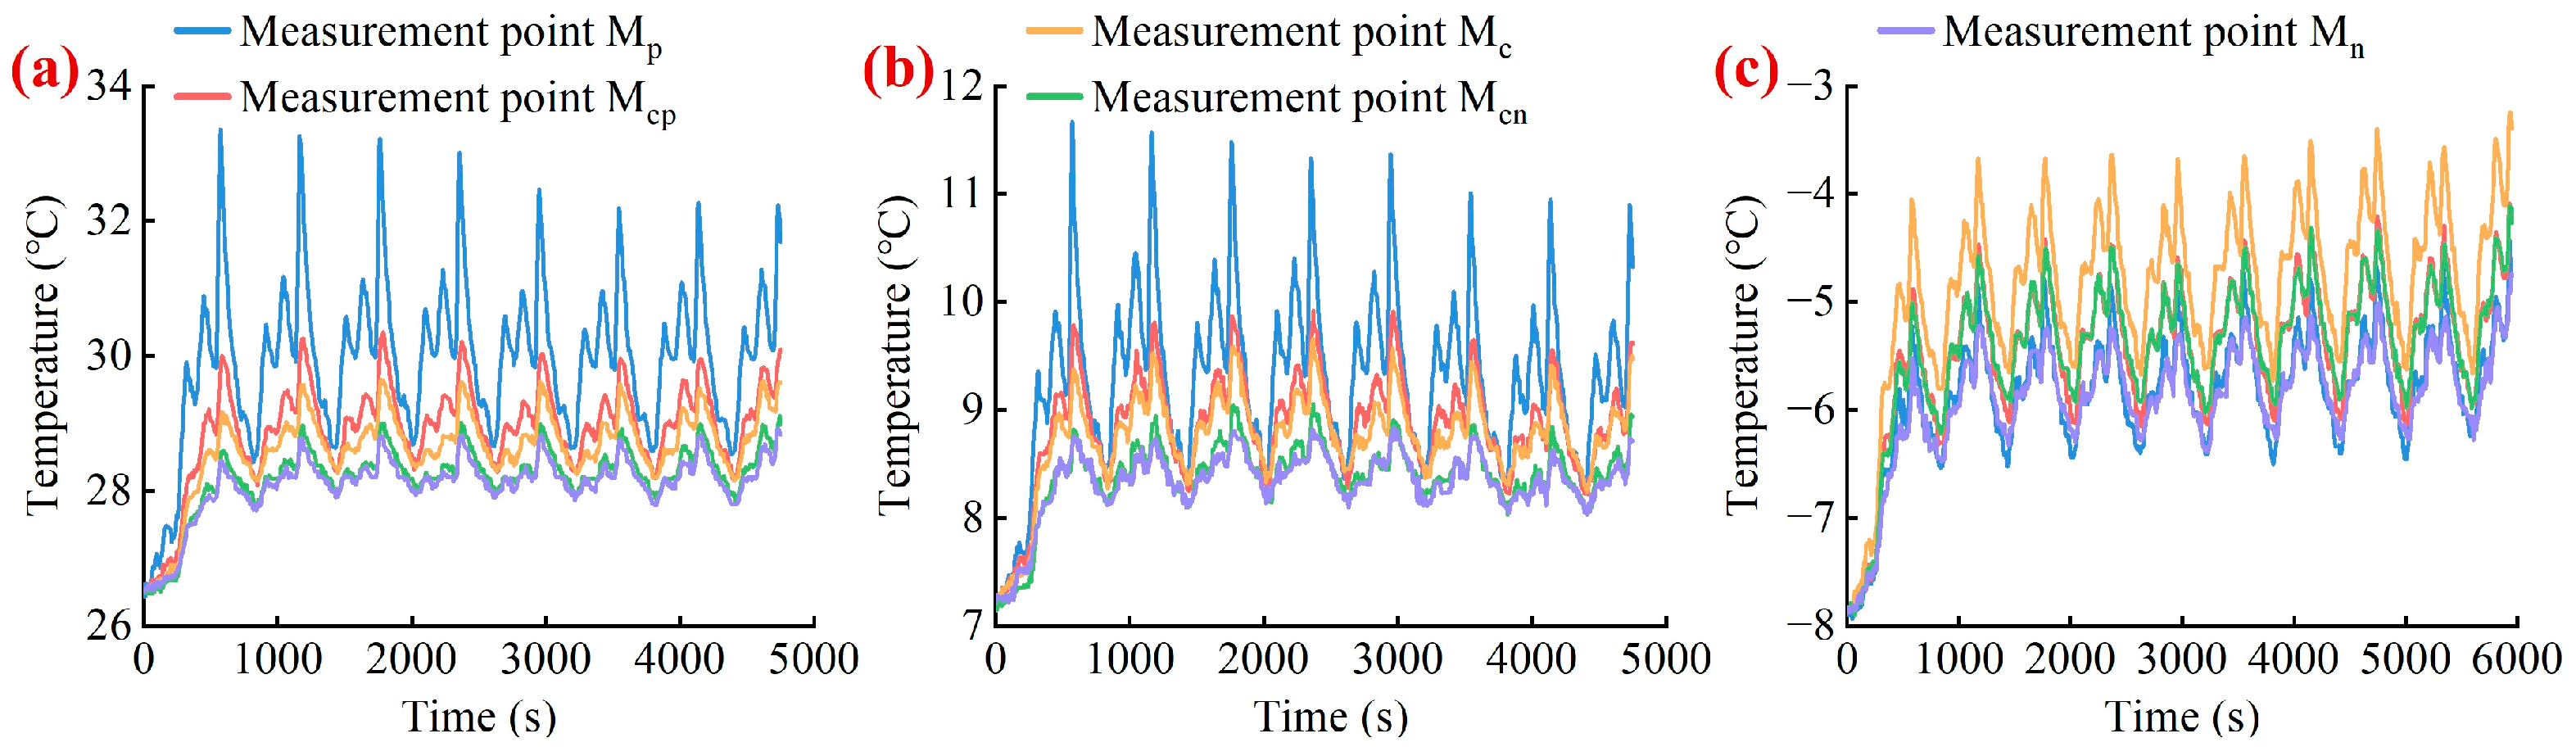
2.2. Thermal Response Analysis

The thermal responses of the pouch-type battery under FUDS and NEDC testing profiles at various ambient temperatures are illustrated in Figure 3 and Figure 4, respectively. As will be readily seen, the location of the highest temperature on the battery surface would be likely to vary with the operating temperature. Specifically, at operating temperatures of 25 °C and 5 °C, the highest temperature of the battery occurs at measurement point Mp, and the lowest temperature of the battery generally occurs at measurement points Mcn or Mn. Nevertheless, the location of the highest temperature will progressively transfer from the positive tab to the center of the main battery body when the operating temperature is reduced to −10 °C.
Furthermore, this study summarizes the temperature distribution of other cell geometries and tab arrangements at various test scenarios based on the datasets reported in the existing literature [15,36,37,38,39], as shown in Table 1. It can be seen that the thermal behavior of temperature field evolution extensively exists in various dimensions and types of Li-ion batteries. From the perspective of the external impact factor, this thermal characteristic is primarily attributable to the magnitude of the loading current and operating temperature during the charging and discharging processes.

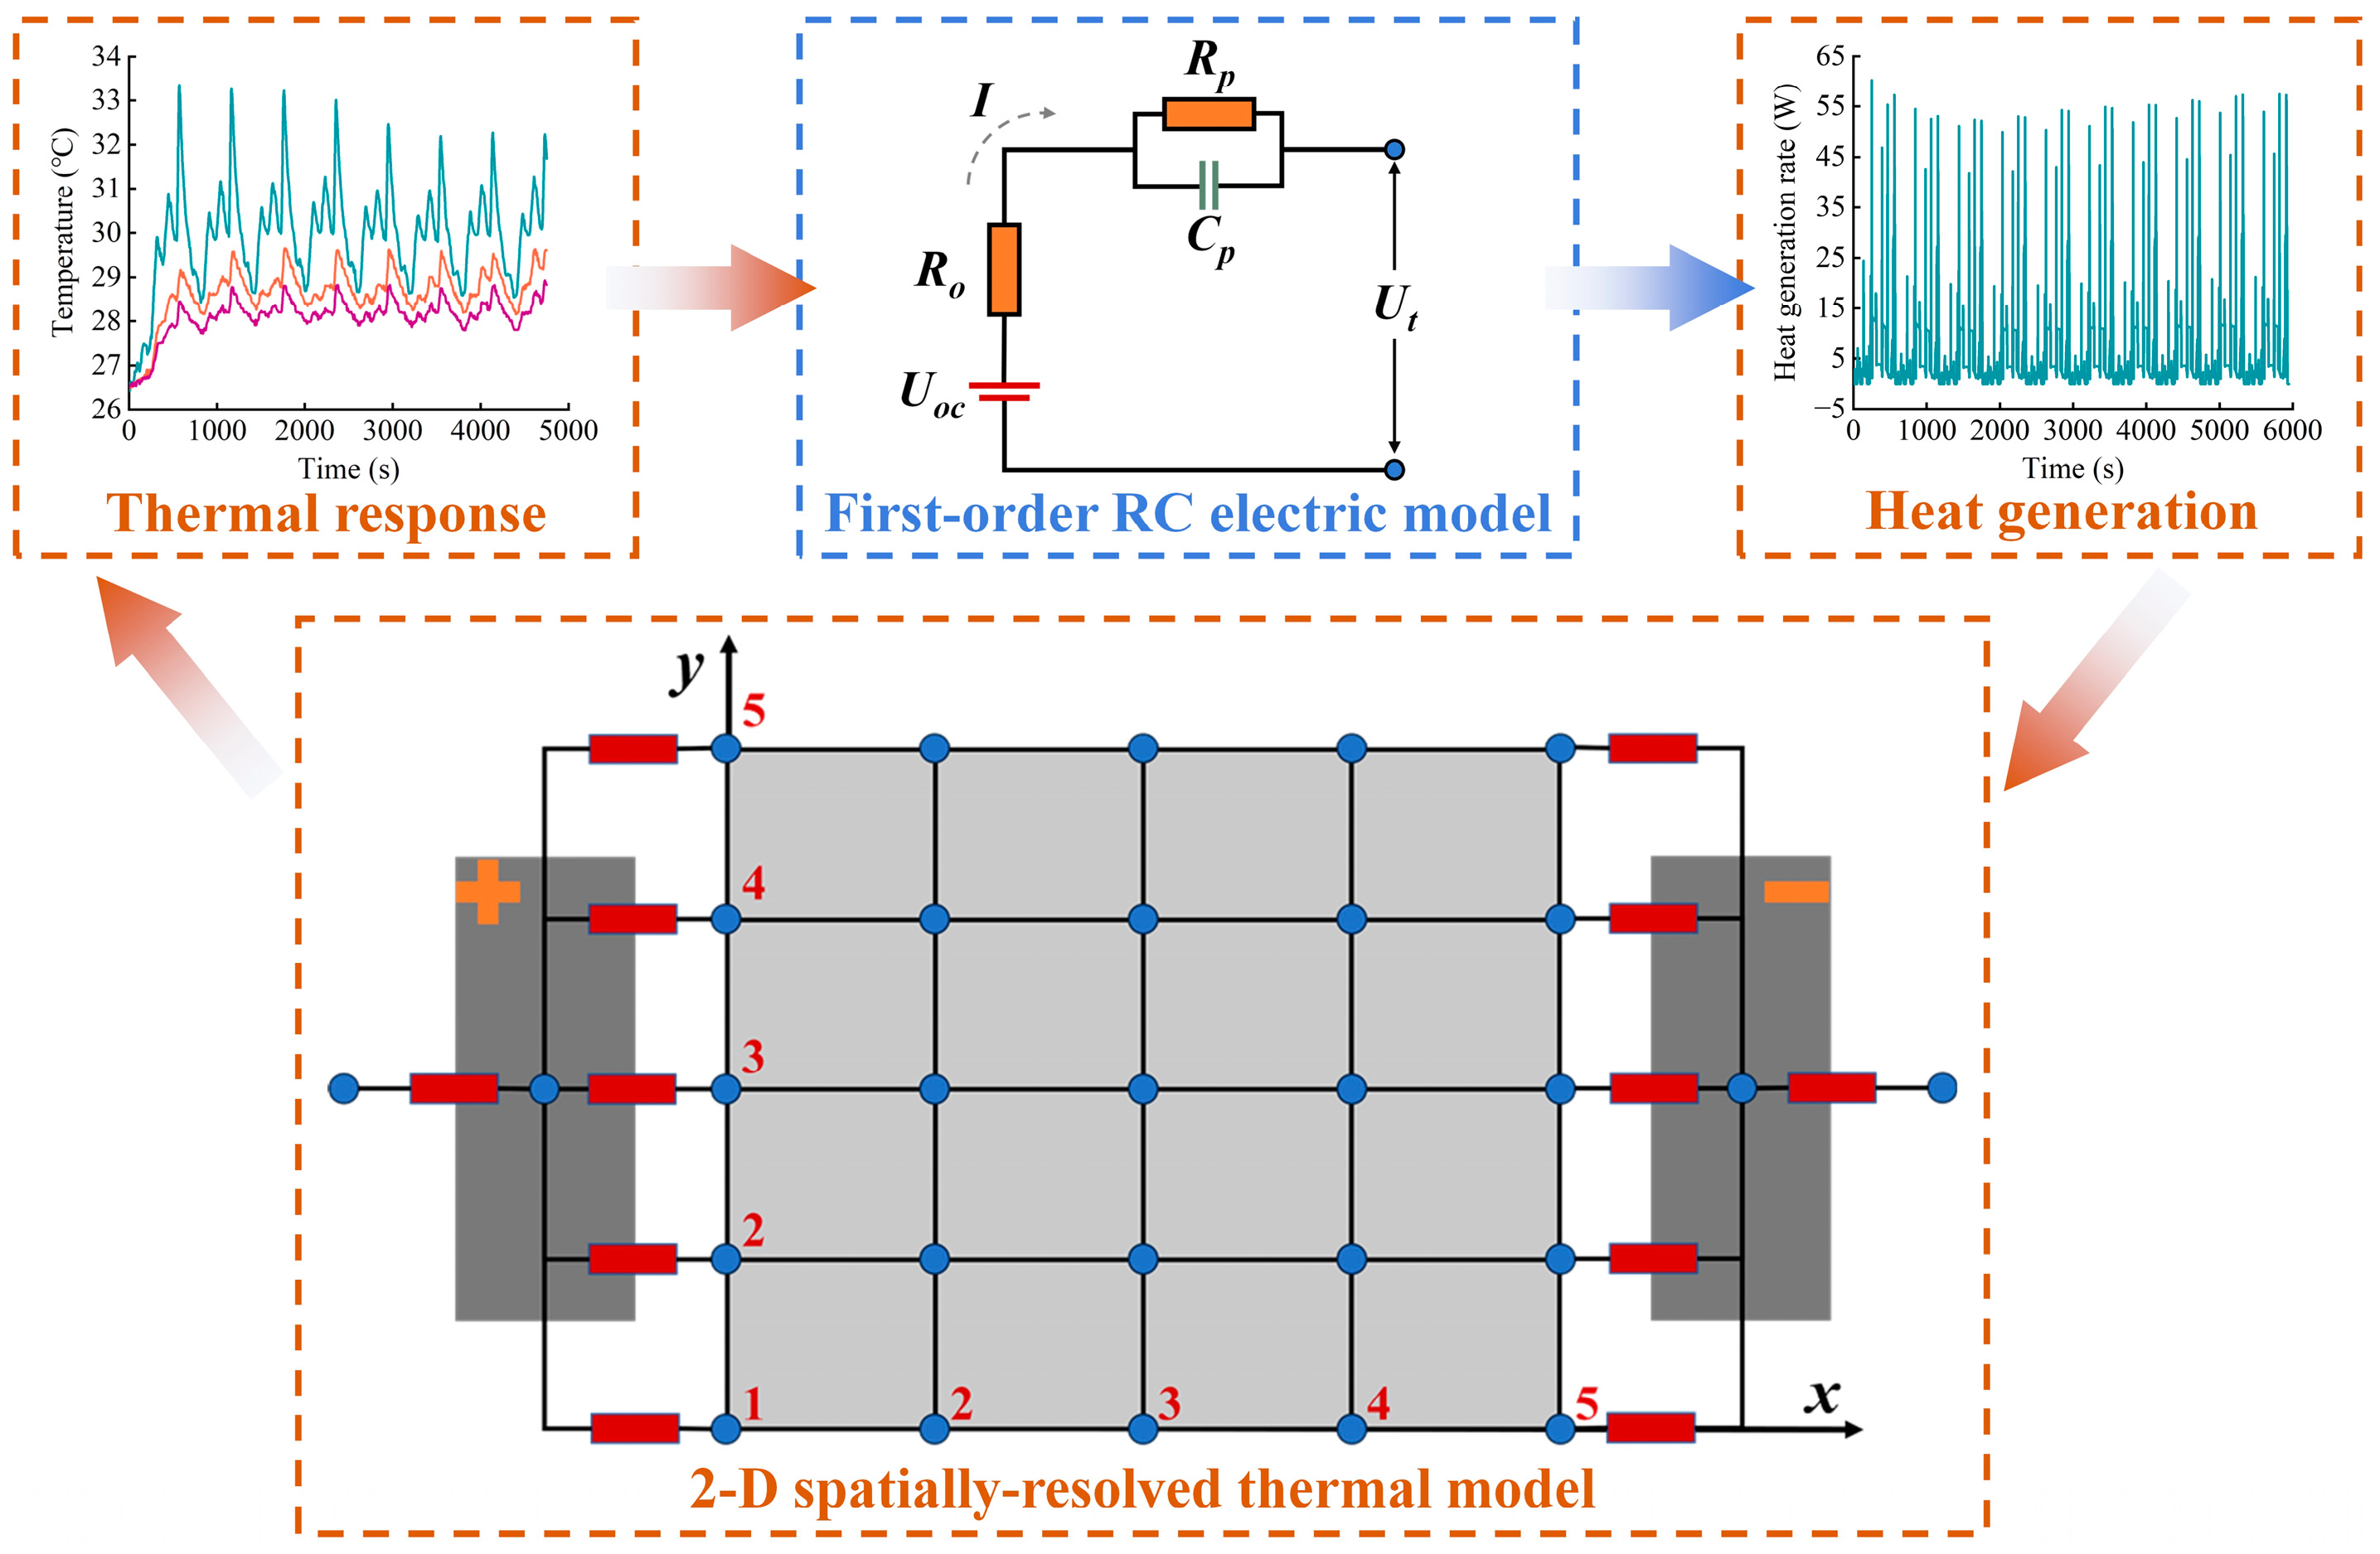
3. Electrothermal Model

As the heat generation rate of the battery is calculated by the equivalent resistance-based method, an electrothermal model for large-format Li-ion batteries is established in this section, which is composed of a first-order RC electric model and a two-dimensional (2-D) spatially-resolved thermal model that combines two lumped-mass thermal sub-models and the FDM solving technique. The schematic of the electrothermal model is illustrated in Figure 5. In addition, the parameterization of the electrothermal model is also addressed in this section.

3.1. Model Assumption

As Li-ion batteries are complicated electrochemical systems with distinct nonlinearity, the application of several reasonable assumptions is conducive to modeling and analysis of the battery on the premise that it has less impact on simulation fidelity. Therefore, the following assumptions are presented in this study.
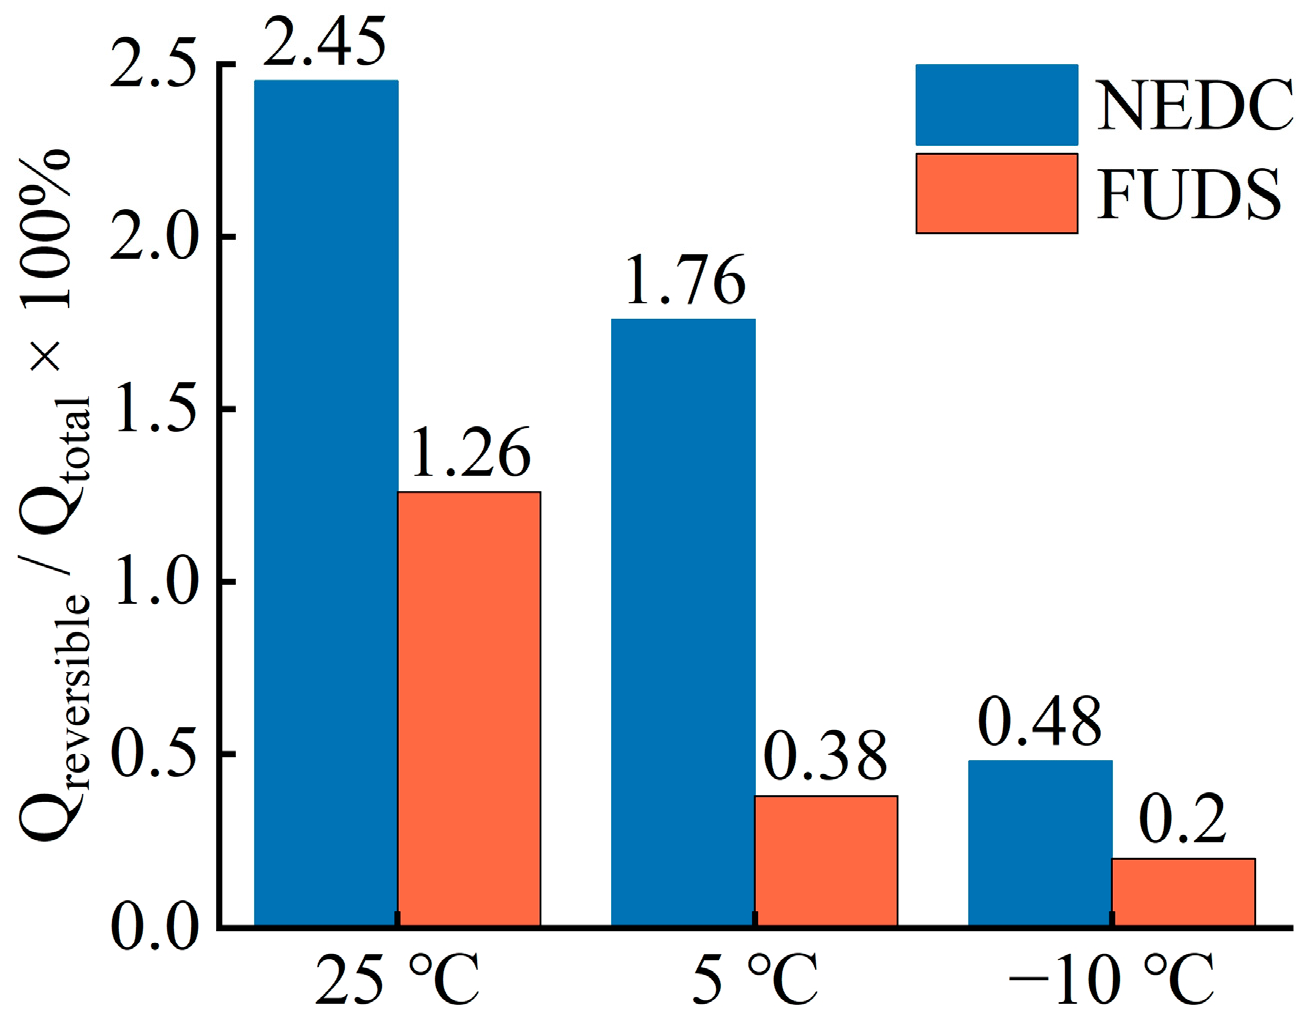
  • As described in the introduction, reversible heat accounts for a small proportion of the total heat generation, and thus this work is only interested in irreversible heat. To demonstrate the validity of this assumption, the ratio of reversible heat to total heat generation is calculated here, and the results are illustrated in Figure 6. As will be readily seen, the relative proportion of the reversible heat of the battery is tiny in comparison to the irreversible heat, and the proportion is positively correlated with the operating temperature. Hence, the omission of reversible heat has less impact on the overall heat generation of the battery.
  • Since the battery is placed in an atmosphere of constant temperature and humidity, this work assumes that each direction of the battery has identical cooling conditions, i.e., an identical convection coefficient and boundary temperature [40].
  • From the perspective of material properties and simulation results reported in the existing literature [41], the temperature distribution of the two tabs is assumed to be uniform in this study.

3.2. Model Establishment

3.2.1. Electric Model

In this study, the first-order RC electric model is employed to capture the electric behavior of the battery. According to Kirchhoff’s law, its mathematical formulae can be expressed by [42]
C p d U p d t + U p R p = I
U t = U o c + U p + I R o
where C p , R p and U p are the polarization capacitance, resistance and voltage, respectively. U o c and U t represent the open circuit voltage and terminal voltage, respectively. R o is the Ohmic resistance. I is the loading current, which is positive for charging and negative for discharging in this study.
The Laplace transform and bilinear transform are introduced to discretize the aforementioned expression which is time-continuous, and the time-discrete expressions as described by
Φ k = [ U t U o c k 1 I k I k 1 ]
θ k = c 1 c 2 c 3 T
y = Φ k θ k
where Φ k and θ k represent the data vector and parameter vector, respectively, and the subscript k is the time steps. Subsequently, the electric model parameters can be obtained in accordance with the parameter vector; the specific calculation expressions are given by
R o = c 2 c 3 / 1 c 1
R p = c 2 + c 3 / 1 + c 1 R o
C p = 1 c 1 / 2 c 1 + 2 R p

3.2.2. Thermal Model

Lumped-mass thermal sub-models for the two tabs: The temperature evolution of the tabs is attributable to three sources, including heat generation, heat flow between the tabs and the main battery body, and convection heat dissipation between the tabs and the external environment. Since the positive and negative tabs have identical principles of heat generation and transfer, the generic thermal model for the two tabs is given here. It is formulated by
C p t m t T t t = I 2 R o t h c t A c t T t T Q b t
where C p t and m t denote the specific heat capacity and mass of the tab, respectively. R o t represents the equivalent Ohmic resistance of the tab. h c t and A c t are the equivalent convection coefficient and convection area, respectively. T t and T are the bulk temperature of the tab and the ambient temperature, respectively. Q b t denotes the heat flux between the tabs and the main battery body, which is approximately described by the following empirical expression:
Q b t = y = 1 n h b t A b t T t T x , y
where h b t denotes the heat transfer coefficient. A b t and T x , y are the average cross-sectional area and the temperature of the discrete grid points connected directly to the tab, respectively. The subscripts x and y represent the location of grid points, and here x = 1 , m . In addition, m and n are the number of discrete grid points along the length and width of the battery body, respectively.
FDM solving technique for the main battery body: The energy conservation equation applied in the 2-D thermal model is described by the following second-order parabolic partial differential equation (PDE) [40]:
ρ C p T t = k x 2 T x 2 + k y 2 T y 2 + q
The convective boundary conditions for the 2-D thermal model are subject to
T x = h k x T r T T x = h k x T T l
T y = h k y T u T T x = h k y T T b
where ρ and C p are the volume-averaged density and specific heat capacity of the main battery body, respectively. k x and k y represent the thermal conductivity along the x and y directions, respectively, which are assumed to be identical here and expressed by k . T is the temperature distribution in the battery plane. The subscripts r , l , u and b represent the right, left, upper and bottom boundaries of the battery, respectively. h is the equivalent convection coefficient. The term q denotes the volumetric heat-accumulation rate in the main battery body, including the heat generation inside the battery and the heat flux between the tabs and the main battery body. In addition, this study considers that the latter only exists in the discrete grid points connected directly to the tabs if the thermal interaction between the tabs and the battery body is considered.
According to the aforementioned 2-D governing equations, this study first discretizes the main battery body into m × n grid points in the spatial domain, herein m = n = 5 , and the schematic of discretization strategy is shown in Figure 5. Accordingly, the subscripts x , y serve to distinguish the variables at the discrete grid points, 1 x m and 1 y n . Subsequently, the FDM method is utilized to convert the PDE problem (above mentioned Equations (8)–(10)) into a set of linear Ordinary Differential Equations (ODEs), where this method includes the forward, backward, and central difference approaches derived generally from Taylor expansion [43]. In this study, the central difference method is applied to Equation (8); taking the center grid points, for example, they are expressed by
d T x , y d t = k ρ C p T x + 1 , y Δ x 2 + T x 1 , y Δ x 2 + T x , y + 1 Δ y 2 + T x , y 1 Δ y 2 2 1 Δ x 2 + 1 Δ y 2 + q x , y ρ C p
With regard to the boundary grid points and corner grid points, the similar difference approach is followed and the discrete boundary conditions are combined, where the discrete boundary conditions are described by
T m + 1 , y T m 1 , y 2 Δ x = h k T r T T 2 , y T 0 , y 2 Δ x = h k T T l
T x , n + 1 T x , n 1 2 Δ y = h k T u T T x , 2 T x , 0 2 Δ y = h k T T b
Finally, we end up with m × n ODEs, which can be converted into a state-space form expressed by
x ˙ = A x + B u y = C x
where the system state is x = x 1 , 1 x 2 , 1 x m , 1 x 1 , 2 x m , n T , the system input is u = q 1 , 1 q 2 , 1 q m , 1 q 1 , 2 q m , n T T , and the measured temperatures in the main battery body are extracted as the system output, namely y = T 2 T 3 T 4 T . A , B and C are the system matrices, whose detailed introductions can be found in [18].
Additionally, the following mathematical equations are introduced to calculate the heat-accumulation rate of discrete grid points [40]. Regarding the discrete gird points not connected directly to the tabs, the term is formulated by
q 1 = q i r = β I 2 ( R o + R p ) / V
where β is an adjustment parameter correcting the Ohmic and polarization resistance obtained by interpolation so that the accumulative deviation is avoided. V is the volume of the main battery body. It is noteworthy that this study only considers the effects of temperature and SOC on the Ohmic and polarization resistances. For the discrete grid points connected directly to the tabs, the term is formulated by
q 2 = q 1 + h b t A b t T t T x , y / V / N e
where N e is the number of discrete elements, taking N e = m 1 n 1 .

3.3. Model Parameterization

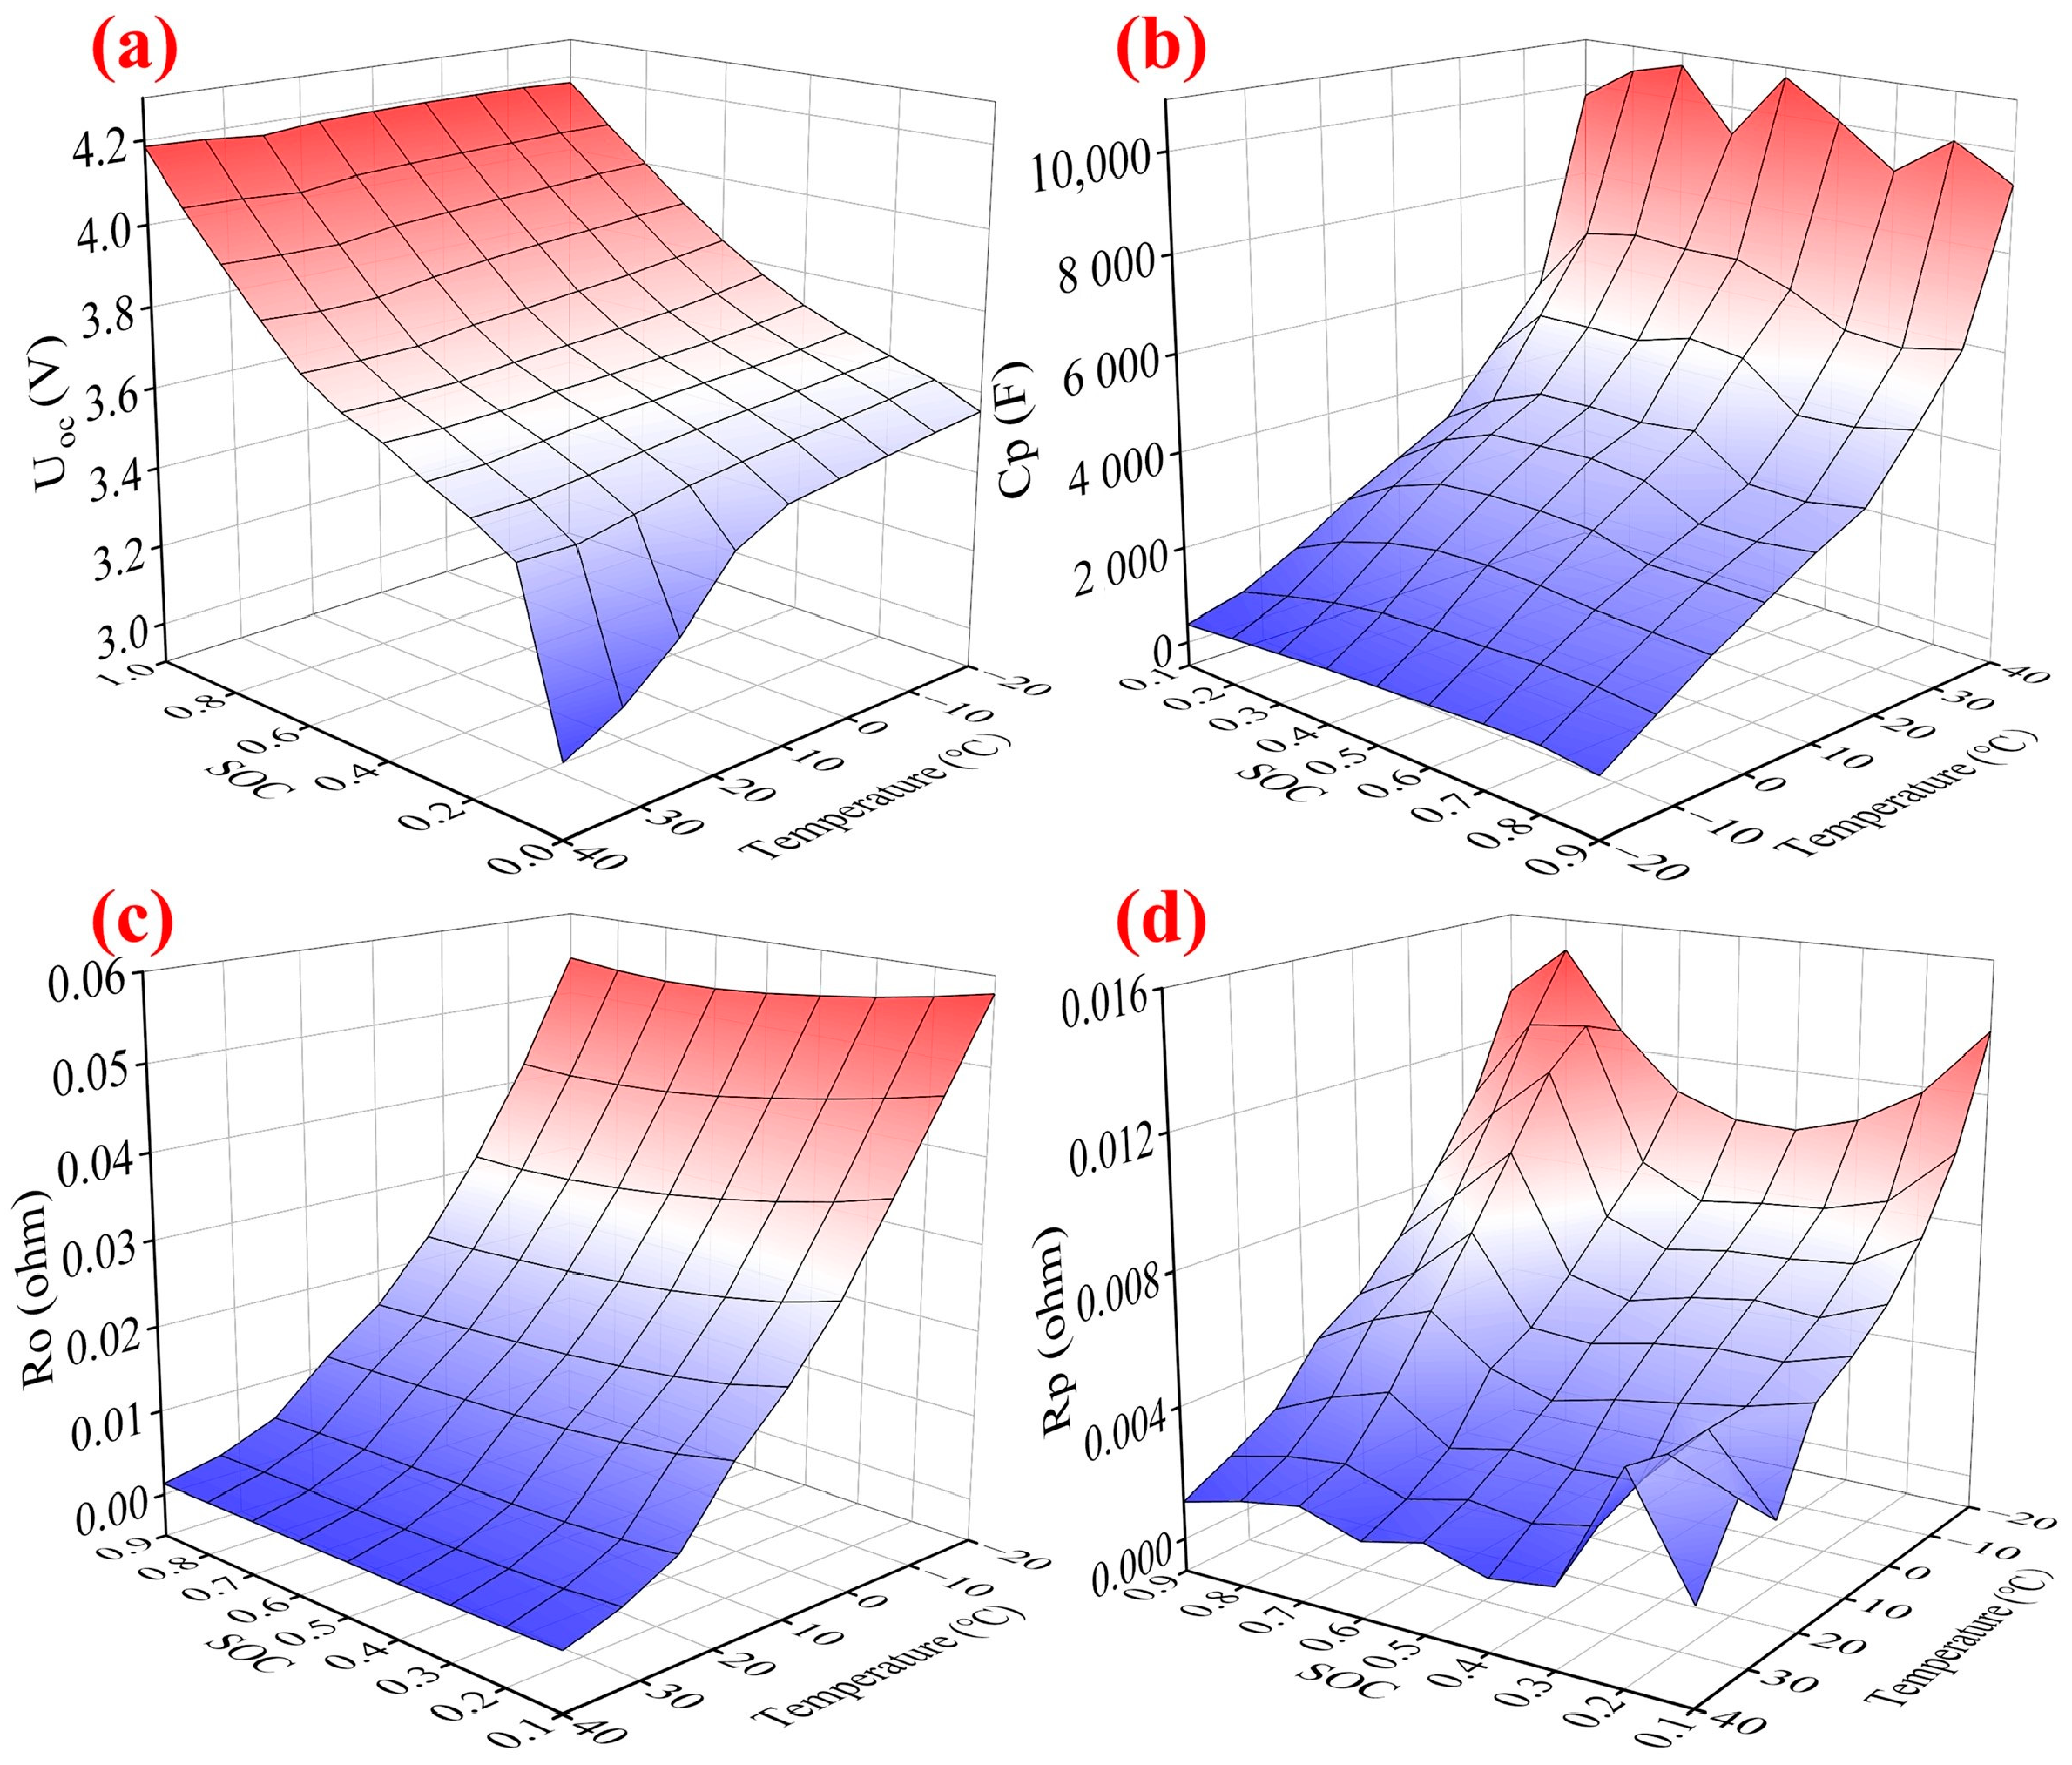
3.3.1. Parameterization of the Electric Model

The parameterization process of the electric model can be divided into two steps. Primarily, the terminal voltages under various temperatures and SOCs are extracted as the OCVs when the internal electrochemical status of the battery is close to equilibrium. Subsequently, in accordance with the discrete-time model derived from Kirchhoff’s law, the recursive least-squares with forgetting factor (FFRLS) algorithm is applied to acquire the optimal values of resistance and capacitance, whose detailed implementation procedure is described as follows [44].
  • Initialization of the forgetting factor λ , parameter vector θ and covariance matrix P .
  • Update the gain matrix: K k = P k 1 Φ k Φ k T P k 1 Φ k + λ 1
  • Calculate the estimation error: e k = y k Φ k T θ k 1
  • Update the parameter vector: θ k = θ k 1 + K k e k
  • Update the covariance matrix: P k = 1 λ P k 1 K k Φ k T P k 1
where k is the iterative time step. Φ represents the data vector. y denotes the actual measurement value. The ultimate identification results of the electrical model parameters are illustrated in Figure 7.

3.3.2. Parameterization of the Thermal Model

As the 2-D spatially-resolved thermal model contains over 10 unknown parameters, the parameters of the two tabs and main battery body are identified independently in order to lower the difficulty of parameterization and avoid overfitting. Additionally, the particle swarm optimization (PSO) algorithm is used as an identified procedure, whose detailed implementation steps are given below [45].
  • Initialize the position x i d and velocity v i d of each particle i at each dimension d randomly within a permissible range.
  • Calculate the fitness value of each particle.
  • Update the personal best solution P i d , b e s t k of each particle and the global best solution G d , b e s t k of the entire particle swarm based on the fitness value of each particle.
  • Update the position and velocity of each particle
    v i d k + 1 = ω v i d k + c 1 r 1 P i d , b e s t k x i d k + c 2 r 2 G d , b e s t k x i d k x i d k + 1 = x i d k + v i d k + 1
  • Determine whether the termination criteria are satisfied. The termination criteria are generally the maximum iterations or optimal fitness value.
where ω represents the inertia weight, c 1 and c 2 are the learning factors, r 1 and r 2 are the random numbers within an interval of 0 to 1.
As described in the lumped-mass thermal model, the equivalent Ohmic resistance R o t , the equivalent convection coefficient h c t , and the heat transfer coefficient h b t are unknown, and the identification results are summarized in Table 2. In the case of the main battery body, its unknown parameters include the volume-averaged density ρ , the specific heat capacity C p , the thermal conductivity k , the convection coefficient h , and the adjustment parameter β . Since the volume-averaged density and specific heat capacity always occur in the form of a product, the equivalent coefficient μ = ρ C p is introduced here to ensure the identified values are more representative. Moreover, as these parameters are insusceptible to the battery status [27], the parameterization results under FUDS testing profiles at 5 °C are taken as the parameters of the main battery body. The optimal values with and without the consideration of thermal interplay are illustrated in Table 3 and Table 4, respectively.

4. Analysis and Discussion

4.1. The Analysis of Temperature Inconsistency of Large-Format Li-Ion Batteries

4.1.1. The Characteristic of Uneven Temperature Distribution

This study considers that this inconsistent characteristic is primarily attributable to inhomogeneous heat generation within the main battery body and the thermal interplay between the two tabs and the main battery body. Regarding the inhomogeneous heat generation, Figure 8 illustrates the heat-generation rate of each measurement point in the main battery body under 1 C-rate current excitation at various temperatures. It can be seen that the heat-generation rate at various measurement points and the nonuniformity between various measurement points increase as the operating temperature decreases, which is strongly related to the variation in the battery’s internal resistance. Furthermore, the difference in the heat-generation rate in the battery plane is small and almost negligible at 25 °C. And the order of the heat-generation rate at each measurement point is opposite to the order of their temperatures. For instance, the highest temperature in the battery plane is at measurement point Mc under the constant current testing profile at −10 °C, while the heat-generation rate at measurement point Mc is the lowest. Therefore, there must be some other thermal behaviors that affect the characteristics of inhomogeneous temperature distribution.
The influence of thermal interplay on the temperature distribution is validated by comparing the temperature outputs of the thermal models with and without consideration of thermal interplay, and the comparison results are illustrated in Figure 9. Moreover, the output results are reasonable if the output errors are in the range of −0.5 °C to 0.5 °C, for the reason that the temperature measurement device adopted has a measurement error of 0.5 °C. As shown in the second row in Figure 9, the temperature output errors of the thermal model with consideration of thermal interplay are less than those without this consideration, and the errors of the thermal model with this consideration are within the tolerance limits. In addition, the mean absolute error (MAE) of the thermal model incorporating the effects of the two tabs considerably outperforms another thermal model, indicating that the heat generation and flux of the two tabs cannot be ignored. In conclusion, the inhomogeneous temperature distribution of large-format Li-ion batteries is generally the result of the combined action of the aforementioned two thermal behaviors.

4.1.2. The Evolution of the Highest Temperature Position

For the characteristics of the difference in the highest temperature position at various operating modes, this study extracts the maximum temperature rise at measurement points Mp and Mc under various dynamic driving tests at −10 °C and 5 °C, which are given in Table 5. It can be seen that the maximum temperature rise at measurement point Mc undergoes a significant change as the battery operating temperature decreases, but the impact on the positive tab is relatively slight. As the temperature rise of the two tabs and main battery body is mainly attributable to their heat generation rate, this study compares the resistance change rate at measurement points Mp and Mc from −10 °C to 5 °C, and the results are shown in Figure 10. The mathematical expression of the resistance change rate is formulated by
R c h a n g e , k = R 10 , k R 5 , k R 10 , k × 100 %
where the subscript k is the time step. In addition, the resistances of measurement points Mp and Mc at each time step are obtained using the interpolation method.
As can be seen from Table 2 and Figure 7, the resistances of the positive tab and main battery body show a consistent negative correlation with temperature. Nevertheless, it can be seen from Figure 10 that the resistance change rate of measurement point Mc is larger than that of measurement point Mp as the temperature decreases. For instance, the average change rate of measurement point Mc is 57.08% under NEDC from −10 °C to 5 °C, while that of measurement point Mp is 24.51%. These are mainly attributable to the material properties of the positive tab and main battery body. The material of the positive tab is aluminum, whose resistance is slightly affected by temperature. Nevertheless, as a complex of “micro cells”, the resistances of the main battery body have a significant dependence on temperature, which is caused by the sluggish kinetics of ion/electrons at low temperatures and the increased electrolyte viscosity with the decreased temperature.

4.2. Potential Thermal Management Strategies Based on the Electrothermal Model

As per the aforementioned description, inconsistent temperature characteristics exist in most large-format Li-ion batteries. Accordingly, a comprehensive understanding of temperature inconsistency has provided strong guidelines for the development of the BTMS. For instance, the layout of temperature sensors can be designed in terms of the temperature information under a series of operating conditions, which is obtained through experiments or simulation ahead of time. Taking the battery employed in this study as an example, its maximum temperature generally occurs at the positive tab and the center of the battery. Hence, as long as the BTMS accurately monitors the temperatures of these positions in real time, the deteriorated thermal behaviors of the battery that include overheating and thermal runaways can be avoided. Nevertheless, confronting the intricate and variable thermal characteristics of Li-ion batteries, limited sensors are incapable of supplying sufficient temperature information to the BTMS. In light of this, establishing an electrothermal model capable of capturing the detailed thermal dynamics of large-format Li-ion batteries is especially significant. In addition, this study analyzes the sensitivity of the electrothermal model applied here to key parameters, whose analysis results are illustrated in Figure 11. It can be seen that the model is sensitive to the variation in external coolant conditions, namely the convection coefficient and ambient temperature, indicating that the electrothermal model effectively tracks actual values even in the time-varying operating environment. Therefore, the real-time thermal information predicted by the electrothermal model can be transmitted as inputs to the BTMS, and then the power output of the cooling or heating equipment in the BTMS can be controlled based on these inputs, thereby mitigating the thermal gradient of the battery during operation.

5. Conclusions

Based on the experimental data of an 8-Ah pouch-type ternary Li-ion battery with contraposition tabs and the thermal behaviors of Li-ion batteries reported in the existing literature, a difference in the highest temperature position at various operational temperatures or currents exists in most large-format Li-ion batteries. In this study, this thermal characteristic and the uneven temperature distribution in the battery plane are collectively referred to as the battery temperature inconsistency, which was analyzed by establishing an electrothermal model. Specifically, the characteristic of inhomogeneous temperature distribution was analyzed by calculating the heat-generation rate at various measurement points and comparing the temperature prediction accuracy of the model with and without consideration of thermal interplay. The results illustrate that the heat-generation rate at various measurement points and the nonuniformity between various measurement points would be likely to increase as the operating temperature decreases. In addition, the thermal model incorporating the effect of the two tabs yields superior prediction accuracy. These indicate that this characteristic is primarily attributable to the uneven heat generation and the impact of the two tabs. Regarding the evolution of the temperature field, this study compares the changes in the maximum temperature rise between the positive tab (measurement point Mp) and main battery body (measurement point Mc) at various operating temperatures, whose results suggest that the operating temperature has a greater impact on measurement point Mc. Subsequently, the resistance change at measurement points Mp and Mc was calculated, and the same conclusion was obtained. The main reason is that, as a complex electrochemical system, the resistance of the main battery body strongly depends on the operating temperature. In conclusion, obtaining the thermal dynamic of Li-ion batteries ahead of time provides a strong guideline for designing the BTMS, and the electrothermal model is also expected to be used for the BTMS to mitigate temperature inconsistency during operation.
In our future work, the physical mechanism of the electrothermal model will be further improved to increase the performance of tracking the thermal behaviors of the battery. The electrothermal model will be tested on larger cells to establish the scale of inconsistency effects with increasing cell size. The detailed thermal dynamics of large-format Li-ion batteries and the limitations of the electrothermal model will also be further explored at extreme temperatures.

Author Contributions

Conceptualization, C.Y. and J.Z.; methodology, C.Y. and J.Z.; software, C.Y.; validation, C.Y. and J.Z.; formal analysis, J.Z.; investigation, C.Y. and J.Z.; resources, J.Z., X.W. and H.D.; data curation, C.Y. and J.Z.; writing-original draft preparation, C.Y.; writing-review, J.Z. and X.W.; visualization, X.W. and H.D.; supervision, X.W. and H.D. All authors have read and agreed to the published version of the manuscript.

Funding

This research was funded by the National Natural Science Foundation of China (NSFC, Grant No. 52107230), the Fundamental Research Funds for the Central Universities and the Major State Basic Research Development Program of China (973 Program, Grant No. 2022YFB2502304, Grant No. 2022YFB2502302).

Data Availability Statement

The original data cannot be shared because of confidentiality issues.

Conflicts of Interest

The authors declare no conflict of interest.

References

  1. Zhou, Z.; Liu, Y.; You, M.; Xiong, R.; Zhou, X. Two-stage aging trajectory prediction of LFP lithium-ion battery based on transfer learning with the cycle life prediction. Green Energy Intell. Transp. 2022, 1, 100008. [Google Scholar] [CrossRef]
  2. Zhu, J.G.; Xu, W.; Knapp, M.; Darma, M.S.D.; Mereacre, L.; Su, P.; Hua, W.; Liu-Théato, X.; Dai, H.; Wei, X.; et al. A method to prolong lithium-ion battery life during the full life cycle. Cell Rep. Phys. Sci. 2023, 7, 101464. [Google Scholar] [CrossRef]
  3. Li, S.; Zhang, C.; Du, J.; Cong, X.; Zhang, L.; Jiang, Y.; Wang, L. Fault diagnosis for lithium-ion batteries in electric vehicles based on signal decomposition and two-dimensional feature clustering. Green Energy Intell. Transp. 2022, 1, 100009. [Google Scholar] [CrossRef]
  4. Zhu, J.G.; Darma, M.S.D.; Knapp, M.; Sørensen, D.R.; Heere, M.; Fang, Q.; Wang, X.; Dai, H.; Mereacre, L.; Senyshyn, A.; et al. Investigation of lithium-ion battery degradation mechanisms by combining differential voltage analysis and alternating current impedance. J. Power Sources 2020, 448, 227575. [Google Scholar] [CrossRef]
  5. Wang, X.Y.; Wei, X.Z.; Chen, Q.J.; Zhu, J.G.; Dai, H.F. Lithium-ion battery temperature on-line estimation based on fast impedance calculation. J. Energy Storage 2019, 26, 100952. [Google Scholar] [CrossRef]
  6. Noura, N.; Boulon, L.; Jemei, S. A Review of Battery State of Health Estimation Methods: Hybrid Electric Vehicle Challenges. World Electr. Veh. J. 2020, 11, 66. [Google Scholar] [CrossRef]
  7. Hu, X.S.; Liu, W.X.; Lin, X.K.; Xie, Y. A Comparative Study of Control-Oriented Thermal Models for Cylindrical Li-Ion Batteries. IEEE Trans. Transp. Electrif. 2019, 5, 1237–1253. [Google Scholar] [CrossRef]
  8. Wei, G.; Huang, R.; Zhang, G.; Jiang, B.; Zhu, J.; Guo, Y.; Han, G.; Wei, X.; Dai, H. A comprehensive insight into the thermal runaway issues in the view of lithium-ion battery intrinsic safety performance and venting gas explosion hazards. Appl. Energy 2023, 349, 121651. [Google Scholar] [CrossRef]
  9. Wang, T.X.; Li, C.L.; Chang, L.; Duan, B.; Zhang, C.H. Thermal behavior analysis of Pouch Lithium ion Battery using distributed electro-thermal model. In Proceedings of the 3rd Conference on Vehicle Control and Intelligence (CVCI), Hefei, China, 21–22 September 2019; pp. 302–306. [Google Scholar]
  10. Sun, T.; Shen, T.; Zheng, Y.; Ren, D.; Zhu, W.; Li, J.; Han, X.; Lu, L.; Ouyang, M. Modeling the inhomogeneous lithium plating in lithium-ion batteries induced by non-uniform temperature distribution. Electrochim. Acta 2022, 425, 140701. [Google Scholar] [CrossRef]
  11. Carter, R.; Kingston, T.A.; Atkinson, R.W.; Parmananda, M.; Dubarry, M.; Fear, C.; Mukherjee, P.P.; Love, C.T. Directionality of thermal gradients in lithium-ion batteries dictates diverging degradation modes. Cell Rep. Phys. Sci. 2021, 2, 100351. [Google Scholar] [CrossRef]
  12. Wang, H.S.; Zhu, Y.; Kim, S.C.; Pei, A.; Li, Y.; Boyle, D.T.; Wang, H.; Zhang, Z.; Ye, Y.; Huang, W.; et al. Underpotential lithium plating on graphite anodes caused by temperature heterogeneity. Proc. Natl. Acad. Sci. USA 2020, 117, 29453–29461. [Google Scholar] [CrossRef] [PubMed]
  13. Fleckenstein, M.; Bohlen, O.; Roscher, M.A.; Baker, B. Current density and state of charge inhomogeneities in Li-ion battery cells with LiFePO4 as cathode material due to temperature gradients. J. Power Sources 2011, 196, 4769–4778. [Google Scholar] [CrossRef]
  14. Tian, Y.; She, Y.; Wu, J.F.; Chai, M.; Huang, L.S. Thermal runaway propagation characteristics of lithium-ion batteries with a non-uniform state of charge distribution. J. Solid State Electrochem. 2023, 27, 2185–2197. [Google Scholar]
  15. Liu, W.X.; Hu, X.; Lin, X.; Yang, X.-G.; Song, Z.; Foley, A.M.; Couture, J. Toward high-accuracy and high-efficiency battery electrothermal modeling: A general approach to tackling modeling errors. Etransportation 2022, 14, 100195. [Google Scholar] [CrossRef]
  16. Liu, H.Q.; Wei, Z.B.; He, W.D.; Zhao, J.Y. Thermal issues about Li-ion batteries and recent progress in battery thermal management system: A review. Energy Convers. Manag. 2017, 150, 304–330. [Google Scholar] [CrossRef]
  17. Bernardi, D.; Pawlikowski, E.; Newman, J. A general energy-balance for battery systems. J. Electrochem. Soc. 1985, 132, 5–12. [Google Scholar] [CrossRef]
  18. Sattarzadeh, S.; Roy, T.; Dey, S. Real-Time Estimation of 2-D Temperature Distribution in Lithium-Ion Pouch Cells. IEEE Trans. Transp. Electrif. 2021, 7, 2249–2259. [Google Scholar] [CrossRef]
  19. Forgez, C.; Do, D.V.; Friedrich, G.; Morcrette, M.; Delacourt, C. Thermal modeling of a cylindrical LiFePO4/graphite lithium-ion battery. J. Power Sources 2010, 195, 2961–2968. [Google Scholar] [CrossRef]
  20. Soltani, M.; De Sutter, L.; Ronsmans, J.; van Mierlo, J. A high current electro-thermal model for lithium-ion capacitor technology in a wide temperature range. J. Energy Storage 2020, 31, 101624. [Google Scholar] [CrossRef]
  21. Xie, Y.; He, X.-J.; Hu, X.-S.; Li, W.; Zhang, Y.-J.; Liu, B.; Sun, Y.-T. An improved resistance-based thermal model for a pouch lithium-ion battery considering heat generation of posts. Appl. Therm. Eng. 2020, 164, 114455. [Google Scholar] [CrossRef]
  22. Richardson, R.R.; Howey, D.A. Sensorless Battery Internal Temperature Estimation Using a Kalman Filter with Impedance Measurement. IEEE Trans. Sustain. Energy 2015, 6, 1190–1199. [Google Scholar] [CrossRef]
  23. Hatchard, T.D.; MacNeil, D.D.; Stevens, D.A.; Christensen, L.; Dahn, J.R. Importance of heat transfer by radiation in Li-ion batteries during thermal abuse. Electrochem. Solid State Lett. 2000, 3, 305–308. [Google Scholar] [CrossRef]
  24. Hu, X.S.; Feng, F.; Liu, K.L.; Zhang, L.; Xie, J.L.; Liu, B. State estimation for advanced battery management: Key challenges and future trends. Renew. Sustain. Energy Rev. 2019, 114, 109334. [Google Scholar] [CrossRef]
  25. Lin, X.F.; Perez, H.E.; Siegel, J.B.; Stefanopoulou, A.G.; Li, Y.; Anderson, R.D.; Ding, Y.; Castanier, M.P. Online Parameterization of Lumped Thermal Dynamics in Cylindrical Lithium Ion Batteries for Core Temperature Estimation and Health Monitoring. IEEE Trans. Control Syst. Technol. 2013, 21, 1745–1755. [Google Scholar]
  26. Dai, H.F.; Zhu, L.T.; Zhu, J.G.; Wei, X.Z.; Sun, Z.C. Adaptive Kalman filtering based internal temperature estimation with an equivalent electrical network thermal model for hard-cased batteries. J. Power Sources 2015, 293, 351–365. [Google Scholar] [CrossRef]
  27. .Kim, Y.; Siegel, J.B.; Stefanopoulou, A.G. A Computationally Efficient Thermal Model of Cylindrical Battery Cells for the Estimation of Radially Distributed Temperatures. In Proceedings of the American Control Conference (ACC), Washington, DC, USA, 17–19 June 2013; pp. 698–703. [Google Scholar]
  28. Mahamud, R.; Park, C. Spatial-resolution, lumped-capacitance thermal model for cylindrical Li-ion batteries under high Biot number conditions. Appl. Math. Model. 2013, 37, 2787–2801. [Google Scholar] [CrossRef]
  29. Richardson, R.R.; Zhao, S.; Howey, D.A. On-board monitoring of 2-D spatially-resolved temperatures in cylindrical lithium-ion batteries: Part I. Low-order thermal modelling. J. Power Sources 2016, 326, 377–388. [Google Scholar] [CrossRef]
  30. Richardson, R.R.; Ireland, P.T.; Howey, D.A. Battery internal temperature estimation by combined impedance and surface temperature measurement. J. Power Sources 2014, 265, 254–261. [Google Scholar] [CrossRef]
  31. Jeon, D.H. Numerical modeling of lithium ion battery for predicting thermal behavior in a cylindrical cell. Curr. Appl. Phys. 2014, 14, 196–205. [Google Scholar] [CrossRef]
  32. Shah, K.; McKee, C.; Chalise, D.; Jain, A. Experimental and numerical investigation of core cooling of Li-ion cells using heat pipes. Energy 2016, 113, 852–860. [Google Scholar] [CrossRef]
  33. Osmani, K.; Alkhedher, M.; Ramadan, M.; Choi, D.S.; Li, L.K.; Doranehgard, M.H.; Olabi, A.-G. Recent progress in the thermal management of lithium-ion batteries. J. Clean. Prod. 2023, 389, 136024. [Google Scholar] [CrossRef]
  34. Ghaeminezhad, N.; Wang, Z.S.; Ouyang, Q. A Review on lithium-ion battery thermal management system techniques: A control-oriented analysis. Appl. Therm. Eng. 2023, 219, 119497. [Google Scholar] [CrossRef]
  35. Christophersen, J.P. Battery Test Manual for Electric Vehicles, Revision 3; U.S. Department of Energy: Washington, DC, USA, 2015. [Google Scholar]
  36. Grandjean, T.; Barai, A.; Hosseinzadeh, E.; Guo, Y.; McGordon, A.; Marco, J. Large format lithium ion pouch cell full thermal characterisation for improved electric vehicle thermal management. J. Power Sources 2017, 359, 215–225. [Google Scholar] [CrossRef]
  37. Yu, Y.F.; Vergori, E.; Worwood, D.; Tripathy, Y.; Guo, Y.; Somá, A.; Greenwood, D.; Marco, J. Distributed thermal monitoring of lithium ion batteries with optical fibre sensors. J. Energy Storage 2021, 39, 102560. [Google Scholar] [CrossRef]
  38. Liu, S.Z.; Zhang, T.; Zhang, C.; Yuan, L.H.; Xu, Z.C.; Jin, L. Non-uniform heat generation model of pouch lithium-ion battery based on regional heat generation rate. J. Energy Storage 2023, 63, 107074. [Google Scholar] [CrossRef]
  39. Sheng, L.; Zhang, Z.; Su, L.; Zhang, H.; Zhang, H.; Li, K.; Fang, Y.; Ye, W. Experimental and numerical approach for analyzing thermal behaviors of a prismatic hard-cased lithium-ion battery. J. Energy Storage 2021, 35, 102313. [Google Scholar] [CrossRef]
  40. Hu, X.S.; Liu, W.X.; Lin, X.K.; Xie, Y.; Foley, A.M.; Hu, L. A Control-Oriented Electrothermal Model for Pouch-Type Electric Vehicle Batteries. IEEE Trans. Power Electron. 2021, 36, 5530–5544. [Google Scholar] [CrossRef]
  41. Goutam, S.; Nikolian, A.; Jaguemont, J.; Smekens, J.; Omar, N.; Bossche, P.V.D.; Van Mierlo, J. Three-dimensional electro-thermal model of li-ion pouch cell: Analysis and comparison of cell design factors and model assumptions. Appl. Therm. Eng. 2017, 126, 796–808. [Google Scholar] [CrossRef]
  42. Xiao, R.X.; Hu, Y.W.; Jia, X.G.; Chen, G.S. A novel estimation of state of charge for the lithium-ion battery in electric vehicle without open circuit voltage experiment. Energy 2022, 243, 123072. [Google Scholar] [CrossRef]
  43. Li, H.X.; Qi, C.K. Modeling of distributed parameter systems for applications—A synthesized review from time-space separation. J. Process Control 2010, 20, 891–901. [Google Scholar] [CrossRef]
  44. Sun, D.; Chen, X.K. Adaptive Parameter Identification Method and State of Charge Estimation of Lithium Ion Battery. In Proceedings of the 17th IEEE International Conference on Electrical Machines and Systems (ICEMS), Hangzhou, China, 22–25 October 2014; pp. 855–860. [Google Scholar]
  45. Wang, Y.; Li, L. Li-ion battery dynamics model parameter estimation using datasheets and particle swarm optimization. Int. J. Energy Res. 2016, 40, 1050–1061. [Google Scholar] [CrossRef]
Figure 1. Schematic of thermocouple placements (Mp and Mn represent measurement points at the positive and negative tabs, respectively. Mcp and Mcn represent measurement points at the main battery body that are close to the positive and negative tabs, respectively. Mc represents measurement point at the center of the main battery body.).
Wevj 14 00271 g001
Figure 2. Connection schematic of the battery experimental platform.
Wevj 14 00271 g002
Figure 3. Thermal responses of the pouch-type battery under FUDS testing profile at various ambient temperatures. (a) 25 °C. (b) 5 °C. (c) −10 °C. (Note that the legends in the in the (ac) can be shared.)
Wevj 14 00271 g003
Figure 4. Thermal responses of the pouch-type battery under NEDC testing profile at various ambient temperatures. (a) 25 °C. (b) 5 °C. (c) −10 °C. (Note that the legends in the in the (ac) can be shared.)
Wevj 14 00271 g004
Figure 5. Schematic of the electrothermal model for large-format Li-ion batteries.
Wevj 14 00271 g005
Figure 6. Relative proportion of the reversible heat at various test scenarios.
Wevj 14 00271 g006
Figure 7. Electrical model parameters with respect to temperature and SOC: (a) OCV. (b) Polarization capacitance. (c) Ohmic resistance. (d) Polarization resistance.
Wevj 14 00271 g007
Figure 8. Heat generation rate at the measurement points Mcp, Mc and Mcn under 1 C-rate constant current testing profile at various ambient temperatures.
Wevj 14 00271 g008
Figure 9. Comparison of the temperature prediction accuracy of the thermal models with and without incorporation of the thermal interplay at various ambient temperatures.
Wevj 14 00271 g009
Figure 10. Comparison of the resistance change rate at measurement points Mp and Mc. (a) Under NEDC. (b) Under FUDS. (c) Histograms of the average resistance change rate at two measurement points.
Wevj 14 00271 g010
Figure 11. Sensitivity analysis results of the electrothermal model to key parameters.
Wevj 14 00271 g011
Table 1. Overview of temperature distribution of large-format Li-ion batteries under various ambient temperatures.
Battery TypeSchematic of Cell Geometries and Temperature AcquisitionTest ScenarioTemperature DistributionRef.
20 Ah pouch-type laminated Li-ion iron phosphate (LiFePO4)/graphite batteryWevj 14 00271 i0012C-CCD
FUDS
NEDC
25 °C: the highest temperature of the battery occurs at measurement point #1 (positive tab).
−15 °C: the highest temperature of the battery occurs at measurement point #5.
[15]
20 Ah pouch-type cell with LiC6 negative electrode and LiFePO4 positive electrodeWevj 14 00271 i002Constant current10 C-rate current at 40 °C and 50 °C: the temperature of measurement point #1 is the highest.
Other C-rates and temperatures: the highest temperature occurs at measurement points #6 and #13 (the center of the cell).
[36]
5Ah pouch-type Nickel Manganese Cobalt (NCM)/graphite batteryWevj 14 00271 i003Constant current25 °C: the hottest surface temperature of the cell is primarily near the positive side and region 2.
10 °C: the hottest region is primarily region 4.
[37]
3.435 Ah Lithium Cobalt Oxide (LiCoO2) pouch-type batteryWevj 14 00271 i004Constant current15 °C and 25 °C: the highest temperature of the cell occurs at measurement point #6.
35 °C and 45 °C: the highest temperature of the cell occurs at measurement point #2.
[38]
8 Ah prismatic hard-cased LiFePO4/graphite cellWevj 14 00271 i005Constant current and numerical simulationThe highest temperature occurs at the bottom of the battery at low ambient temperatures and low C-rates, but that gradually moves to the region near the tabs as the C-rate increases at normal temperatures[39]
Table 2. Identification results of the lumped-mass thermal sub-models for two tabs under FUDS at various temperatures.
Test ScenarioTab PositionEquivalent Ohmic Resistance (ohm)Equivalent Convection Coefficient (W·m−2·K−1)Heat Transfer Coefficient (W·m−2·K−1)
25 °CPositive tab8.70 × 10−5 0.8523956.6317
Negative tab2.71 × 10−53.52733074.8912
5 °CPositive tab2.19 × 10−52.3046681.8795
Negative tab4.90 × 10−52.19501617.2398
−10 °CPositive tab2.71 × 10−53.94251854.8619
Negative tab2.25 × 10−53.27002033.9228
Table 3. Identification results for the main battery body with the consideration of thermal interplay at 5 °C.
Equivalent   Coefficient   μ (J·m−3·K−1)Thermal Conductivity (W·m−2·K−1)Convection Coefficient (W·m−2·K−1) Adjustment   Parameter   β
1.42 × 1050.60602.98260.0395
Table 4. Identification results for the main battery body without the consideration of thermal interplay at 5 °C.
Equivalent   Coefficient   μ (J·m−3·K−1)Thermal Conductivity (W·m−2·K−1)Convection Coefficient (W·m−2·K−1) Adjustment   Parameter   β
1.42 × 1050.66593.18730.0419
Table 5. Comparison of the maximum temperature rise at measurement points Mp and Mc under various dynamic driving tests at two temperatures.
Test ScenarioAmbient TemperatureMeasurement Point MpMeasurement Point Mc
NEDC5 °C4.48 °C2.46 °C
−10 °C3.50 °C4.62 °C
FUDS5 °C4.05 °C3.13 °C
−10 °C4.54 °C4.85 °C
Disclaimer/Publisher’s Note: The statements, opinions and data contained in all publications are solely those of the individual author(s) and contributor(s) and not of MDPI and/or the editor(s). MDPI and/or the editor(s) disclaim responsibility for any injury to people or property resulting from any ideas, methods, instructions or products referred to in the content.

