
Profitability Evaluation of Vehicle-to-Grid-Enabled Frequency Containment Reserve Services into the Business Models of the Core Participants of Electric Vehicle Charging Business Ecosystem

 ,
,  , , ,
, , ,
Abstract
:1. Introduction
1.1. Context
1.2. Literature Overview
1.2.1. V2G Technology
1.2.2. V2G-Enabled Flexibility Services and EV Charging Business Ecosystem
1.2.3. Grid-Balancing Services
1.3. Contribution
2. Methods
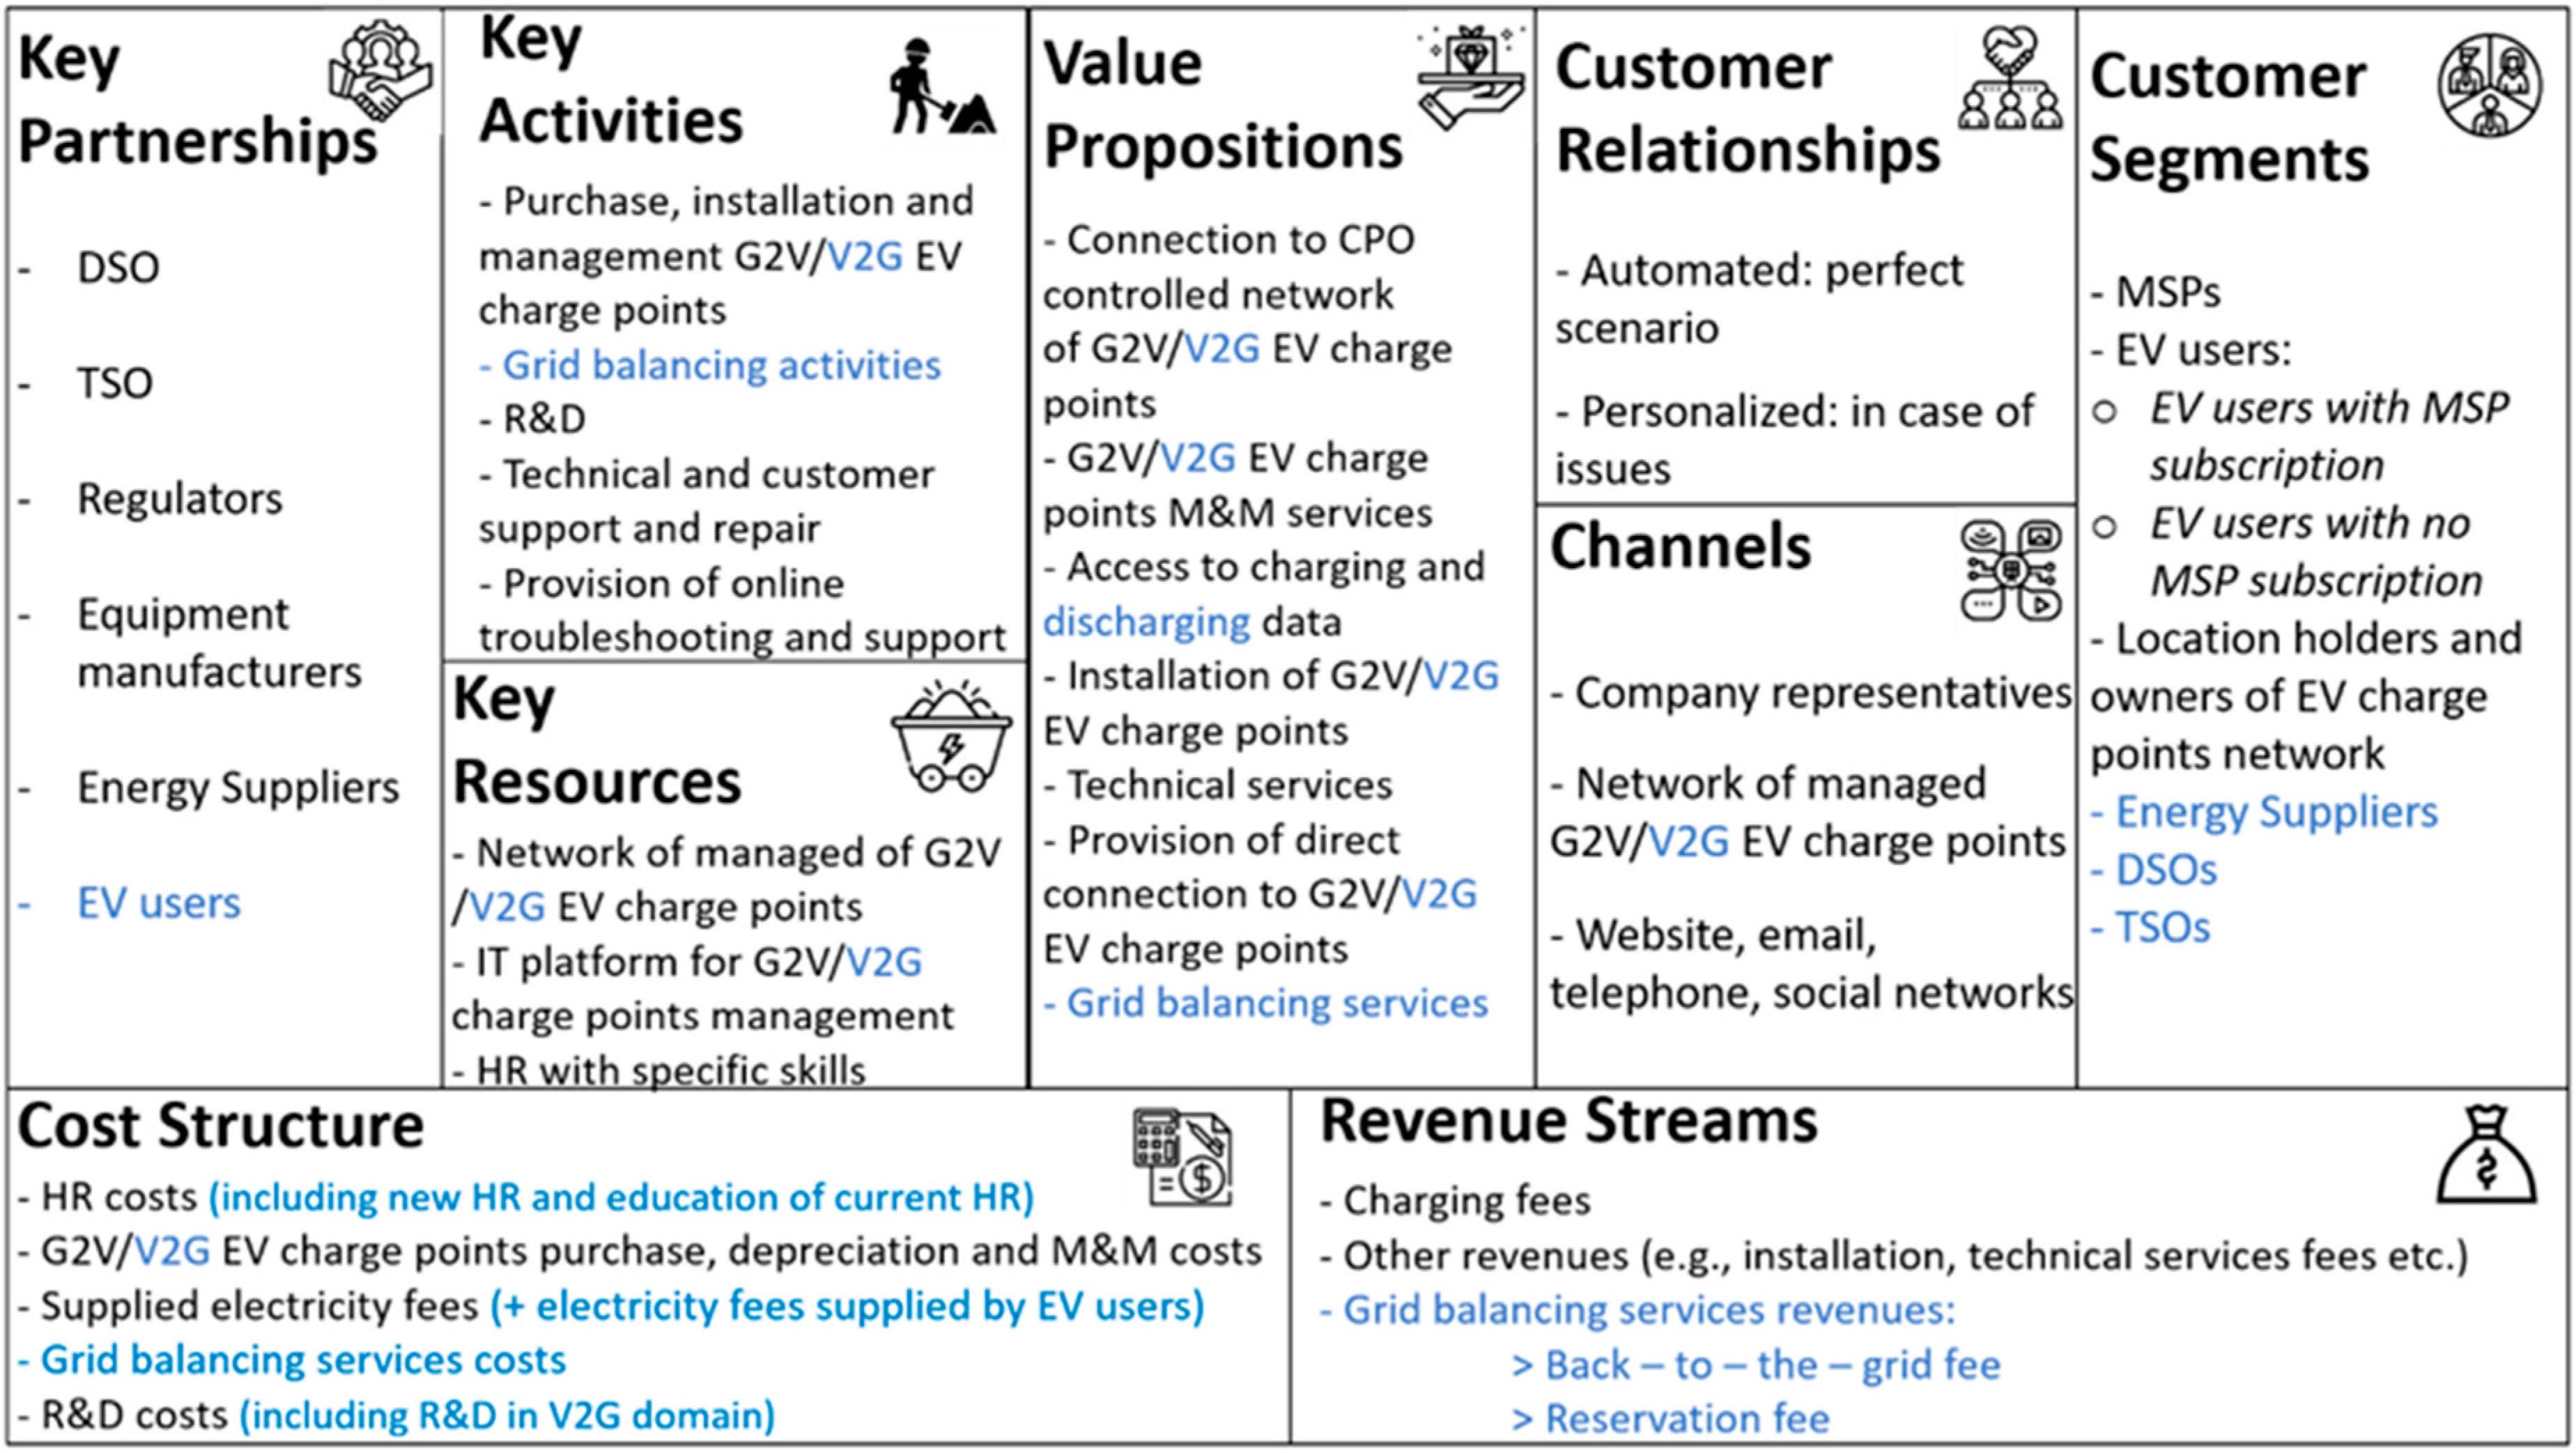
2.1. V2G-Enabled FCR Services into the Financial Perspective of the Business Model
- TF: total fee received from the charging activities on the EVSE network.
- OR: other revenues generated by side activities not directly related to the EV charging (e.g., advertisement, technical fees, etc.).
- CInfrastructure: depreciation, management and maintenance costs of EVSE infrastructure.
- CElectricity: electricity costs paid to the energy suppliers.
- CMP: costs for accessing the common interoperable marketplace for EV charging business ecosystem.
- CHR: costs related to the human resources.
- COther: other additional costs, not represented by the previous categories.
- RFCR: revenues generated through FCR flexibility services
2.2. Profitability Evaluation
2.3. Sensitivity Analysis
2.4. Values of the Relevant Factors
3. Results
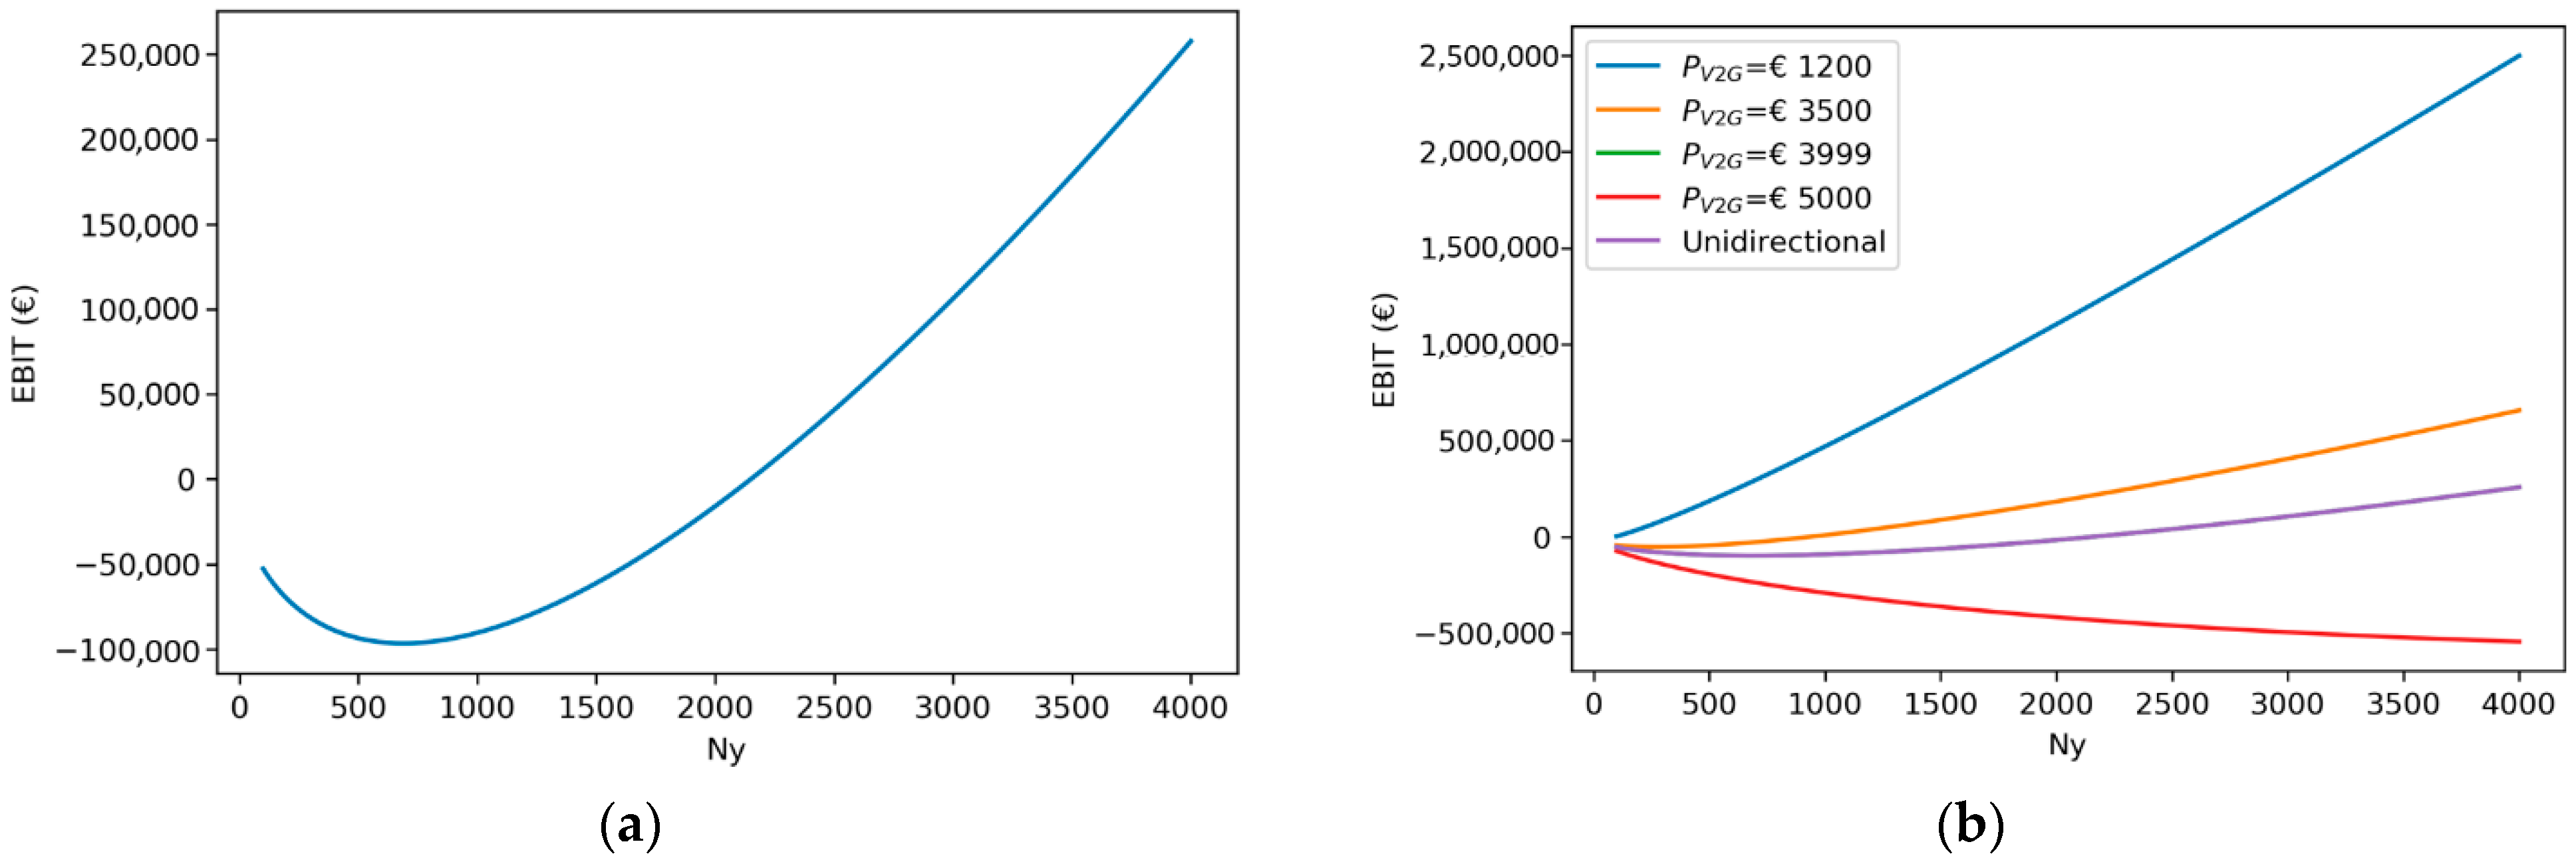
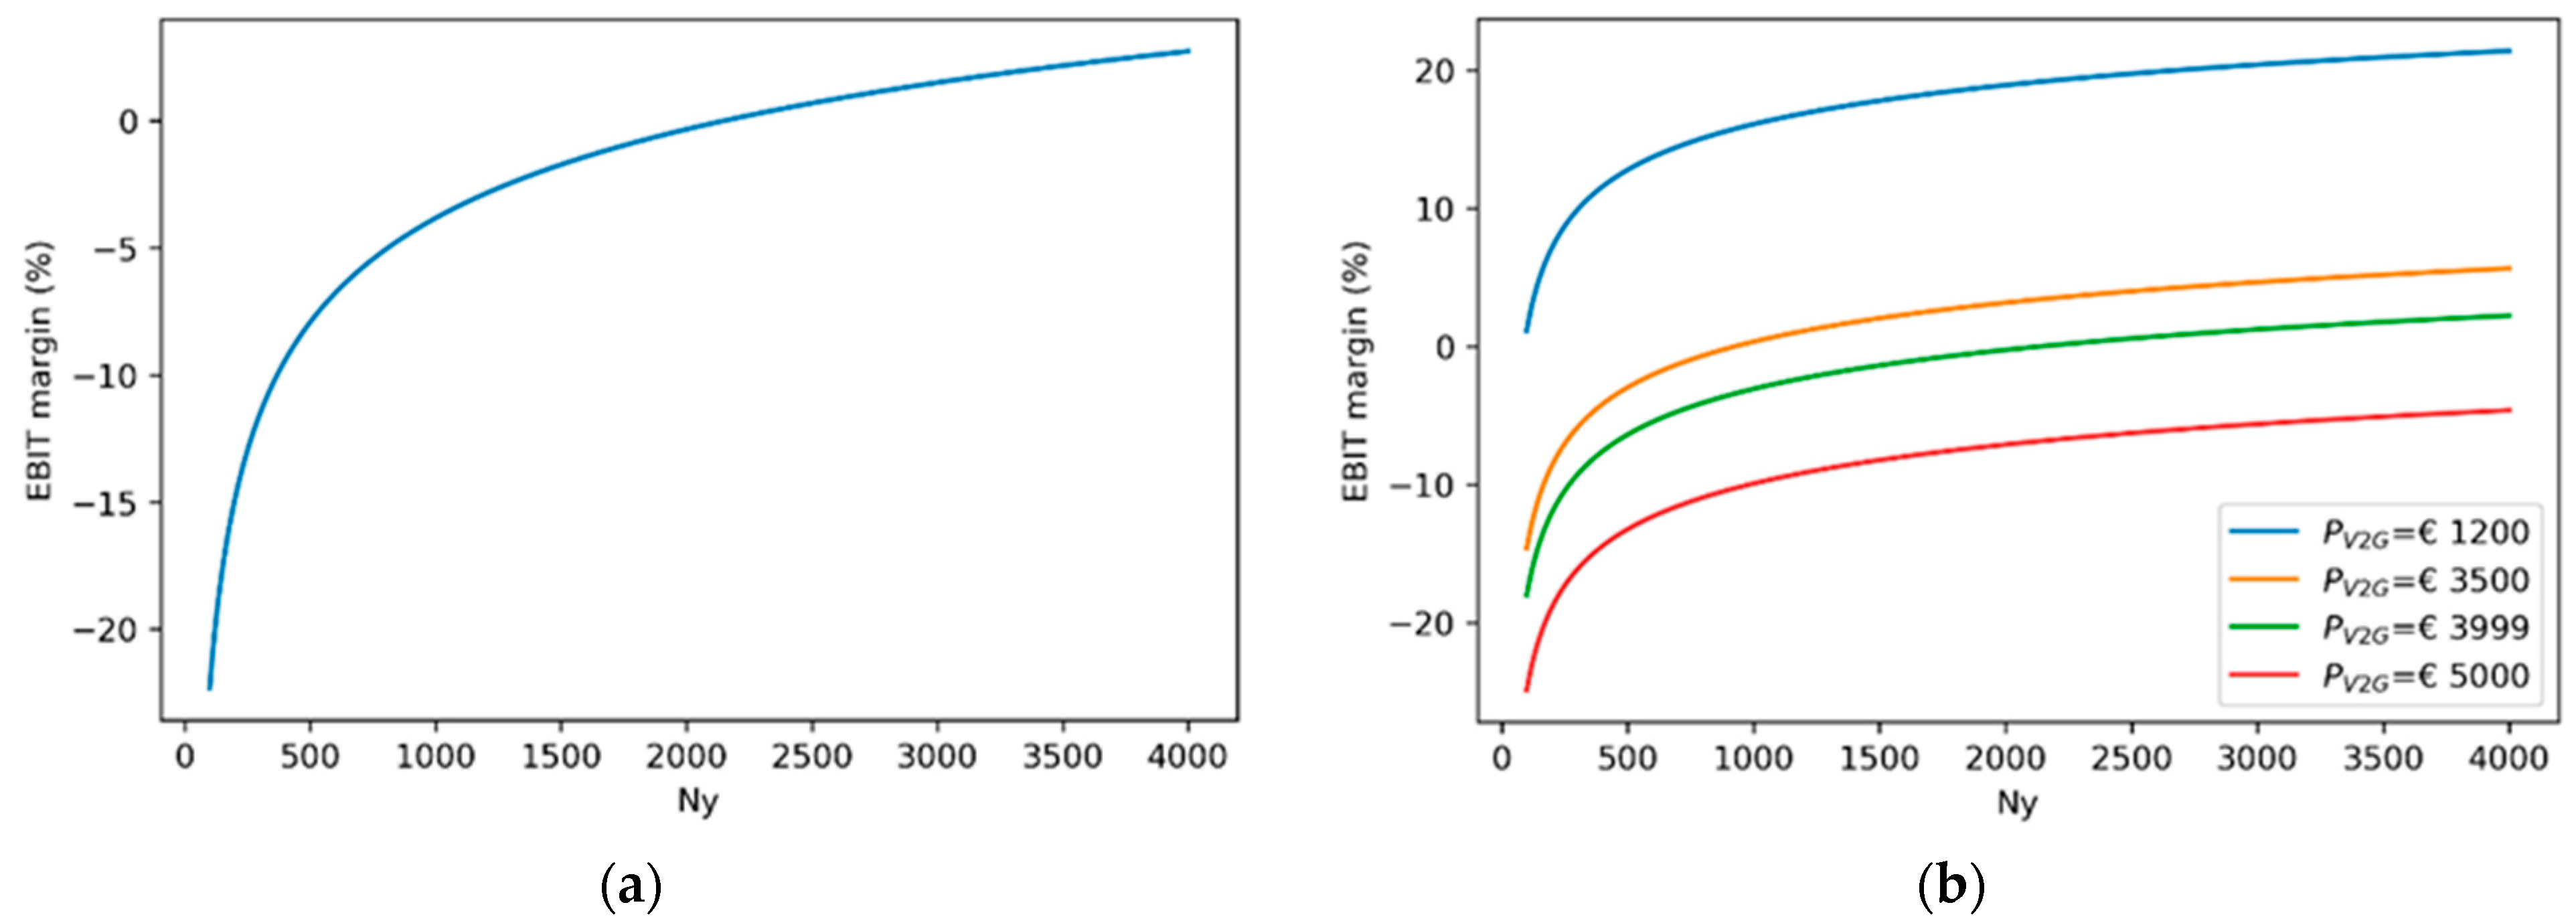
3.1. EBIT and EBIT Margin
3.2. EBITDA and EBITDA Margin
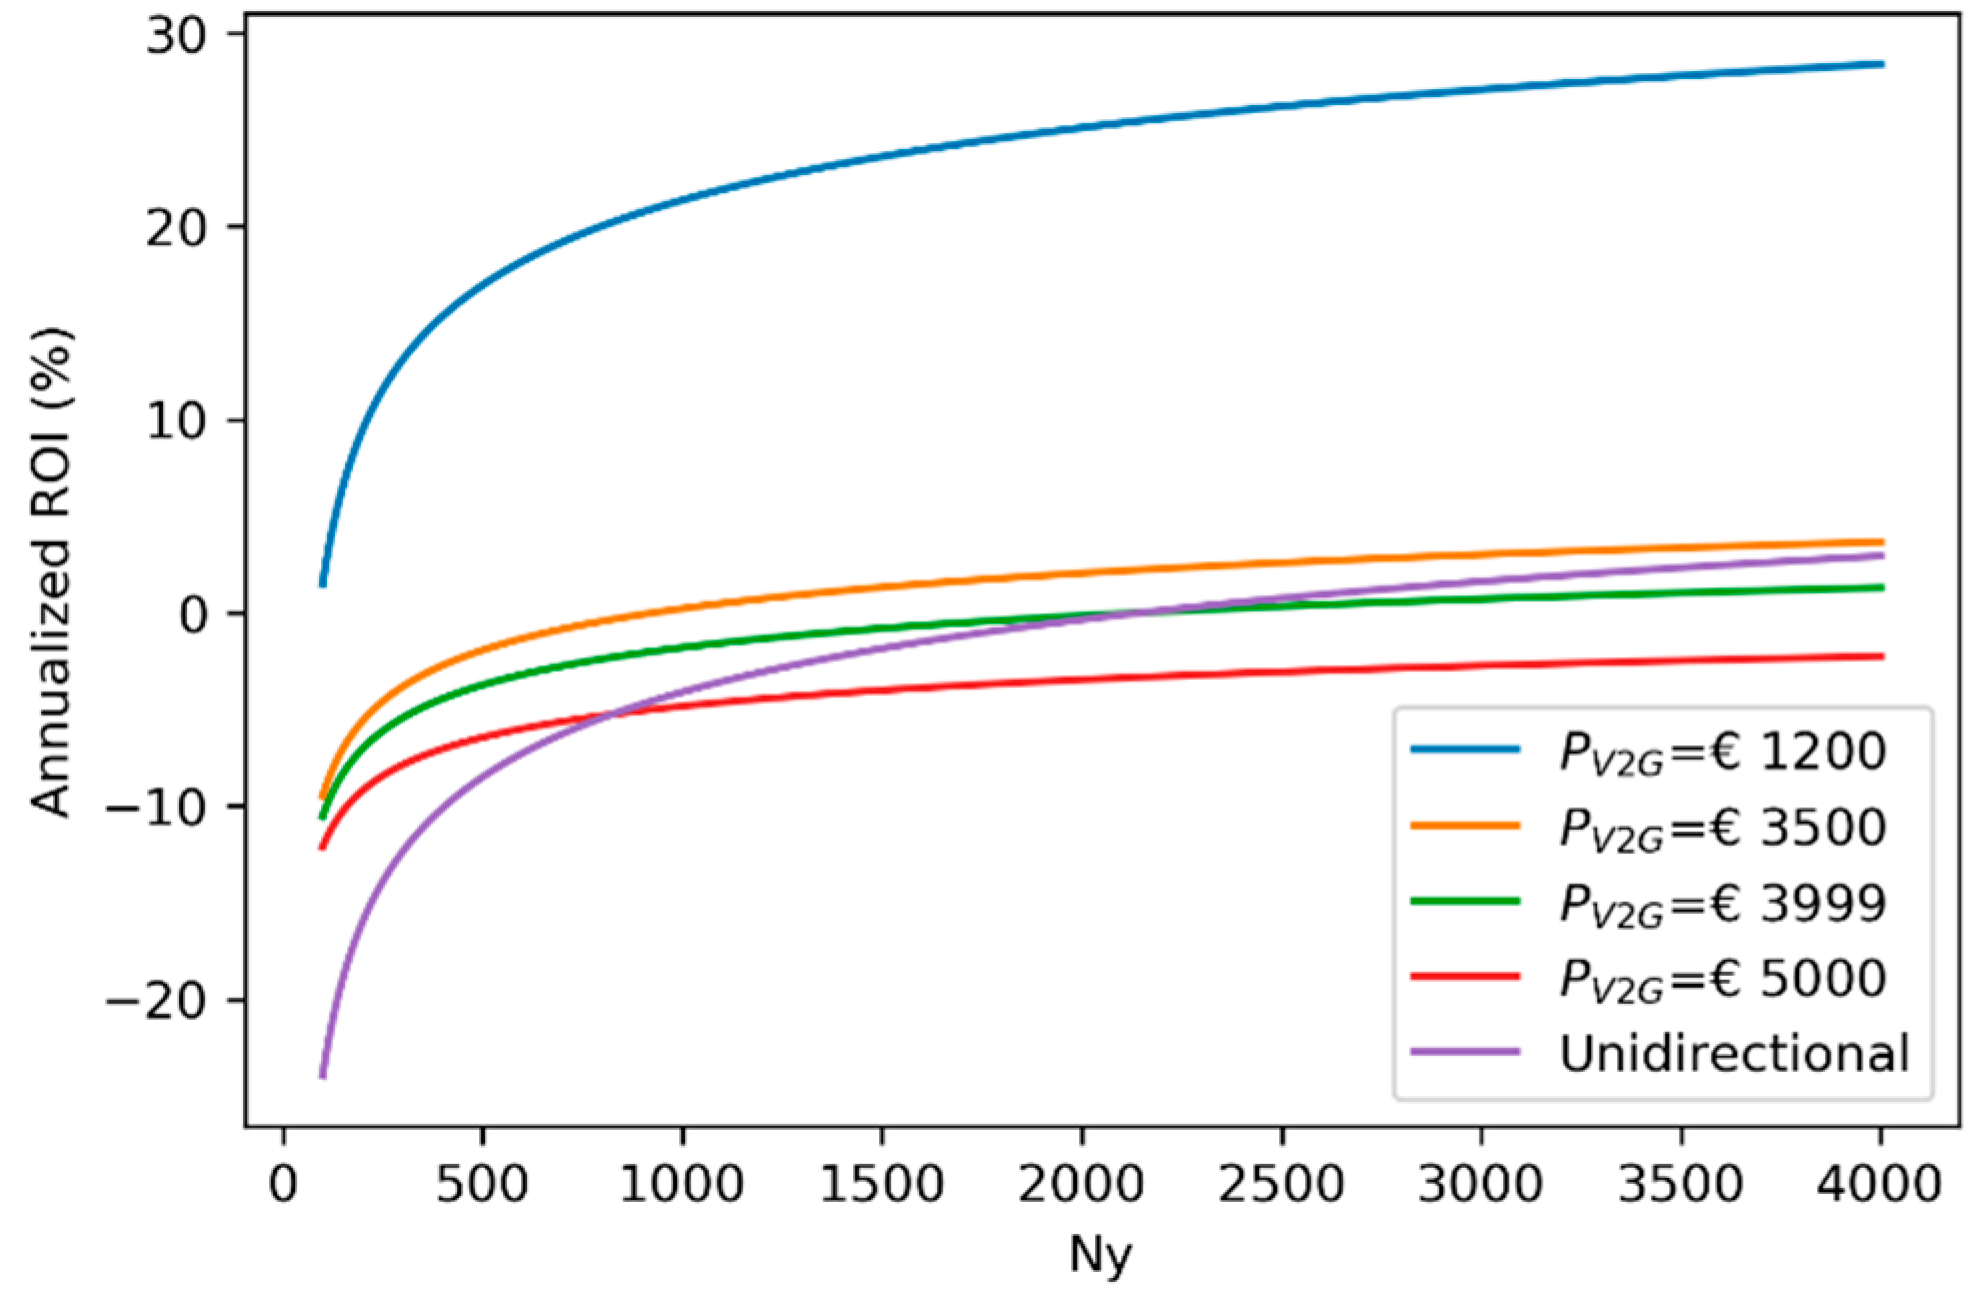
3.3. ROI
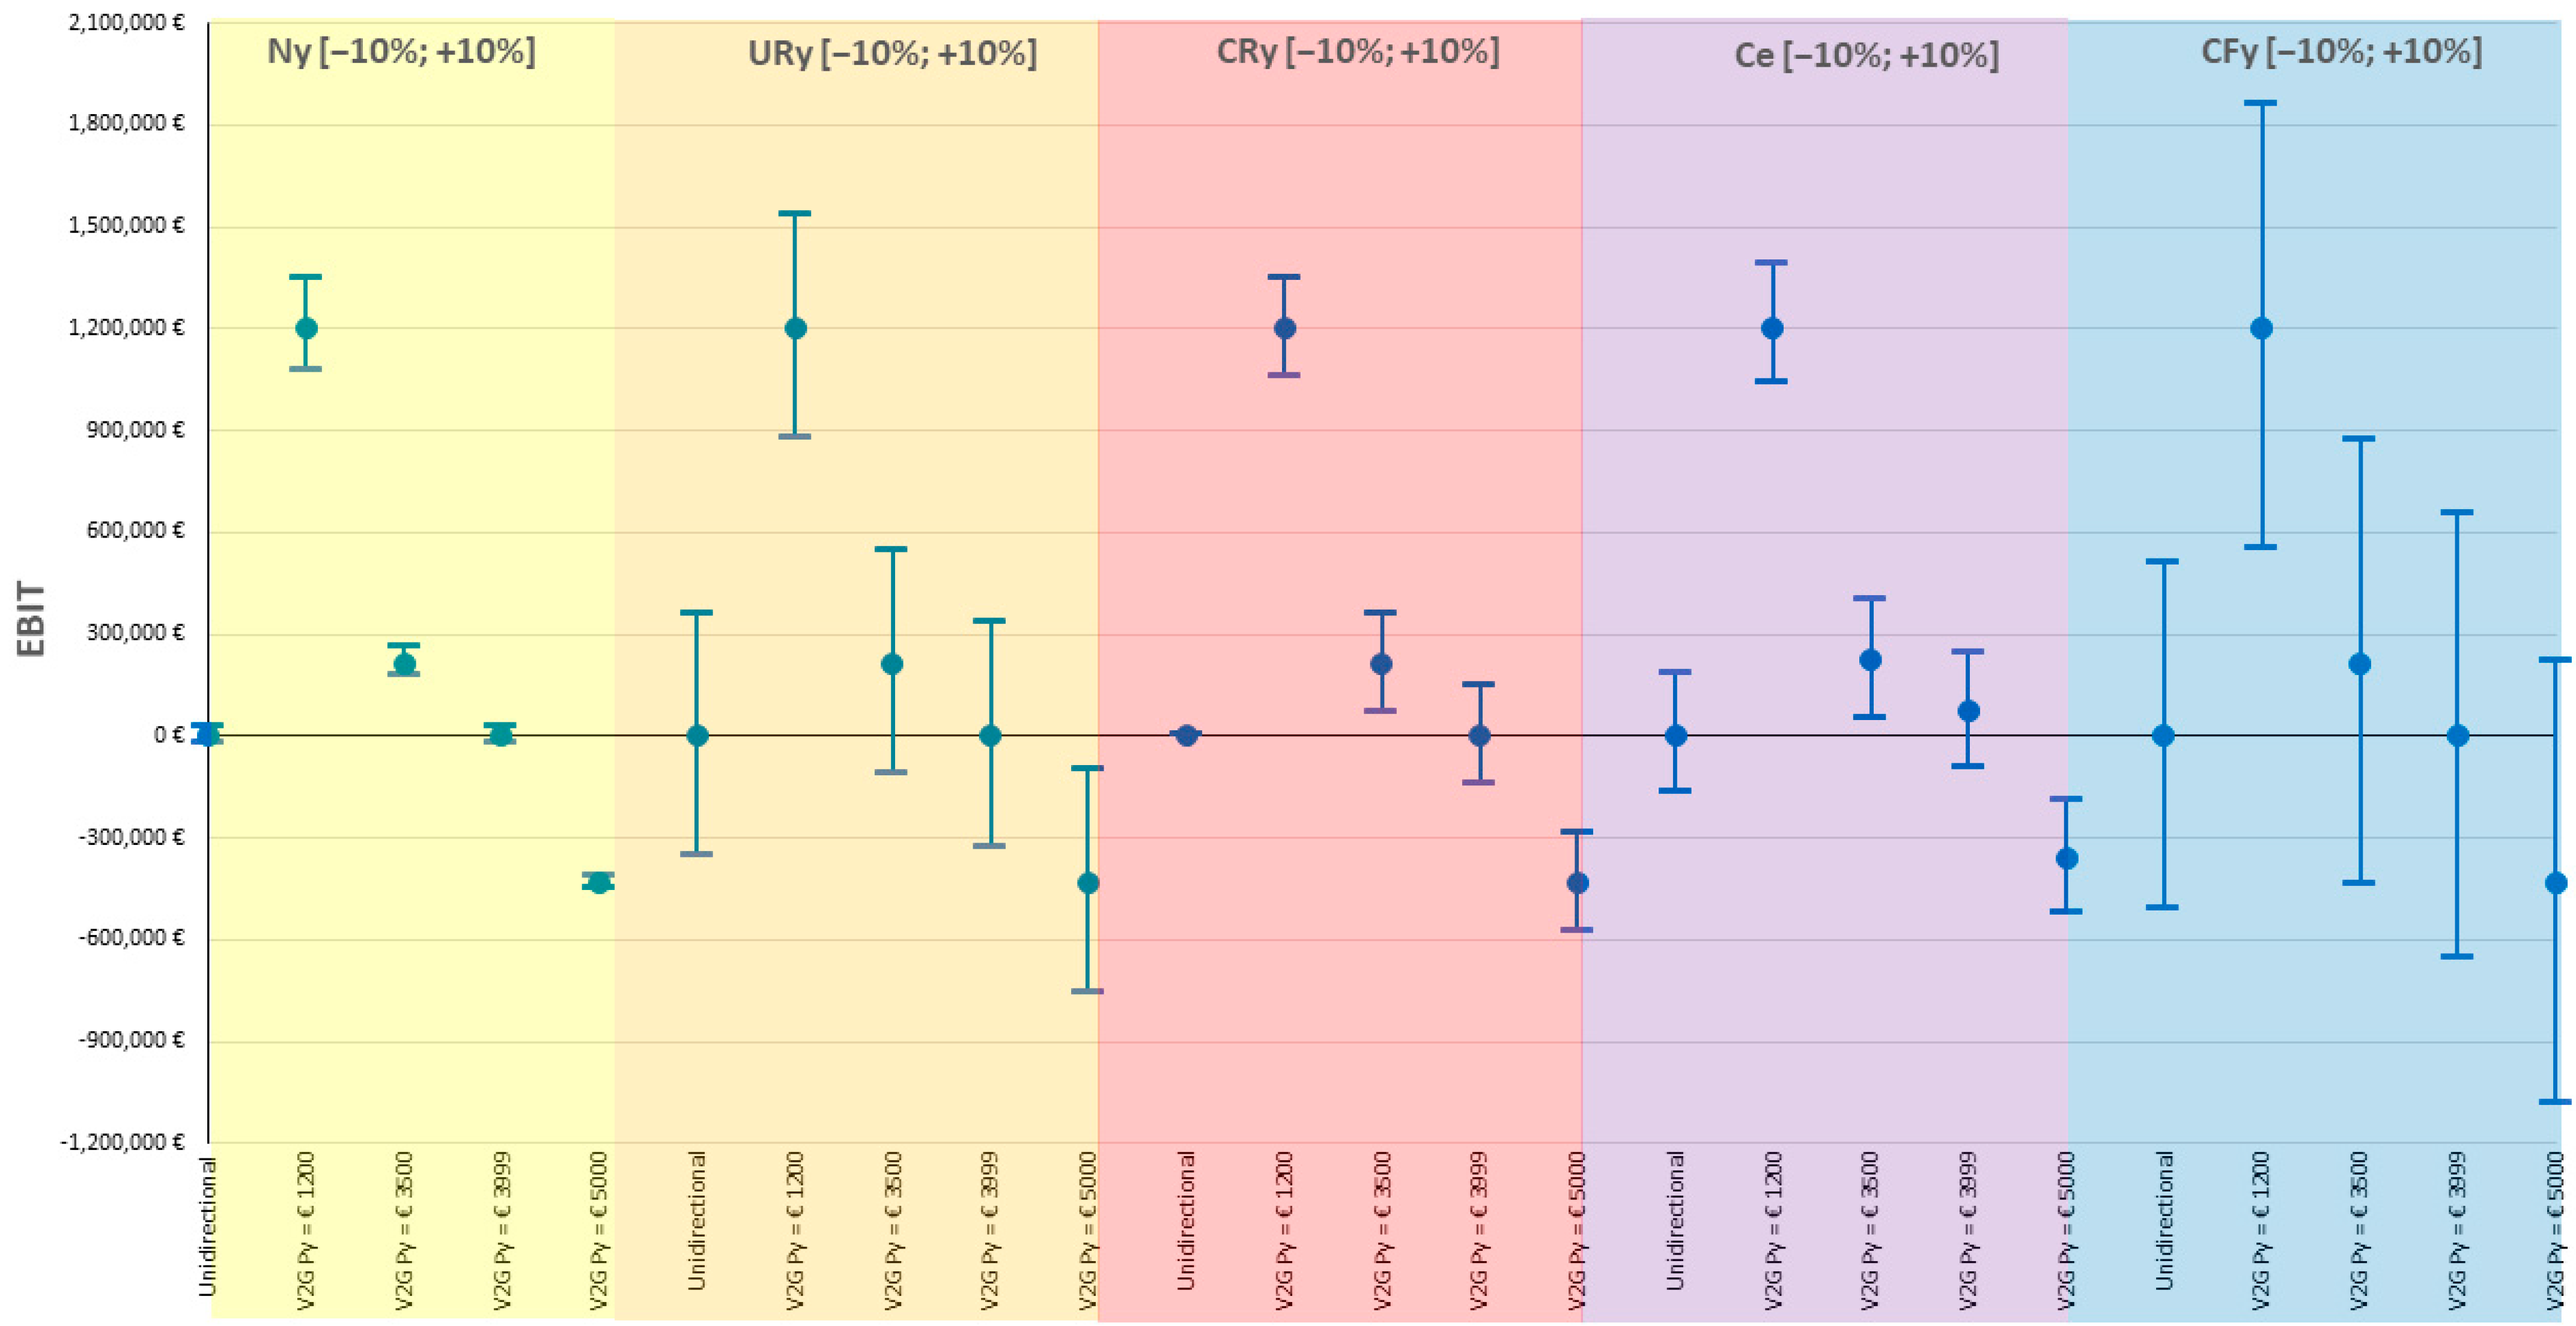
3.4. Sensitivity Analysis
4. Discussion
5. Conclusions
Author Contributions
Funding
Data Availability Statement
Conflicts of Interest
Nomenclature
| Abbreviations | ||
| Abbreviation | Definition | |
| aFRR | Automatic frequency restoration reserve | |
| BSP | Balancing service provider | |
| CPO | Charge point operator | |
| CREG | Commission for electricity and gas regulation | |
| EBIT | Earnings before interests and taxes | |
| EBITDA | Earnings before interests and taxes depreciation and amortization | |
| EV | Electric vehicle | |
| EVSE | Electric vehicle supply equipment | |
| FCR | Frequency regulation reserve | |
| ICE | Internal combustion engine | |
| mFRR | Manual frequency restoration reserve | |
| ROI | Return on investment | |
| TSO | Transmission system operator | |
| V2G | Vehicle-to-grid | |
| Variables | ||
| Symbol | Variable | Unit |
| y | EVSE type | / |
| Ky | EVSE power level | kW |
| Py | EVSE price | € |
| Iy | EVSE installation cost | € |
| CFy | Charging fee | €/kWh |
| T | Maximum yearly availability time | hours |
| MCy | Maximum yearly charging capacity | kWh/year |
| CRy | EVSE connection rate | % |
| URy | EVSE charging usage rate | % |
| CElectricity | Electricity price | €/kWh |
| FCRBid | Average FCR capacity bid | €/MW/h |
| Ly | Useful lifetime | years |
| Sy | Salvage value | % |
| CHR | HR cost | € |
| CMP | Cost of accessing the marketplace | € |
| C Other | Miscellaneous costs | € |
| CM&M | Management and maintenance costs | € |
| Ny | Number of EVSE | Units |
| RFCR | Revenues generated through FCR flexibility services | € |
| TF | Total fee received from the charging activities on the EVSE network | € |
| OR | Other revenues generated by side activities not directly related to the EV charging (e.g., advertisement, technical fees, etc.). | € |
References
- Lauinger, D.; Vuille, F.; Kuhn, D. A Review of the State of Research on Vehicle-to-Grid (V2G): Progress and Barriers to Deployment. In Proceedings of the European Battery, Hybrid and Fuel Cell Electric Vehicle Congress, Geneva, Switzerland, 16 March 2017. [Google Scholar]
- Gunkel, P.A.; Bergaentzlé, C.; Græsted Jensen, I.; Scheller, F. From Passive to Active: Flexibility from Electric Vehicles in the Context of Transmission System Development. Appl. Energy 2020, 277, 115526. [Google Scholar] [CrossRef]
- Gonzalez Venegas, F.; Petit, M.; Perez, Y. Active Integration of Electric Vehicles into Distribution Grids: Barriers and Frameworks for Flexibility Services. Renew. Sustain. Energy Rev. 2021, 145, 111060. [Google Scholar] [CrossRef]
- Zhou, C.; Xiang, Y.; Huang, Y.; Wei, X.; Liu, Y.; Liu, J. Economic Analysis of Auxiliary Service by V2G: City Comparison Cases. Energy Rep. 2020, 6, 509–514. [Google Scholar] [CrossRef]
- Ali, H.; Hussain, S.; Khan, H.A.; Arshad, N.; Khan, I.A. Economic and Environmental Impact of Vehicle-to-Grid (V2G) Integration in an Intermittent Utility Grid. In Proceedings of the 2020 2nd International Conference on Smart Power and Internet Energy Systems, Bangkok, Thailand, 15–18 September 2020. [Google Scholar]
- Borne, O. Vehicle-to-Grid and Flexibility for Electricity Systems: From Technical Solutions to Design of Business Models; Université Paris Saclay: Paris, France, 2019. [Google Scholar]
- Knezović, K.; Marinelli, M.; Codani, P.; Perez, Y. Distribution Grid Services and Flexibility Provision by Electric Vehicles: A Review of Options. In Proceedings of the Universities Power Engineering Conference, Stoke on Trent, UK, 1–4 September 2015. [Google Scholar]
- Pearre, N.S.; Ribberink, H. Review of Research on V2X Technologies, Strategies, and Operations. Renew. Sustain. Energy Rev. 2019, 105, 61–70. [Google Scholar] [CrossRef]
- Goncearuc, A.; Sapountzoglou, N.; de Cauwer, C.; Coosemans, T.; Messagie, M.; Crispeels, T. An Integrative Approach for Business Modelling: Application to the EV Charging Market. J. Bus Res. 2022, 143, 184–200. [Google Scholar] [CrossRef]
- Høj, J.C.M.L.; Juhl, L.T.; Lindegaard, S.B. V2G-An Economic Gamechanger in E-Mobility? World Electr. Veh. J. 2018, 9, 35. [Google Scholar] [CrossRef] [Green Version]
- Sovacool, B.K.; Noel, L.; Axsen, J.; Kempton, W. The Neglected Social Dimensions to a Vehicle-to-Grid (V2G) Transition: A Critical and Systematic Review. Environ. Res. Lett. 2018, 13, 013001. [Google Scholar] [CrossRef]
- Thompson, A.W.; Perez, Y. Vehicle-to-Everything (V2X) Energy Services, Value Streams, and Regulatory Policy Implications. Energy Policy 2020, 137, 111136. [Google Scholar] [CrossRef]
- Wang, X.; Liu, Y.; Qian, W.; Wang, B.; Lu, X.; Zou, K.; González-Santini, N.; Karki, U.; Peng, F.Z.; Chen, C. A 25kW SiC Universal Power Converter Building Block for G2V, V2G, and V2L Applications. In Proceedings of the Proceedings—2018 IEEE International Power Electronics and Application Conference and Exposition, Shenzhen, China, 4–7 November 2018. [Google Scholar]
- Rua, D.; Issicaba, D.; Soares, F.J.; Rocha Almeida, P.M.; Rei, R.J.; Peças Lopes, J.A. Advanced Metering Infrastructure Functionalities for Electric Mobility. In Proceedings of the IEEE PES Innovative Smart Grid Technologies Conference Europe, ISGT Europe, Gothenburg, Sweden, 11–13 October 2010. [Google Scholar]
- Buonomano, A. Building to Vehicle to Building Concept: A Comprehensive Parametric and Sensitivity Analysis for Decision Making Aims. Appl. Energy 2020, 261, 114077. [Google Scholar] [CrossRef]
- Yamagata, Y.; Seya, H.; Kuroda, S. Energy Resilient Smart Community: Sharing Green Electricity Using V2C Technology. Energy Procedia 2014, 61, 84–87. [Google Scholar] [CrossRef]
- Harding, J.; Powell, G. Vehicle-to-Vehicle Communications: Readiness of V2V Technology for Application; National Highway Traffic Safety Administration: Washington, DC, USA, 2014. [Google Scholar]
- Noel, L.; Zarazua de Rubens, G.; Kester, J.; Sovacool, B.K. Navigating Expert Skepticism and Consumer Distrust: Rethinking the Barriers to Vehicle-to-Grid (V2G) in the Nordic Region. Transp. Policy 2019, 76, 67–77. [Google Scholar] [CrossRef]
- Sovacool, B.K.; Kester, J.; Noel, L.; Zarazua de Rubens, G. Actors, Business Models, and Innovation Activity Systems for Vehicle-to-Grid (V2G) Technology: A Comprehensive Review. Renew. Sustain. Energy Rev. 2020, 131, 109963. [Google Scholar] [CrossRef]
- Geske, J.; Schumann, D. Willing to Participate in Vehicle-to-Grid (V2G)? Why Not! Energy Policy 2018, 120, 392–401. [Google Scholar] [CrossRef]
- Elia Becoming a Balancing Service Provider. Available online: https://www.elia.be/en/electricity-market-and-system/system-services/becoming-a-balancing-service-provider (accessed on 31 October 2022).
- Elia Flexible Demand Management Products. Available online: https://www.elia.be/-/media/project/elia/elia-site/electricity-market-and-system---document-library/balancing---balancing-services-and-bsp/2017/2017-brochure-flexible-demand-management-products_en.pdf (accessed on 3 July 2022).
- Elia Towards a Consumercentric and Sustainable Electricity System. Available online: https://www.eliagroup.eu/-/media/project/elia/shared/documents/elia-group/publications/studies-and-reports/20210618_elia_ccmd-white-paper_en.pdf (accessed on 31 October 2022).
- Gerard, H.; Rivero, E.; Six, D. Basic Schemes for TSO-DSO Coordination and Ancillary Services Provision. SmartNet 2016, 1, 12. [Google Scholar]
- Elia FCR Service Design Note. Available online: https://www.elia.be/-/media/project/elia/elia-site/electricity-market-and-system---document-library/balancing---balancing-services-and-bsp/2019/2019-design-note-fcr-for-2020.pdf (accessed on 22 August 2022).
- Smart Energy Europe The SmartEn Map. Available online: https://www.smarten.eu/wp-content/uploads/2018/11/the_smarten_map_2018.pdf (accessed on 20 August 2022).
- Elia Market Facilitation. Available online: https://innovation.eliagroup.eu/innovation-pillars/market-facilitation/ (accessed on 18 August 2022).
- Elia Using Electric Vehicles to Balance the Network. Available online: https://innovation.eliagroup.eu/projects/v2g/ (accessed on 23 August 2022).
- Elia Innovation Incentive 2020–2023 Plan Update. Available online: https://www.creg.be/sites/default/files/assets/Consult/2020/658E69/PRD658E69Annex.pdf (accessed on 18 August 2022).
- Elia Terms and Conditions for Balancing Service Providers for Frequency Containment Reserve (FCR). Available online: https://www.elia.be/-/media/project/elia/elia-site/public-consultations/2020/20200317-tc-bsp-fcrfinal-consulten.pdf (accessed on 15 August 2022).
- Goncearuc, A.; Sapountzoglou, N.; de Cauwer, C.; Coosemans, T.; Messagie, M.; Crispeels, T. Business Model Quantification Framework for the Core Participants of the Ev Charging Market. World Electr. Veh. J. 2021, 12, 229. [Google Scholar] [CrossRef]
- Perisa, A.; Kurnoga, N.; Sopta, M. Multivariate Analysis of Profitability Indicators for Selected Companies of Croatian Market. UTMS J. Econ. 2017, 8, 231–242. [Google Scholar]
- Nissim, D. EBITDA, EBITA, or EBIT? SSRN Electron. J. Columbia Business School. 2017, 17–71. [Google Scholar] [CrossRef]
- Bouwens, J.; de Kok, T.; Verriest, A. The Prevalence and Validity of EBITDA as a Performance Measure. Comptab. Controle Audit. 2019, 25, 55–105. [Google Scholar] [CrossRef]
- Frey, H.C.; Patil, S.R. Identification and Review of Sensitivity Analysis Methods. Risk Anal. 2002, 22, 553–578. [Google Scholar] [CrossRef]
- Saltelli, A.; Aleksankina, K.; Becker, W.; Fennell, P.; Ferretti, F.; Holst, N.; Li, S.; Wu, Q. Why so Many Published Sensitivity Analyses Are False: A Systematic Review of Sensitivity Analysis Practices. Environ. Model. Softw. 2019, 114, 29–39. [Google Scholar] [CrossRef]
- Izvia Bornes de Recharge V2G Entreprise. Available online: https://www.izivia.com/bornes-electriques-lieu-de-travail/bornes-de-recharge-V2G-entreprise (accessed on 21 August 2022).
- Indra Vehicle-to-Grid (V2G) Chargers. Available online: https://www.indra.co.uk/v2g (accessed on 11 August 2022).
- Alfen Alfen Enabling the Energy Transition. Available online: https://alfen.com/sites/default/files/media/documents/Alfen%20Annual%20Report%202021.pdf (accessed on 14 May 2022).
- BlueCorner Laadpalen Onderweg. Available online: https://www.bluecorner.be/laadpalen/onderweg/ (accessed on 23 August 2022).
- Allego What Costs Charging? Available online: https://www.allego.eu/support (accessed on 23 August 2022).
- Eflux Mobility Cards to Charge Your EV. Available online: https://www.e-flux.io/en/e-flux-mobility-cards/ (accessed on 23 August 2022).
- Allego Enabling Electrification. Available online: https://www.allego.eu/-/media/A7ECA09B306A409B99F39CA87292562F.ashx (accessed on 23 August 2022).
- Wolbertus, R.; Kroesen, M.; van den Hoed, R.; Chorus, C. Fully Charged: An Empirical Study into the Factors That Influence Connection Times at EV-Charging Stations. Energy Policy 2018, 123, 1–7. [Google Scholar] [CrossRef] [Green Version]
- Wolbertus, R.; van den Hoed, R.; Maase, S. Benchmarking Charging Infrastructure Utilization. World Electr. Veh. J. 2016, 8, 754. [Google Scholar] [CrossRef]
- Wolbertus, R.; van den Hoed, R. Charging Station Hogging: A Data-Driven Analysis. In Proceedings of the EVS 2017—30th International Electric Vehicle Symposium and Exhibition, Stuttgart, Germany, 9–11 October 2017. [Google Scholar]
- Eurostat Electricity Prices Components for Non-Household Consumers—Annual Data. Available online: https://ec.europa.eu/eurostat/web/energy/data/database (accessed on 23 August 2022).
- CREG Study on the Functioning and Price Evolution of the Belgian Wholesale Electricity Market—Monitoring Report 2020. Available online: https://www.creg.be/sites/default/files/assets/Publications/Studies/F2229EN.pdf (accessed on 23 August 2022).
- Nelder, C.; Rogers, E. Reducing EV Charging Infrastructure Costs; Rocky Mountain Institute: Basalt, CO, USA, 2020. [Google Scholar]
- Madina, C.; Zamora, I.; Zabala, E. Methodology for Assessing Electric Vehicle Charging Infrastructure Business Models. Energy Policy 2016, 89, 284–293. [Google Scholar] [CrossRef]
- Hubject Flexible Pricing That Scales with Your Business. Available online: https://www.hubject.com/pricing (accessed on 23 August 2022).
- Eclearing Pricing. Available online: https://e-clearing.net/partners/pricing (accessed on 23 August 2022).
- Wellisch, D.; Lenz, J.; Faschingbauer, A.; Pöschl, R.; Kunze, S. Vehicle-to-Grid AC Charging Station: An Approach for Smart Charging Development. IFAC-Pap. 2015, 48, 55–60. [Google Scholar]
- VREG Energiemarkt in Cijfers. Available online: https://www.vreg.be/nl/energiemarkt-cijfers (accessed on 7 October 2022).


| Type | Description |
|---|---|
| Frequency Containment Reserve (FCR) | Primary automatic reserve provided by the entity with FCR service contract, reacting within a timeframe between zero and 30 s to a frequency deviation and stabilizing it on a certain level. |
| Automatic Frequency Restoration Reserve (aFRR) | Secondary automatic reserve provided by the entity with aFRR service contract, restoring the frequency to 50 Hz within a timeframe between 30 s and 15 min. |
| Manual Frequency Restoration Reserve (mFRR) | Tertiary reserve, provided by the entity with mFRR service contract, manually activated by the TSO in case of major imbalances and congestions. The respective BSPs must make mFRR available not later than 15 min after the TSO’s demand. |
| Indicator | Generalized Formula | Definition | |
|---|---|---|---|
| EBIT | = | EBIT is the difference between company’s operating revenues (not including the interest revenues) and costs (before the inclusion of tax-related expenses). | |
| EBITDA | = | EBITDA repeats the definition of EBIT but does not include the depreciation and amortization into the costs list. | |
| EBIT margin (%) | = | EBIT margin is a company profitability ratio, indicating the relative part of the revenues preserved after the deduction of expenses (before interests and taxes). | |
| EBITDA margin (%) | = | EBITDA margin repeats the definition of EBIT margin but does not consider the depreciation and amortization costs. | |
| ROI (%) | = | ROI shows the ratio of company’s EBIT to the total amount of the invested capital. |
| # | Parameter | Symbol | Unit | Value | ||
|---|---|---|---|---|---|---|
| 1 | EVSE type | y | / | Unidirectional AC charger | V2G charger | |
| 2 | EVSE power level [37] | Ky | kW | 11 | ||
| 3 | EVSE price [19,37,38,39] | Py | € | 1200 | DC Current | 5000 |
| DC Break-even | 3999 | |||||
| DC Estimated | 3500 | |||||
| AC Estimated | 1200 | |||||
| 4 | EVSE installation cost [37,40] | Iy | € | 1000 | ||
| 5 | Charging fee [40,41,42,43] | CFy | €/kWh | 0.35 | ||
| 6 | Maximum yearly availability time | T | hours | 8760 | ||
| 7 | Maximum yearly charging capacity | MCy | kWh/year | 96,360 | ||
| 8 | Connection rate [43,44,45,46] | CRy | % | 42 | ||
| 9 | Charging usage rate [43,44,45,46] | URy | % | 7 | ||
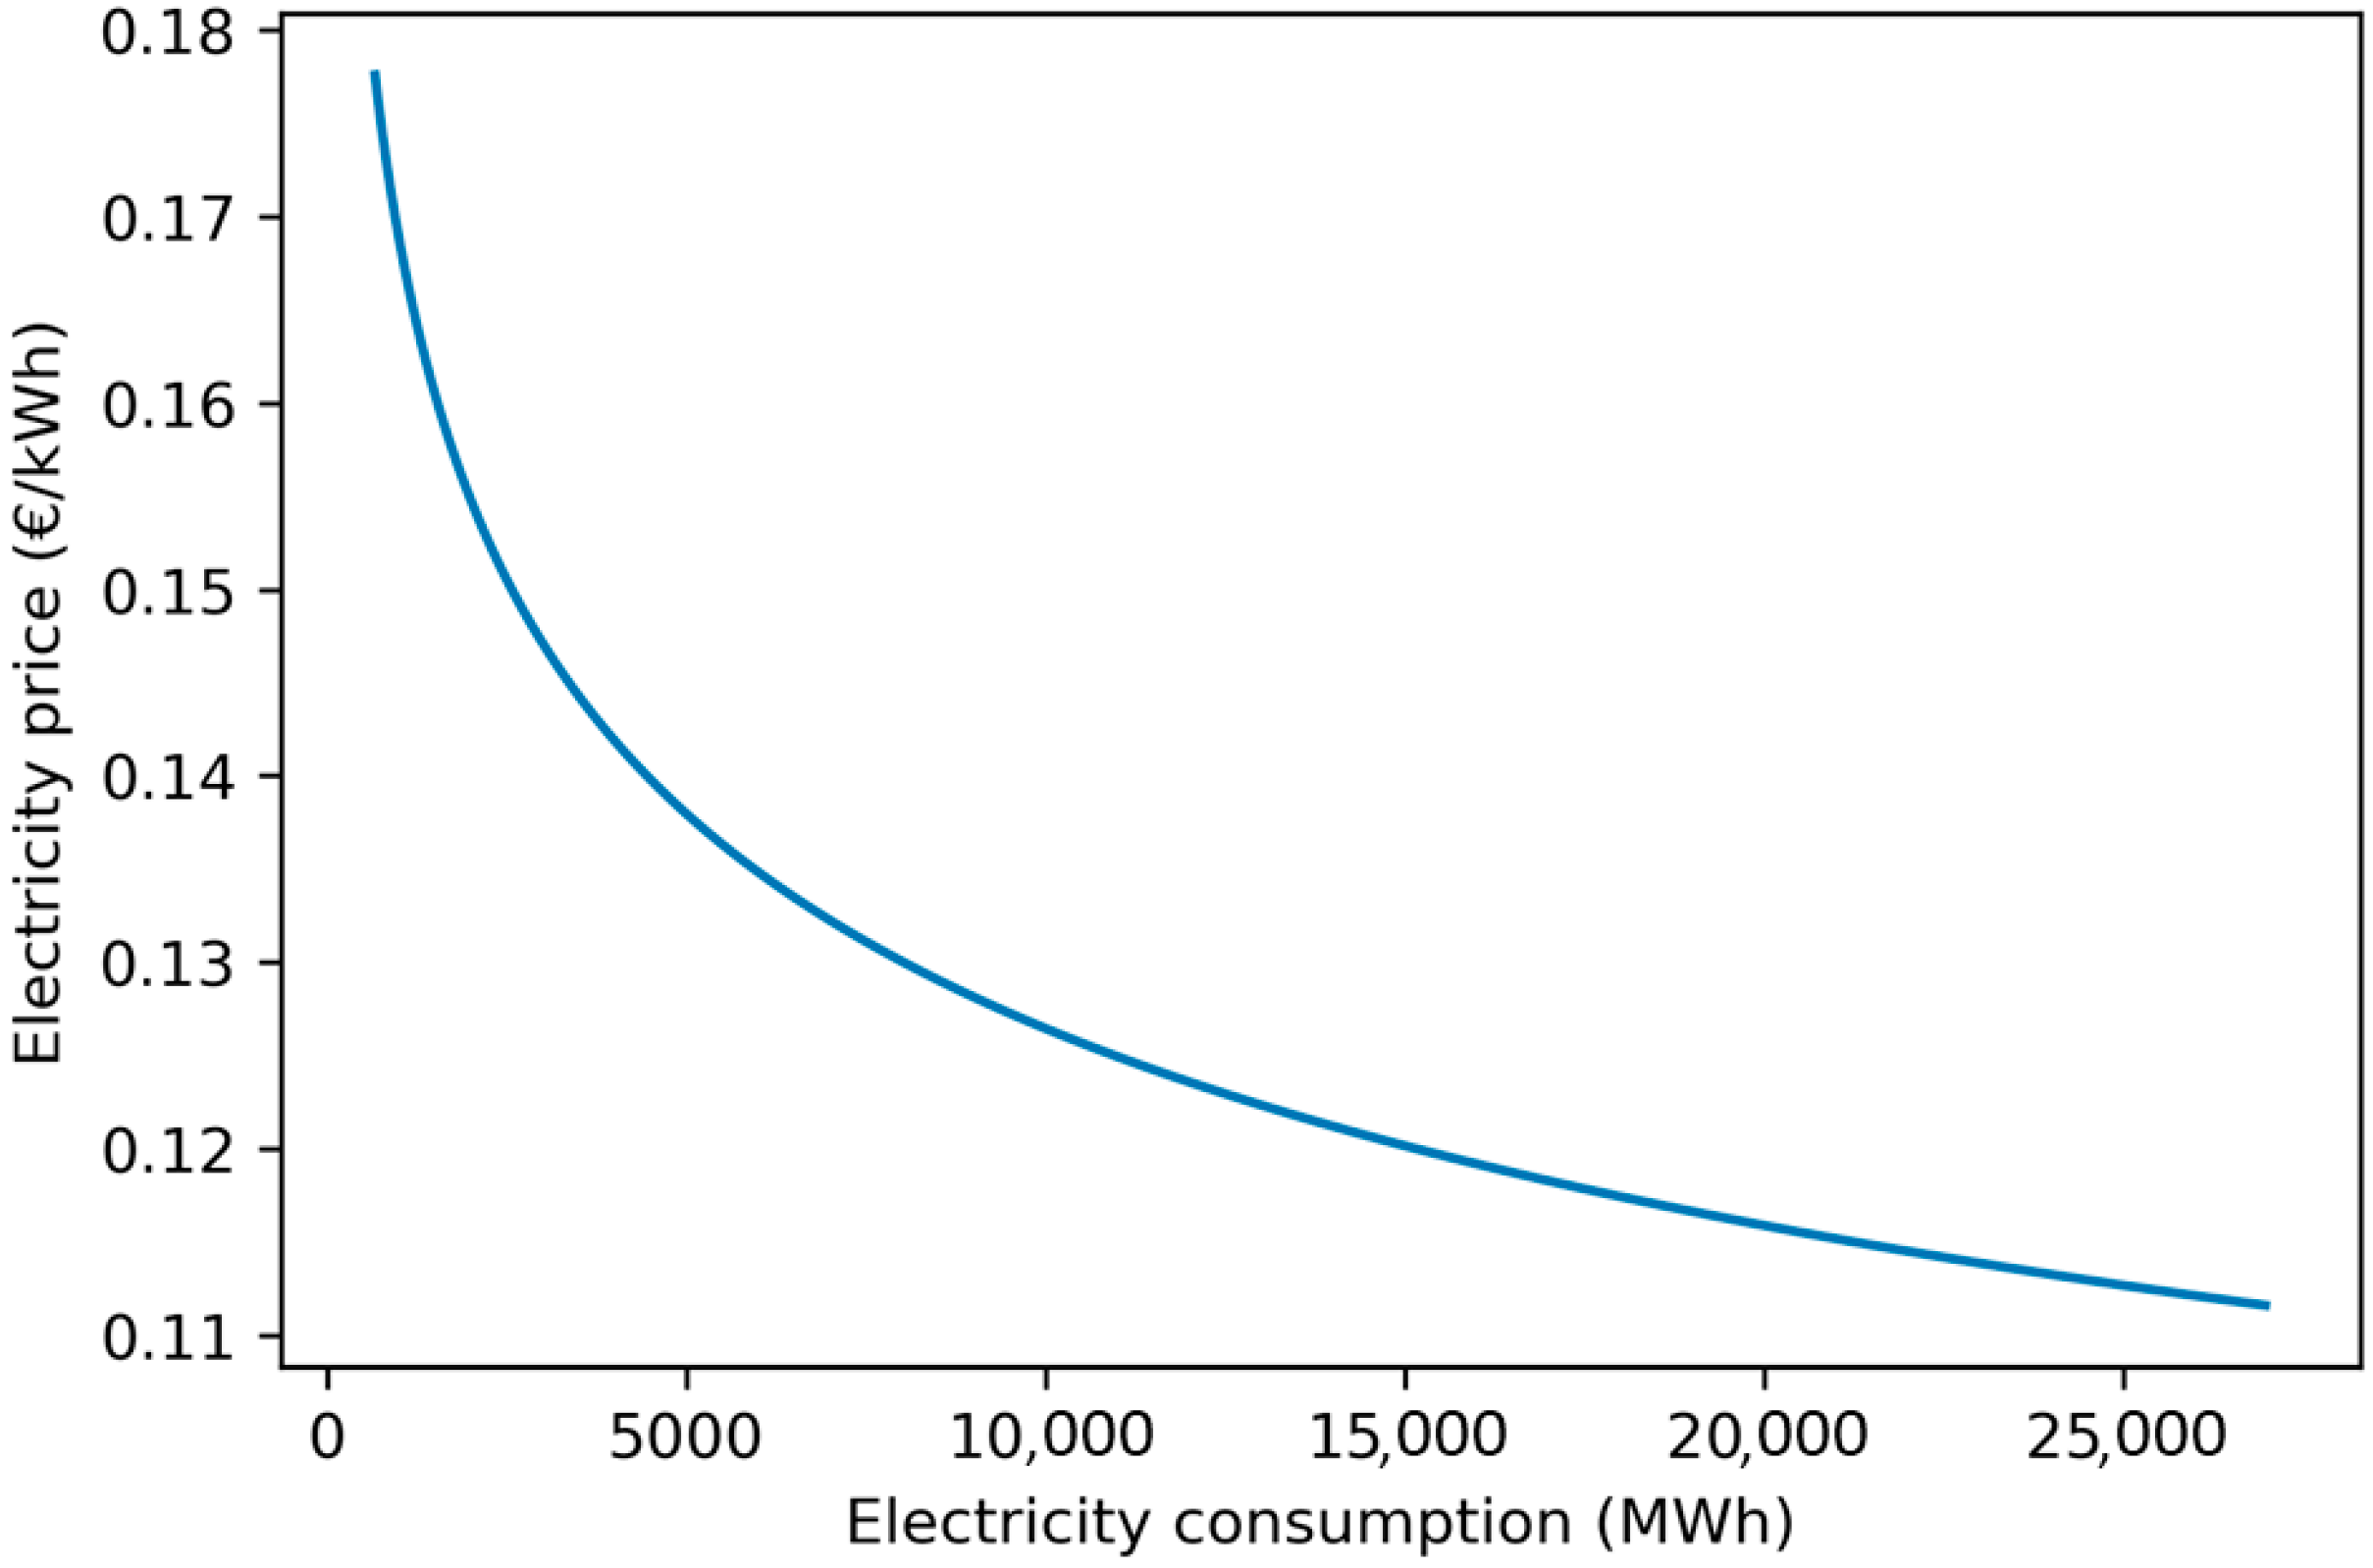
| 10 | Electricity price [47] | CElectricity | €/kWh | |||
| 11 | Average FCR capacity bid [48] | FCRBid | €/MW/h | 16.6 | ||
| 12 | Useful lifetime [49,50] | Ly | years | 10 | ||
| 13 | Salvage value [49,50] | Sy | % | 5 | ||
| 14 | HR cost [43] | CHR | € | |||
| 15 | Cost of accessing the marketplace [51,52] | CMP | € | 15,000 | ||
| 16 | Miscellaneous costs [43,49,50] | C Other | € | 100 000 | ||
| 17 | Management and maintenance costs [43,49,50] | CM&M | € | |||
| 18 | Total initial investment | / | € | |||
| 19 | Number of EVSE | Ny | Units | Variable | ||
Disclaimer/Publisher’s Note: The statements, opinions and data contained in all publications are solely those of the individual author(s) and contributor(s) and not of MDPI and/or the editor(s). MDPI and/or the editor(s) disclaim responsibility for any injury to people or property resulting from any ideas, methods, instructions or products referred to in the content. |
© 2023 by the authors. Licensee MDPI, Basel, Switzerland. This article is an open access article distributed under the terms and conditions of the Creative Commons Attribution (CC BY) license (https://creativecommons.org/licenses/by/4.0/).
Share and Cite
Goncearuc, A.; Sapountzoglou, N.; De Cauwer, C.; Coosemans, T.; Messagie, M.; Crispeels, T. Profitability Evaluation of Vehicle-to-Grid-Enabled Frequency Containment Reserve Services into the Business Models of the Core Participants of Electric Vehicle Charging Business Ecosystem. World Electr. Veh. J. 2023, 14, 18. https://doi.org/10.3390/wevj14010018
Goncearuc A, Sapountzoglou N, De Cauwer C, Coosemans T, Messagie M, Crispeels T. Profitability Evaluation of Vehicle-to-Grid-Enabled Frequency Containment Reserve Services into the Business Models of the Core Participants of Electric Vehicle Charging Business Ecosystem. World Electric Vehicle Journal. 2023; 14(1):18. https://doi.org/10.3390/wevj14010018
Chicago/Turabian StyleGoncearuc, Andrei, Nikolaos Sapountzoglou, Cedric De Cauwer, Thierry Coosemans, Maarten Messagie, and Thomas Crispeels. 2023. "Profitability Evaluation of Vehicle-to-Grid-Enabled Frequency Containment Reserve Services into the Business Models of the Core Participants of Electric Vehicle Charging Business Ecosystem" World Electric Vehicle Journal 14, no. 1: 18. https://doi.org/10.3390/wevj14010018