1. Introduction
The lithium-ion battery has been attracting increasing preference since its extraordinary properties such as high energy density, long life, and no memory effect, and has been extensively used as the mainstream power source of electric vehicles [
1]. Nevertheless, the accompanying irreversible health degradation characteristic poses a major challenge to battery management [
2]. Recently, battery state of health (SOH) estimation has captured widespread attention due to it being tightly bound to the remaining useful life and accurate state of charge (SOC) estimation of batteries. Real-time and exact estimation of battery SOH is of great importance for automotive applications. Rendering accurate information about battery performance during the driving process of new-energy vehicles is helpful to manage energy distribution and prevent catastrophic accidents and can perform battery fault diagnosis for maintenance and replacement planning [
3].
Currently, SOH estimation methods can be roughly classified into three categories, i.e., the direct measurement, model-based, and data-driven-based SOH estimation algorithms. The direct method measures the capacity by integrating the amount of electricity released during the whole discharge cycle. However, most batteries are in the state of partial charge and discharge in the actual working condition, the capacity estimation by calculating the charge between two SOCs over-depends on the accuracy of SOC estimation [
4]. Model-based approaches include empirical model, equivalent circuit model (ECM), and physics-based model (PM). The empirical model method is adopted to fit the linear model, exponential model, and polynomial model by continuously updating the measured or estimated parameters during the cycle [
5], but it is commonly only suitable for specific aging modes and battery types. Because internal changes of the batteries are unknowable, empirical models have difficulty capturing the complex aging process. The ECM and PM methods reflect the characteristics of batteries by establishing battery models and estimate SOH by identifying specific model parameters [
6]. However, due to complex operating conditions and coupling degradation mechanisms, it is difficult to achieve accurate and robust capacity estimates over the entire life of a battery. Compared with model-based methods, data-driven methods have been widely studied due to the superiority of model-free, high precision, and strong robustness [
7].
The data-driven methods concentrated on mapping the relationships between the SOH and the feature vectors in the battery aging process. Since the capacity attenuation of the battery is closely related to its remaining service life, SOH is differentiated from the SOC estimation that relies mainly on the open circuit voltage (OCV) [
8]. Researchers have no consensus on the recognized parameters that can reflect the SOH of a battery. Thus, the data-driven-based SOH estimation problem boils down to mining a signal-sensitive feature that maps SOH varieties and employing it to construct a predictor to estimate the battery SOH. The slope of the voltage curve and the voltage variation in a certain fixed time are frequently used feature extraction methods [
9]. Moreover, the methods of extracting geometric characteristics from images by transforming the original measurement data have also fascinated growing predilection. Furthermore, incremental capacity (IC) peak value [
10], differential thermal voltammetry (DTV) [
11], and differential thermal capacity (DTC) [
12] features have been demonstrated to be capable of capturing SOH aging characteristics preferably.
Classical machine learning regression algorithms such as support vector regression (SVR) [
12,
13], Gaussian process regression (GPR) [
14], and neural networks and their variants [
15,
16,
17] are also commonly used to mine the mapping relationship between features and SOH. Wang et al. [
18] adopted broad learning system (BLS) to effectively reconstruct the model through incremental learning, shortening the training process and avoiding catastrophic forgetting. However, the traditional machine learning model used to establish the SOH estimator requires a certain number of samples with actual values, and the sample features and corresponding actual values are taken as the training set. While complicated experimental circumstances are required to obtain the real value during real-world applications, and it takes months or even years to collect a vast majority of cyclic data, the data obtained are fairly limited and precious. Mainstream machine learning algorithms cannot learn enough features when using a small sample training, which severely restricts the application and availability of the algorithm.
Model-based transfer learning (TL) can transfer tasks from the source domain to the target domain and is commonly used to dispose of small-sample learning problems. Deng et al. [
19] grouped multiple batteries according to the capacity attenuation rate, and each group was provided with a reference battery. A long short-term memory (LSTM) neural network model was established for the reference battery, and the reference model was fine-tuned by substituting part of the target battery data to obtain the SOH estimation model of the target battery. Wang et al. [
20] presented an improved transfer learning SOC estimation algorithm based on a gated recurrent unit (GRU) model. By pre-training the GRU model in the source domain, the GRU hidden unit structure can be enhanced, and the weight parameters of the source domain were transferred to the GRU model of the target battery. Experimental results showed that the proposed improved GRU-based transfer learning method performed well on small samples. Shu et al. [
21] combined the LSTM network and fine-tuning strategies-based TL model to establish the SOH cell mean model (CMM) using part of the training data. To evaluate the SOH inconsistency between batteries, the LSTM model was adopted as the cell difference model (CDM), and the minimum estimate of CDM was identified to determine the SOH of the battery pack, thus realizing the model migration.
Because of a wide variety of batteries and complex working conditions (changes in temperature, current, and other working environments), different internal electrochemical compositions, and complex external environmental factors, even the aging curves of the same type batteries are dissimilar. Thus, the distribution difference of different battery aging data varies greatly, the existing training sample sets are not necessarily suitable for the newly generated data, and the estimator trained on this basis struggles to meet the requirement. The model built with one battery dataset is difficult to generalize to other battery datasets.
The goal of feature-based transfer learning is to search for an optimally shared feature subspace, narrowing the distribution difference between the source domain and target domain data on this feature subspace, while preserving the feature mapping of its internal attributes to the greatest extent. Using the domain training model after feature transformation is essentially equivalent to increasing the training data to enhance the generalization ability of the model. Blitzer et al. [
22] presented a method of structural correspondence, identifying pivot features that frequently appear in the source domain and a target domain and using these pivot features to establish cross-domain feature correspondence. Wang et al. [
23] adopted structured sparsity-inducing norms to discover correlations between tasks during multi-task learning and then improved the prediction performance by sharing characteristics among related tasks. The effective measurement of distribution differences between domains is a critical component in feature transfer learning. The main commonly used methods of measuring discrepancy between domains are the Bregman distance [
24], the entropy-based Kullback–Leibler (KL) divergence [
25], and the maximum mean discrepancy (MMD) [
26]. Because Bregman distance adopts the gradient descent method to solve the objective function, it requires a large amount of computation. KL divergence is frequently used in measuring the similarity between probability distribution functions, which requires continuous prior probability density estimation. Compared with Bregman distance and KL divergence, the measurement calculation of MMD is comparatively simple, straightforward, and understandable, and has been attracting increasing preference in feature transfer learning.
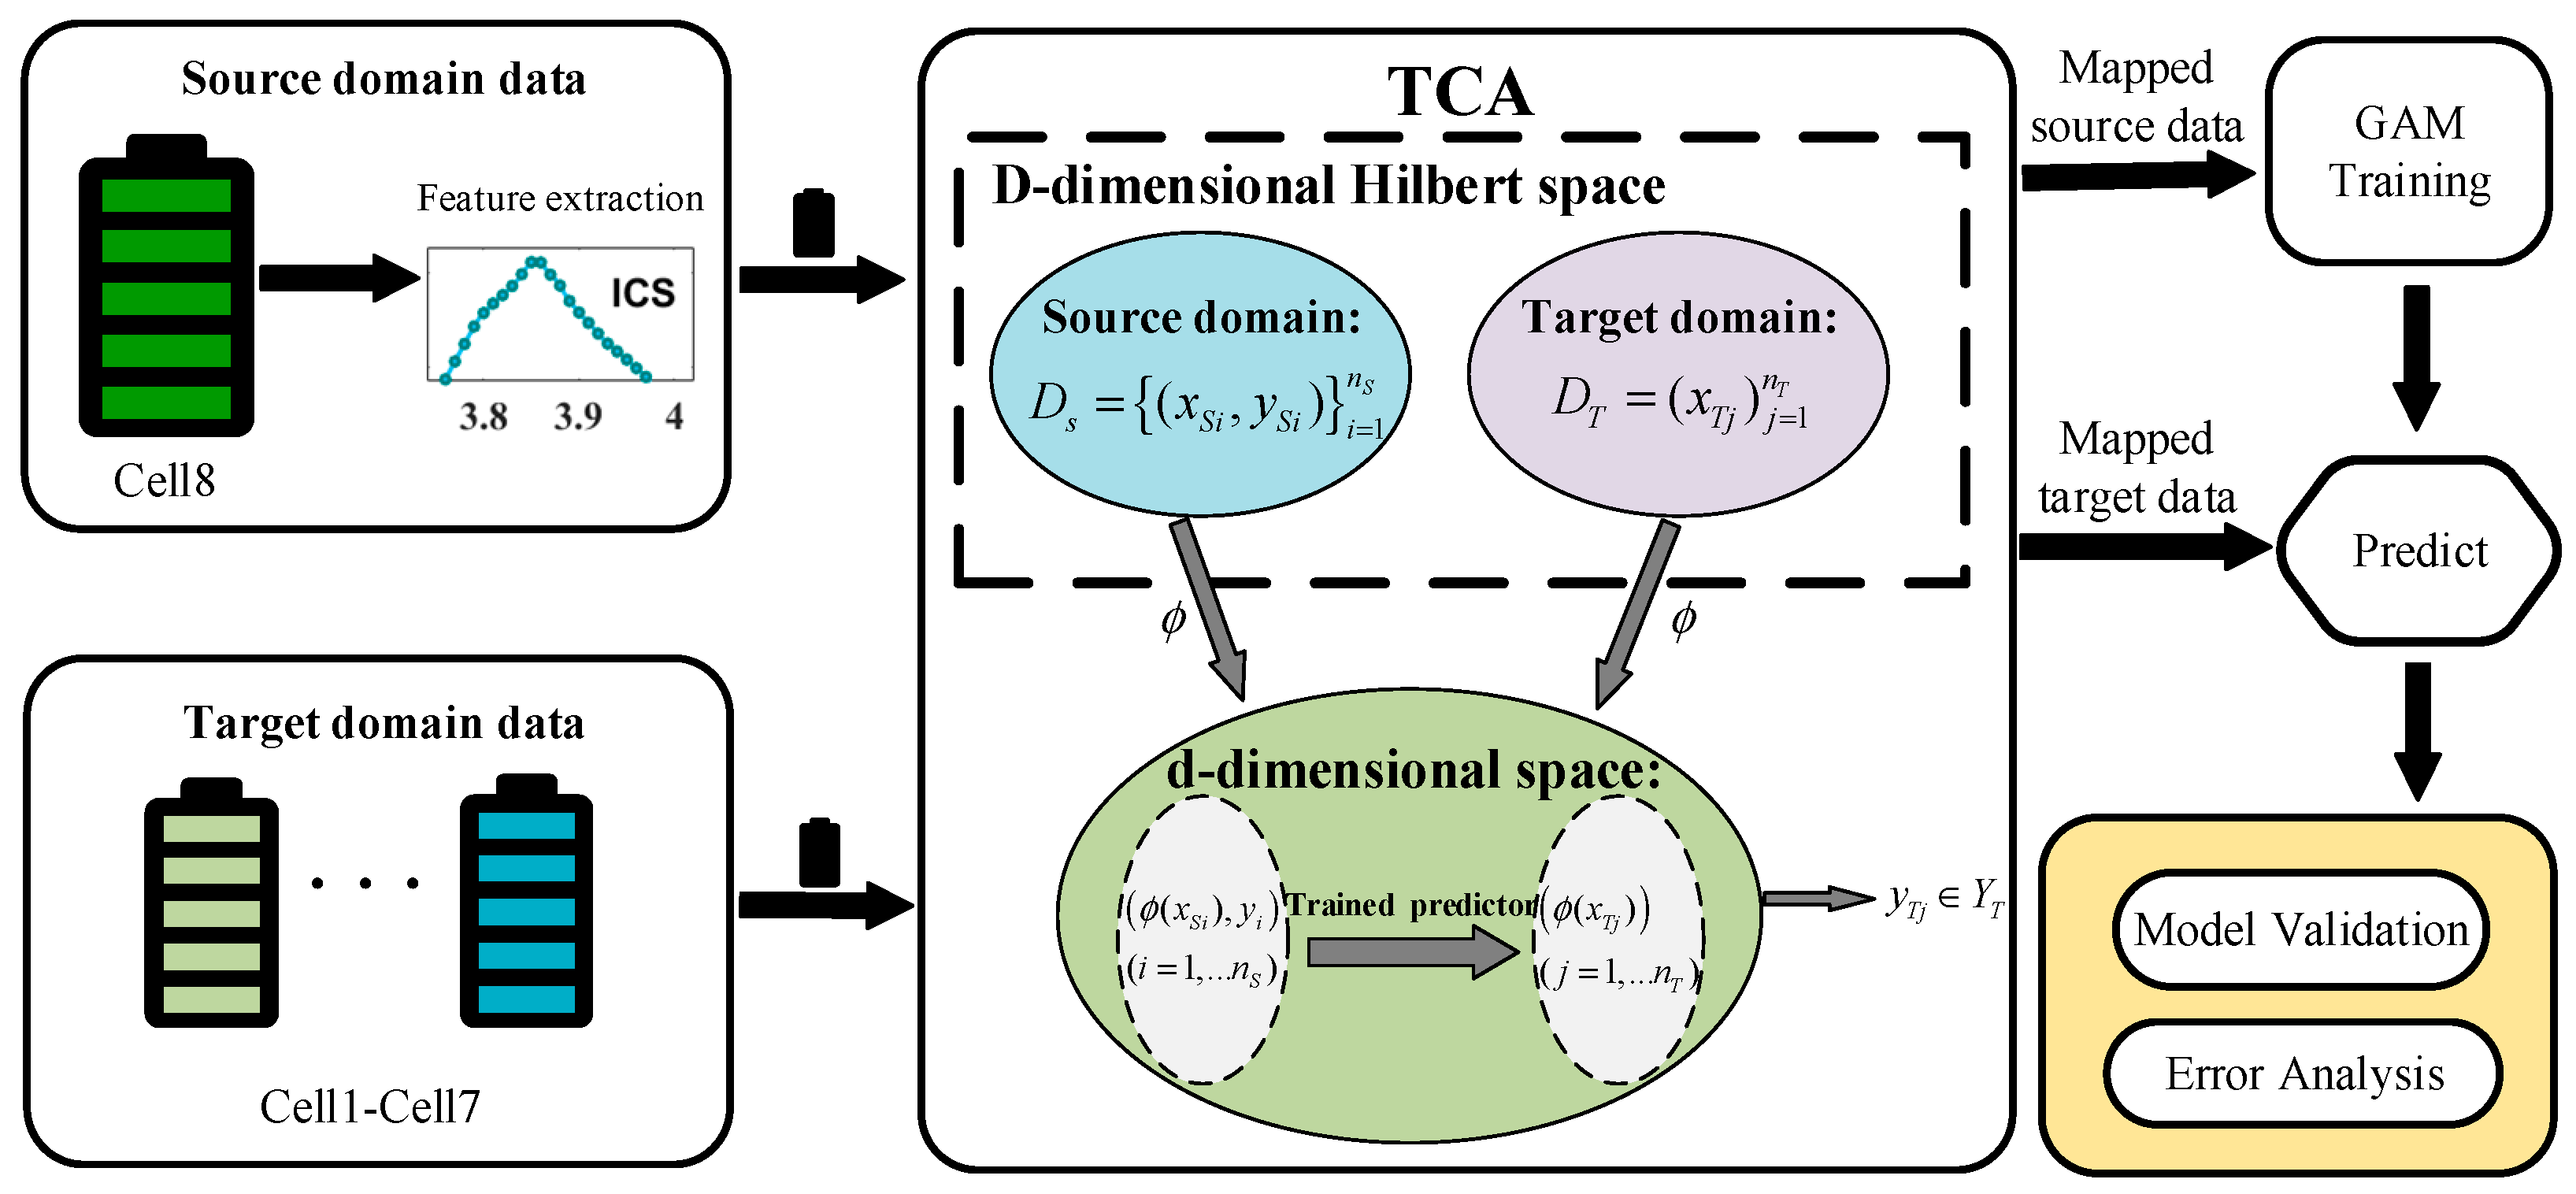
Motivated by the aforementioned limitations, this study focuses on developing an innovative SOH estimation algorithm based on feature transfer learning. Sequence features that are highly sensitive to SOH changes are sufficiently extracted from IC curves, and the distribution difference between the features of the source domain and target domain in a shared feature subspace is minimized by transfer component analysis (TCA) [
27], while the internal attributes of the original data are maintained. The newly obtained characteristics of the source and target domains are input into a generalized additive model (GAM) to estimate the SOH of the battery, and then experiments on multiple batteries are conducted to substantiate the proposed transfer learning technique.
The layout of this paper is as follows:
Section 2 introduces feature extraction methods of lithium-ion batteries.
Section 3 describes the SOH estimation algorithm in detail. Experimental results and analysis are made in
Section 4, followed by conclusions summarized in
Section 5.
2. Feature Extraction
2.1. Definition of SOH
The cyclic aging data of lithium-ion batteries in this paper are obtained from the Oxford battery degradation dataset [
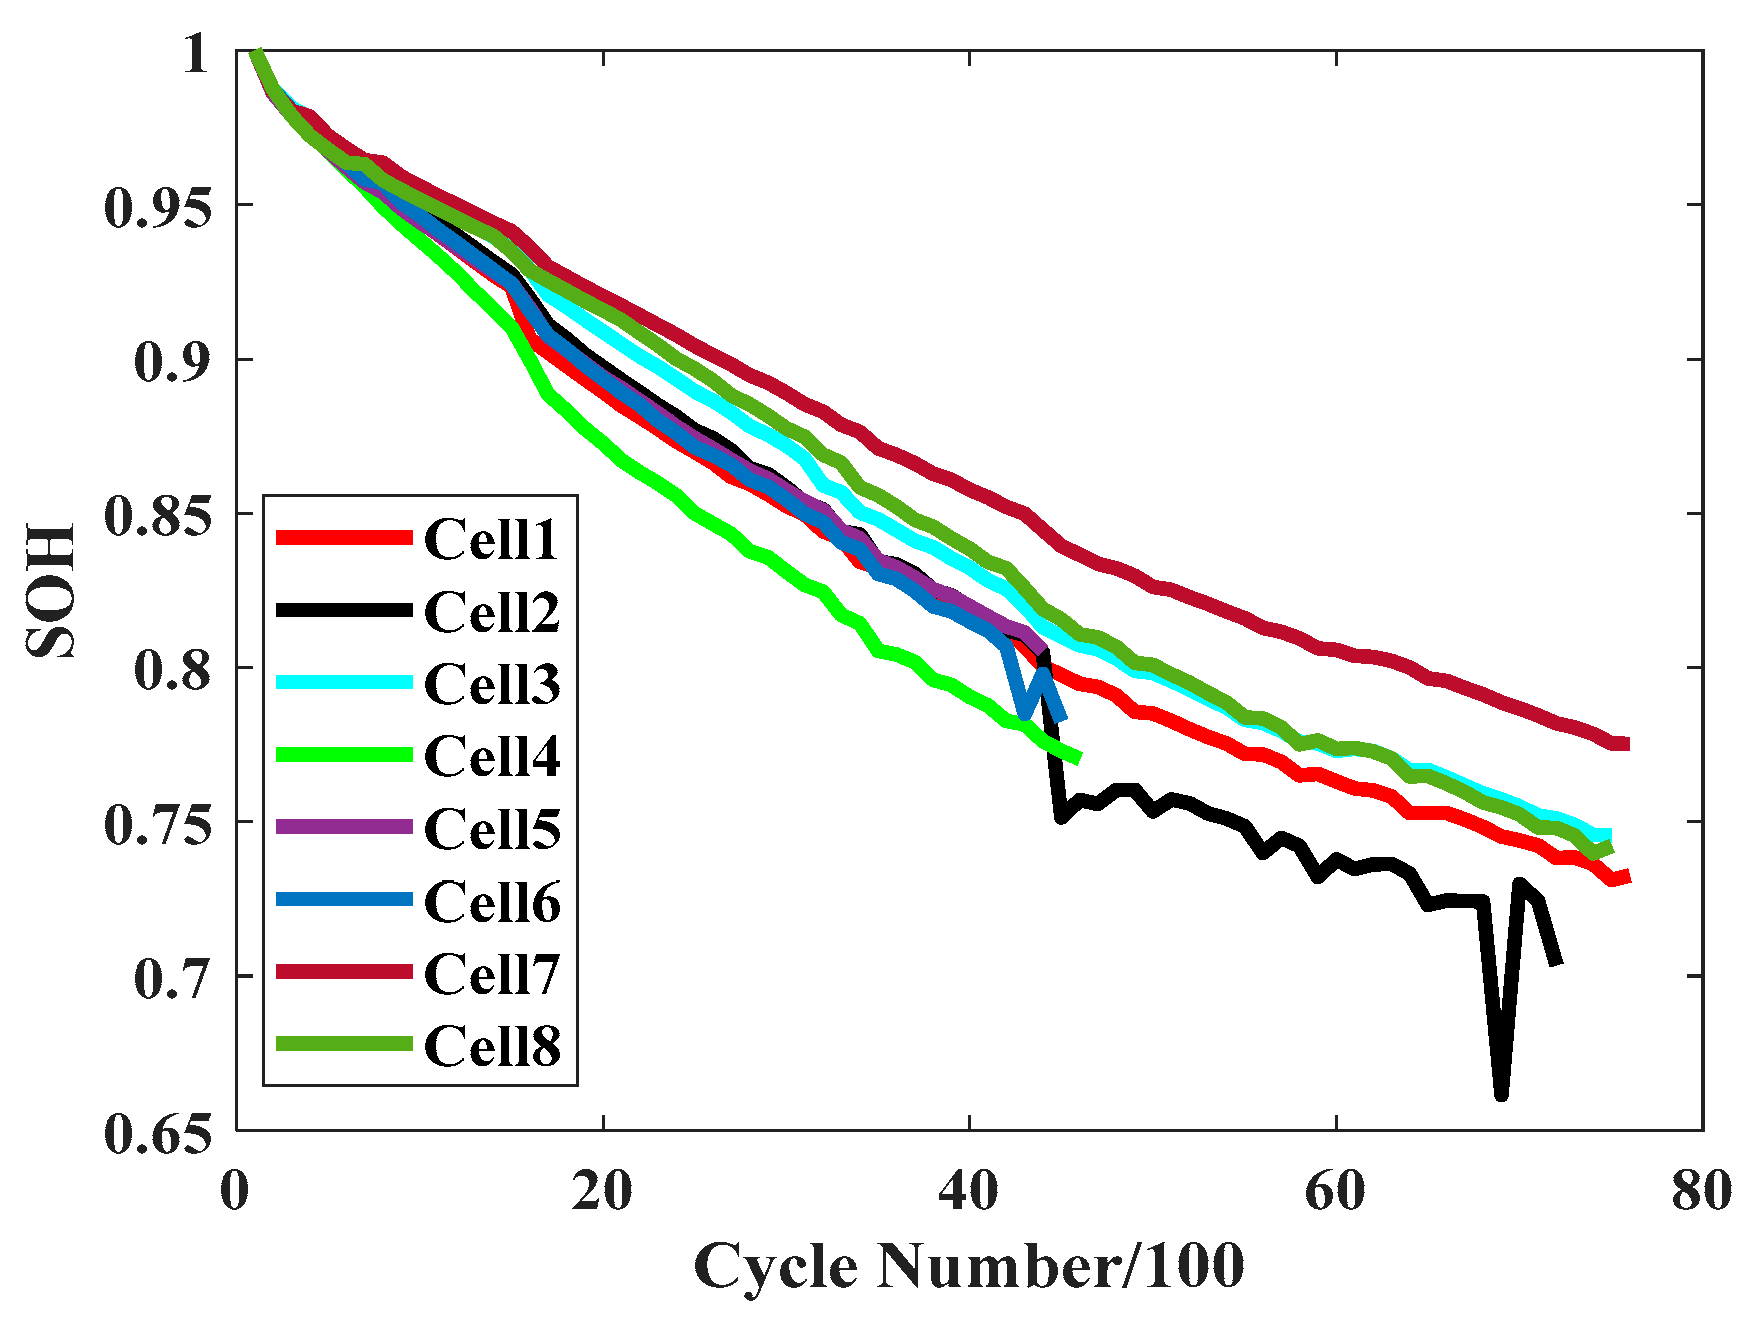
28]. This dataset contains aging data of eight Kokam pouch batteries with a nominal capacity of 740 mAh, noted as cell 1 to cell 8. The dimensions of batteries are 58.5 × 33.5 × 5 mm, and the model number is SLPB533459H4. The negative electrode material of batteries is graphite, and the positive electrode material is LiMO2 (where M represents a combination of Ni, Mn, and Co, commercially known as NMC). The cells were all tested in a thermal chamber at 40 degC. The current, voltage, and surface temperature of batteries were measured and recorded by a Bio-logic MPG-205 battery tester in every 100 aging cycles. The charging-discharging process of lithium-ion batteries includes a 1C (740 mA) constant current-constant voltage (CC-CV) charge-discharge cycle and a 40 mA low current charge-discharge process.
The health status of lithium-ion batteries indicates the percentage of the maximum available capacity of the battery in the rated capacity, measuring the aging degree of the battery. With the aging of the battery, its capacity gradually diminishes. The battery SOH could be defined as
where
represents the current capacity of the battery,
is the rated capacity, which is the initial capacity of the fresh battery. For a fresh battery, the initial SOH is assumed to be 100%. When the capacity attenuates to 80% of the initial capacity, the battery is considered to be invalid [
29]. The capacity changes of eight cells are shown in
Figure 1. Because of the inevitable changes of ambient temperature and mechanical stress, or internal battery failure in battery charging and discharging experiments, there are a certain number of invalid or missing values in the raw battery data. Prior to the feature extraction process, the original current, voltage, temperature, and other data in the battery dataset need to be cleaned. For voltage and current data, the moving average (MA) method was used to reduce the influence of sensor noise in sampling, and a robust locally weighted regression algorithm was used to smooth the temperature curve with poor robustness.
2.2. ICS Feature Vector Extraction
IC analysis was originally derived from research by Thompson in the field of materials science in 1979 [
30]. Later in the 1990s, Dahn adopted it to investigate carbon materials in lithium batteries [
31]. In the study of the capacity degradation mechanism of lithium-ion batteries, IC represents the battery capacity increased at a continuous voltage increment. In the constant current charging mode, the calculation formula of IC is
where
Q denotes the capacity,
U is the voltage, and
t represents the sampling time.
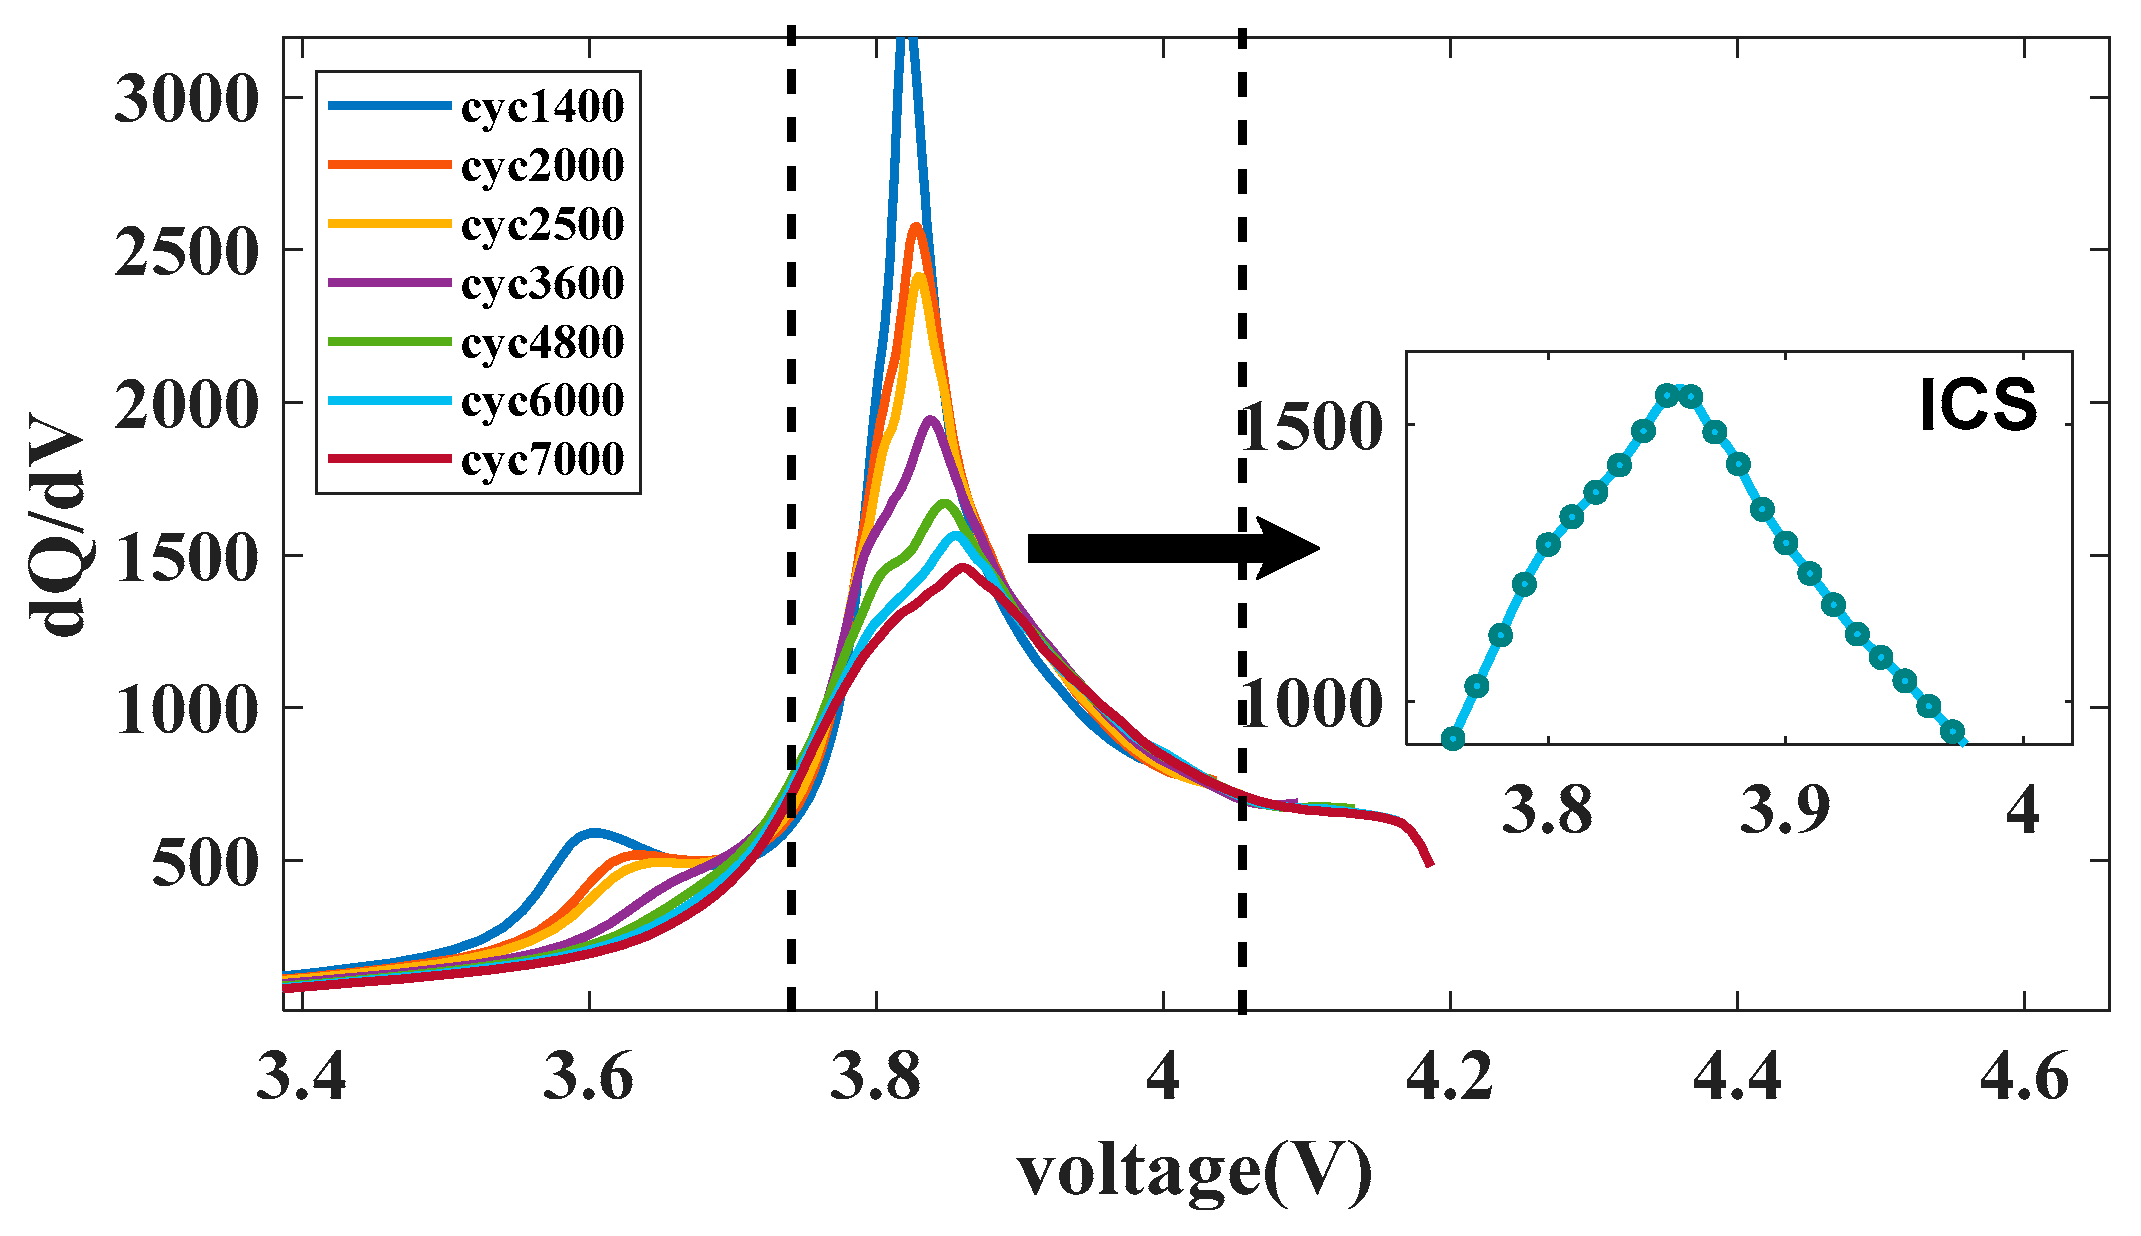
SOH estimation needs to extract the characteristics reflecting battery degradation from the IC curve, usually adopting geometric or statistical features, such as the peak value of the IC curve or sample entropy [
32]. However, as shown in
Figure 2, in addition to the peak value, there are still fluctuations related to the aging degree in the IC curve, thus it is extremely vulnerable to noise interference if the IC peak value is adopted as a feature alone. To address this issue, the values of a segment of the IC curve are sampled as characteristics, and then the mapping relationship between the IC curve and SOH is established. For the given sampling step
and voltage interval
, the sampling point
can be determined, and then the ICS feature vector
, with
can be extracted, where ICS means the IC feature vector with the length of
n containing the IC peak value. After analyzing the charging curves of each battery in the Oxford dataset, samples were taken at intervals of 0.01 V between 3.75 V and 4.04 V, and the ICS feature sequence with a length of 20 was extracted.
2.3. ICS Feature Transfer
A battery in the Oxford dataset is randomly selected as the source domain , and , where is the ICS feature sequence of the battery in the source domain, and is the corresponding actual SOH value. Suppose that the battery to be predicted is the target domain , and , where is the ICS feature sequence of the target domain, and both and are D-dimension feature data. Insufficient training samples will result in poor SOH estimation accuracy, which may be attributed to the data distribution difference between source and target domains, i.e., . In this paper, the TCA method is employed to combine MMD with principal component analysis (PCA) to seek out a shared feature representation between adjacent domains. That is, assuming that there is a nonlinear feature mapping , the TCA method can make the marginal probability distribution between the two domains in the mapped new feature subspace as consistent as possible, i.e., satisfy .
To calculate the aforementioned feature mapping
, the discrepancy between the source and target domains is measured by means of the MMD approach shown below
where
is the number of aging battery samples in the source domain, and
is the number of aging battery samples in the target domain.
represents the norm of reproducing kernel Hilbert space.
However, using raw data directly to minimize the objective function will bring about complicated
calculation. For simplifying the implementation procedure and reducing the calculational cost, the TCA method introduces the following nuclear matrix
K and coefficient matrix
L:
where
and
are the kernel matrices of the source domain, target domain, and cross-domains respectively, and
.
, where
denotes the trace of the matrix.
In addition, dimensionality reduction theory is also adopted in the TCA method. Firstly, the kernel matrix K is decomposed into . The low-dimensional matrix is defined, and the kernel mapping is transformed to the m-dimensional space.
Then, is replaced with the empirical kernel , where . Thus, is obtained.
Moreover, the regularization term is introduced in the process of minimizing the objective function to maintain the variance of the sample data to the maximum extent to ensure that the data characteristics are preserved after transformation. Assuming that the variance of the data is , where is the central matrix, and is the column vector whose elements are 1.
Finally, the objective function of the TCA algorithm is as follows
where
is a tradeoff factor. Therefore, the optimal mapping matrix
is obtained by solving the above equation to implement the mapping of the ICS feature space of the source and target domains.
4. Experiments and Analysis
To evaluate the performance of the estimation method, the mean absolute error (MAE) and the root mean squared error (RMSE) were opted as evaluation indicators. The definition of two metrics are shown in Equations (8) and (9).
where
and
denote the predicted and actual values, respectively,
N is the number of test samples.
The predicted results of battery SOH before and after feature transfer are shown in
Figure 4. The MAE and RMSE results are also calculated in
Table 1.
As can be seen in
Figure 4 and
Table 1, without using the TCA method, the model trained using samples from one battery contained in the Oxford dataset made poor predictions for the other seven batteries. In the middle and later stages of the aging cycle, the predicted results of each battery are significantly different from the real values, and the overall forecast curve fluctuates greatly, with RMSE values all greater than 2%. However, the SOH prediction effect of each battery was significantly improved by using the TCA algorithm; the results are very close to the reference value for all operating cycles. From
Table 1, it can be observed that the MAE values are all within 2%, especially the MAE values of cells 1, 3, and 7 are all within 1%. It is noted that the prediction results of cell 2 are worse than those of other batteries, probably since cell 2 experienced two capacity drops during the charge-discharge cycle. However, after using feature transfer learning, the MAE error of the cell 2 is reduced from 7.37% to 1.72%, and the RMSE value is reduced from 10.86% to 2.31%. The RMSE value of other cells are all within 2%. The results manifest the feasibility of the proposed algorithm.
To further verify the effectiveness of the proposed algorithm, the data of cell 8 were still adopted as the training set, and traditional IC features were extracted to train four commonly used machine learning models, namely, SVR, neural network (NN) [
29], linear regression (LR) [
34], and convolutional neural network (CNN) [
35], to compare with the algorithm proposed in this paper. The SOH prediction effect of each model on the aging curve of cell 1 to cell 7 is shown in
Figure 5. The MAE and RMSE results of SOH estimation results of different models are also given in
Table 2.
The experimental results show that the SVR, NN, LR, and CNN models trained on one cell have unsatisfactory predictive effects on the other seven cells due to the distribution difference between batteries. CNN algorithm has a poor fitting effect when training based on small samples, while the inconsistency of data distribution between the training set and the test set further increases the prediction error, with MAE and RMSE values both above 5%. The NN method can capture the general tendency of battery aging but provide low robustness, and the overall prediction curve is more volatile. SVR and LR models rely on outstanding small sample fitting ability to improve the smoothness of the predicted curve compared with the NN method, but the predicted results in the early stages of the aging cycle are significantly deviated from the real values, still unable to accurately track the aging status of the battery within the whole life cycle. Therefore, the traditional regression models cannot capture the dynamic aging characteristics of the battery based on small training samples, with a poor generalization performance of the trained model.
Since the GAM is based on a simple additive model, with a short time-consuming model training, and better results can be obtained without feature screening and normalization. GAM has a lower model complexity in comparison to other methods. In the case of a small number of training set samples, even if cell 1 to cell 7 with more samples are used as the test set, the features processed by the TCA method can still satisfactorily map the relationship between the features and the SOH value, and the overall predicted curves have a higher consistency and smoothness with the real values. The above-mentioned results validate that a small amount of experimental data can be taken full advantage of through feature transfer learning. It is further illustrated that the proposed algorithm has strong engineering practical significance.


