Article

Experimental Validation of an Automated Approach for Estimating the Efficiency and Heat Balance of Gearboxes Based on an Electrified Heavy Commercial Vehicle Axle

Institute for Automotive Engineering (ika), Steinbachstr. 7, 52074 Aachen, Germany
*
Author to whom correspondence should be addressed.
World Electr. Veh. J. 2022, 13(8), 142; https://doi.org/10.3390/wevj13080142
Submission received: 28 June 2022 / Revised: 15 July 2022 / Accepted: 27 July 2022 / Published: 2 August 2022

Abstract

:
Freight transport accounts for about half of all distances travelled in Europe. Therefore, freight transport is one of the decisive factors for reducing greenhouse gases and air pollutants. For this reason, the electrification of road freight transport is being promoted as part of the project “BEV Goes eHighway—[BEE]”. The data basis for the modelling used in this project is an electric drive axle for a heavy commercial vehicle, which was developed in the “Concept-ELV2” project. Based on the results of the previous project, the methodological tools that were developed are presented in this paper. These allow a wide range of possible powertrain topologies to be considered at the concept stage of development based on an estimation of future system characteristics. For this purpose, the components are automatically designed taking into account the mutual influence of the requirements and are evaluated in the context of the holistic system. This publication focuses on the efficiency and thermal evaluation of the transmission stages of the addressed electric drive units and validates the developed models using a pototypically designed electric commercial vehicle axle.

1. Introduction

For the evaluation of commercial vehicle-related emissions, a standardized Europe-wide tool was developed in 2018 in the form of VECTO (Vehicle Energy Consumption Calculation Tool). As is already customary for the passenger car segment with the WLTP (Worldwide harmonized Light vehicles Test Procedure), this tool defines reference cycles, test procedures and their boundary conditions, as well as the recording of emission values in real road traffic [1]. Since the segment of heavy-duty commercial vehicles covered by VECTO comprises fewer units but a significantly higher number of variants, component tests are used more frequently in this procedure [2]. These also enable less common vehicle variants to be evaluated concerning their emissions without an individual test procedure using standardized longitudinal dynamic simulation models. In this approach, transverse dynamic effects are neglected, as they have only a small impact on vehicle efficiency.
In the current certification processes, battery-electric vehicles are considered zero-emission vehicles both in the commercial and passenger car sectors, as they do not exhaust any local CO2 emissions. Thus, even a small number of these vehicles has a significant impact on the fleet footprint of a vehicle manufacturer. However, this approach neglects the preceding process of energy generation, which also disregards the efficiency of the energy use of the respective vehicles. As a result, this factor, which is crucial for the success of the technology change, is only of secondary importance [3].
Consequently, the current legislative situation is similar to the situation in the entire commercial vehicle sector before the introduction of the VECTO, as no standardized approaches are currently defined to assess the efficiency of a commercial electric vehicle. As this topic has the previously described significant influence on the success of the technology and is gaining in importance due to the new regulatory environment, the first approaches for a supplement to the VECTO have already been developed. These are currently being implemented in a binding form [4,5].
A key aspect of the increased applicability of electric powertrains in the commercial vehicle segment is the enhancement of the usable driving range of the vehicles [6]. Due to the considerable battery capacities to be expected in this segment and the associated charging times, this aspect is gaining in importance compared to the passenger car segment with respect to economic viability. In this context, besides the consideration of the battery characteristics, the efficiency of the drivetrain is of great importance, as it has a significant influence on the achievable range of the vehicles. Due to the changed requirements compared to conventional powertrains, simpler powertrain and gearbox structures are currently being implemented. Especially in the case of gearboxes, only a few gear stages are currently common to meet the driving requirements. This results in the possibility to automate the design of these systems and thus cover a wide range of possible solutions. However, this automated process is also subject to divergent requirements with respect to efficiency and costs [7].
The automation of the design process also has the advantage that the transition from conventional to electric drives is underway, and manufacturers currently only have a limited pool of experience in this segment. Therefore, methods must be provided that allow an early estimation of the system properties. In this paper, therefore, thermal analysis of the gear stages is carried out in addition to the evaluation of the system efficiency. This aspect has gained importance due to the proximity of the electric motor and gearbox [8]. For the thermal modelling of gearboxes, approaches exist according to [9,10,11]. However, these do not link the efficiency evaluation with the thermal evaluation and are also not automated; therefore, the user constantly has to build a thermal analysis model manually for each gearbox. Thus, covering a large solution space is only possible with enormous manual effort.

2. General Methodology

In order to meet the challenges of electrifying powertrains, a tool was expanded and applied within the ‘Concept-ELV2’ project that was developed at the Institute for Automotive Engineering (ika) for the synthesis and design of powertrains [12]. The holistic approach chosen starts with the basic parameters of the vehicle and derives component-centered requirements using longitudinal dynamic vehicle models. This systematic assessment of the individual component requirements enables the optimization of each individual component and the simultaneous modelling of the interdependencies between those components. One reason is that each powertrain component’s individual optimum does not often lead to the optimum within the entire powertrain [13]. The conceptual design process of ika is visualized in Figure 1 in the form of a V-diagram.
The process of generating a suitable powertrain is subdivided into several sub-models, starting with the longitudinal dynamics model of the vehicle as described earlier. Taking into account the desired driving requirements, the specifications of the powertrain can be derived using this typical simualtive approach. Depending on the selected vehicle and application, different levels of detail of longitudinal dynamics models are used. In the following step, the automated design of the powertrain begins. Since initially only the global requirements of the powertrain are available, their dependencies on each other are implemented in the form of a parameter set. The underlying holistic approach is presented in [13]. It considers the effects of the scaling of a component on the requirements of the other components of the drivetrain and thus addresses the direct interaction of the component dimensioning in the overall system. In the following, the design of the gearbox is described in detail. The approach implemented within the holistic methodology for the dimensioning of the electric machine is described in detail in [14].
For the design of the gearbox, each parameter set of the holistic model is processed individually. In this subordinate step of the design process, possible drive topologies are designed algorithm-based on these requirements. Predefined criteria are used for evaluation, including the system’s complexity, the achievable driving performance and the number of system elements. The most promising topologies according to these criteria are then further detailed. The shaft-bearing system is first defined in this detailing, and an initial design of the basic gearing parameters is carried out. This enables a component-based efficiency calculation of the concepts whereby a well-founded second evaluation and prioritization of the remaining topologies can be carried out. Based on this efficiency simulation, a thermal node model of the gearbox is created automatically. This model assigns the losses calculated for each component to the thermal nodes of the respective components and links them to each other according to the gearbox configuration. In addition, a simplified gearbox housing is generated to calculate heat dissipation to the environment. The gear oil, which plays a decisive role in heat transfer, is also considered in this method. An approach based on particle simulations was developed to integrate the oil into the thermal model presented in the publications by Köller et al. and Uerlich et al. [15,16]. Since this paper focuses on validating the models using measurement data, we refer to the mentioned publications for a detailed elaboration of the modelling process.

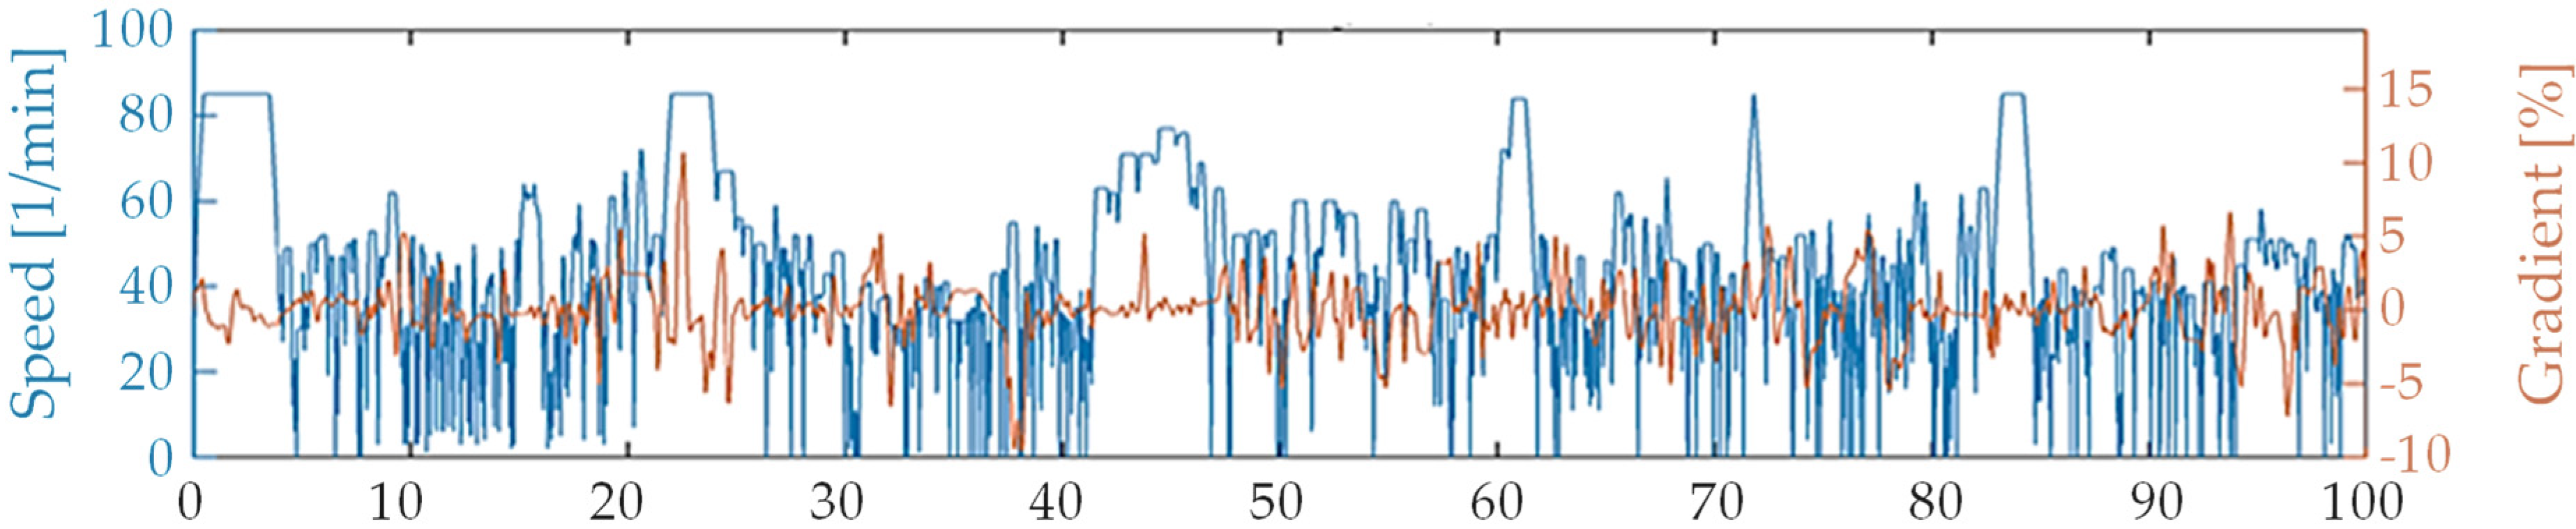
2.1. Requirement Specification Based on VECTO

The urban delivery cycle of VECTO was chosen as the basis for this design process in the exemplary application for the ‘Concept-ELV2’ project. As there is currently no modification of this cycle for battery electric vehicles integrated in VETCO, the cycle of conventionally powered vehicles was used for the evaluation. This driving cycle is shown in Figure 2 [1].
The diagram shows the required speeds in blue and the gradients in orange. It can be seen that the urban delivery cycle involves comparatively few constant-speed sections, but rather continual acceleration and braking demands. In addition, a wide range of road gradients is taken into account. This results in a set of requirements which, due to the homogeneous distribution of driving conditions within the cycle, delivers significantly more complex requirements with respect to overall vehicle efficiency.

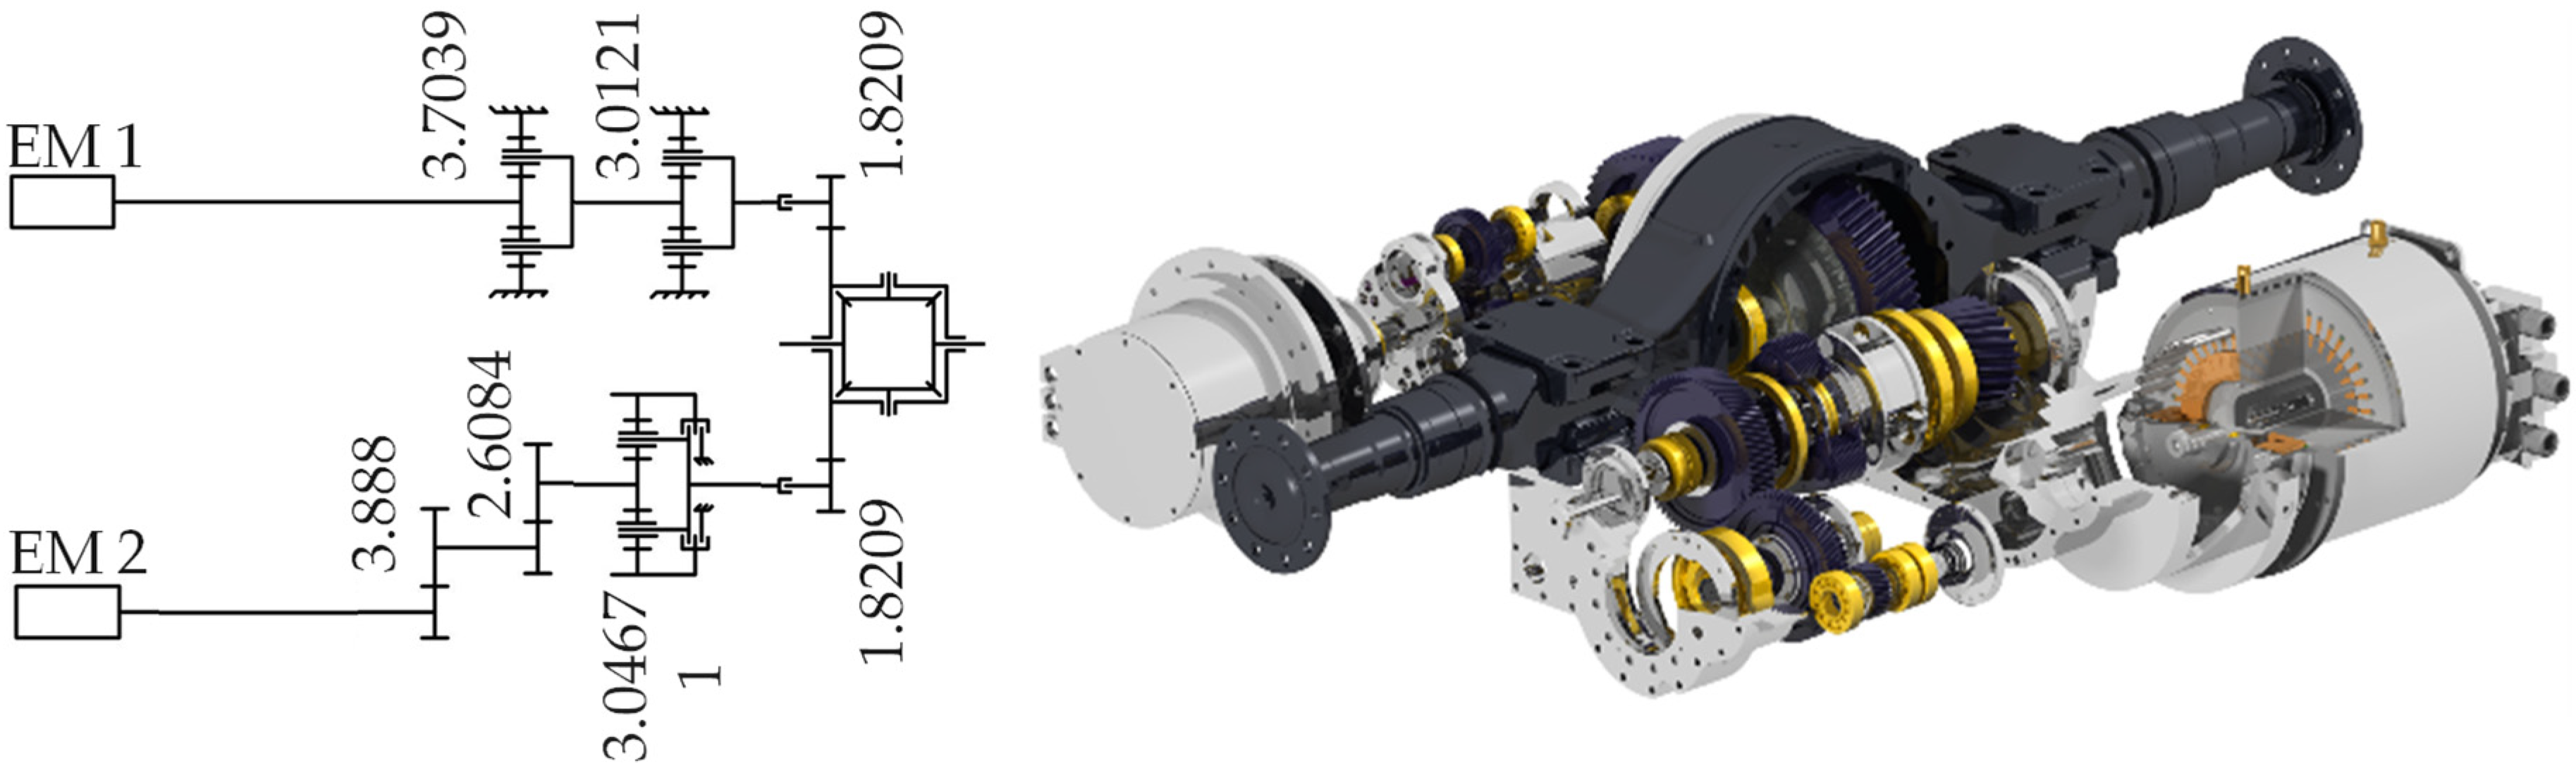
2.2. Methodical Approach for the Automated Identification of Suitable Powertrain Topology and Gearbox Design

The processing of these requirements is carried out according to a method presented in detail in the work of Köller et al. [17]. The method introduced there differs from other state-of-the-art methods in its holistic approach to identifying solutions and subsequent optimization. In addition, the degree of automation sets it apart from other prior art processes and enables a large solution space of possible topologies to be included in the approach. The three essential design steps of topology synthesis, initial gear dimensioning and evolutionary combination are carried out within the method.
In the topology synthesis, all possible transmission topologies are generated that comply with the driving requirements and the restrictions of the solution space, such as the maximum number of gear stages, required torque and maximum speed. For these topologies, an estimation of the characteristic gearing parameters is conducted already in the first development step, allowing prioritization of the topologies according to their fitness. For this purpose, the criteria complexity, costs and efficiency are assessed based on the limited number of available parameters. The second step is followed by an initial dimensioning of the gear elements for the most promising variants. This analytical process is based on ISO 21771 and ISO 6336 [18,19]. Through the analytical approach, a large number of gear variants are considered and optimized in the final step of the method with the help of a genetic algorithm. This algorithm weighs and combines the solution variants concerning system mass, safety, lifetime and efficiency. The user determines the importance of these criteria according to the application’s requirements. In the context of the application within the ‘Concept ELV2’ project, 109 gearbox variants were initially generated with this algorithm, and about 400 variants were dimensioned in a second step. A selection of these variants and the prototypically realized variant is shown in Figure 3.
The selection of gearbox topologies shown here provides small insight into the bandwidth. In all transmission topologies, two electric machines were set as a boundary condition, as these should ensure more efficient coverage of the widely varying load requirements of a heavy commercial vehicle. In variant 1, mainly planetary stages are used to realize the transmission, whereas in variant 3, only spur gear stages are used. Variant 2 and variant 4 represent different combinations of these gearing elements, so the advantages of both element types can generate an advantage with respect to service life or efficiency in one system. In addition to the automated weighting, the selection of the realized topology was based on the aspects of manufacturability and research-relevant system designs. Thus, a stepped planet was designed for electric machine one and a shiftable planetary stage with decoupled through-drive was designed for electric machine two. The topology selected for the prototypical implementation and its CAD design is shown in Figure 4. A detailed discussion of the synthesis process can be found in [17].

2.3. Method of Iterative Efficiency Simulation

An iterative calculation of the component losses is subsequently carried out for the generated and top-rated gearbox topologies for in-depth evaluation of the concepts. Based on the initially defined overall structure, it is necessary to determine the shaft-bearing system and to specify the bearing positions as well as the gear configuration. The general sequence of the process is divided into the modelling of the gearbox component bearings, shafts and gears, followed by linking those to each other with elements such as gear pairs and couplings. After the complete modelling of the mentioned components, the system of equations is set up automatically for each topology treated. In these, the speed relationships and the force and torque flows within the system are taken into account. In the first solution step, this equation system is solved without considering the system losses. These are then determined iteratively in a subsequent calculation step. The resulting losses lead to a load reduction for the following elements in the torque flow. Hence the iterative consideration is necessary. This process was presented comprehensively in the publication by Kieninger et al. and in further publications by Köller et al. and Uerlich et al. and is therefore not explained in depth here [13,15,17]. The results of this calculation approach for the designed topology of the ‘Concept-ELV2’ project are shown in Figure 5 for the switchable transmission part of electric machine two (EM2).
The addition of the planetary stage causes a reduction in the overall efficiency of about one percent over the entire map. This influence is comprehensible due to the increased number of tooth contacts generated by the addition of the planetary stage and corresponds to the expectations based on known literature values [20]. Drag losses are neglected in the loss calculation, as no approach for the early stage of the gearbox design could be identified that would allow a feasible estimation. The gear losses calculated for each component are used in the following process step for the thermal assessment of the gearbox concept.

2.4. Thermal Modelling Approach

Within ISO/TR 14179-2 [21], an approach for calculating the gearbox temperature is introduced, which relates the power loss of the gearbox to the outer surface of the housing. With this method, a thermal equilibrium state is calculated for the gearbox. This approach is not possible to identify thermally critical system parts due to the simplified procedure. The procedure also provides only limited information, as the standard already pointed out that a deviation of 14% from measured values is to be expected. To be able to make a more precise prediction, a thermal network is generated for the gearbox at this point in the ika method, which includes at least three nodes for each loss-generating gearbox component. An exemplary network of a gearbox section is shown in Figure 6. In this figure, the meshing of the bearings, gears, shaft, seal, housing, oil and environment can be traced on a gearbox section.
The thermal modelling approach of a gear using thermal networks is already established. Such an approach was already used by Blok [22] to model a single-stage FZG gear test rig. This modelling aimed to obtain feedback on the thermal behavior of the tooth contact, the lubricant film in the tooth contact and the tooth flank. This modelling approach was not validated by measurement in his work and used a too-coarse mesh with five accounts. In Funck’s [23] work, this approach was refined and validated by measurement. However, a deviation of 25% between the measured value and the model was determined there.
A significant improvement in the results was achieved by Geiger [9], who further refined the thermal network and divided the gear into thermal nodes tooth flank, tooth body and gear wheel. Similarly, the shafts were divided into several nodes. The gear oil was still represented as one node at this point, which can be considered sufficient due to the structure of an FZG test rig. Additionally, his work implemented an approach that enables temperature calculation under transient load conditions. With these adjustments, good compliance between the model and the measurements was achieved, with a deviation of about 10%.
The approach used in this paper is based on the previously mentioned approaches but differs in the chosen application. Instead of a single-stage FZG test rig, multi-stage vehicle gearboxes are modelled. These vary not only in the number of stages but also in the housing design. A more closely fitting form is assumed for vehicle transmissions instead of the cuboid housing shape used in the FZG test rig. In this approach, an automatically generated housing is created based on the shaft arrangement and corresponds to a detailed housing only as an initial approximation. The interior of the housing, which is also modelled in this way and filled with an oil–air mixture during operation, is subdivided into further sub-elements and is represented with a thermal node for each. This subdivision enables thermally critical points within the gearbox to be identified based on the oil node temperatures. The gears in the model consist of the node flank, tooth and gear body, and the bearings are represented by the node inner ring, rollers and outer ring. The shafts are divided into smaller shaft segments. The calculation procedure is divided into four essential steps: the generation of the thermal network, the time-step calculation, the temperature calculation and the evaluation. These steps and their details are shown in a flow chart in Figure 7.
First, the gearbox components are divided into single nodes, and the required data are specified and determined. After automatically detecting all links between the nodes, the time-independent parameters are calculated. In step two, the time-dependent parameters and conductivity values are determined. Moreover, the flow state of oil is calculated based on look-up tables from SPH simulations. The next step is solving the equation system for the component temperatures for the respective time step using the calculated parameters before. In the final step, the results of the component-by-component calculation are combined and evaluated. The detailed description of the configuration of the thermal simulation model is given in [24].

3. Results

The measurement results of the prototype gear unit are presented in the following and are used to validate the simulation results. For the measurement, the gear unit was mounted between test bench machines. These emulated the electric motor as the drive unit on the one hand and the output on the wheel on the other. The mechanical efficiency was determined using a torque measurement sensor at the gearbox input and a torque measurement sensor at the gearbox output. The representation of these measuring points on the prototype can be seen in Figure 8.
For the validation of the efficiency calculation presented in this paper, only the measurement of the gearbox part of EM2 was carried out, thus the measurement of the mechanical performance of input 2 compared to the output. In addition, for the validation of the simulated thermal balance, the temperature was measured on twelve fixed gearbox components, such as bearing outer rings, seals, housing and the oil inlet and outlet. In addition, the temperatures of six rotating gear components were recorded. These were each recorded as a pair; therefore, three different component temperatures are available for comparison with the simulation. These are located in the tooth flank, a shaft segment and a bearing inner ring.

3.1. Efficiency Results

The gearbox efficiency maps of Figure 9 were recorded with this measurement setup. These maps show the system’s efficiency concerning the input speed and the input torque. Both maps show gaps in the upper speed and torque range compared to the simulation. These ranges have not been measured since the driving requirements do not demand them of the vehicle and could not be covered using the emulated electric motor. Furthermore, these areas were not considered in the in-depth design of the gearbox, as this would lead to a massive over-dimensioning of the unit compared to the requirements.
Compared to the simulation, there is deterioration in the efficiency of one to two percent in both gears in the range above 150 Nm input torque and over the entire speed range. Below this input torque, this deviation increases for the gear with the transmission ratio of 14.847 to five percent at 100 Nm and up to ten percent in torque-free operation. This is the same as for the gear with a ratio of 46.128, but a five percent deviation only occurs at an input torque of 75 Nm and a ten percent deviation during towing operation. These slight deviations can be attributed to the changed speeds caused by the different gear ratios, especially since the load-independent losses significantly influence the efficiency in these load ranges. Thus, the comparatively high deviation of the measurement results in the lower efficiency map range, which is largely due to the lack of the modelling of the drag losses, the implementation of which is currently still a current research topic point.

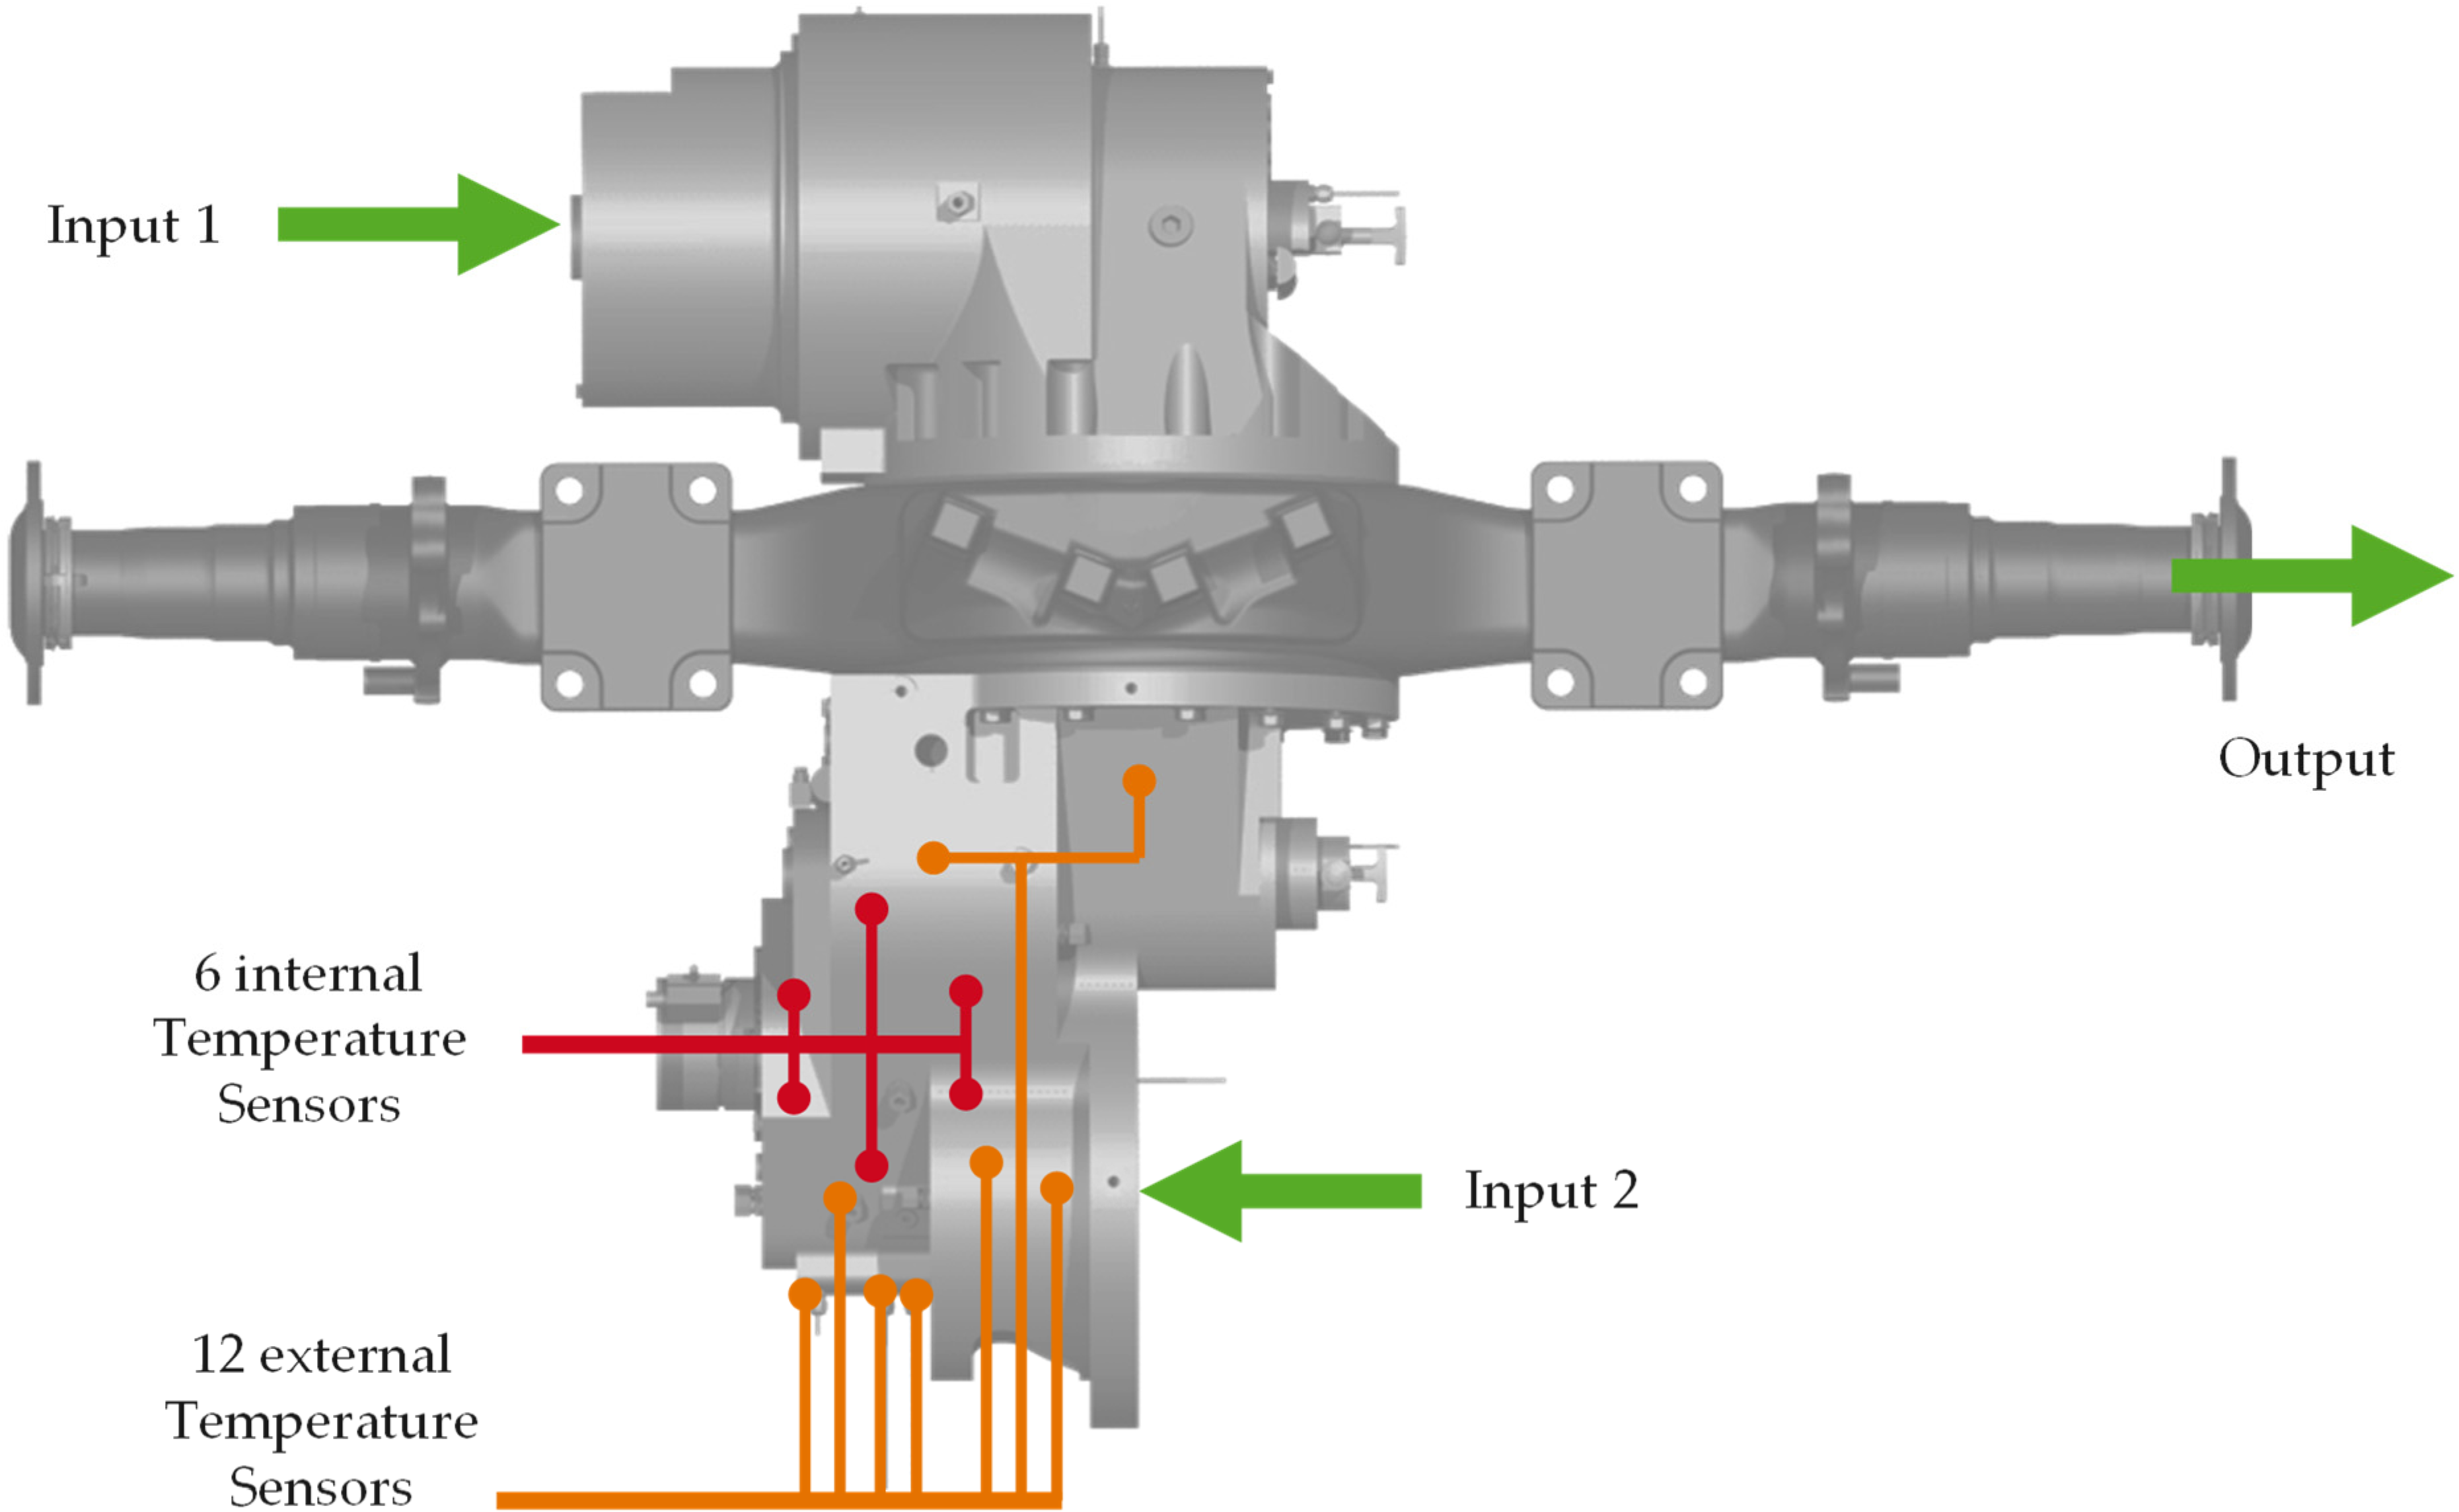
3.2. Thermal Modelling and Measurement Results

Alongside the efficiency measurement of the gearbox, a thermal characterization was also carried out. For this purpose, the load cases listed in Table 1 were recorded in a steady state. Each of these load cases was held for 30 min. Then, the gearbox was cooled down to its initial state; therefore, the measurement of the following load case could be carried out with approximately the same initial state. However, slight deviations due to different initial temperatures of the individual cannot be avoided due to the test setup.
Input torques of 100, 200 and 300 or 400 Nm were run in both gears, depending on the total power applied. For the gear with a ratio of 14.847, input speeds of 2500, 5000 and 7500 rpm were used to represent the wide range of driving speeds of this gear. In the gear with the ratio of 46.128, which was designed for the starting maneuvers, only 2500 and 7500 rpm were used as engine speeds, as this gear only covers a comparatively lower speed range. The inlet of the injected oil was always kept at a constant 50 °C; therefore, its influence as the primary heat transporter could be specifically demonstrated. For this purpose, the injection temperatures were changed to 40 °C and 60 °C at individual load points. This also allowed the influence on the inertia of the thermal system to be traced.
Figure 10 shows the result of such a thermal characterization for the load case of 5000 1/min input speed 400 Nm input torque and 50 °C oil injection temperature in the gear with the transmission ratio of 14.847 and with its simulation superimposed. In this illustration, the three thermal accounts of a bearing inner ring, a gear tooth and a housing segment for the second gearbox shaft are shown. When designing the prototype, the integration of temperature sensors in the rotating gearbox elements for their thermal measurement was feasible in this shaft due to the gearbox layout.
Although the end temperature deviation of the bearing is about ten degrees celsius, the simulated temperatures of the gear tooth and the housing segment show good accordance with the measured temperatures. Since the gearbox was not always cooled down to the ambient temperature between test runs, there are more significant temperature differences for 0 s ≤ 100 s. To derive a statement about the thermal inertia of the system despite this transient, the gradient of the temperature increase was introduced as an evaluation variable and is shown in Figure 11.
However, since the first 100 s of the measured values are needed for the system to stabilize, the time when the system has already reached 50% of the final temperature is selected as the starting point. Starting from this point, the gradients for 35% and 85% of the remaining 50% are determined according to Equations (1)–(6). These are evaluated as characteristic values in the following.
An average value of the last five percent of the test time is chosen as the final temperature for this calculation to not give too much weight to any measurement deviations of a single measuring point. The minimum system temperature results in the initial temperature delta according to Equation (1).
Δ T m i n e n d = T e n d T m i n
Subsequently, the final temperature differences are determined:
Δ T m i n e n d , 50 = 0.5 ( T e n d T m i n )
Δ T 50 e n d , 35 = 0.35 Δ T m i n e n d , 50
Δ T 50 e n d , 85 = 0.85 Δ T m i n e n d , 50
The characteristic time intervals are then calculated by:
Δ t 50 e n d , 35 = t ( T m i n + Δ T m i n e n d , 50 + Δ T 50 e n d , 35 ) t ( T m i n + Δ T m i n e n d , 50 )
Δ t 50 e n d , 85 = t ( T m i n + Δ T m i n e n d , 50 + Δ T 50 e n d , 85 ) t ( T m i n + Δ T m i n e n d , 50 )
The key temperature parameter and the key time parameters are equally calculated for the simulation. For example, if the measured temperature course is steeper than the simulated, the key time intervals are shorter for the measurements than for the simulations. Figure 12 illustrates the comparison of the final temperatures between the simulation and the experiment in the left-hand diagram, and the right-hand graph shows the inertia based on the time interval for reaching   Δ t 50 e n d , 35 and Δ t 50 e n d , 85 .
For the ideal case of precise temperature prediction, all points in the diagram on the left would lie on the origin line drawn in. The two additional straight lines in the diagram indicate a deviation of ten percent. If points within the diagram lie above the origin diagonal, the simulation temperatures are higher than the measured temperatures, and if the points lie below the straight line, the simulated temperatures are lower than the measured temperatures. The graph shows that the majority of the determined values are within a ten percent deviation. This corresponds to a deviation of between 1.5 and 4.5 °C at the temperature level considered. This value is to be emphasised as a positive result, especially in comparison with the currently established approach of ISO TR 14179, since ISO-TR-14179 provides one system and one housing temperature as a result, and deviations of up to 10 °C are specified in the ISO as the expected accuracy. The developed model thus allows the prediction of internal component temperatures with higher accuracy and thus represents a significant improvement compared to established approaches.
Figure 12 also shows that the simulated temperatures tend to be lower than the measured ones. On the one hand, this is due to the detailed design of the housing and its surrounding airflow and, on the other hand, to the already proven deviations of the loss modelling. A further source could be the thermocouples used, which have a relatively high measuring deviation compared to the measuring range with a tolerance of 1.5 K.
The evaluation of the system inertia in the right-hand diagram of Figure 12 is not part of the approach of ISO-TR-14179 and thus represents a new evaluation parameter for this type of system evaluation. It turns out that the inertia shows a wider deviation. On the one hand, this is due to the chosen modelling approach, as simplifications in the component geometry and oil distribution were assumed. On the other hand, only a small part of the heating curves could be evaluated when analyzing the inertia. Particularly, this is due to the transient response of the experimental setup in the first time ranges, which can therefore not be evaluated. Thus, for a reliable estimation of the system inertia, on the one hand, detailed modelling of the real constructional implementation is necessary, and on the other hand, the test stand setup needs to be modified in such a way that initial warm-up phases with lower transient behavior can also be utilized. Nevertheless, the approach already provided the possibility of carrying out an initial evaluation of the thermal behavior for the available scope of information and thus provided a substantially well-founded basis for decision making for the system developer without an in-depth design.

4. Conclusions and Outlook

In this paper, an overview of the validation of the method developed at the Institute for Automotive Engineering (ika) to evaluate transmission concepts is given. In the assessment of the loss modelling, it is shown that, even with the limited information available, a sufficiently good approximation of the measured losses could be given. The drag losses, which have been neglected, were only noticeable in areas of comparably low system performance. The evaluation of the thermal system properties based on this loss modelling was also able to provide a good approximation, particularly concerning the stationary end temperatures of the system. Deviations of a few degrees between the simulation model and the measurement were noted here. This is a promising result, especially considering the highly simplified housing within the simulation model, and thus provides a good supplement in identifying thermally critical system points. The evaluation of the thermal inertia, on the other hand, is afflicted with more significant deviations. In addition to the deviating housing design and the associated deviating thermal mass of the housing, deviations in the thermal masses of the shafts and gears due to the CAD design must also be considered as possible causes.
Recalculating the thermal model by scaling the loss components to the level of the measured losses led to a further improvement in the forecast for the final temperatures. The system inertia was also significantly improved by adjusting the thermal masses according to the CAD models. Thus, the function of the approach could be proven, but the use case of an early system evaluation does not allow such a system adaptation for the large number of systems considered. In summary, the loss calculation and the identification of the thermally critical components provide good results, and the modelling can therefore be considered validated for application within the ‘BEV Goes eHighway–[BEE]’. Consequently, valuable predictions of the vehicle characteristics can be derived for a large number of powertrain configurations.

Author Contributions

Conceptualization, R.U. and T.K.; methodology, R.U. and T.K.; software, R.U., T.K., S.K. and G.W.; validation, R.U.; formal analysis, R.U., T.K., S.K. and G.W.; investigation, R.U. and T.K.; resources, R.U.; data curation, R.U.; writing—original draft preparation, R.U.; writing—review and editing, T.K. and G.W.; visualization, R.U., T.K., S.K. and G.W.; supervision, L.E.; project administration, R.U.; funding acquisition, L.E. All authors have read and agreed to the published version of the manuscript.

Funding

This research was funded by the Federal Ministry of Economics and Climate Action (BMWK) grant number [16EM5003] and grant number [01MY17002B].

Data Availability Statement

Not applicable.

Acknowledgments

The authors want to thank the Federal Ministry of Economics and Climate Action (BMWK) for the funding of the project ‘BEV Goes eHighway—[BEE]’ (16EM5003), which offers a comprehensive application scenario for the methodology developed at the Institute for Automotive Engineering (ika), as well as the funding of the project ‘Concept ELV2’ (01MY17002B), which provided the data basis for the current application.

Conflicts of Interest

The Authors declare no conflict of interest.

References

  1. European Parliament and Council. Regulation (EU) 2019/1242 of the european parliament and of the council. Presented at the CO2 Emission Performance Standards for New Heavy-Duty Vehicles and Amending Regulations (EC) No 595/2009 and (EU) 2018/956 of the European Parliament and of the Council and Council Directive 96/53/EC, Brüssel, Belgium, 20 June 2019. [Google Scholar]
  2. ACEA. CO2 Emissions from Heavy-Duty Vehicles: Preliminary CO2 Baseline (Q3-Q4 2019) Estimate; European Automobile Manufacturers Association: Brüssel, Belgium, 2020. [Google Scholar]
  3. Rodríguez, F. The Future of Vecto: CO2 Certification of Advanced Heavy-Duty Vehicles in the European Union; The International Council on Clean Transportation: Berlin, Germany, 2019. [Google Scholar]
  4. Fiori, C.; Ahn, K.; Rakha, H.A. Power-based electric vehicle energy consumption model: Model development and validation. Appl. Energy 2016, 168, 257–268. [Google Scholar] [CrossRef]
  5. Earl, T. Analysis of Long Haul Battery Electric Trucks in EU: Marketplace and Technology, Economic, Environmental, and Policy Perspectives. Presented at 8th Commercial Vehicle Workshop, Graz, Austria, 17–18 May 2018. [Google Scholar]
  6. Wu, J.; Liang, J.; Ruan, J.; Zhang, N.; Walker, P.D. Efficiency comparison of electric vehicles powertrains with dual motor and single motor input. Mech. Mach. Theory 2018, 128, 569–585. [Google Scholar] [CrossRef]
  7. Ahssan, M.R.; Ektesabi, M.M.; Gorji, S.A. Electric Vehicle with Multi-Speed Transmission: A Review on Performances and Complexities. SAE Int. J. Alt. Power. 2018, 7, 169–181. [Google Scholar] [CrossRef]
  8. Gronwald, P.-O.; Kern, T.A. Traction Motor Cooling Systems: A Literature Review and Comparative Study. IEEE Trans. Transp. Electrific. 2021, 7, 2892–2913. [Google Scholar] [CrossRef]
  9. Geiger, J. Wirkungsgrad und Wärmehaushalt von Zahnradgetriebem bei instationären Betriebsbedingungen. Ph.D. Dissertation, Technische Universität München, München, Germany, 2014. [Google Scholar]
  10. Changenet, C.; Oviedo-Marlot, X.; Velex, P. Power Loss Predictions in Geared Transmissions Using Thermal Networks-Applications to a Six-Speed Manual Gearbox. J. Mech. Des. 2006, 128, 618–625. [Google Scholar] [CrossRef]
  11. Höhn, B.-R.; Michaelis, K. Influence of oil temperature on gear failures. Tribol. Int. 2004, 37, 103–109. [Google Scholar] [CrossRef]
  12. Kieninger, D. The Highly Integrated ModulED Drive Module–Holistic Concept Design. In Proceedings of the 20th International VDI Congress “Dritev”, Bonn, Germany, 24–25 June 2020. [Google Scholar]
  13. Kieninger, D.; Hemsen, J.; Köller, S.; Uerlich, R. Automated Design and Optimization of Transmissions for Electric Vehicles. MTZ Worldw. 2019, 80, 88–93. [Google Scholar] [CrossRef]
  14. Hemsen, J.; Negri, T.; Trost, C.; Eckstein, L. Comparison of Permanent Magnet Rotor Designs for Different Vehicle Classes and Driving Scenarios: A Simulation Study. SAE Int. J. Alt. Power. 2021, 10, 207–226. [Google Scholar] [CrossRef]
  15. Uerlich, R. Concept ELV2 Design of an Electric Drive Axle for Heavy Distribution Traffic. In Proceedings of the 30th Aachen Colloquium Sustainable Mobility, Aachen, Germany, 4–6 October 2021. [Google Scholar]
  16. Köller, S.; Uerlich, R.; Witham, G.; Eckstein, L. Concept ELV2—Development of an Electric Drive Axle for Heavy Commercial Vehicles, ELIV 2021; VDI Verlag: Düsseldorf, Germany, 2021; 653-XVI. [Google Scholar]
  17. Köller, S.; Schmitz, V. Systematic Synthesis and Multi-Criteria Evaluation of Transmission Topologies for Electric Vehicles. Automot. Engine Technol. 2022, 7, 65–79. [Google Scholar] [CrossRef]
  18. DIN ISO 6336:2019; Calculation of Load Capacity of Spur and Helical Gears (ISO_6336:2019). Beuth Verlag GmbH: Geneva, Switzerland, 2019.
  19. DIN ISO 21771:2014-08; Zahnräder_- Zylinderräder und Zylinderradpaare mit Evolventenverzahnung_- Begriffe und Geometrie (ISO_21771:2007). Beuth Verlag GmbH: Berlin, Germany, 2014.
  20. Naunheimer, H.; Bertsche, B.; Ryborz, J.; Novak, W.; Fietkau, P. Fahrzeuggetriebe; Springer: Berlin/Heidelberg, Germany, 2019. [Google Scholar]
  21. ISO/TC 60/SC 2. ISO/TR 14179-2:2001; Gears—Thermal Capacity—Part 2: Thermal Load-Carrying Capacity. Beuth Verlag: Berlin, Germany, 2001.
  22. Blok, H. Recent Developments in Gear Tribology. In Proceedings of the Institution of Mechanical Engineers, London, UK, 1 September 1969. [Google Scholar]
  23. Funck, G. Wärmeabführung bei getrieben unter quasistationären Betriebsbedingungen. Ph.D. Dissertation, Technische Universität München, München, Germany, 1985. [Google Scholar]
  24. Uerlich, R.; Koch, T.; Theising, H.; Eckstein, L. Method for thermal evaluation of automotive gearbox packages taking into account load point-dependent oil distribution. Automot. Engine Technol. 2022. [Google Scholar] [CrossRef]
Figure 1. V-model of the ika design methodology for electric powertrains.
Wevj 13 00142 g001
Figure 2. Urban delivery cycle of VECTO according to [1].
Wevj 13 00142 g002
Figure 3. Exemplary selection of considered gearbox topologies according to [16,17].
Wevj 13 00142 g003
Figure 4. Prototypical realised gearbox topology including ratios and CAD rendering of the prototypical electric drive axle [15,16].
Wevj 13 00142 g004
Figure 5. Simulative efficiency maps of the switchable gear stage of EM2 from Concept ELV2.
Wevj 13 00142 g005
Figure 6. Exemplary representation of the thermal node model for a gearbox section.
Wevj 13 00142 g006
Figure 7. Stepwise process of model generation and calculation of the thermal network.
Wevj 13 00142 g007
Figure 8. Measurement setup of the prototype for measuring the mechanical efficiency as well as the temperatures of 12 stationary and 6 rotating gearbox components.
Wevj 13 00142 g008
Figure 9. Measured efficiency maps of the prototype electric drive axle.
Wevj 13 00142 g009
Figure 10. Comparison of temperature curves for a gear tooth, an inner ring of a bearing and a housing segment.
Wevj 13 00142 g010
Figure 11. Key temperature and time parameters.
Wevj 13 00142 g011
Figure 12. Comparison of simulated key parameters versus measured key parameters for all load cases in Table 1.
Wevj 13 00142 g012
Table 1. Overview of load cases that were carried out on the test bench.
Gear
Ratio
Rot. Speed [1/min]Torque [Nm]Oil Temp.
[°C]
Gear
Ratio
Rot. Speed [1/min]Torque
[Nm]
Oil Temp.
[°C]
14.847250010040, 50, 6046.128250010050
250020040, 50, 60250020040, 50
250040050250030050
500010050750010050
500020040, 50, 60750020040, 50, 60
500040040, 50, 60750030040, 50
750010050
750020040, 50, 60
750030050
Publisher’s Note: MDPI stays neutral with regard to jurisdictional claims in published maps and institutional affiliations.

