Article

Battery Capacity Estimation Based on Incremental Capacity Analysis Considering Charging Current Rate

1
School of Automotive Studies, Tongji University, No. 4800 Caoan Road, Shanghai 201804, China
2
Clean Energy Automotive Engineering Center, Tongji University, No. 4800 Caoan Road, Shanghai 201804, China
*
Author to whom correspondence should be addressed.
World Electr. Veh. J. 2021, 12(4), 224; https://doi.org/10.3390/wevj12040224
Submission received: 25 September 2021 / Revised: 1 November 2021 / Accepted: 5 November 2021 / Published: 9 November 2021

Abstract

:
Incremental capacity analysis (ICA) is widely used in the battery decay mechanism analysis since the features of battery incremental capacity (IC) curves are closely related to battery aging and maximum available capacity. However, the traditional ICA method to estimate battery capacity mainly focuses on a single charging condition, and the influence of charging current on IC curves is ignored. In this paper, an adaptive capacity estimation method based on ICA considering the charging current is established. First, the charging experiments using different charging current rates under different battery aging statuses are designed and conducted. Then, the relationship between battery maximum available capacity, IC curve features, and charging current is investigated. Furthermore, the fitting method and data-driven method considering charging current are proposed and compared. Finally, the capacity estimation results prove the accuracy and adaptability of the proposed method.

1. Introduction

Lithium-ion batteries (LIBs) have been widely applied in electric vehicles because of their high energy/power density and low environmental impact [1]. However, due to the harsh working conditions and their inherent poor durability, LIBs must be assisted by an advanced battery management system (BMS), which can ensure the safe and reliable operation of LIBs. Battery capacity is an essential parameter in battery management technology and can indicate the battery health status and remaining useful life [2]. However, the nonlinear degradation of battery capacity due to the effect of inside and outside factors brings great challenges to capacity estimation.
Some effective battery capacity estimation methods have been proposed, including the state of charge (SOC) based method [3,4], the data-driven based method [5,6], and the incremental capacity analysis (ICA) based method [7,8]. Bartlett et al. [9] proposed a dual-nonlinear observer to estimate the SOC and capacity based on a reduced-order electrochemical mode, but the battery aging only considered the loss of cyclable lithium. Cheng et al. [10] proposed an adaptive square root unscented Kalman filter method to improve the SOC estimation accuracy based on a second-order equivalent circuit model. However, the effect of aging and temperature was not taken into account in the model. With the development of artificial intelligence, methods using machine learning [5,11] and deep learning [12,13] have drawn great interest and proved their effectiveness in battery capacity or state of health (SOH) estimation. Hu et al. [5] extracted five characteristics related to the capacity from the charge curve and used k-nearest neighbor regression to build a nonlinear kernel regression model. Wu et al. [12] applied control theory to assist the estimation of SOH, in which the SOH is treated as an internal state. Then, the certain system output data and battery SOH are modeled by the group method of a data handling polynomial neural network. Nevertheless, a great amount of experimental data is essential for the data-driven method, which is hard and time-consuming to acquire. Moreover, the quality of experimental data and the speed of the training process have a great influence on the estimation performance.
Facing the defects of the SOC based method and the data-driven based method, the ICA based method received more and more attention. It has been proved as an effective way to estimate the battery capacity. In addition, it is also considered as a good approach to study the battery fading mechanisms, since there is no need to damage the battery’s internal structure. IC curves are obtained by calculating the derivative of the charging/discharging capacity to battery voltage. The voltage plateaus caused by the electrode phase transition is then transferred into valleys and peaks on the incremental capacity (IC) curve, which is more intuitive and identifiable. The reduction, shift, or disappearance of the IC curves are employed to reveal the battery degradation and estimate capacity, which represents different electrochemical processes of the LIBs. However, it is also important to avoid the deformation of the IC curves caused by the polarization effect. Thus, a low charging/discharging current with C/25 is usually adopted in the experiment to ensure the equilibrium state. Overall, ICA is a promising method to estimate battery capacity [14].
The foundation of the capacity estimation based on ICA is to determine the features of IC curves, which have a strong relationship with battery capacity fading [15]. A universal capacity model based on the charging curve is proposed in Ref. [15], which established the correlation between SOH and the electrode phase transition. The feasibility and accuracy are verified on batteries of different types and aging statuses. In Ref. [14], the influence of sampling frequency on the IC curves was investigated, and the position of IC peaks was adopted to estimate battery capacity after obtaining the IC curves under different battery aging statuses. Furthermore, Weng et al. [16] employed ICA curves to characterize the aging behavior of LIBs, and further extended the SOH monitoring approach from single cells to battery modules or packs that have parallel-connected cells.
However, the traditional ICA method is limited by the charging condition, such as charging current, charging temperature, or initial SOC, which have a severe influence on ICA [8], while previous ICA studies mainly focused on the standard charging condition (charging from 0% SOC with a 0.5 C current at 25 °C, 1 C = 2.75 A). Therefore, it is necessary to study the IC curve characteristics under different charging conditions to improve the adaptability of the ICA method. This paper will mainly focus on the impact of charging current rate on IC curve features, and further propose an adaptive ICA method to estimate battery capacity. In order to achieve the research goal, we have conducted a series of experiments and introduced two different methods to fit the relationship between the capacity and IC curve features. The final results show a great improvement compared with the traditional method.
The specific work is organized as follows: Section 2 introduces the battery experiments and the IC curve characteristics under different charging current rates. Section 3 proposes two different methods to obtain the relationship between battery capacity and picked IC curve characteristics. Then, the feasibility of the two methods is proved. Section 4 further performs a comparison between the accuracy of the two improved methods and the traditional method by qualitative and quantitative analysis. Some conclusions and summarizations are provided in the final section.

2. Experiment Design and IC Curve Characteristic Analysis

2.1. Battery Experiments

A kind of commercial NCM/graphite cylindrical battery with a rated capacity of 2750 mAh and a nominal capacity of 2900 mAh is used in this study. The battery charge and discharge cut-off voltage are 4.2 V and 2.5 V, respectively. The recommended charging temperature ranges from 0 °C to 45 °C. The experiment setups include a battery charge and discharge system, a temperature measurement station, an environmental chamber, and a host computer, as shown in the following Figure 1.
To obtain the relationship between IC features, capacity fading, and charging current rate, some charging experiments are designed and conducted. The specific experimental steps are shown in Table 1. Considering the 0.5 C charging current is relatively large for vehicular application, this study focuses on charging current rates smaller than 0.5 C, and includes the charging experiments of 0.1 C, 0.2 C, 0.3 C, 0.4 C, and 0.5 C. It should be noted that the charging experiment is performed periodically during the battery accelerated aging test.

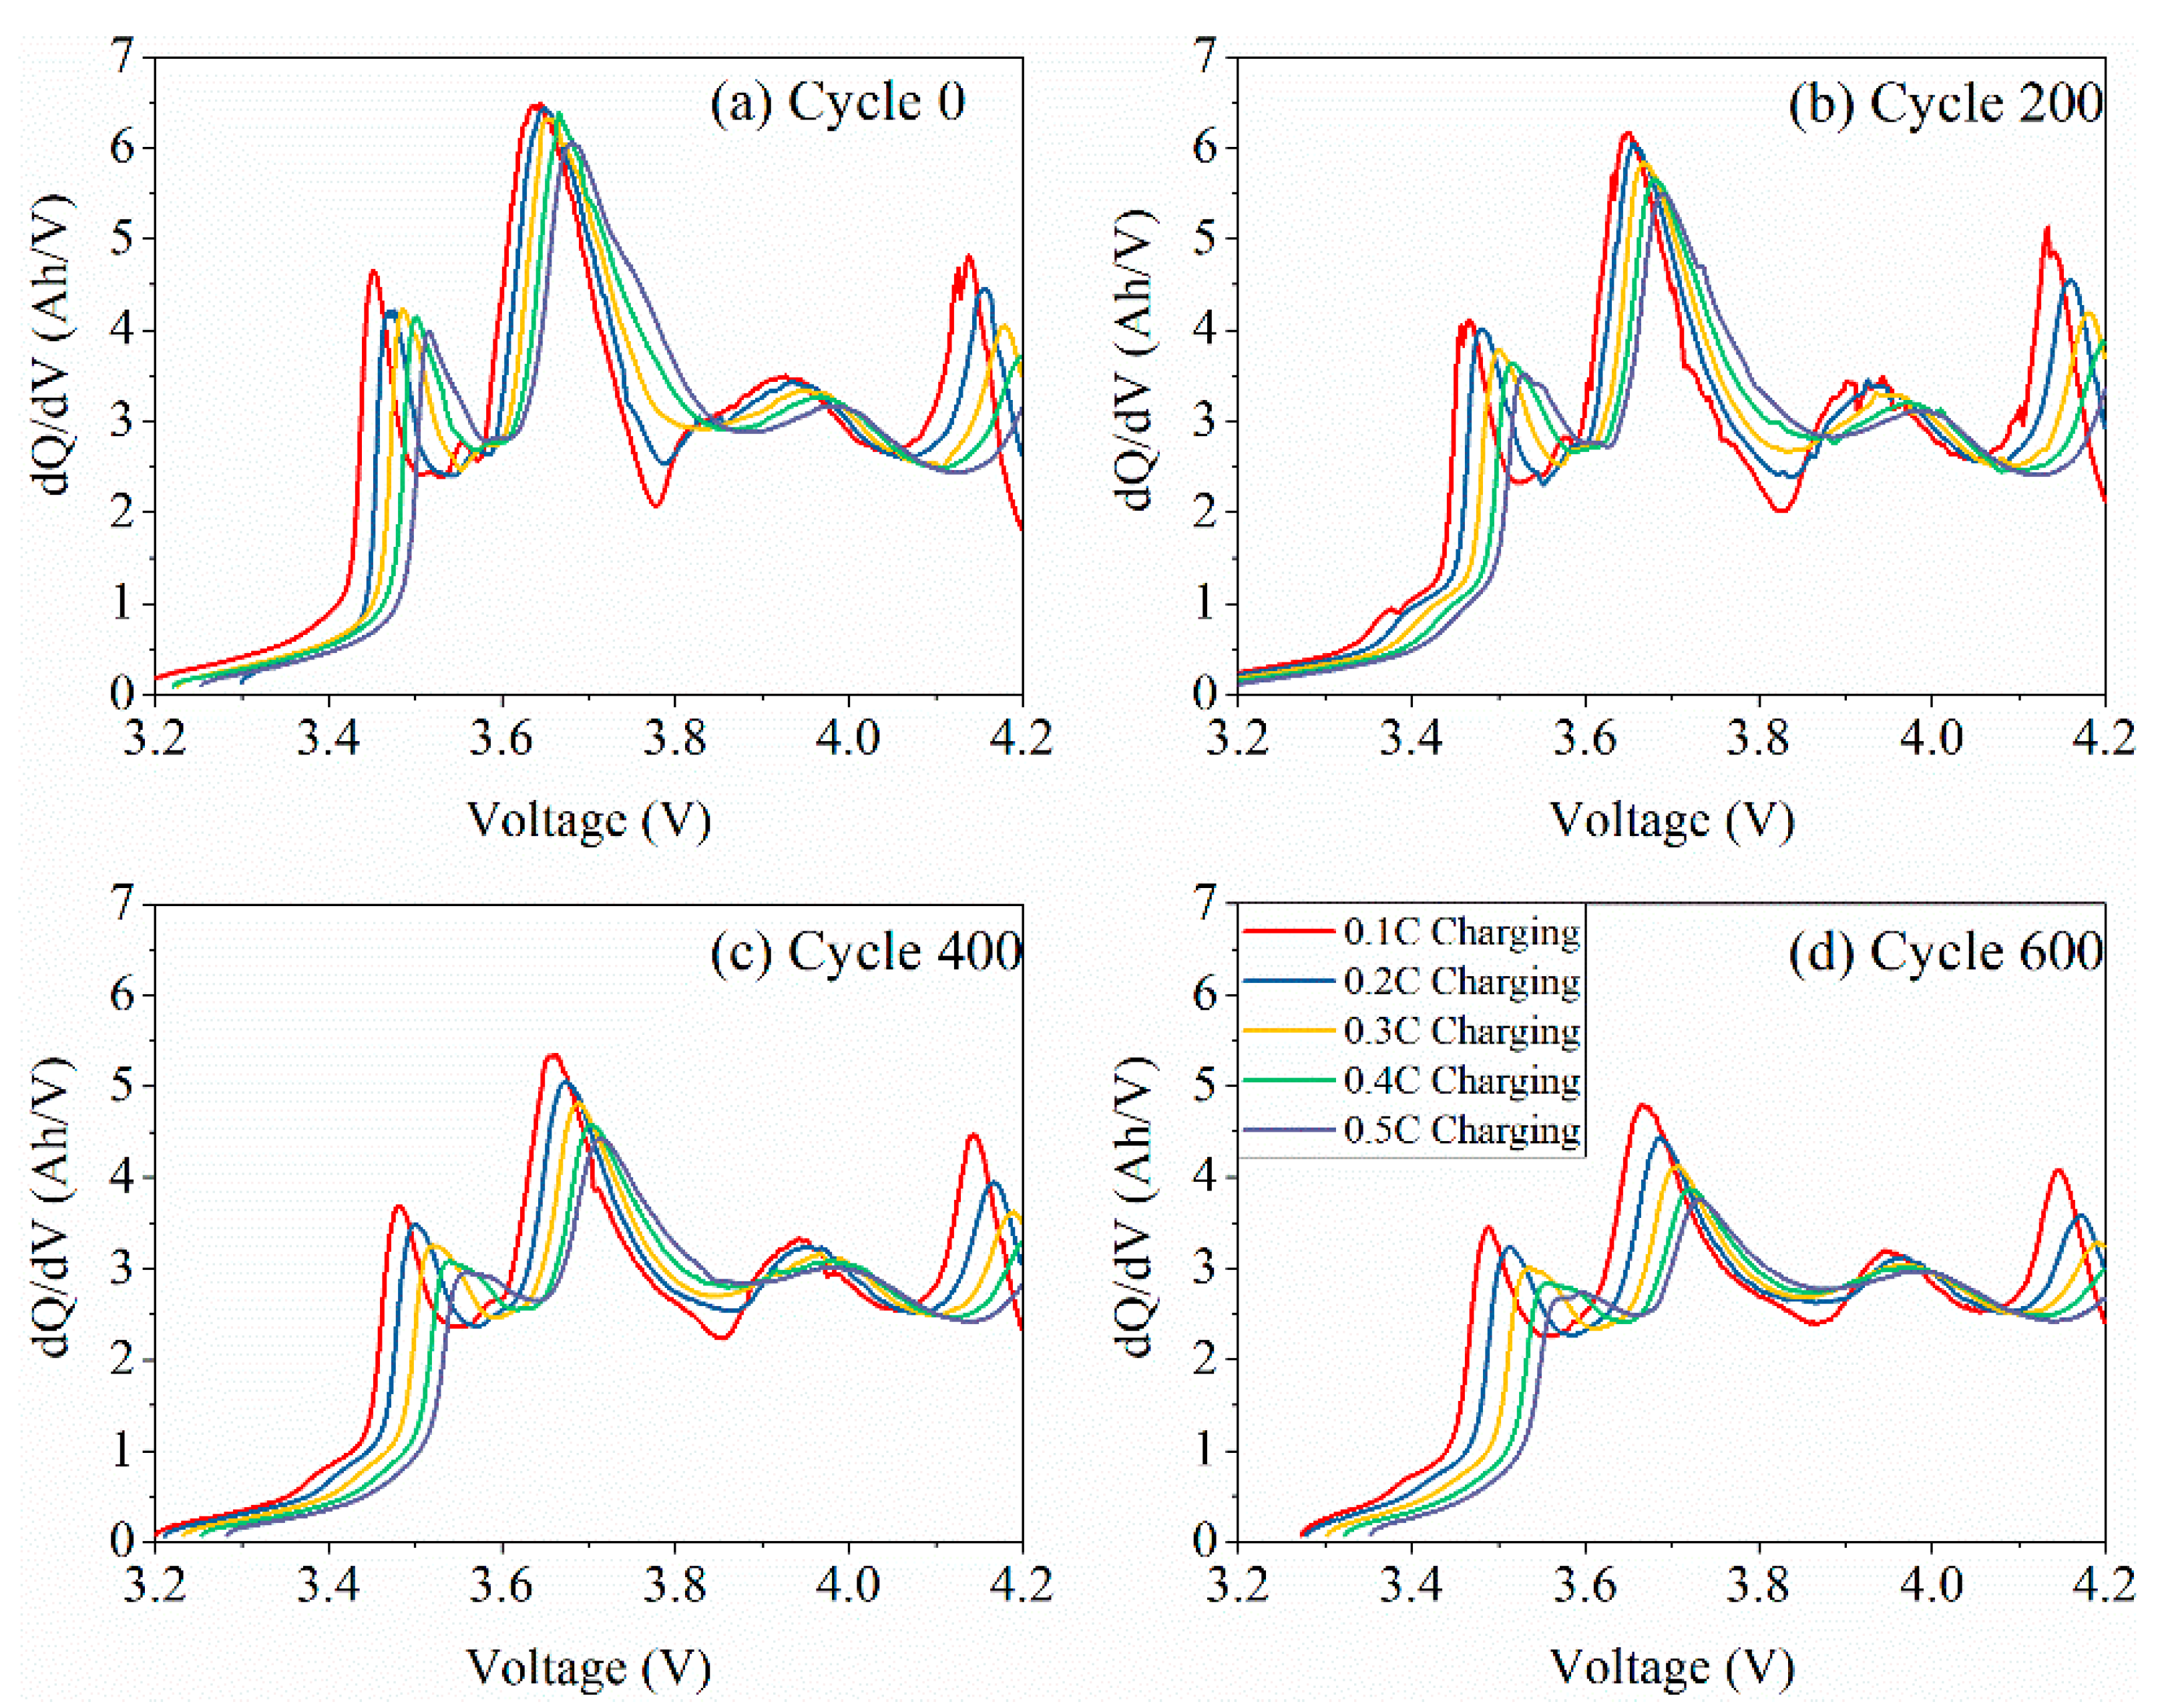
2.2. Battery IC Curve Characteristics with Different Current Rates

Traditionally, the numerical derivative method is adopted to acquire IC curves. According to the definition of ICA, the charging capacity divided by terminal voltage change within the equal voltage interval (EVI) or equal time interval (ETI) is the IC value. The acquisition of IC curves through the numerical derivative method can adopt the following equation.
{ EVI :   IC = d Q c d V c Δ Q c Δ V c = Q c , 2 Q c , 1 Δ V c ETI :   IC = d Q c d V c Δ Q c Δ V c = i c Δ t V c , 2 V c , 1
However, the IC curve will be severely affected by the selected voltage or time interval. Therefore, it is necessary to adopt a proper filter to obtain a smooth IC curve. In our previous study [8], a fast acquisition method for IC curves is proposed, and in this paper, we still use the Kalman filter (KF) method to smooth IC curves.
Based on the KF method mentioned above and the experimental data obtained in Section 2.1., IC curves with the different charging current rates at different aging cycles are obtained, as shown in Figure 2.
Overall, the shape of the IC curves with the same charging current is basically the same under different aging cycles. However, the location and intensity of curves change under different charging current rates. With the decrease in the charging current, the IC curves have a moving trend to low voltage. For cycle 0, every peak or valley moves about 0.1 V left as the charging current decreases from 0.5 C to 0.1 C. Additionally, the fourth peak is shown around 4.15 V when the current is less than 0.3 C. Moreover, when the battery SOH is high and the charging current is low, as shown in Figure 2a, b, a smaller peak is generated at 3.6 V. Therefore, the charging/discharging process with extremely low current is essential for the analysis of the battery degradation mechanism in detail. In addition, it can be seen that with the decrease in the charging current, the height of all peaks increases, and the height of the valleys decreases. Taking the second peak around 3.7 V as an example, for 0, 200, 400, and 600 cycles, the height of the peak increases by 0.43, 0.67, 0.92, and 1.04, respectively, when the current decreases from 0.5 C to 0.1 C. It is also noteworthy that, the more serious the aging status of the battery, the greater the IC curves of the battery affected by the charging current. As the SOH decreases, the fluctuation of the curves becomes flat. When the highest peak of IC curves under 0.1 C is 6.5 Ah/V for cycle 0, it only reaches 4.8 Ah/V for cycle 600. Thus, taking the coupling effect of aging and charging current to IC curve characteristics into consideration is helpful for expanding the adaptability of the ICA method in capacity estimation.

3. Development of Battery Capacity Estimation Considering Charging Current

3.1. Capacity Estimation Based on the Fitting Method

Based on the analysis in Section 2.2, the relationship between IC curve characteristics and capacity under different current rates can be fitted for capacity estimation. In this paper, we adopt the height of the IC peaks to estimate the battery capacity. The peaks are associated with the phase transition process in the positive and negative electrodes, as discussed in Refs. [17,18,19]. Basically, capacity fading is mainly caused by the loss of lithium inventory (LLI), the loss of active material (LAM), and resistance increase during the phase transition process. However, which aging factors dominate depends on the specific using conditions of the battery. The area under each peak represents the charging capacity during the corresponding phase change process. The decrease in the peak value means LAM of the negative electrode. If a certain peak loses more proportion than the others, it indicates that LLI also happens. Additionally, the moving trend towards high voltage means that the plateau voltage corresponding to each phase transition process has a significant increase, indicating that the internal resistance has increased. Here, because peak II around 3.7 V and peak III around 3.9 V have a strong correlation with the battery capacity under all current rates, as shown in Figure 3, these two features will be employed for the ICA based estimation method. As analyzed before, it can be found that LAM and resistance increase happened during both the phase transition process of peak II and peak III. In addition, LLI also happened in peak II after cycle 400.
The linear relationship between the battery capacity and the features can be established with the following equation:
C F i = α i × H F i + β i
where i represents the ith IC feature, C F i represents the estimated capacity according to the ith feature. H F i represents the identified height of the ith feature. The corresponding coefficients α i and β i with different currents are listed in Table 2.
From Table 2, we can observe that almost all R2 of the coefficients of peak II and peak III are greater than 0.95, which indicates the high correlation between the coefficients and capacity. In addition, it can be found that for peak II, the value of α 1 gradually drops as the charging current increases, while that of β 1 shows an increasing trend. The coefficients of peak III show a complete opposite change rule. From Figure 4 below, we can have a more intuitive understanding of the regular.
The relationship can be fitted by nonlinear functions shown in the Equations (3) and (4).
{ α 1 = 0.635 × C 2 0.493 × C + 0.257 β 1 = 3.640 × C 2 + 3.14087122 × C + 1.2083
{ α 2 = 3.910 × C 2 0.388 × C + 0.883 β 2 = 11.5161 × C 2 + 1.585 × C 0.323
Finally, we can obtain the estimated capacity with the following steps: first, two groups of coefficients α i and β i corresponding to two characteristics under different charging current rates are calculated using Equations (3) and (4). Secondly, the estimated capacity of two characteristics under a specific charging current can be acquired by substituting the coefficients into Equation (2). Lastly, the average of two results will be considered as the final estimated capacity.

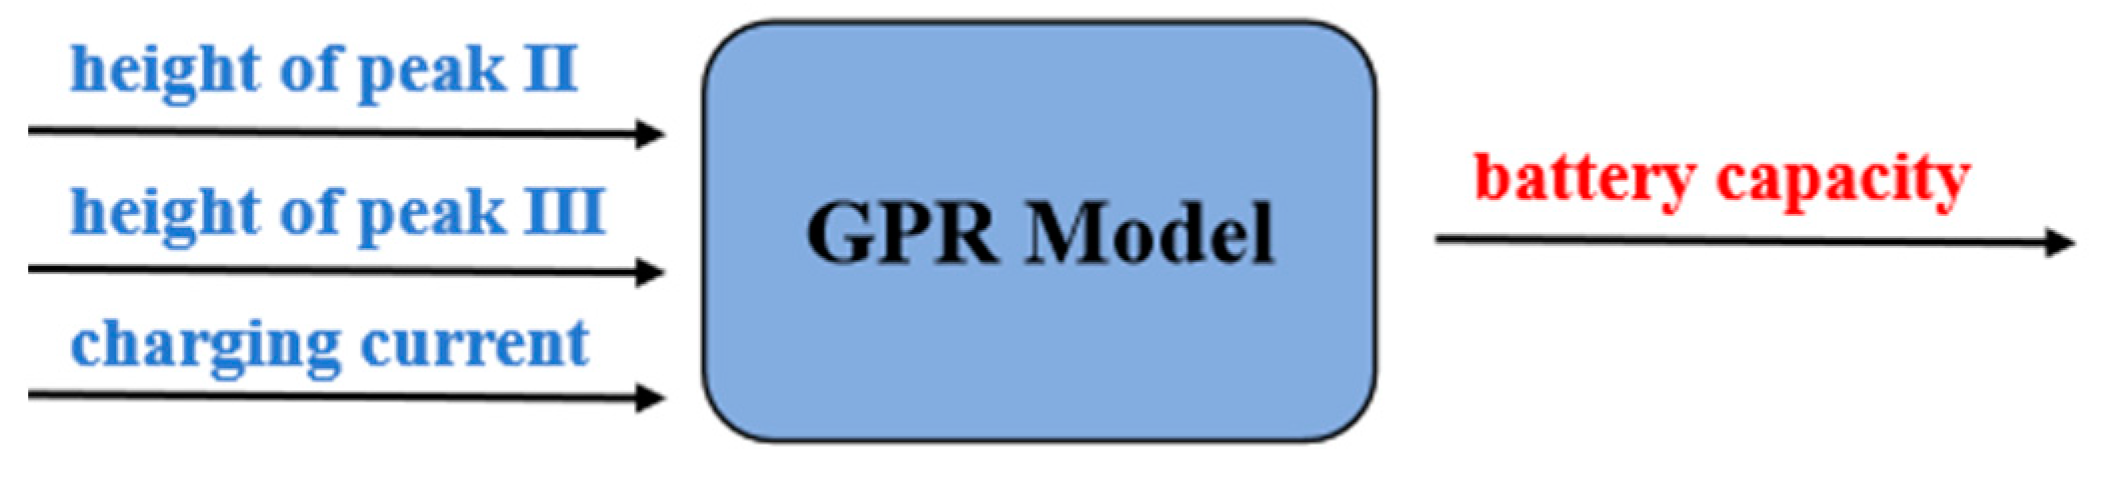
3.2. Capacity Estimation Based on the Data-Driven Method

In the previous method, there are two error sources: one comes from the fitting process of the linear relationship between the battery capacity and the features, the other comes from the fitting process of the coefficients and the charging current. In order to further improve the precision of the estimation, we adopted a data-driven Gaussian process regression (GPR) [20] method to acquire the relationship among the capacity, IC curve features, and charging current directly. GPR is a machine learning regression method based on statistical mathematics theory. It is a probabilistic machine learning method that can avoid local optima during parameter optimization, and can also solve nonlinear or high-dimension problems. The procedure of the GPR method is explained as follows:
First, consider the training set
D ( x i , y i ) ,     i = 1 , 2 , , n
where xi and yi represent the input and output data.
Pretend that there is a function f (·), which maps the input value xn to output value yn, as written in Equation (6):
y n = f ( x n ) + ξ n
where the value of noise ξn follows the Gaussian process ξn ~N(0, σn2).
Here, we use squared exponential kernel functions as the kernel of the GPR model, as written in Equation (7):
k s ( x i , y i ) = l 2 e [ 1 2 d = 1 D ( x i d x j d w d ) 2 ]
where l = [l0, l1,… ld] denotes hyperparameter in the kernel function. Substituting Equation (7) into Equation (6), we can obtain Equation (8).
k ( x i , y i ) = k s ( x i , y i ) + σ n 2 δ i , j
Therefore, the distribution of output y follows:
p ( y | f , X ) = N ( f , σ n 2 l )
Using maximum likelihood estimation to find the hyperparameters of the kernel function of the formula, we finally determine the kernel function:
l o g p ( y | X , θ ) = 1 2 y T ( k + σ n 2 l ) 1 y 1 2 l o g | k + σ n 2 l | N 2 l o g 2 π
Therefore, the combined distribution of the training output and the test output can be expressed as:
p ( y , y ε | X , y , x ε θ ) = n ( [ 0 0 ] , [ k + σ n 2 l k ε k ε T k ε ε + σ n 2 ] )
where the mean and covariance of the predicted distribution are as follows:
μ ε = k ε T ( K + σ n 2 l ) 1 y
Σ ε = σ n 2 + k ε ε k ε T ( K + σ n 2 l ) 1 k ε
The mean value of the predicted distribution in Equation (11) is actually the estimation value of the output.
Here, the training inputs of the GPR model are the charging current and the heights of peak II and peak III, and capacity obtained from the experiment is used as the test output, as shown in Figure 5. The training output showed a high precision with a training error under 0.8% in most conditions. Only in the situation of high aging cycles under 0.1 C is the error relatively high, ranging from 0.8% to 1.4%. Thus, it is feasible to use the model for the capacity estimation.

4. Verification Results and Discussion

4.1. Comparison of the Estimation Accuracy between the Fitting and Data-Driven Methods

In order to validate the effectiveness and further compare the accuracy of the two proposed methods, we also performed the same experiments on another battery. The estimation results are shown in Figure 6, and we can figure out that the capacity estimation error of the data-driven method is much lower than the fitting method in most conditions, which indicates better estimation accuracy. The maximum estimation error difference between the two methods is up to 2%. Additionally, it can be observed that the estimation errors of the two methods both increase with the battery aging in general. From the aspect of charging current, the error of the two methods shows a downward trend with increasing of the current rate. It is noteworthy that the GPR method has more stable performance in the whole lifecycle. For example, the error of the fitting method fluctuates from 2.0% to 0.09%, while that of the data-driven method is much lower, ranging from 0.7% to 0.2% under a 0.3 C charging current.
In order to have a quantitative analysis of the two methods, we further observed average error and the root mean squared error (RMSE) of the two methods during the whole lifecycle, as shown in Table 3. We can tell that both the average error and RMSE of the data-driven method are better than that of the fitting method. While the average error of the fitting method remains above 1% and achieves 3.9% under 0.1 C, the data-driven method shows the improvement of precision up to 1%. Similar results can be obtained in terms of RMSE. Thus, the data-driven method is effective in the corrected ICA method.

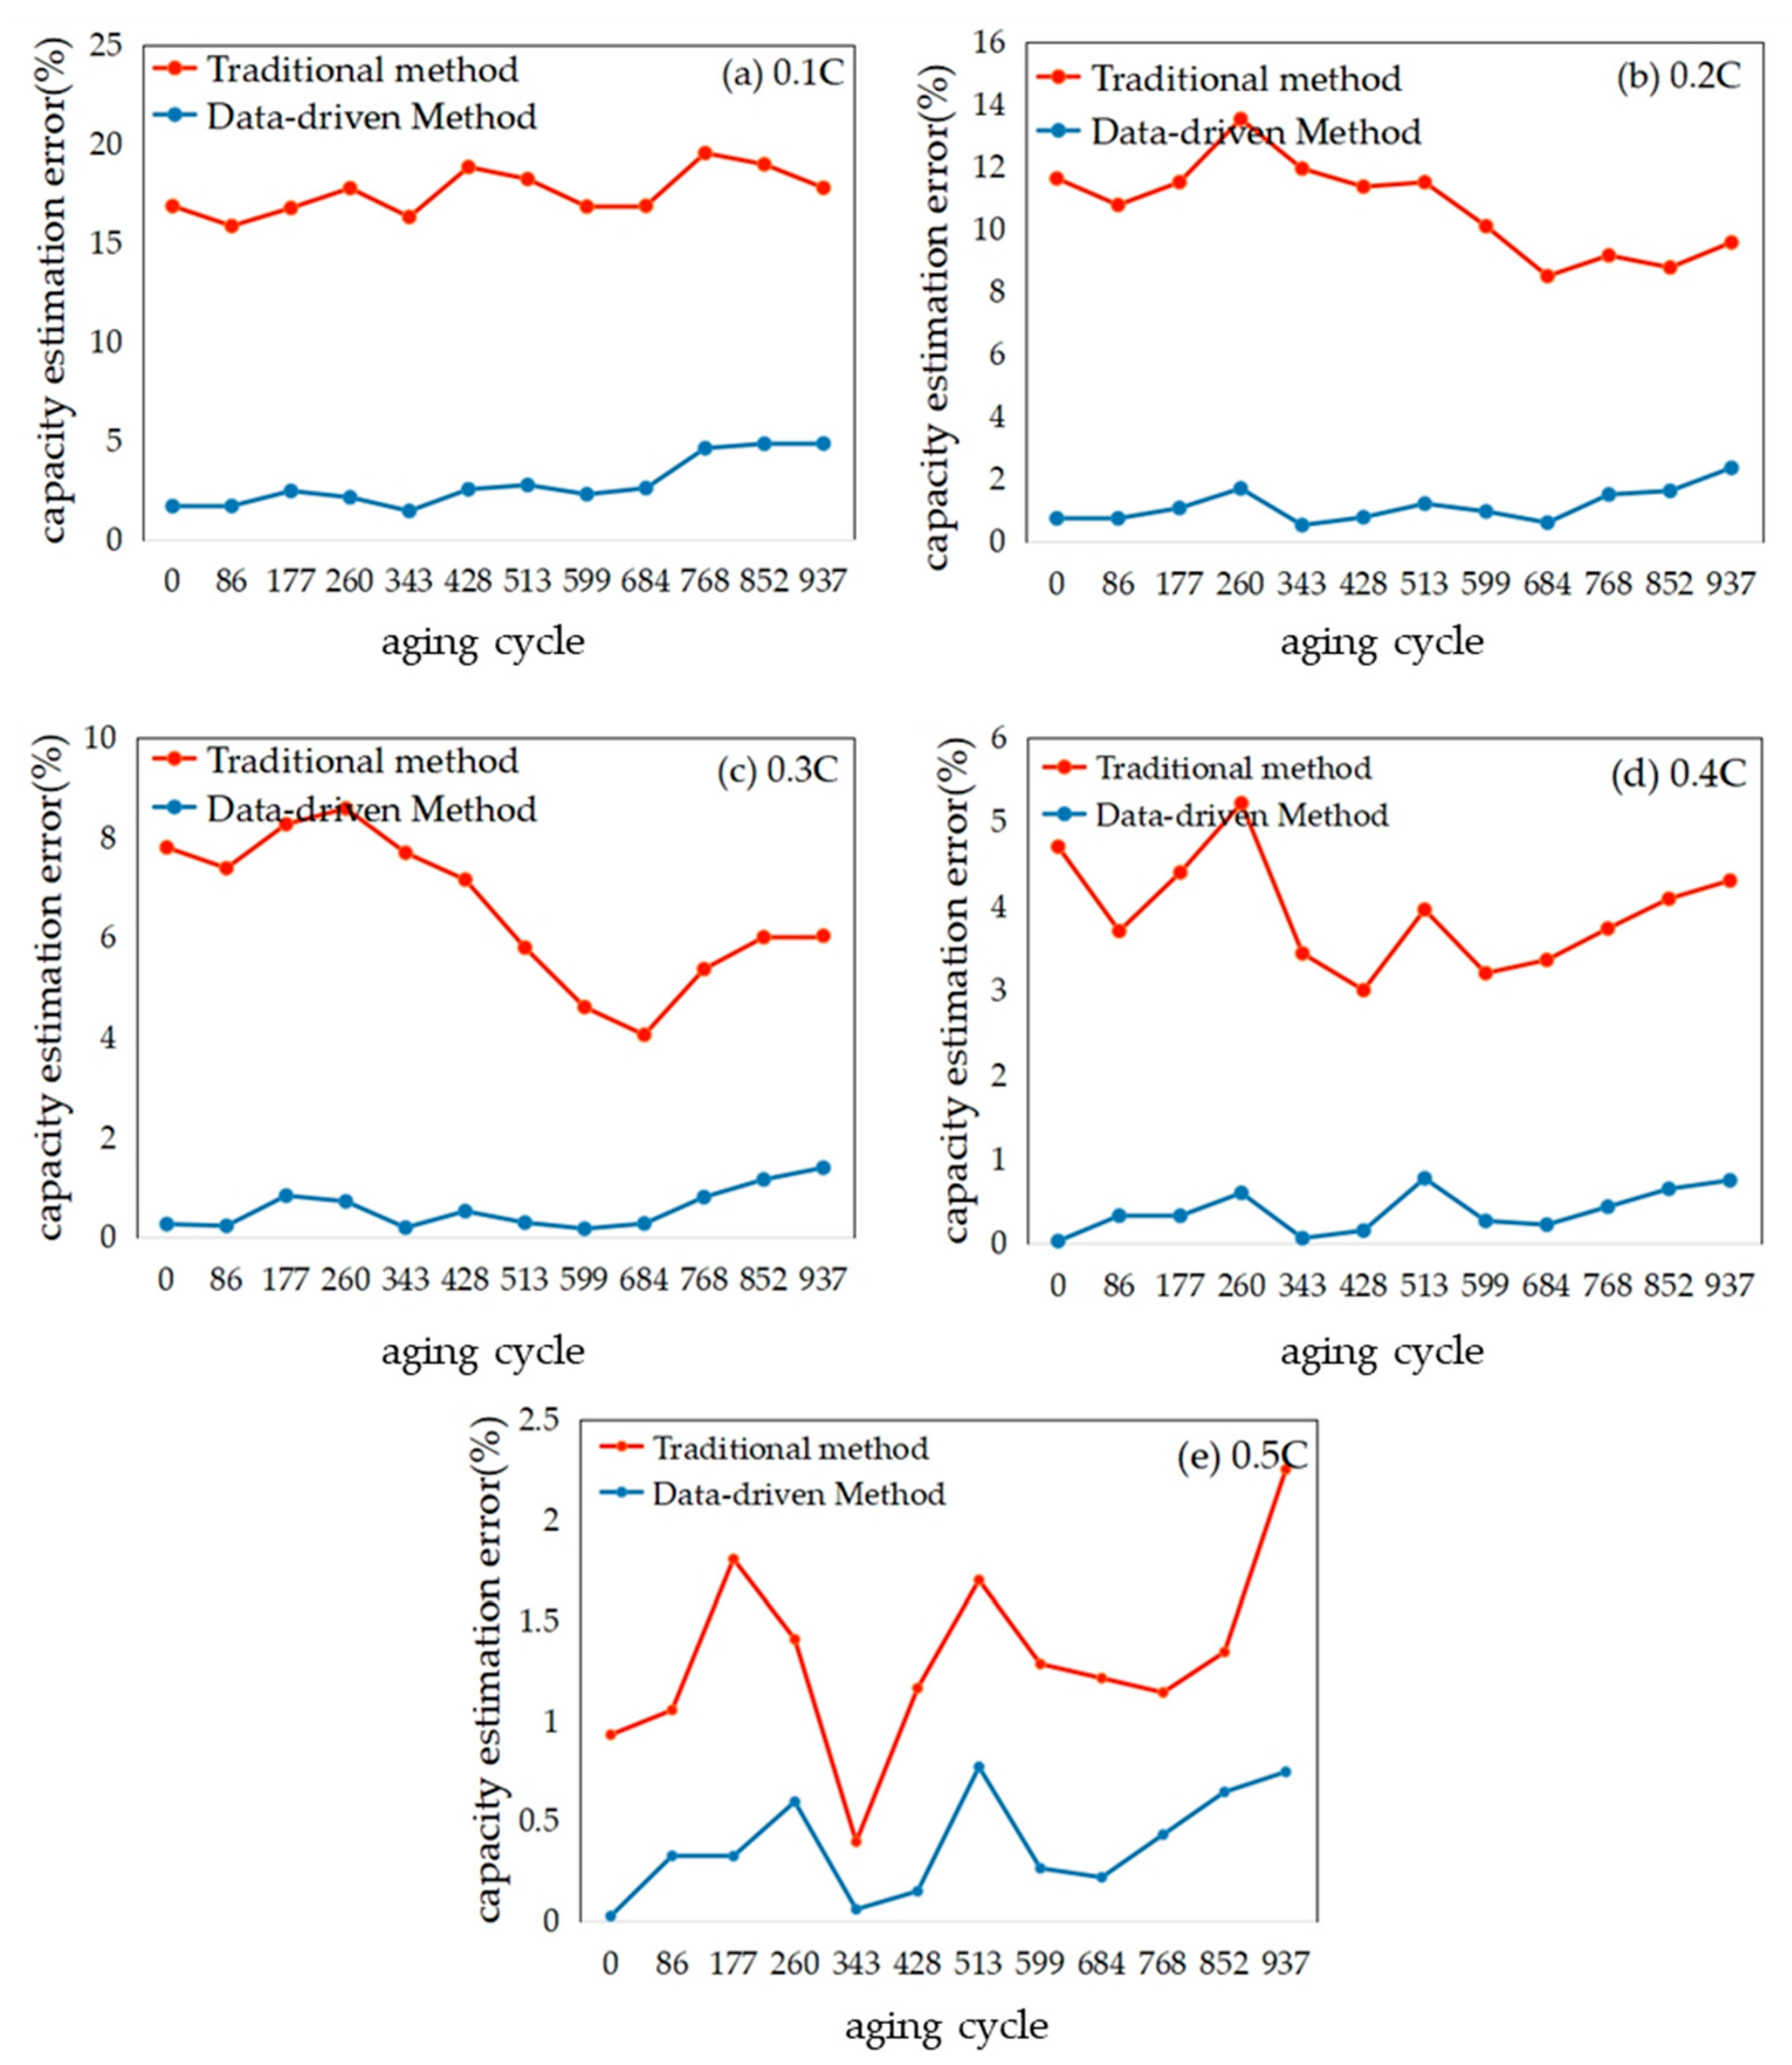
4.2. Comparison of the Accuracy between the GPR Method and Traditional Method

Figure 7 shows an intuitive comparison of the data-driven method and traditional method in the whole life cycle of the battery. Here, the traditional method employs the data under 0.5 C in Table 2 to estimate capacity without considering the charging current. It is confirmed that the proposed method is effective. Compared with the traditional method, the precision of the improved method considering charging current has an improvement of up to 15.175%. In addition, the smaller the charging current is, the bigger the improvement will be. For the method ignoring charging current, the error ranges from around 19.5% under 0.1 C to 0.39% under 0.5 C. Although the accuracy of the proposed method also reduces slightly with the decrease in charging current, the variation of the error is still within an acceptable range, not more than 5.6%. It is worth noting that the estimation accuracy no longer has a linear relationship with the charging current compared with the traditional method, which means the robustness to current interference has improved. During the whole life cycle, the estimation precision also remains at a high level; thus, the proposed method also has good adaptability to capacity attenuation.

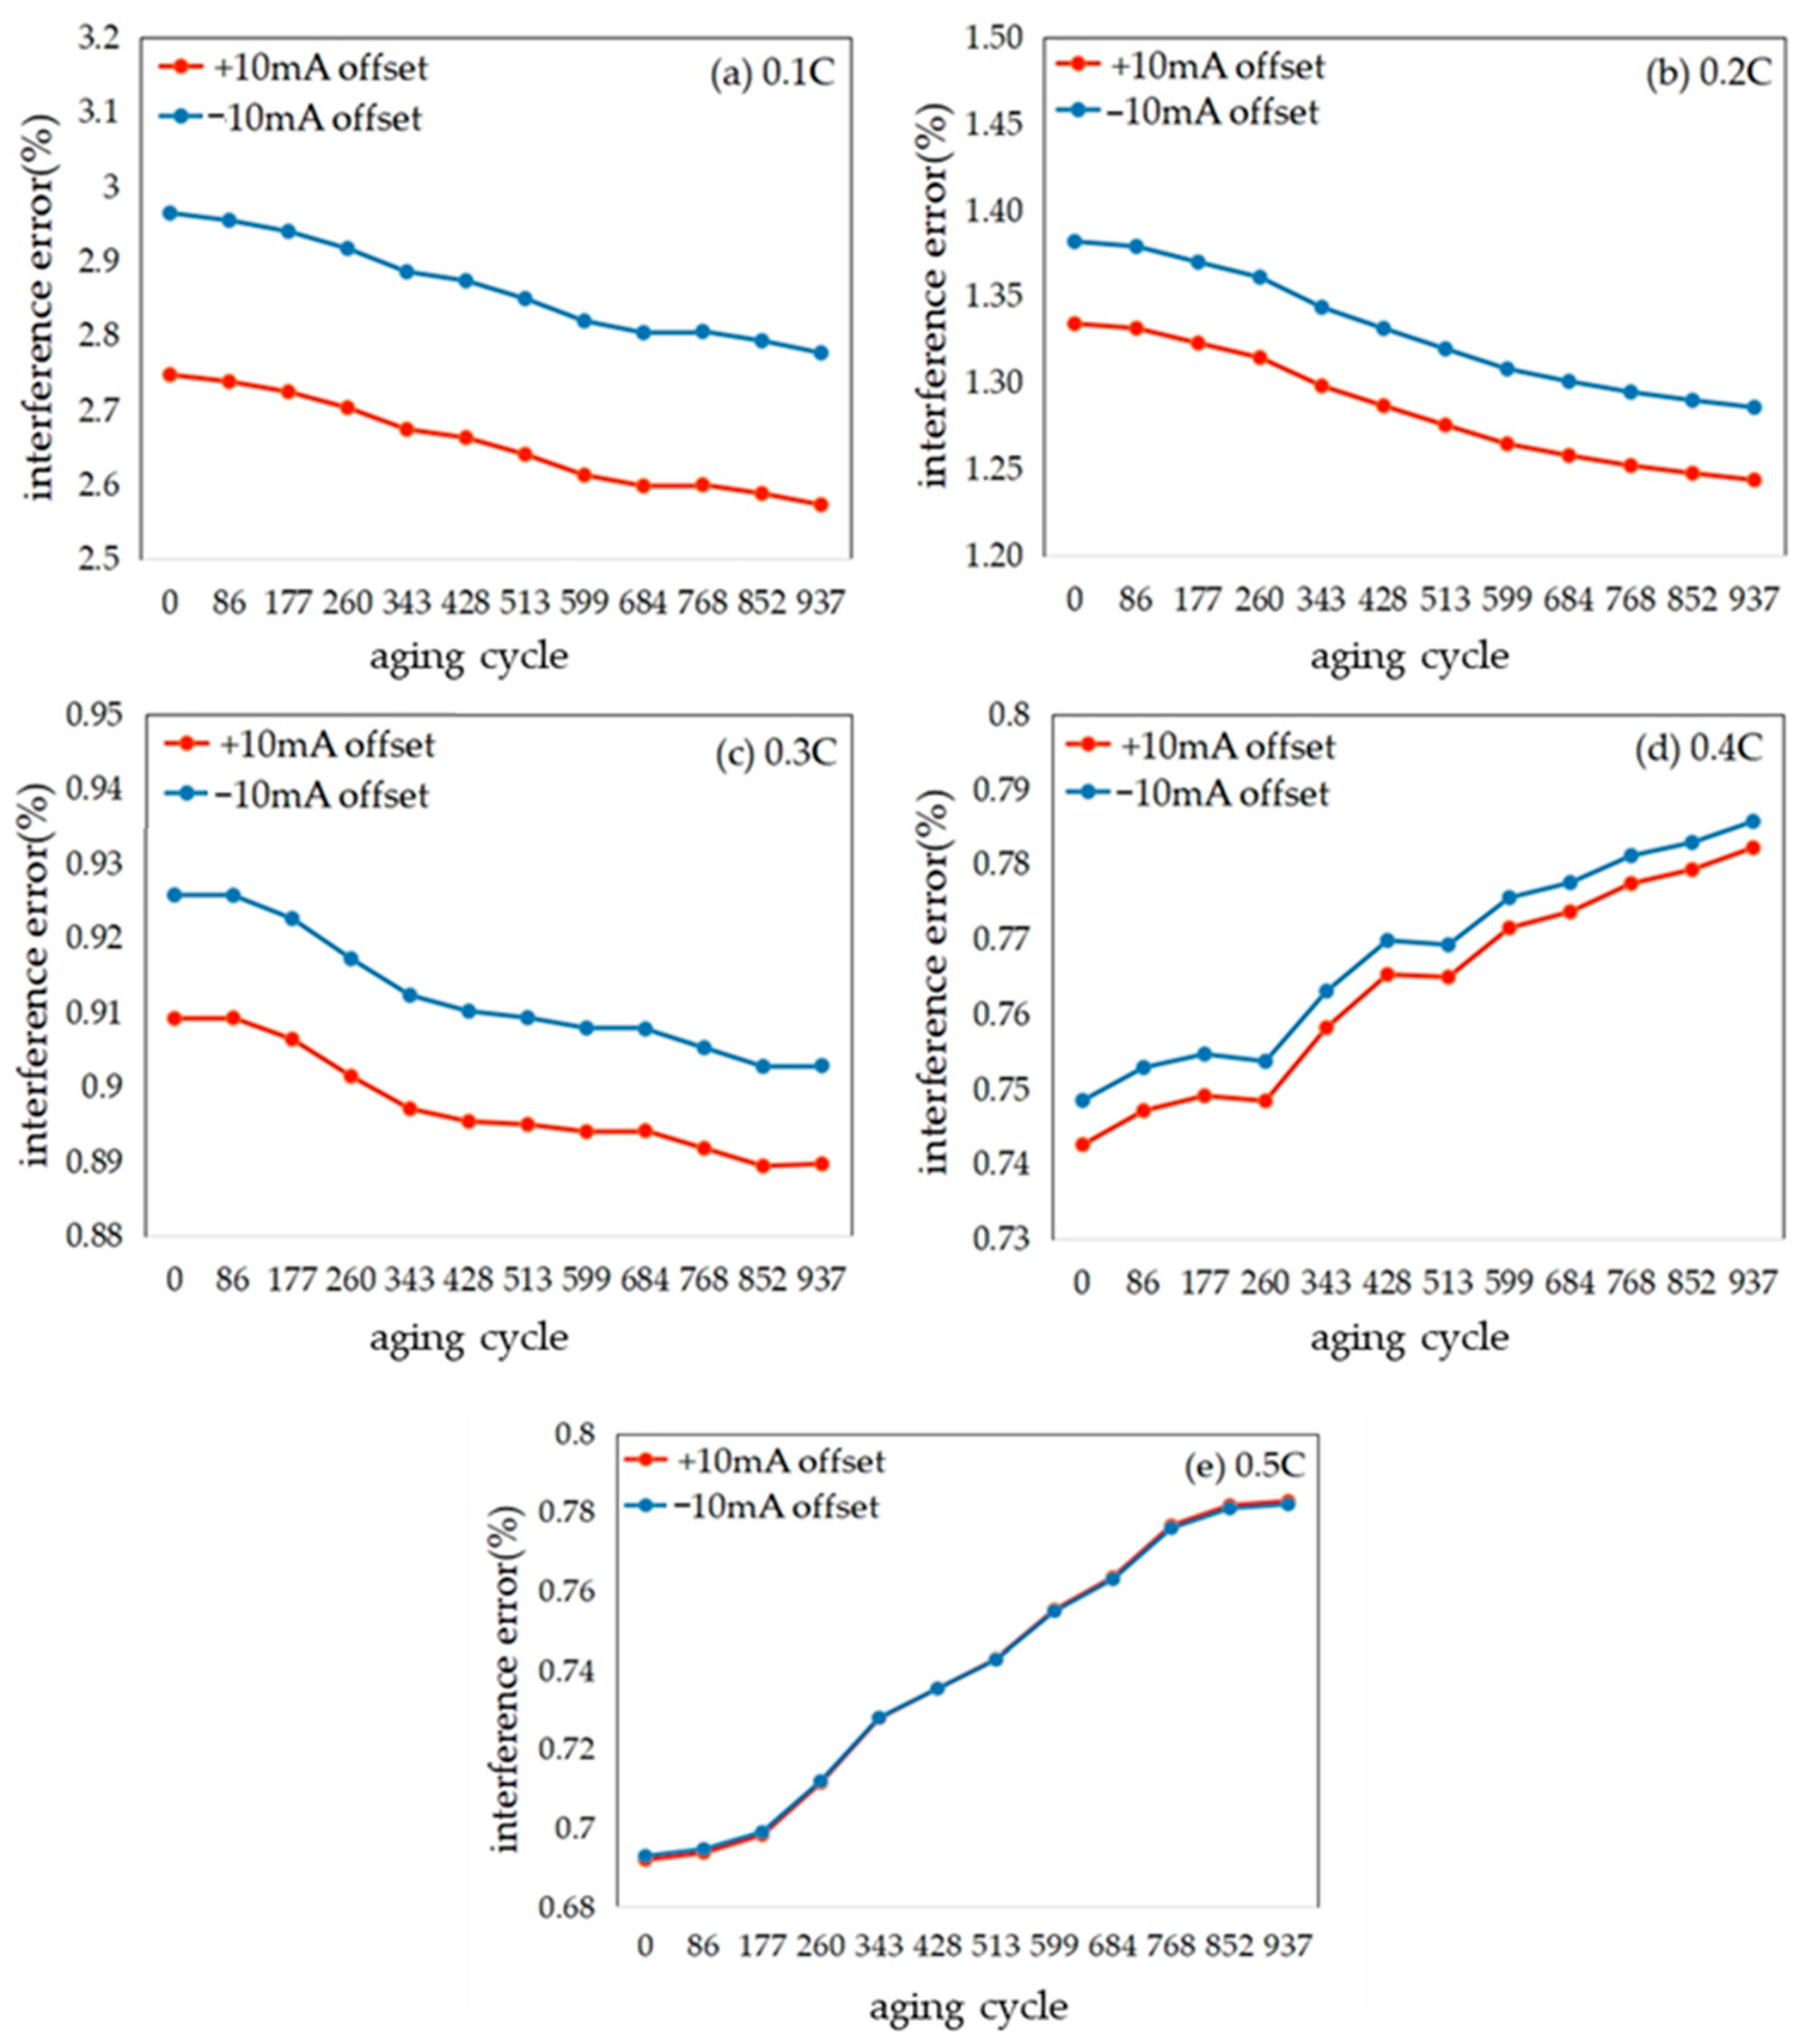
4.3. The Influence of Charging Current Offset on Capacity Estimation

For both of the two methods mentioned above, the charging current is used as a vital input. However, the measurement error may exist in the actual test conditions and could lead to the deviation of the estimation results. For the fitting method, different charging current rates correspond to different IC curves, which means the characteristics and corresponding coefficients will also change with it. For the data-driven method, the deviation of the charging current will also affect the estimation error. Thus, the robustness ability against the interference of charging current is of great importance.
In order to validate the robustness of the two methods, interference verification was conducted. Here, we impose a ± 10 mA offset on the actual charging current and investigate the effects on the capacity estimation error of the two methods. Figure 8 demonstrates the interference error of the fitting method caused by the current offset, which indicates the increased deviation from the original estimation results shown in Figure 6.
It is noteworthy that the interference error is falling with the increase in the charging current. In the high charging current conditions from 0.3 C to 0.5 C, the interference error maintains in an acceptable range within 1%. However, the error under low charging current is relatively high. Additionally, while the error has a downward trend with the battery aging under the current rate from 0.1 C to 0.3 C, an opposite trend is observed under 0.4 C and 0.5 C. Furthermore, the interference error of −10 mA offset is always lower than +10 mA offset, and the gap narrows with increasing of the charging current rate.
Figure 9 shows the interference error of the data-driven method caused by the current offset. Compared with the fitting method, this method performs much better in resistance to the charging current deviation. First, the interference error remains steady under different charging current rates, ranging from 0.02% to 0.09%, indicating better robustness under different charging conditions. The interference error of both offsets overlaps under most conditions. Thus, the data-driven method also performs more stably under different charging current offsets. Overall, the data-driven method has a better and more stable performance than the fitting method.

5. Conclusions

This paper investigates the capacity estimation using the ICA method considering the charging current rate. First, the characteristics of IC curves with different charging current rates under different aging statuses are investigated. Then, relationships between the charging current and the coefficients of different features are established to construct the fitting method. Furthermore, a data-driven GPR method is introduced to reduce the estimation error caused by the two-step fitting process of the first method. In order to validate the robustness against the measurement error of charging current, the interference test also is performed on two methods. Finally, the accuracy and adaptability of different methods are validated and compared.
Some conclusions and summarizations are drawn below:
  • Charging current has a significant impact on IC curves. With the decrease in the charging current, the IC curves have a moving trend to low voltage, and the height of all peaks increases, and the height of valleys decreases. In addition, the more serious the aging status of the battery, the more the IC curves of the battery will be affected by the charging current.
  • The height of peak II, peak III has a strong linear relationship with the capacity degradation under all tested charging currents, which can be used in the fitting method or GPR model to build the capacity estimation model. Additionally, the data-driven method can solve the error generated from the fitting process well and is proved to have higher precision than the fitting method. The data-driven method has an accuracy improvement of up to 15.175% compared with the traditional method.
  • Both methods have good robustness to the charging current interference under most working conditions. The data-driven method performs better compared with the fitting method, with an interference error under 0.1%, while that of the fitting method is up to 3%.
There are still some problems that need to be considered in further research:
  • In this paper, we did not consider the effect of charging temperature and initial charging SOC, which also have a severe influence on ICA. Future research work that takes these factors into consideration will be carried out to improve the accuracy on the basis of this study.
  • Here, we simply use the average of the estimated results of two picked features as the final results in the fitting method, which may cause an increase in the capacity estimation error. Pearson correlation coefficient can be used to determine the weights of different features in order to optimize the estimation.
  • Only the charging current smaller than 0.5 C is studied in this paper. However, fast charging is the research focus of the next-generation BMS. Hence, more work under the high charging current rate should be carried out to improve the applicability of this method.

Author Contributions

Conceptualization, Y.L. and B.J.; methodology, Y.L. and B.J.; software, Y.L.; validation, Y.L. and B.J.; investigation, Y.L. and B.J.; resources, B.J. and H.D.; data curation, B.J.; writing—original draft preparation, Y.L. and B.J.; writing—review and editing, B.J. and H.D.; funding acquisition, H.D. All authors have read and agreed to the published version of the manuscript.

Funding

This work was supported by the National Natural Science Foundation of China (NSFC, Grant No. U20A20310).

Conflicts of Interest

The authors declare no conflict of interest.

Nomenclature

BMSbattery management system
ETIequal time interval
EVIequal voltage interval
GPRGaussian process regression
ICincremental capacity
ICAincremental capacity analysis
KFKalman filter
LAMloss of active material
LIBslithium-ion batteries
LLIloss of lithium inventory
RMSEroot mean squared error
SOCstate of charge
SOHstate of health

References

  1. Waag, W.; Fleischer, C.; Sauer, D.U. Critical review of the methods for monitoring of lithium-ion batteries in electric and hybrid vehicles. J. Power Source 2014, 258, 321–339. [Google Scholar] [CrossRef]
  2. Liu, K.; Li, K.; Peng, Q.; Zhang, C. A brief review on key technologies in the battery management system of electric vehicles. Front. Mech. Eng. 2019, 14, 47–64. [Google Scholar] [CrossRef] [Green Version]
  3. Plett, G.L. Extended Kalman filtering for battery management systems of LiPB-based HEV battery packs: Part 3. State and parameter estimation. J. Power Source 2004, 134, 277–292. [Google Scholar] [CrossRef]
  4. Dai, H.; Sun, Z.; Wei, X. Estimation of internal states of power lithium-ion batteries used on electric vehicles by dual extended Kalman filter. J. Mech. Eng. 2009, 45, 95–101. [Google Scholar] [CrossRef]
  5. Hu, C.; Jain, G.; Zhang, P.; Schmidt, C.; Gomadam, P.; Gorka, T. Data-driven method based on particle swarm optimization and k-nearest neighbor regression for estimating capacity of lithium-ion battery. Appl. Energy 2014, 129, 49–55. [Google Scholar] [CrossRef]
  6. Lai, X.; Qin, C.; Zheng, Y.; Han, X. An adaptive capacity estimation scheme for lithium-ion battery based on voltage characteristic points in constant-current charging curve. Automot. Eng. 2019, 41, 1–6. [Google Scholar]
  7. Li, X.; Wang, Z.; Zhang, L.; Zou, C.; Dorrell, D.D. State-of-health estimation for Li-ion batteries by combing the incremental capacity analysis method with grey relational analysis. J. Power Source 2019, 410, 106–114. [Google Scholar] [CrossRef]
  8. Jiang, B.; Dai, H.; Wei, X. Incremental capacity analysis based adaptive capacity estimation for lithium-ion battery considering charging condition. Appl. Energy 2020, 269, 115074. [Google Scholar] [CrossRef]
  9. Bartlett, A.; Marcicki, J.; Onori, S.; Rizzoni, G.; Yang, X.G.; Miller, T. Electrochemical Model-Based State of Charge and Capacity Estimation for a Composite Electrode Lithium-Ion Battery. IEEE Trans. Control. Syst. Technol. 2015, 24, 1. [Google Scholar] [CrossRef]
  10. Cheng, Z.; Yang, L.; Sun, X. State of charge and state of health estimation of li-on batteries based on adaptive square-root unscented kalman filter. Proc. CSEE 2018, 38, 2384–2393. [Google Scholar]
  11. Deng, Z.; Yang, L.; Cai, Y.; Deng, H.; Sun, L. Online available capacity prediction and state of charge estimation based on advanced data-driven algorithms for lithium iron phosphate battery. Energy 2016, 112, 469–480. [Google Scholar] [CrossRef]
  12. Wu, J.; Wang, Y.; Zhang, X.; Chen, Z. A novel state of health estimation method of Li-ion battery using group method of data handling. J. Power Source 2016, 327, 457–464. [Google Scholar] [CrossRef]
  13. Shen, S.; Sadoughi, M.; Chen, X.; Hong, M.; Hu, C. A deep learning method for online capacity estimation of lithium-ion batteries. J. Energy Storage 2019, 25, 100817. [Google Scholar] [CrossRef]
  14. Li, Y.; Abdel-Monem, M.; Gopalakrishnan, R.; Berecibar, M.; Nanini-Maury, E.; Omar, N.; Bossche, P.V.D.; Van Mierlo, J. A quick on-line state of health estimation method for Li-ion battery with incremental capacity curves processed by Gaussian filter. J. Power Source 2018, 373, 40–53. [Google Scholar] [CrossRef]
  15. Li, X.; Jiang, J.; Wang, L.Y.; Chen, D.; Zhang, Y.; Zhang, C. A capacity model based on charging process for state of health estimation of lithium ion batteries. Appl. Energy 2016, 177, 537–543. [Google Scholar] [CrossRef]
  16. Weng, C.; Feng, X.; Sun, J.; Peng, H. State-of-health monitoring of lithium-ion battery modules and packs via incremental capacity peak tracking. Appl. Energy 2016, 180, 360–368. [Google Scholar] [CrossRef] [Green Version]
  17. Groot, J. State-of-Health Estimation of Li-ion Batteries: Cycle Life Test Methods. Master’s Thesis, Chalmers University of Technology, Göteborg, Sweden, 2012. [Google Scholar]
  18. Yazami, R.; Touzain, P. A reversible graphite-lithium negative electrode for electrochemical generators. J. Power Source 1983, 9, 365–371. [Google Scholar] [CrossRef]
  19. Dubarry, M.; Liaw, B.Y. Identify capacity fading mechanism in a commercial LiFePO4 cell. J. Power Source 2009, 194, 541–549. [Google Scholar] [CrossRef]
  20. Jia, J.; Liang, J.; Shi, Y.; Wen, J.; Pang, X.; Zeng, J. SOH and RUL Prediction of Lithium-Ion Batteries Based on Gaussian Process Regression with Indirect Health Indicators. Energies 2020, 13, 375. [Google Scholar] [CrossRef] [Green Version]
Figure 1. Experiment setups.
Wevj 12 00224 g001
Figure 2. IC curves with different current rates under different aging cycles: (a) cycle 0; (b) cycle 200; (c) cycle 400; (d) cycle 600.
Wevj 12 00224 g002
Figure 3. The correlation between the features of IC curves and battery capacity: (a) peak II; (b) peak III.
Wevj 12 00224 g003
Figure 4. The correlation between coefficients and current rate: (a) peak II; (b) peak III.
Wevj 12 00224 g004
Figure 5. Capacity estimation mode based on GPR.
Wevj 12 00224 g005
Figure 6. Accuracy comparison of two methods considering charging current.
Wevj 12 00224 g006
Figure 7. Accuracy comparison of the traditional method and data-driven method.
Wevj 12 00224 g007
Figure 8. Interference error generated by ± 10 mA offset of the fitting method.
Wevj 12 00224 g008
Figure 9. Interference error generated by ± 10 mA offset of the data-driven method.
Wevj 12 00224 g009
Table 1. Charging experiments at different charging current rates.
StepExperiment Description
1Set the chamber temperature to 25 °C, discharge the battery to 2.5 V with 0.5 C current
2Rest the battery for 1 h, and charge the battery to 4.2 V with 0.1 C current
3Rest the battery for 1 h, and discharge the battery to 2.5 V with 0.5 C current
4Rest the battery for 1 h
5Charge the battery to 4.2 V with 0.2 C, 0.3 C, 0.4 C, 0.5 C current, repeat step 3 to step 4
Table 2. The coefficients α i and β i with different currents.
Feature/CurrentPeak IIPeak III
α 1 β 1 R2 α 2 β 2 R2
0.1 C0.2151.4780.9930.906−0.3590.945
0.2 C0.1801.7100.9910.918−0.3210.964
0.3 C0.1691.8060.9951.109−0.8490.984
0.4 C0.1601.8830.9891.408−1.7240.992
0.5 C0.1691.8700.9901.640−2.31890.990
Table 3. Comparison of the average error and RMSE of the two methods.
ErrorMethod0.1 C0.2 C0.3 C0.4 C0.5 C
Average error (%)fitting method3.9141.5711.1341.4151.054
GPR method2.8091.1460.5660.3790.289
RMSE (%)fitting method0.1040.0440.0340.0400.030
GPR method0.0770.0320.0170.0110.010
Publisher’s Note: MDPI stays neutral with regard to jurisdictional claims in published maps and institutional affiliations.

