Article

Study on Mechanism Analysis of Skidding Prediction for Electric Vehicle Based on Time-Delay Effect of Force Transmission

School of Mechanical and Electrical Engineering and Automation, Shanghai University, Shanghai 200444, China
*
Author to whom correspondence should be addressed.
World Electr. Veh. J. 2021, 12(4), 171; https://doi.org/10.3390/wevj12040171
Submission received: 17 August 2021 / Revised: 15 September 2021 / Accepted: 27 September 2021 / Published: 29 September 2021

Abstract

:
The electric vehicle anti-skidding control system is used to ensure the stability of the vehicle under any circumstances. There is a typical feature in most anti-skidding detection methods; the skidding occurs first, and then the detection is performed. For methods that rely on slip rate detection, more accurate vehicle speeds are required, which are often difficult to accurately observe. The previous method was detection and could not do prediction. Skidding prediction can improve driver reaction time and increase safety. Therefore, this paper proposes a prediction method that does not depend on the slip rate. The skidding prediction can be performed by relying on the driving torque, as well as the wheel speed. In this paper, the characteristics of the transmission from the driving force to the friction force in the vehicle model are analyzed. As for the distributed electric vehicle, the slip factor was designed with traction torque and friction force for skidding prediction by its sharp increase before the maximum adhesion point. The variation in the slip factor and time period of skidding are revealed. A multi-information merged prediction model is designed to improve reliability. The co-simulation and experimental verification based on the physical skidding simulation platform are carried out.

1. Introduction

In recent years, as a solution to environmental problems and energy shortages, electric vehicles have become the development trend and research hotspot of the automotive industry. As the core component of electric vehicles, the anti-skid control system can ensure the stable operation of the vehicle under any circumstances, especially in low-adhesion road conditions or emergency situations. The key technology of anti-skid control includes the reliable perception and control of the sliding state of the vehicles. Since the slip rate is related to the adhesion stability and dynamic performance of the vehicle [1,2,3], the main idea of solving the stability is to directly or indirectly control the slip rate of the driving wheel. The perception of vehicle tire-road adhesion status and its driving anti-skid control have been studied in depth by scholars, and some important results have been obtained.
References [2,3,4,5] are based on the slip rate-adhesion coefficient relationship and use fuzzy algorithms to identify typical road surfaces. The input of the road surface identifier is the wheel slip rate and the road surface adhesion coefficient, and the output is the similarity coefficients of 8 typical road surfaces. The maximum adhesion coefficient and optimal slip rate of the current road surface are obtained, and the wheel slip rate is calculated using the estimated vehicle speed. In driving conditions, the wheel slip rate is mostly within 1%, and the wheel speed signal has noise interference, so it is difficult to accurately obtain slip rate. In addition, the adhesion coefficient and the slip rate are not strongly linear in the small slip rate stage. Therefore, this method is not practical. In the road surface recognition method of the tire model, a standard adhesion coefficient-slip rate curve database is first established according to the accurate tire model, and then the road surface is classified. In order to ensure the accuracy of road recognition, a large amount of test data is needed to identify the characteristic parameters of the tire model [3,6]. In Reference [7], Cabrera et al. proposed a modified Magic Formula tire model to more accurately describe the effect of changes in external conditions (road condition, tire type, vehicle speed, slip rate, etc.) on the coefficient of adhesion. The test results under different road conditions proved that the modified Magic Formula has higher model accuracy.
There are two types of road surface identification methods based on the adhesion coefficient-slip rate relationship curve and based on the tire model [4], and they both rely on the relationship between the slip rate and the adhesion coefficient. They are the continuation and development of the original technical route, and their reliable realization depends on the accurate calculation of slip rate. The traction conditions of the vehicle are complex, so there are many factors that affect the calculation accuracy of the slip ratio. At the same time, the accurate estimation of the longitudinal speed of the vehicle is still a technical difficulty. Therefore, it is necessary to propose a road identification method that does not rely on slip rate.
At present, anti-skid control algorithms are mainly used by changing the drive torque method [1,2,3,4,5,8] (slip rate closed-loop, MTTE, etc.) and changing the road contact characteristics method [9]; most of the driving anti-skid control algorithms stay in the simulation stage and the typical working condition test stage, and the effectiveness and robustness of the algorithm have not been verified under complex working conditions. In this paper, skidding is predicted in the absence of slip rate to improve safety. The force transmission characteristics based on the single-wheel dynamics model are analyzed, and a slip factor that can characterize the stability of the vehicle is proposed. The sharp change of the slip factor before the maximum attachment point is used to predict vehicle skids.

2. Materials and Methods Analysis for Time-Delay Effect of Force Transmission Based on Single-Wheel Dynamics Model

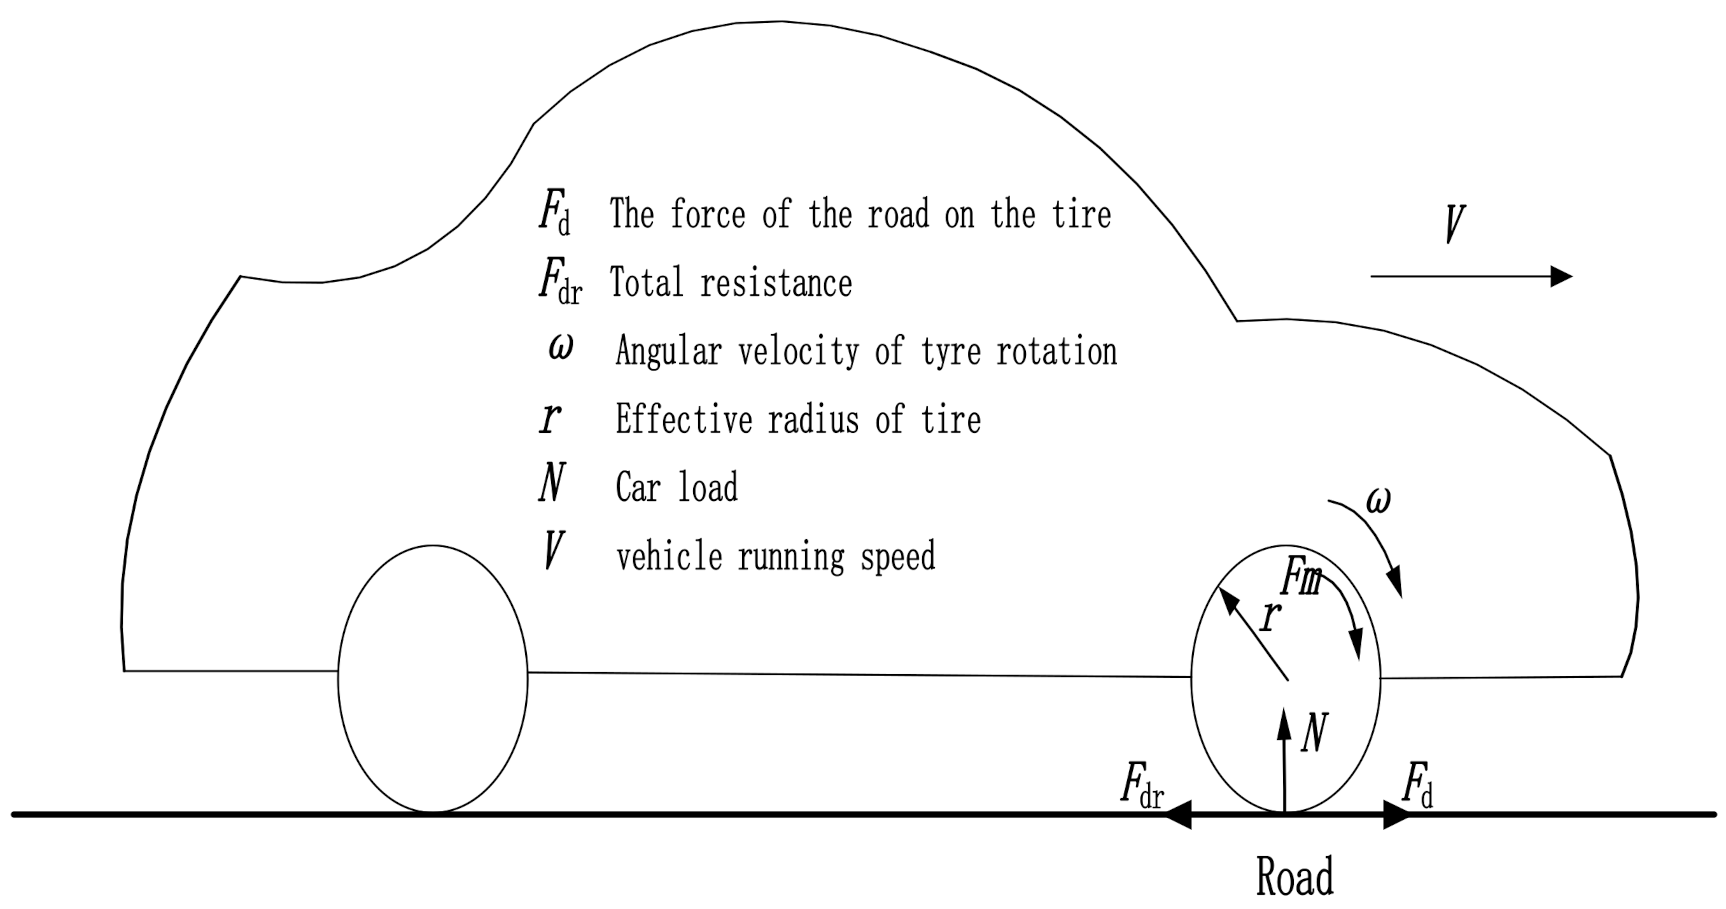
The single-wheel dynamics model is shown in Figure 1. It only considers the longitudinal linear motion and ignores the influence of the vertical motion and roll of the vehicle. In the figure, Fm is the driving force of the wheel (N); J is the equivalent rotational inertia of the wheel (kg·m2); ω is the rotational angular velocity of the wheel (rad/s); r is the effective radius of rotation of the wheel [m]; Fd is the wheel ground Inter-friction force (N) (also known as friction force); Fdr is the total resistance of the vehicle movement (N), including wind resistance, rolling resistance; M is the wheel load mass (kg); V is the longitudinal speed of the vehicle (m/s).
Assuming that the curve (Figure 2) between the tire-ground adhesion coefficient (μ) and the slip rate (λ) is smooth and continuous, the single-wheel dynamic model [10] can be linearized near the working point. Taking the driving condition of the vehicle as an example, the small-signal linearization processing of the single-wheel dynamics model can be used to obtain the following formula:
Δ λ = 1 r ω Δ V + 1 λ ω Δ ω ,
Δ F m r Δ F d r = J d ( Δ ω ) d t ,
Δ F d Δ F dr = M d ( Δ V ) d t ,
Δ F d = Δ μ N = a Δ λ N .
Among them, a = 𝜕𝜇/𝜕λ, N is the tire vertical load, λ is the longitudinal slip rate, defined as shown in Equation (5), and ε is a small constant to prevent the denominator from being zero.
λ = ω r V max { ω r , V , ε }
ΔFdr is the change of wind resistance, which accounts for a small proportion and can be ignored. By Formulas (1)–(5), the dynamic structure block diagram of vehicle force transmission can be drawn, as shown in Figure 3.
The relationship between adhesion coefficient and slip rate (μλ) can be roughly described as shown in Figure 3.
According to Figure 2, the force transfer function can be obtained:
G v ( s ) = Δ F d r Δ F m r = K v 1 + τ v s .
In the same way, the transfer function of force transmission under braking conditions can be obtained, and the form is the same as that of traction conditions. In traction conditions, K v = M r 2 ( 1 | λ | ) [ ( 1 | λ | ) M r 2 + J ω ] , τ v = J ω M ω r a N [ ( 1 | λ | ) M r 2 + J ω ] ; in braking conditions, K v = M r 2 [ ( 1 | λ | ) J ω + M r 2 ] , τ v = J ω M ω r a N ( 1 | λ | ) [ M r 2 + ( 1 | λ | ) J ω ] .
It can be seen from the equation that the force transmission of different working conditions is a first-order inertial system. When a < 0, τv < 0, the friction force feedback is positive feedback, and the wheel-ground contact cannot achieve stable force transmission. In addition, the time constant (τv) is proportional to the wheel speed and inversely proportional to the slope (a) of the road surface characteristics. When the working point is close to the maximum attachment point, the delay of force transmission increases sharply, and the friction force change approaches zero. This characteristic provides a theoretical basis for predicting the attachment state of the vehicle.

3. Electric Vehicle Skidding Prediction Method Based on Skidding Prediction Factor

3.1. Principles of Electric Vehicle Skidding Prediction Based on Skidding Prediction Factor

In order to predict vehicle skidding, the slip factor shown in Equation (7) is defined:
δ ( t ) = Δ F m ( t ) Δ F d ( t ) Δ F m 0 ε Δ F d ( t ) Δ F m = 0 .
ε is a normal number that is not zero. Near the operating point, the traction increment can be expressed as:
Δ F m ( t ) = k u ( t ) .
k is the slope of traction. From Equations (6)–(8), the change of friction force can be obtained as:
Δ F d ( t ) = k K v 1 e t / τ v .
In the vicinity of the maximum attachment point, the Taylor series expansion of Equation (9) is carried out. Since t τ v , the higher-order terms can be ignored, and Equation (10) can be obtained:
δ ( t ) = Δ F m ( t ) Δ F d ( t ) 1   K 1 ( 1 e t τ v ) J ω a N r 1 t .
As shown in Figure 3, as the slip rate becomes larger, but the friction force decreases, it is judged that skidding occurs. In this paper, the slip factor changes, such as a hyperbola, as shown in Figure 4. At the skidding point, the slip factor tends to be positive infinity, so the skidding can also be judged according to this property. Therefore, the vehicle skidding can be predicted by setting the threshold of the Slip factor. In Figure 4, the slip factor reaches a maximum at t = 5.55 s. At this time, the value of a tends to 0, so the slip factor tends to infinity. Among them, the time when the maximum value occurs is related to the vehicle’s motion state, and it is determined by a variety of factors. The slip factor is inversely proportional to the load and the slope of the road surface characteristics, proportional to the wheel speed and inertia. The speed in Equation (10) is the speed at the moment of skidding. Theoretically, skidding can occur at any moment. When the speed is relatively low, the skidding factor is small, so our method is difficult to judge for such working condition as skidding at startup. The simulation proves that it can be judged above 5 km/h. The threshold can be set according to the slip factor value at low speed, or it can be dynamically adjusted according to the wheel speed. When the threshold is constant, the skidding prediction advance time is different at different speeds. The predicted advance time will increase as the vehicle speed increases. High-speed skidding is more harmful, so this feature can meet the needs of anti-skid control.

3.2. Sliding Window Time

The change of the road surface is always uncertain, so it is difficult to analyze window-time caused by the skidding. Here, the window time of skidding caused by the driver’s improper operation is analyzed.
From Figure 2, the transfer function of slip rate to traction torque can be obtained:
G λ ( s ) = Δ λ ( s ) Δ F m ( s ) r = K λ 1 + τ v s ,
K λ = M r ( 1 | λ | ) a N ( 1 | λ | ) M r 2 + J .
The slip rate increment near the working point is expanded by Taylor series. Considering λ 1 , the higher-order terms can be ignored, so that:
Δ λ ( t ) = k K λ 1 e t τ v = r k ( 1 | λ | ) 2 J V t r k J V t .
The time corresponding to the attachment slope a = 1 to a = 0 is defined as the skidding-window-time. The skidding-window-time represents the interval of time, which is not related to the actual time of skidding occurrence. The longer the interval of time, the greater the time margin predicted by this algorithm. Due to the large inertia of the vehicle, the speed change of the vehicle can be ignored during the skidding-window-time. At the same time, r and J are also constants. It can be seen from Equation (13) that the slip rate changes approximately according to a quadratic curve during the skidding process.
The slip rate change ratio is inversely proportional to the vehicle speed and directly proportional to the slope of traction torque. The lower the vehicle speed and the greater the slip rate change ratio, the shorter the skidding-window-time.
Using the parameters in Table 1 to carry out co-simulation of MATLAB and CarSim, the time variation curve of the skidding-window-time that can be obtained is shown in Figure 5. The control variates method is used in the simulation to analyze the effect of parameters. As can be seen:
(1)
When road surface characteristics are same, the lower speed, the shorter skidding-window-time; the greater traction torque slope, the shorter skidding-window-time.
(2)
When vehicle speed and traction torque slope are same, the skidding-window-time varies greatly with different road conditions, and the skidding-window-time on icy roads is shorter.
When calculating the slip factor, the observation of friction force requires the use of traction torque and wheel speed. Considering that the slip factor is sensitive to noise, the torque of command is used to calculate it and the observation of friction force. The time constant that characterizes the change of friction force is affected by wheel speed and the slope of road characteristics, and the vibration of friction force will cause drastic changes in the Slip factor. In this paper, an open-loop observer is used to observe the friction force, as shown in Equation (14):
F d = 1 r ( T m J d ω d t ) .
In order to reduce the influence of noise on the differential, the pseudo-differential is used for differential calculation, and the moving average filter is used to retain the steep change of the slip factor.

4. Simulation and Experiment of Electric Vehicle Skidding Prediction Method Based on Slip Factor

4.1. Simulation Verification and Analysis

In order to verify the effectiveness of the skidding prediction method, a co-simulation study based on CarSim and MATLAB was carried out, and the traction conditions were taken as an example to verify. According to Table 1, set the simulation parameters of the vehicle structure, transmission system, braking system, steering system, front and rear suspension system, and tires.
The traction torque uses a ramp signal. The traction torque of the four wheels is equally distributed, and the front wheel signals are used for road surface recognition. The road setting adopts single-road (the road with a single adhesion coefficient). The skidding prediction threshold is set to 200.
In single-road, the vehicle is driving on an icy road, and the adhesion coefficient is 0.2. Figure 6 shows the simulation waveform of vehicle skidding at a speed of 85 Km/h. Figure 7 shows the simulation waveform of vehicle skidding at a speed of 48 Km/h. It can be seen from Figure 6 that the vehicle enters the unstable area from the stable area at about 1.98 s. At this time, as the traction torque increases, the friction torque decreases instead, and the wheel acceleration increases. In the process of approaching the maximum attachment point, the slip factor has a sharp peak. When it is greater than the threshold 200, the skidding prediction flag (con_sign) is 1, and the identified optimal slip rate (s_ref) is about 0.024. It can be seen from Figure 6b that the slip factor can be used to predict that the vehicle is about to slip, and the prediction time in advance is about 60 ms.
It can be seen from Figure 7 that the change of slip factor is similar to Figure 6. According to Equation (10), the vehicle speed is lower and the magnitude of the slip factor decreases. The identified optimal slip rate is 0.024, which is consistent with the road surface information. It can be seen from Figure 7b that the advance time of skidding prediction is about 50 ms. Compared with Figure 6, the vehicle speed is reduced, so the skidding-window-time becomes shorter. The size of the slip factor is proportional to the speed, and the prediction advance time is also shorter at the same slip threshold, which is consistent with the theoretical analysis. Compared with Figure 4, it can be seen from Figure 6 and Figure 7 that the slip factor does not monotonously increase according to the ideal hyperbola, but several pulses with rapidly increasing amplitudes appear. Since the tire model is not an ideal model (relationship between adhesion coefficient and slip rate is shown in Figure 3) in the CarSim simulation configuration, a tire empirical model is used. The decay time of the pulse is related to the increase of the time constant, which is related to the tire empirical model adopted by the vehicle. The empirical model is a mathematical description of the tire mechanical characteristics established based on tire test data and experience, which is closer to actual road conditions [11].

4.2. Experimental Verification of Electric Vehicle Skidding Prediction Based on Slip Factor

In this paper, experiments will be carried out on a vehicle dynamic safety simulation tested platform with an asynchronous motor as the core [12]. This physical system-based simulation experiment system is closer to the actual vehicle experiment than the simulation.
The schematic diagram of the vehicle dynamic safety simulation tested system based on an asynchronous motor is shown in Figure 8. The traction motor (synchronous motor) is controlled by the vehicle power control system; the vehicle speed is calculated by the vehicle real-time simulation system according to the vehicle model; the stator voltage and frequency are adjusted by the inverter 2 according to the wheel-ground characteristics when the vehicle speed is simulated. In the experiment, the rotor side is short-circuited, which means that the resistance of the rotor remains unchanged. Therefore, the road surface characteristics have always been slippery under traction conditions, and the road characteristics have been improved under braking conditions [13]. There are measured characteristic curves in Section 4.3.
Figure 9 is the diagram of the actual test platform, includes a semi-physical real-time unit, a motor-to-drag platform, a CAN analyzer, a host computer, and a display. The rated power of the permanent magnet synchronous motor is 3.5 KW, the rated speed is 2000 r/min, and the rated torque is 16.7 N·m; the rated power of the wound asynchronous motor is 3 KW, the rated speed is 1400 r/min, and the rated torque is 20.5 N·m. In order to ensure the occurrence of the skidding phenomenon, the wound asynchronous motor works in the weak field state, and the electromagnetic torque of the asynchronous motor is observed by the observer. The simulated vehicle mass is 30 kg, the tire radius is 0.1 m, and the wind resistance of the vehicle is not considered.

4.3. Experimental Waveforms and Analysis

Figure 10 shows the experimental waveforms for simulating the skidding prediction under the low-speed traction state of the vehicle. Figure 10c is the road surface characteristic curve obtained by the simulation experiment, and its shape is consistent with the actual curve (Figure 3), with the optimal slip ratio of the simulation curve about 0.84.
In Figure 10a, Tm_ref is the traction torque of command; Tm_real is the observed traction torque, which contains more noise. It can be seen from Figure 10a that, as the synchronous motor torque increased, the asynchronous motor torque Td (simulated friction torque) increased, the wheel speed increased, the vehicle speed increased, and the slip rate increased slowly. As shown in Figure 10a,b, after about 37.926 s, the vehicle speed is about 30 Km/h, the slip factor amplitude starts to increase, and the asynchronous electric torque follows slowly. When the slip factor amplitude is greater than the threshold value of 50, it is determined that the simulated vehicle is about to slip, the control signal (con_sign) is set to 1, the given slip rate (s_ref) is set to 0.83, and then the wheel accelerates and the slip rate increases. It shows that the slip factor can be used to predict the simulated vehicle skidding in advance, and this prediction is about 5 ms ahead of schedule. The road characteristics are constantly changing, although the prediction lead time is not comparable with the simulation results, and the prediction is more difficult.
Figure 11 shows the experimental waveforms for simulating the skidding prediction in the high-speed traction state of the vehicle. Figure 11c is the characteristic curve of friction torque and slip rate. When the slip rate is 0.64, the maximum friction torque is reached. From Figure 11a,b, it can be seen that slip occurs at 25.926 s, and the slip factor has a sharp peak. At 25.916 s, the slip factor is greater than the threshold, predicting that the vehicle is about to slip. The control signal (con_sign) is set to 1, and the prediction time is 10 ms. At this time, the wheel speed is 112 km/h, the vehicle speed is 69 km/h, and the slip rate is 0.64. Compared with Figure 10, the peak value of the corresponding slip factor is greater than the peak value at low speed, which is consistent with the previous theoretical analysis and predicts skidding earlier.

5. Conclusions

Skidding-detection is the core technology of the vehicle’s anti-skid control system. In this paper, a slip factor was designed according to the time-delay effect of force transmission. The sharp increase of the slip factor before the maximum adhesion point can realize skidding prediction. Therefore, the anti-skid control performance of the vehicle is improved. The co-simulation and experimental verification based on the physical skidding simulation platform are carried out, which proves the validity and feasibility of the method. The proposed algorithm has not been further tested in real vehicle conditions. Future research work will focus on conducting real vehicle tests.

Author Contributions

Conceptualization, Y.Y.; methodology, Y.Y., X.W.; investigation, Y.Y.; validation, X.W., Y.Z.; writing, Y.Y., X.W. All authors have read and agreed to the published version of the manuscript.

Funding

This research was funded by Delta Environment and Education Foundation.

Data Availability Statement

The datasets used and/or analyzed during the current study are available from the corresponding author on reasonable request.

Acknowledgments

We want to thank the Institute of Motor Control of Shanghai University for the support in the completion of the project.

Conflicts of Interest

The authors declare no conflict of interest.

References

  1. Yin, D.; Sun, N.; Hu, J.-S. A Wheel Slip Control Approach Integrated with Electronic Stability Control for Decentralized Drive Electric Vehicles. IEEE Trans. Ind. Inform. 2019, 15, 2244–2252. [Google Scholar] [CrossRef]
  2. Zhang, B.; Chen, Z.; Fu, J. Four-wheel independent drive electric vehicle adaptive drive anti-skid control. J. Shandong Univ. 2018, 48, 96–103. [Google Scholar]
  3. Gong, D. Research on Compound Braking Control System of Four-Wheel Independent Drive Hub Motor Electric Vehicle; Hunan University: Changsha, China, 2018. [Google Scholar]
  4. Wang, Q.; Liu, W.; Chen, W.; Wang, H.; Huang, H. Sliding mode control of vehicle stabilization system based on road surface identification. Automot. Eng. 2018, 40, 82–90. [Google Scholar]
  5. Li, G. Research on the Optimal Control Technology of Electric Vehicle Traction System Based on Self Anti-Disturbance Algorithm; University of Chinese Academy of Sciences (Shenzhen Institute of Advanced Technology, Chinese Academy of Sciences): Beijing, China, 2020. [Google Scholar]
  6. Leng, B.; Xiong, L.; Yu, Z.; Sun, K.; Liu, M. Robust Variable Structure Anti-Slip Control Method of a Distributed Drive Electric Vehicle. IEEE Access 2020, 8, 162196–162208. [Google Scholar] [CrossRef]
  7. Cabrera, J.A.; Castillo, J.J.; Perez, J.; Velasco, J.M.; Guerra, A.J.; Hernández, P. A procedure for determining tire-road friction characteristics using a modification of the magic formula based on experimental results. Sensors 2018, 18, 896. [Google Scholar] [CrossRef] [PubMed] [Green Version]
  8. He, Y. The Electric Vehicle Torque Adaptive Drive Anti-Skid Control Based on Objective Optimization. Jordan J. Mech. Ind. Eng. 2021, 15, 39–49. [Google Scholar]
  9. Sekour M’hamed, K.H.; Abdelkader, M. Electric Vehicle Longitudinal Stability Control Based on a New Multimachine Nonlinear Model Predictive Direct Torque Control. J. Adv. Transp. 2017, 2017, 4125384. [Google Scholar]
  10. Fawzy, N.; Habib, H.F.; Mokhtari, S. Performance Evaluation of Electric Vehicle Model under Skid Control Technique. World Electr. Veh. J. 2021, 12, 83. [Google Scholar] [CrossRef]
  11. Yang, Y.; Zhang, Y.; Wang, X. Principle Analysis of anti-skid decoupling Control of Distributed Electric Vehicle. In Proceedings of the 2020 3rd International Conference on Power and Energy Applications (ICPEA), Busan, Korea, 9–11 October 2020; pp. 125–130. [Google Scholar]
  12. Ni, J. Tire model application in FSAE racing dynamics simulation. J. Automot. Eng. 2012, 2, 359–364. [Google Scholar]
  13. Xu, G.; Luo, Y.; Yang, Y.; Zhang, J. A new wheel-ground simulation load model and system for vehicle dynamics performance testing. Chin. J. Sci. Instrum. 2018, 39, 214–223. [Google Scholar]
Figure 1. Single wheel model (QCM model).
Wevj 12 00171 g001
Figure 2. The relationship between adhesion coefficient and slip rate (μλ).
Wevj 12 00171 g002
Figure 3. The dynamic structure block diagram of vehicle force transmission.
Wevj 12 00171 g003
Figure 4. The dynamic waveform of slip factor and friction force.
Wevj 12 00171 g004
Figure 5. Time change curve of slip window.
Wevj 12 00171 g005
Figure 6. Simulation waveforms of road recognition under icy roads (high speed). (a) Relevant simulation waveforms in road recognition; (b) local amplified waveforms near the maximum attachment point).
Wevj 12 00171 g006
Figure 7. Simulation waveforms of road recognition under icy roads (low speed). (a) Relevant simulation waveforms in road recognition; (b) local amplified waveforms near the maximum attachment point).
Wevj 12 00171 g007
Figure 8. The schematic diagram of the vehicle dynamic Safety simulation tested system.
Wevj 12 00171 g008
Figure 9. Diagram of the vehicle dynamic safety simulation test platform.
Wevj 12 00171 g009
Figure 10. Low-speed slip test waveforms in traction conditions. (a) Experimental waveforms related to skidding prediction; (b) local enlarged waveforms near the maximum attachment point of skidding prediction; (c) simulated road characteristic curve.
Wevj 12 00171 g010
Figure 11. High-speed slip test waveforms in traction conditions. (a) Experimental waveforms related to skidding prediction; (b) local enlarged waveforms near the maximum attachment point of skidding prediction; (c) simulated road characteristic curve.
Wevj 12 00171 g011
Table 1. Vehicle parameter table.
ParameterValuesUnit
sprung mass1370kg
unsprung mass71kg
height1535mm
width1695mm
mass to front axis1040mm
wheel base2600mm
to drag hook3400mm
face area2.2m2
Tire Size205/55 R16
Publisher’s Note: MDPI stays neutral with regard to jurisdictional claims in published maps and institutional affiliations.

