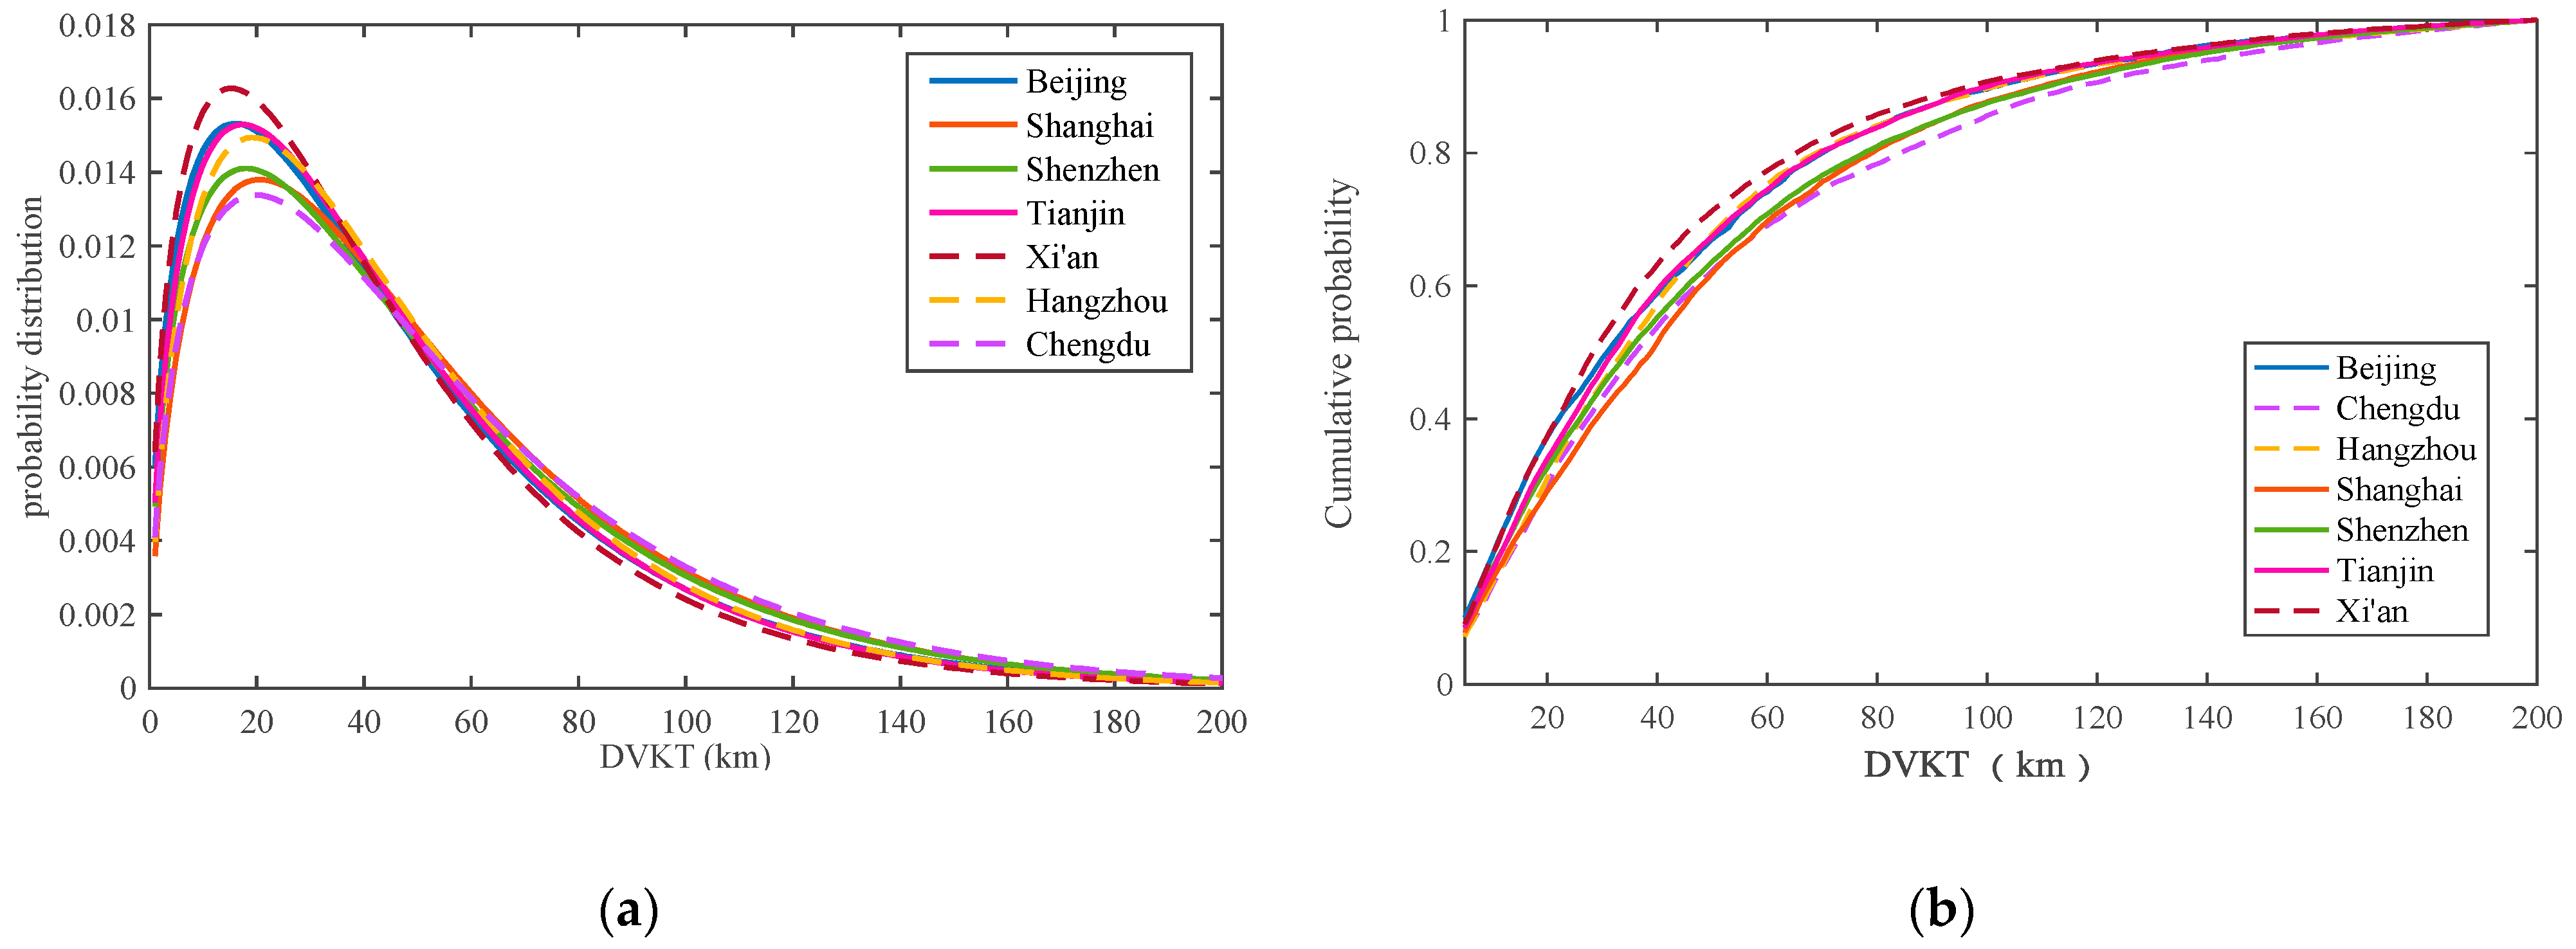
3.1. Travel and Charging Pattern
The gamma distribution fitting results of each city are shown in
Table 3, and the probability distribution curve and cumulative probability distribution curve are shown in
Figure 2. According to the gamma travel distribution, 59~69% of the average daily travel distance is less than 50 km, and 78~86% of the average DVKT is less than 80 km. Among them, Xi’an has the highest proportion of short DKVT (less than 50 km) days at nearly 70%; Shanghai and Shenzhen have the largest proportion of days with more than 80 km (19~20%). Furthermore, to ensure the indeed difference between different cities, ANOVA and Student’s
t-test are carried out on the daily mileages between each two cities. It turns out that the assumption of all the cities are coming from the same data source can be rejected at the significance level of 1%. As for the comparison between each two cities, it turns out that most cities can reject the same data source assumption at the significance level of 5% from the student’s
t-test, except for Beijing-Tianjin, Shanghai-Hangzhou and Shenzhen-Chengdu, indicating different travel patterns are representative among cities. Moreover, Beijing and Tianjin, Shanghai and Hangzhou are very close to each other, and it is acceptable to have similar travel patterns. It is necessary to further understand the travel heterogeneity between Shenzhen and Chengdu with more data, which is not available in this research. Check the
Appendix A for the ANOVA and Student’s
t-test.
The ambient temperature impact on DVKT is illustrated via the daily mileage variation in different seasons. As shown in
Table 4, DVKT varies significantly with different seasons, especially in the cities with distinct four seasons. In Beijing, Shanghai, Tianjin, Chengdu and Hangzhou, there are fewer trips in winter due to the low temperature; therefore, the DVKT difference between winter and summer can reach up to 7–14%. However, DVKT difference between summer and winter in Shenzhen is only 4%, where the average yearly ambient temperature is 20 °C. Here spring covers March, April, May, summer covers June, July, August, autumn covers September, October, November, and winter covers December, January and February.
Average distance travelled between two adjacent charging events is 67% to 138% of NEDC tested range in the seven cities, that is, A/T ratio varies from 0.67 to 1.38 in the seven cities. As shown in
Figure 3b, based on actual travel characteristics and charging behaviors, 70.5~87.4% of PHEV owners in these seven cities with an average of 77.0% are frequent charging adopters, and only 2.4~6.1% of PHEV owners rarely charge (rarely charging adopters) during daily use with an average of 3.0%. Among these seven cities, there are most rarely charging adopters in Chengdu while there are least rarely charging adopters in Shanghai, however the differences among cites are limited. Specially, there is a unique double-peak phenomenon in the range of 0 < A/T ratio ≤ 1.5 in Shenzhen (
Figure 3a), which indicates two different charging patterns in Shenzhen.
Standard UF of PHEV50 (50-km-all-electric range PHEV) varies from 0.55 to 0.62, and UF of PHEV80 (80-km-all-electric range PHEV) varies from 0.71 to 0.77 as the red shadow shown in
Figure 4. Among the seven cities, the UF of PHEV50 was the smallest in Chengdu, while the UF of Tianjin and Xi’an were the largest. Besides, the PHEV80 has the smallest UF at Chengdu and the largest UF at Tianjin listed in
Table 5.
Furthermore, sales-weighted average UF is 0.59 for PHEV50 and 0.74 for PHEV80. Cities with more than 1000 PHEV sales in China accounted for 83% of PHEV sales in 2018 [
29], travel pattern in these cities were approximated by the above seven cities with existing data according to the city level and the regions. The sales-weighted average UF is the red curve shown in
Figure 4.
Power exponential function fitting is carried out based on the above UF values. According to the trips in this research, the DVKT of 400 km or more only accounts for about 1%, and the omission of this part of travel has little influence on UF research. Therefore, 400 km is set as the upper limit of daily travel mileage, and 400 km is set for trips above 400 km, with the fitting parameters listed in
Table 6. The fitting is carried out as nine orders to decrease the fitting error to less than 0.015 per the Beijing example shown in
Figure 5. The fitting parameters are listed to simplify the calculation in actual use.
3.2. Actual Utility Factor and Discussion
Actual UF is derived from the Equation (3), with the sales-weighted UF at an actual charging pattern of 0.53 for the 50 km all-electric-range PHEVs and 0.68 for the 80 km all-electric-range PHEVs, which is between 23.2% to 26.2% (0.03 to 0.04) smaller than the standardized UF. In reality, this is mainly due to lower than average charging frequency. As shown in
Figure 5, the dashed line shows the standard sales-weighted UF while the solid line shows the actual sales-weighted UF, and the shadows indicate the variation among different cities. The actual UF varies from 0.44 to 0.66 for the 50km all-electric-range PHEV and 0.59 to 0.79 for the 80 km-all-electric-range PHEV in different cities. Distinct inter-city UF variation indicates various charging patterns among different cities, possibly due to different charging infrastructure construction, consumer preference and charging prices. Furthermore, the power exponential function fitting of actual UF is listed in
Table 7. Similar to the standard UF curves, actual UF curves are also fitted with nine order functions and the fitting errors are less than 0.015.
Utility factor research is the basis of energy consumption and carbon emission research. On-road carbon emission of PHEV can be simplified as the weighted average of on-road carbon emission of fuel driven distance and on-road carbon emission of electricity driven distance (zero for the on-road carbon emission) measured by utility factor. Therefore, considering the sales-weighted UF at actual charging pattern is 0.53 for the 50 km all-electric-range PHEVs, that is, over 50% distance is driven by electricity at actual charging pattern, indicating over 50% on-road carbon emission reduction potential for PHEV.
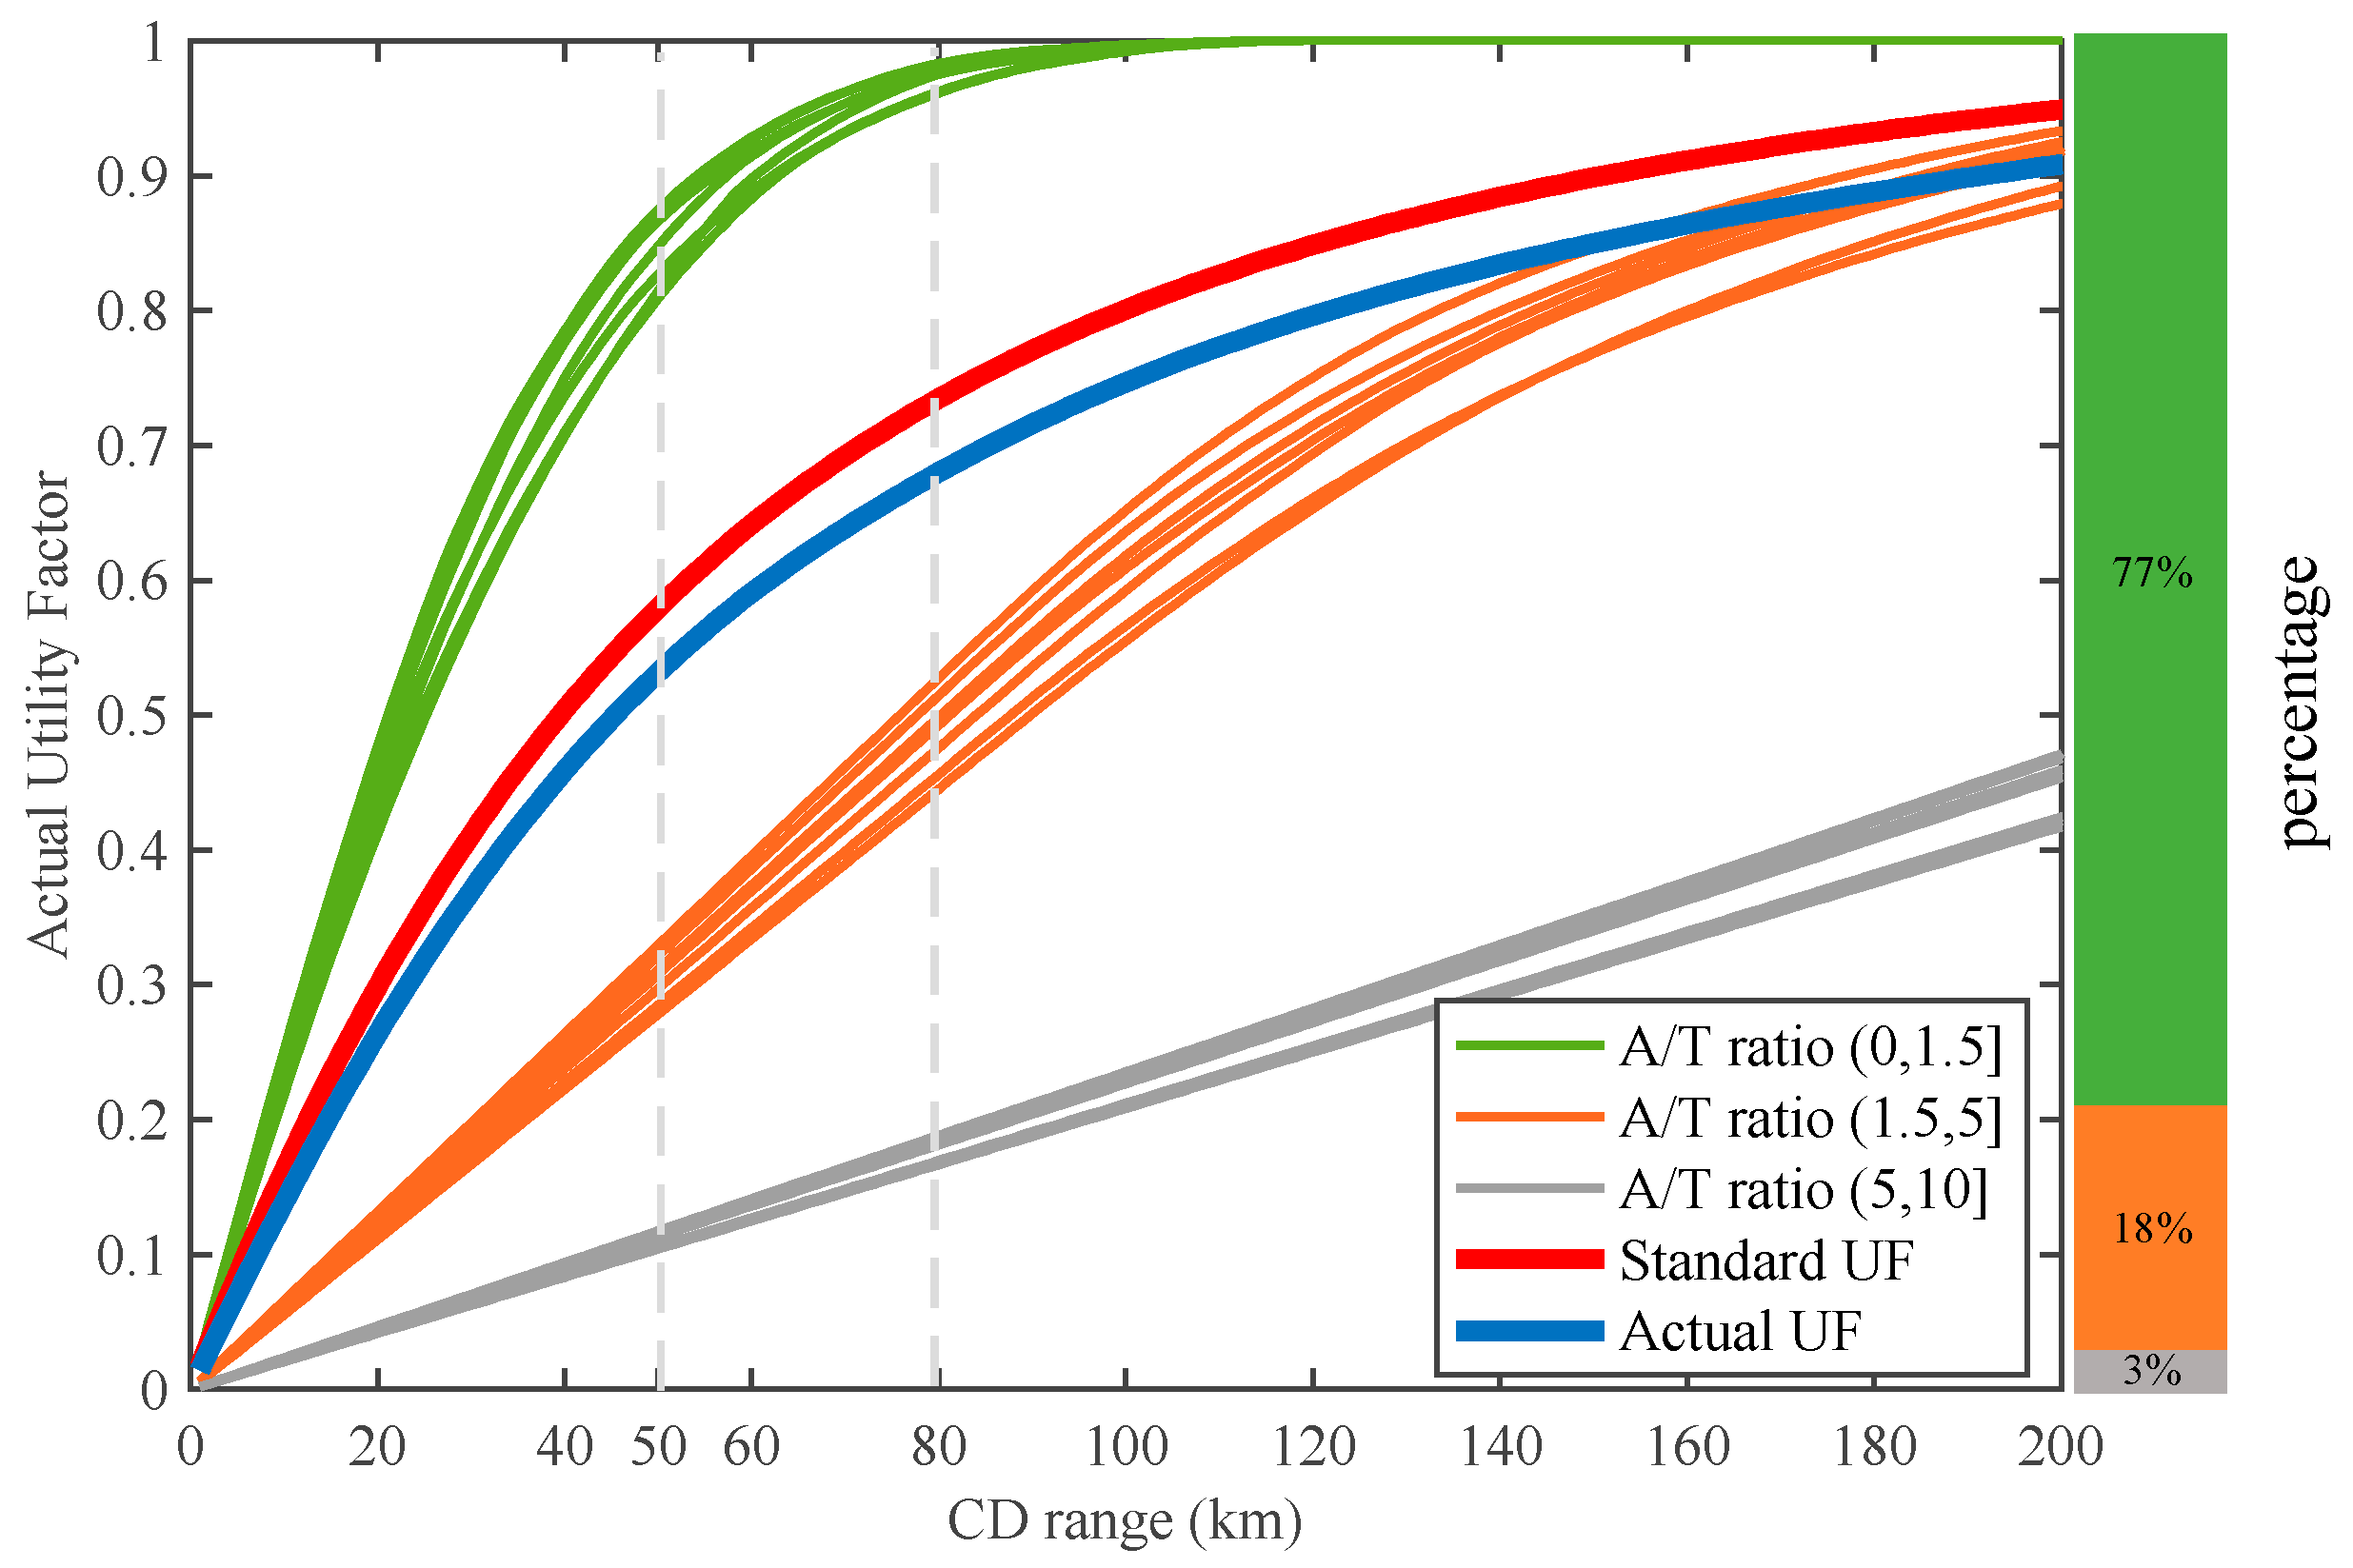
Actual UF for frequently charging adopters can reach 0.8 for the 50 km all-electric-range PHEV while it is only 0.1 for rarely charging adopters. As shown in
Figure 6, bars illustrate the ratio of frequently charging adopters, occasionally charging adopters and rarely charging adopters at 77%, 18% and 3%, respectively. The UF curves in the seven cities at different charging frequencies are depicted with different colors. For frequent charging adopters, actual UF could reach over 0.8 for PHEV50 (with a range of 0.81 to 0.87) and over 0.96 for PHEV80 (with a range of 0.96 to 0.98), indicating a very significant energy saving and on-road carbon emission reduction potential of PHEV. For occasionally charging adopters, actual UF could reach a range of 0.28 to 0.33 for PHEV50 and a range of 0.45 to 0.53 for PHEV80, indicating that extending the CD range could significantly improve UF for these consumers. For rarely charging adopters, actual UF is as low as a range of 0.10 to 0.12 for PHEV50 and a range of 0.17 to 0.19 for PHEV80 and improving CD range have limited effects in such situation. Therefore, increasing CD range is effective for frequent and occasional charging adopters.


